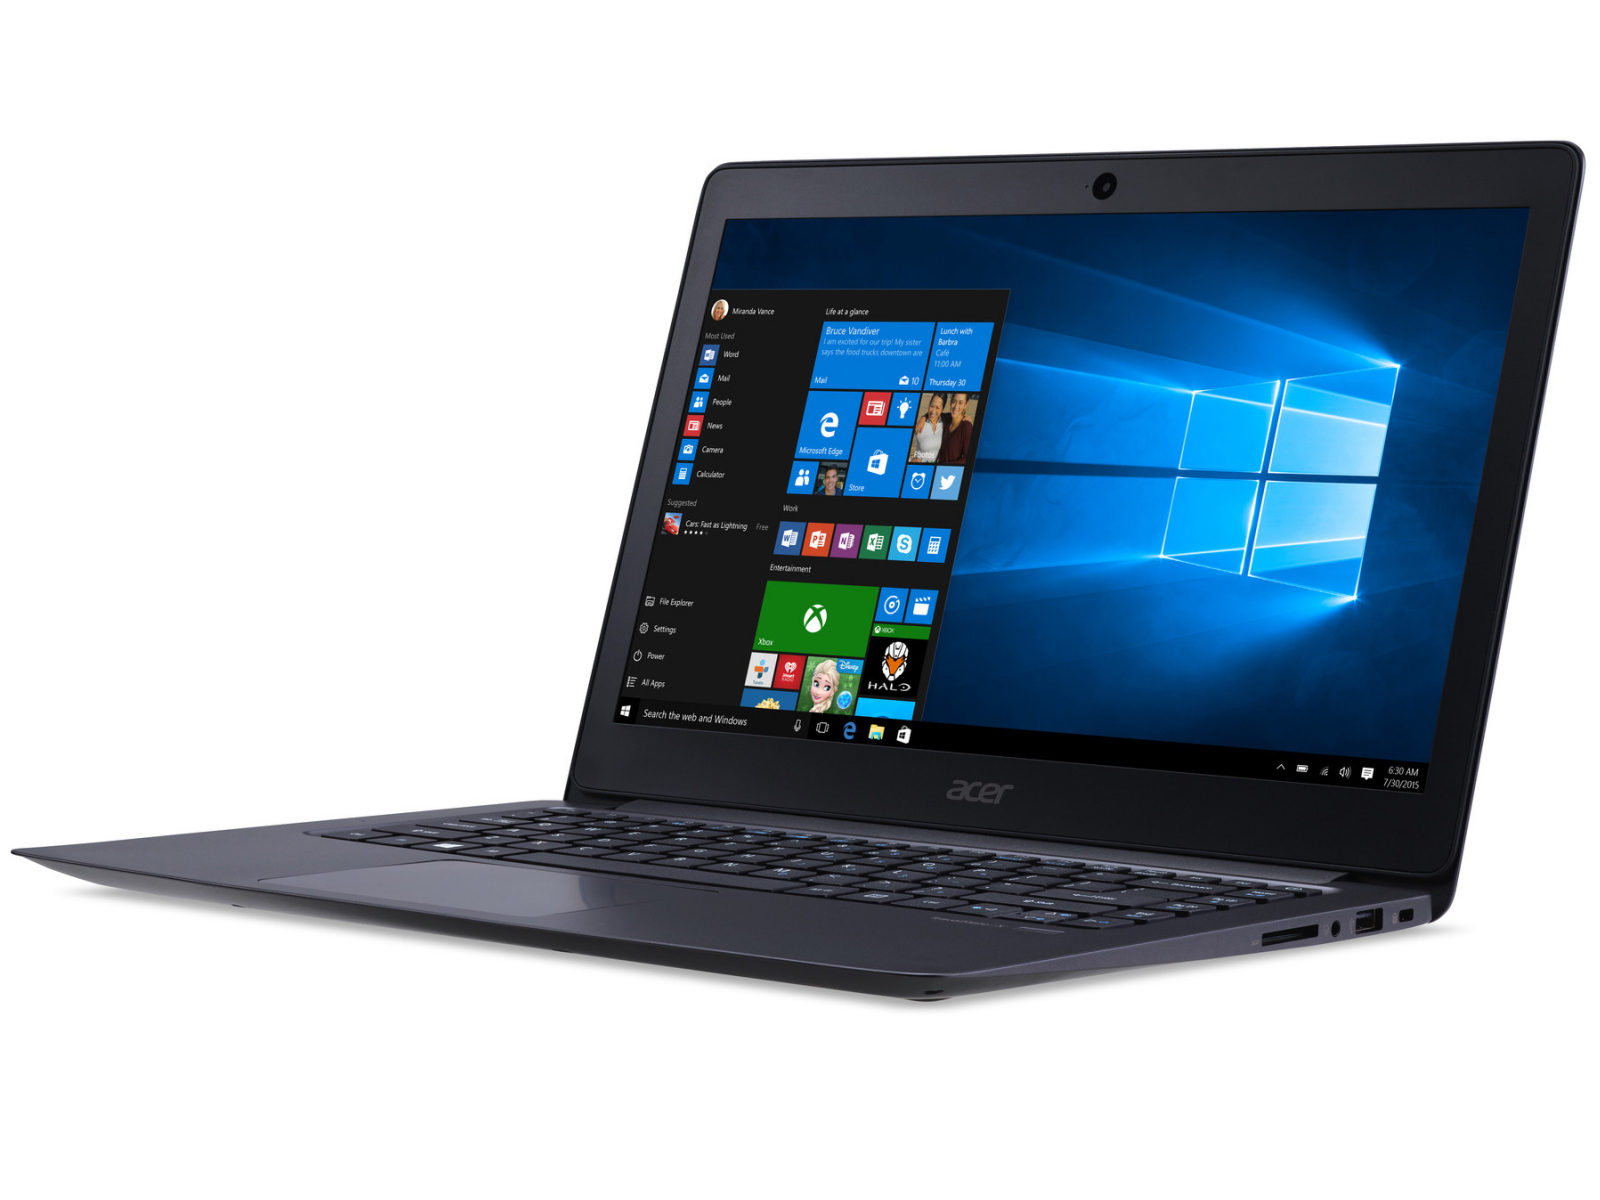
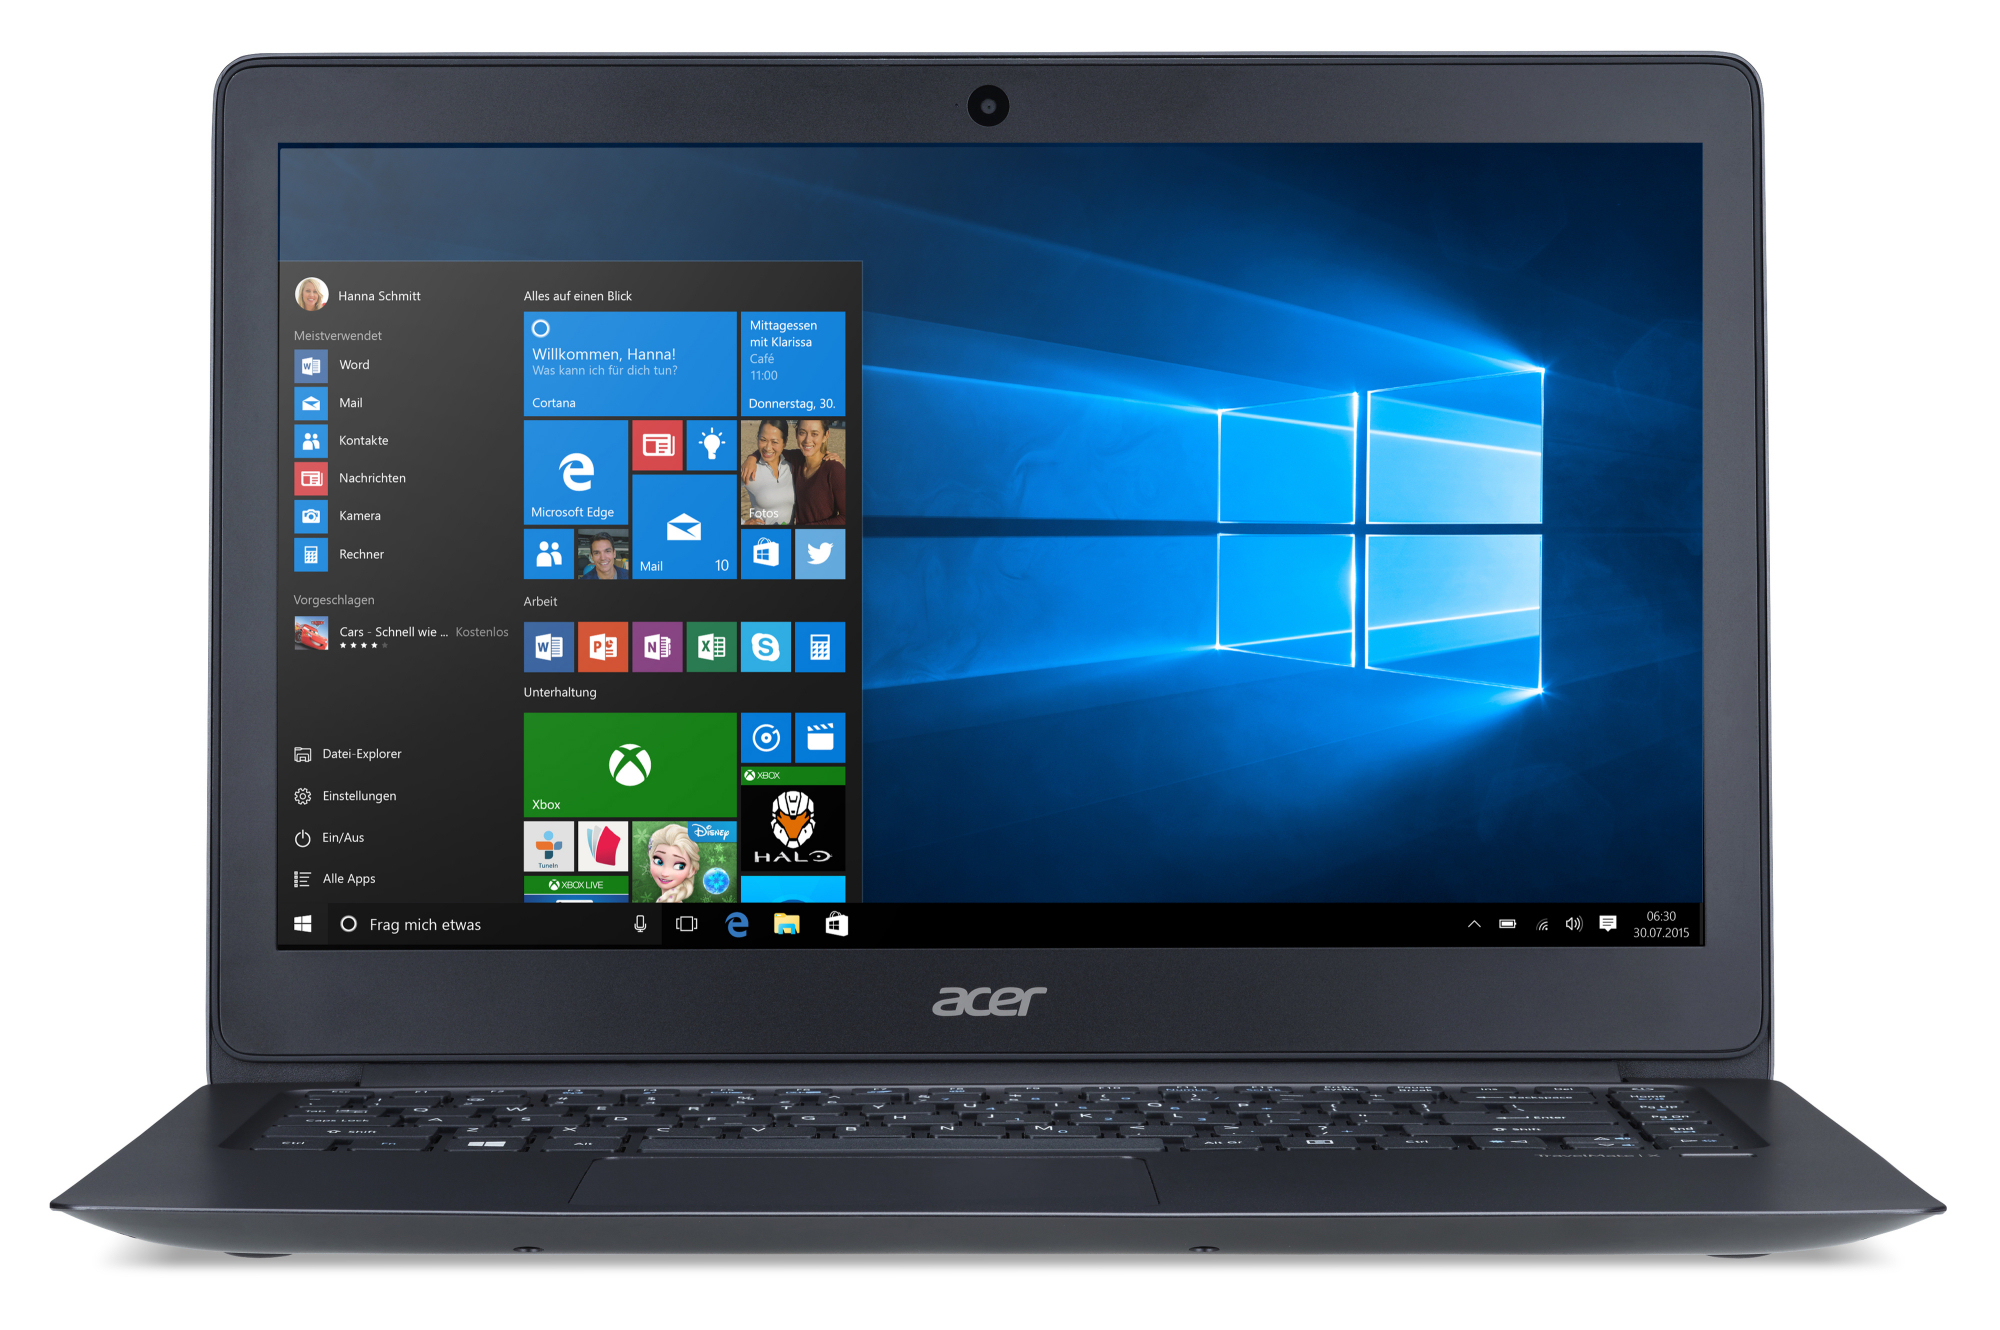
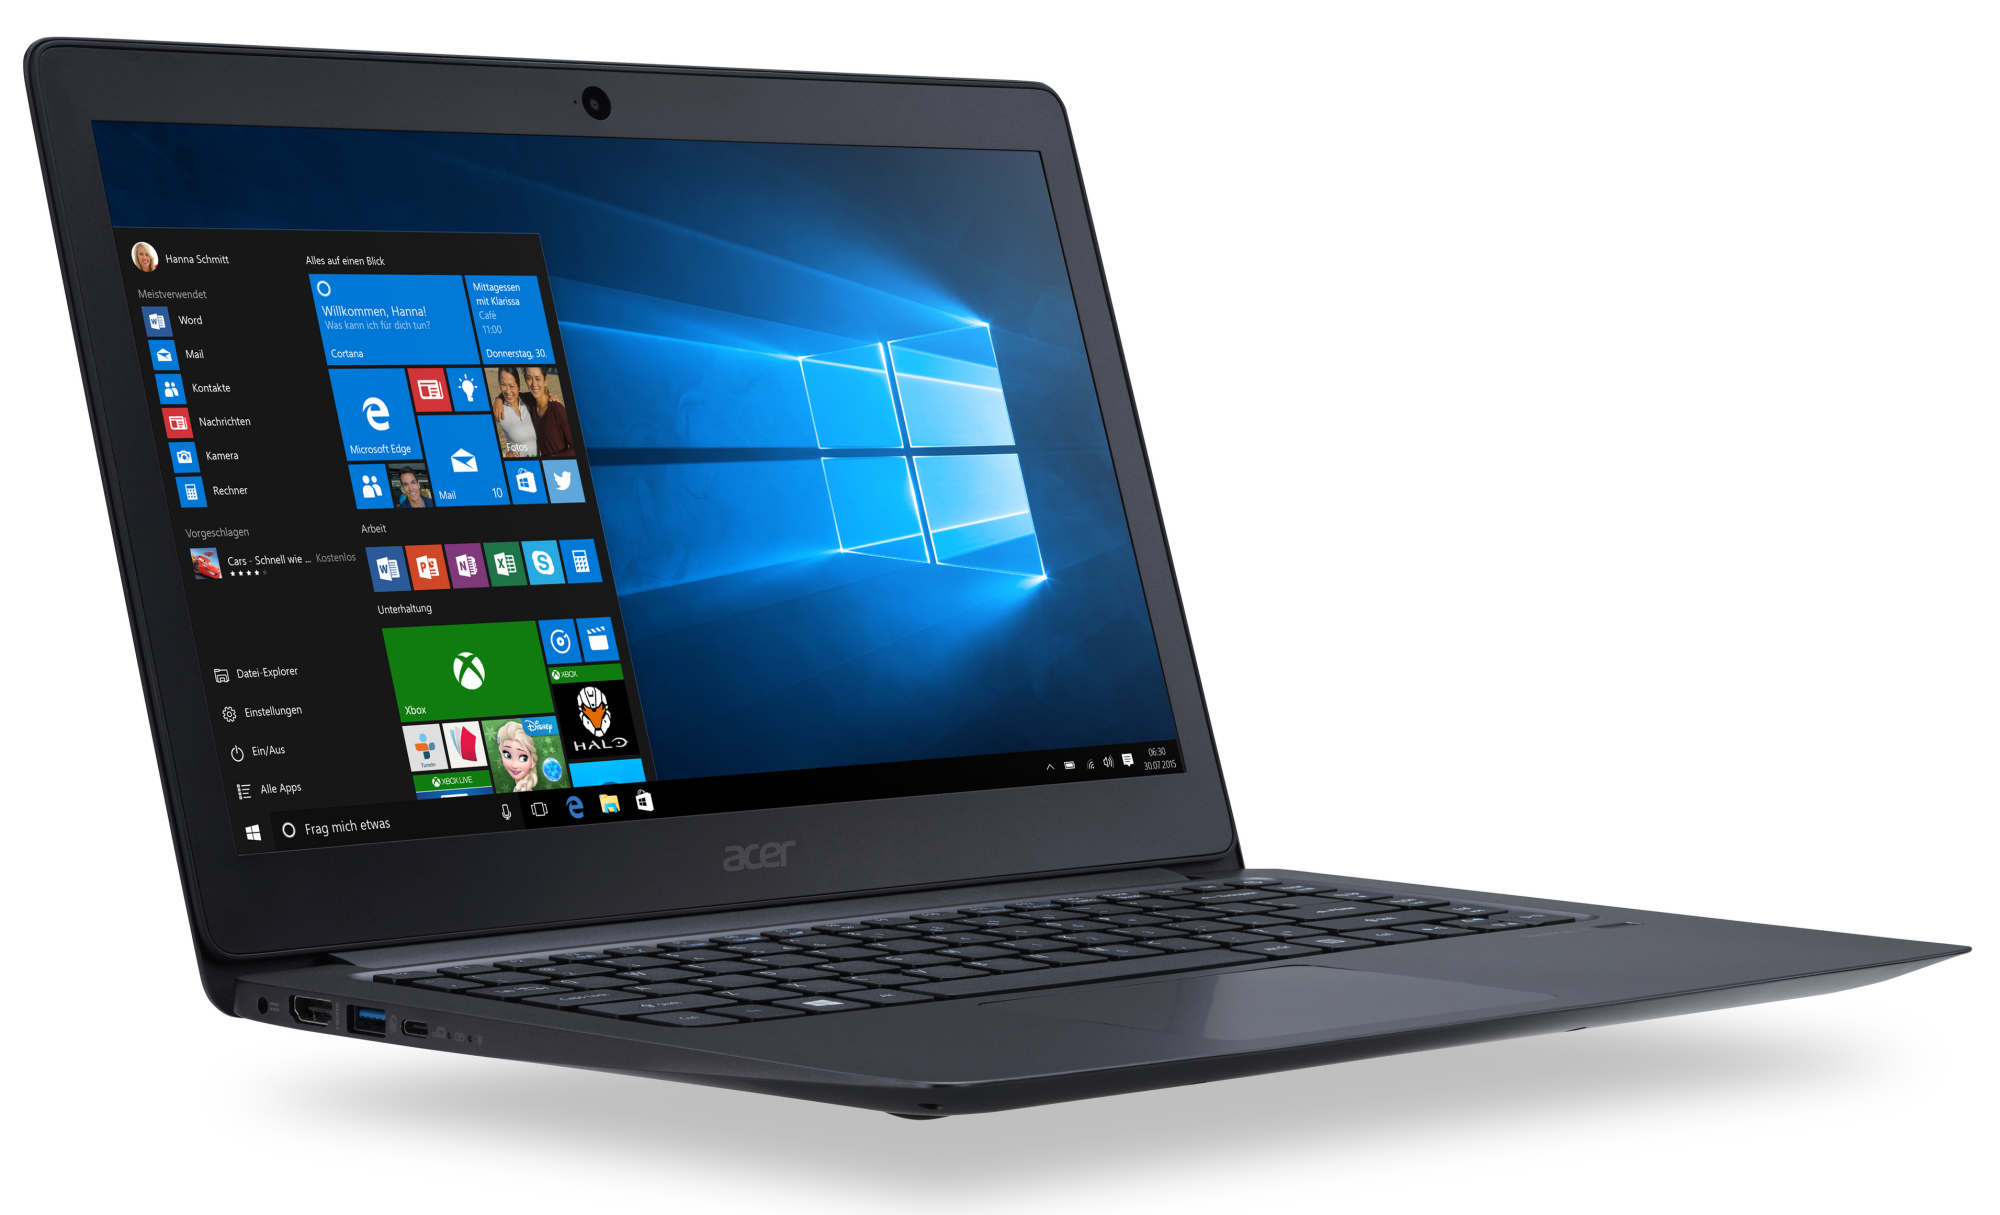
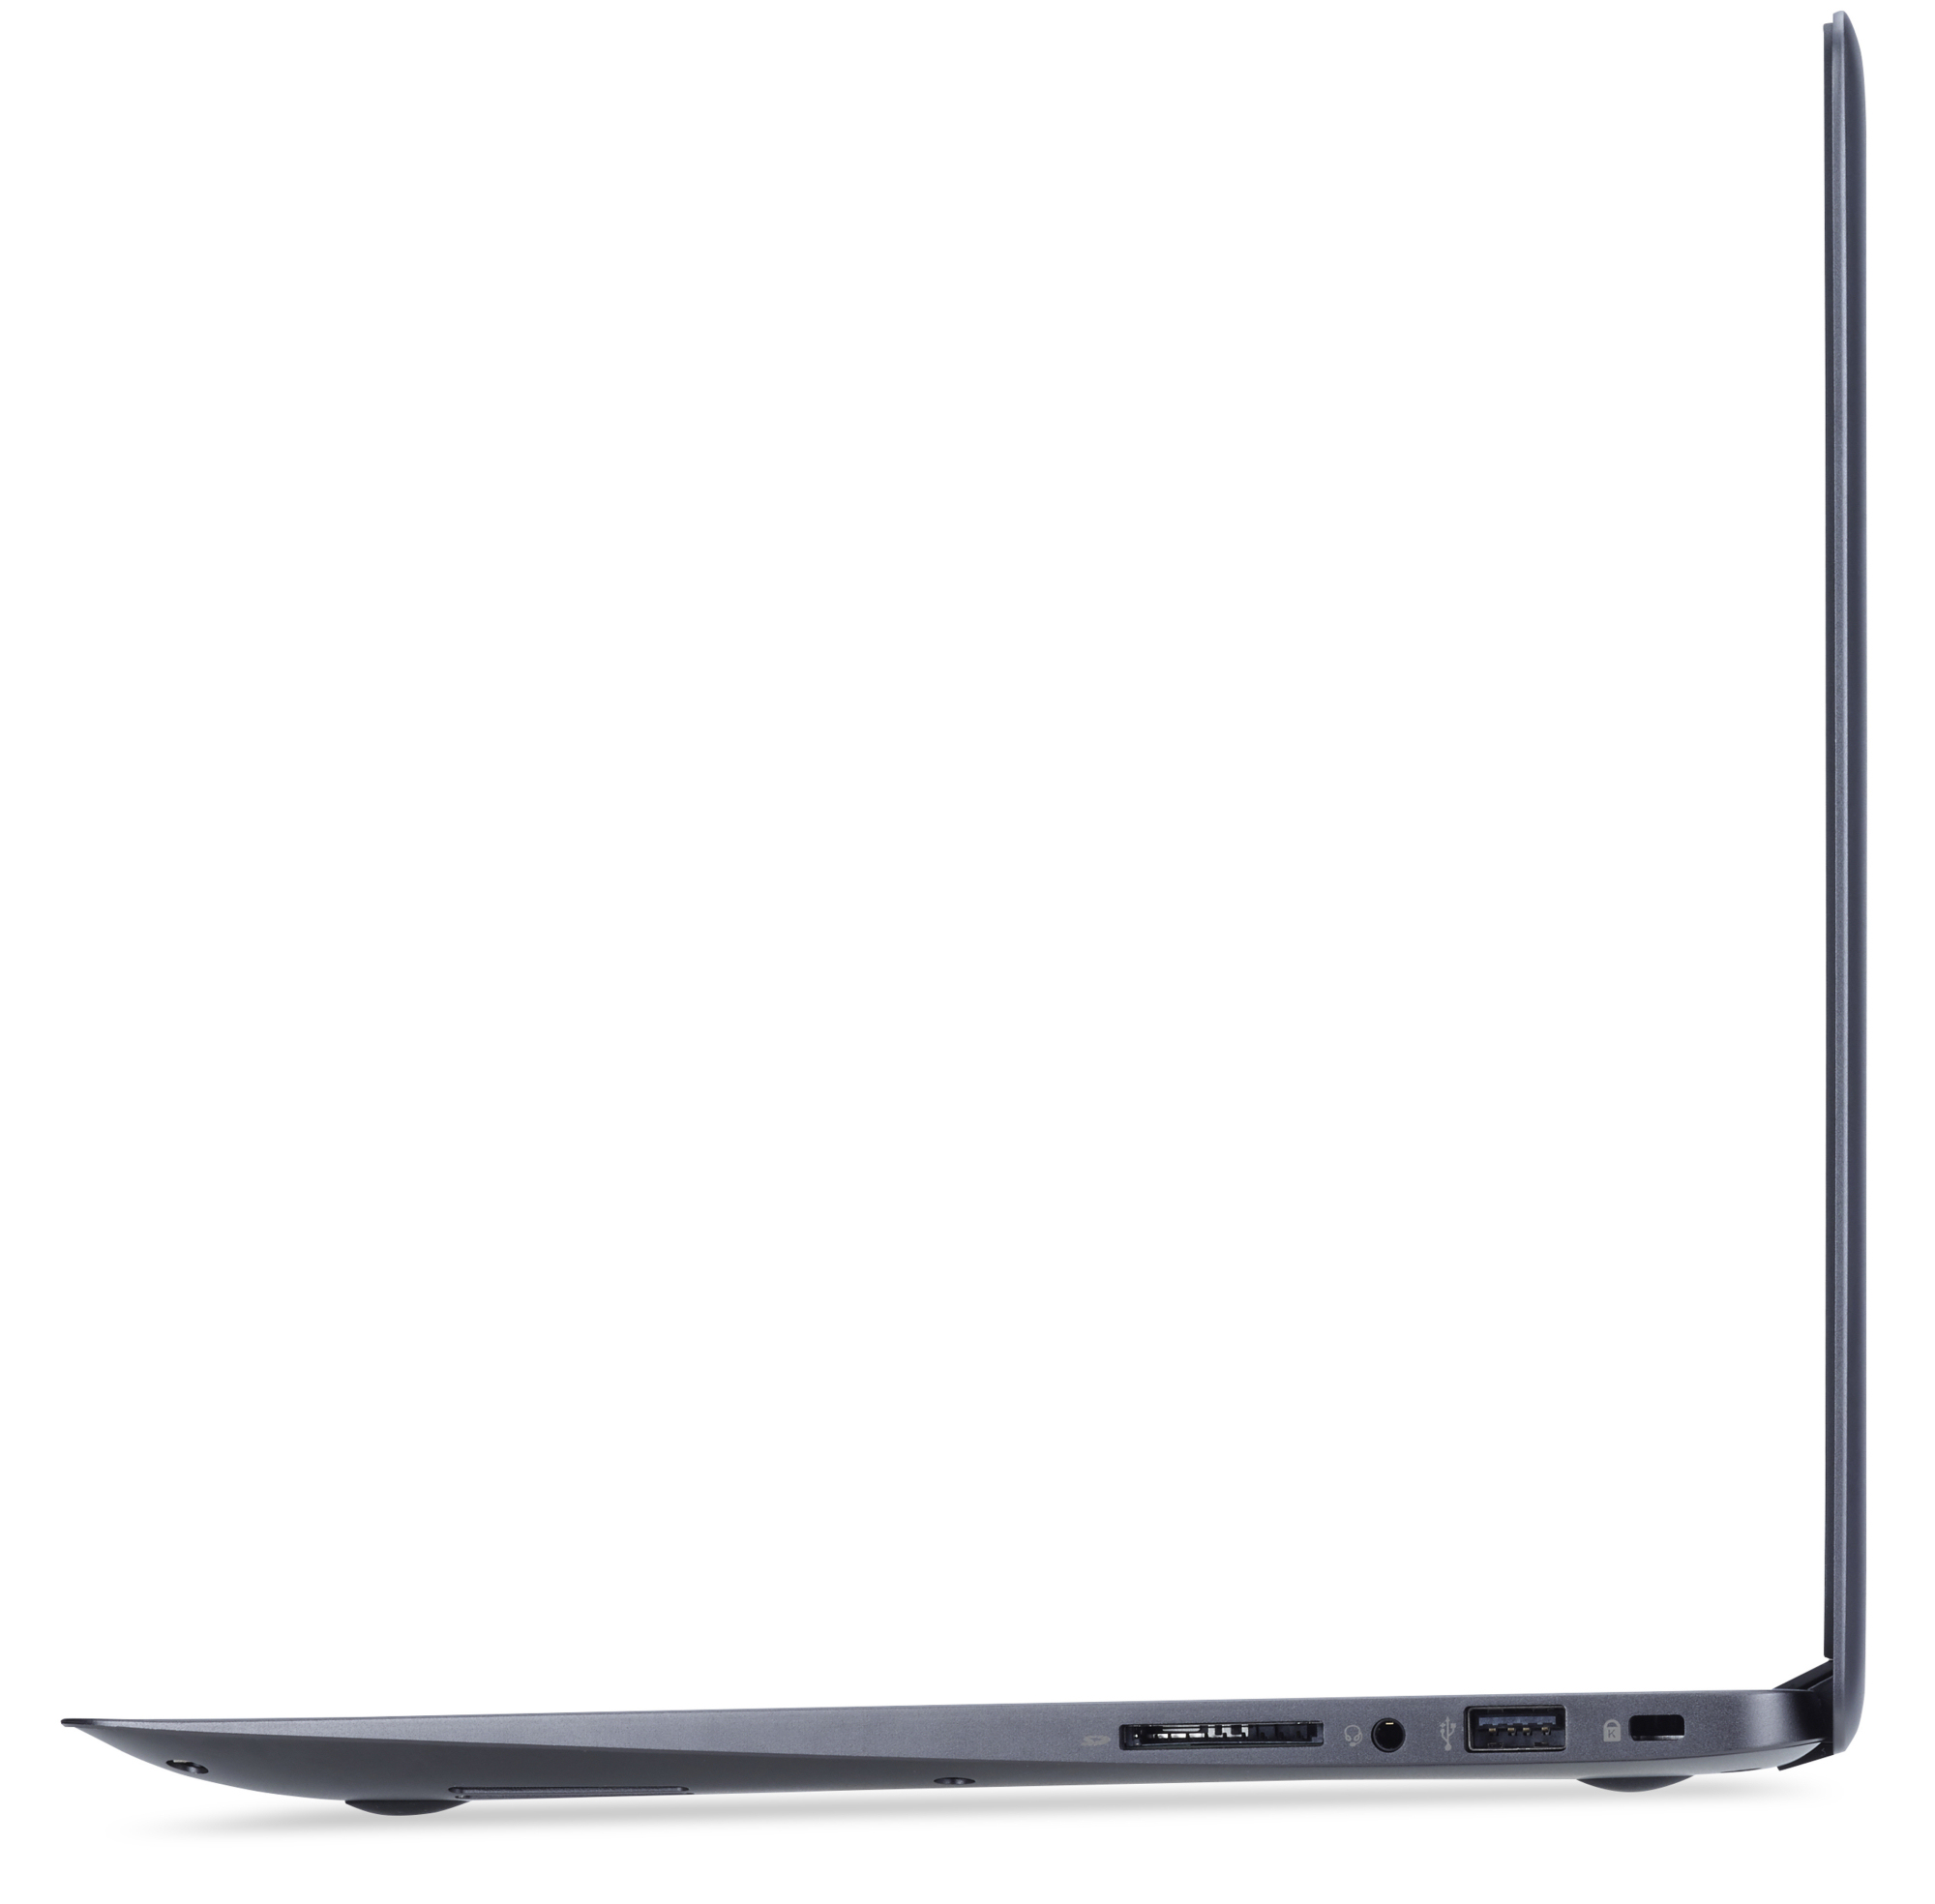
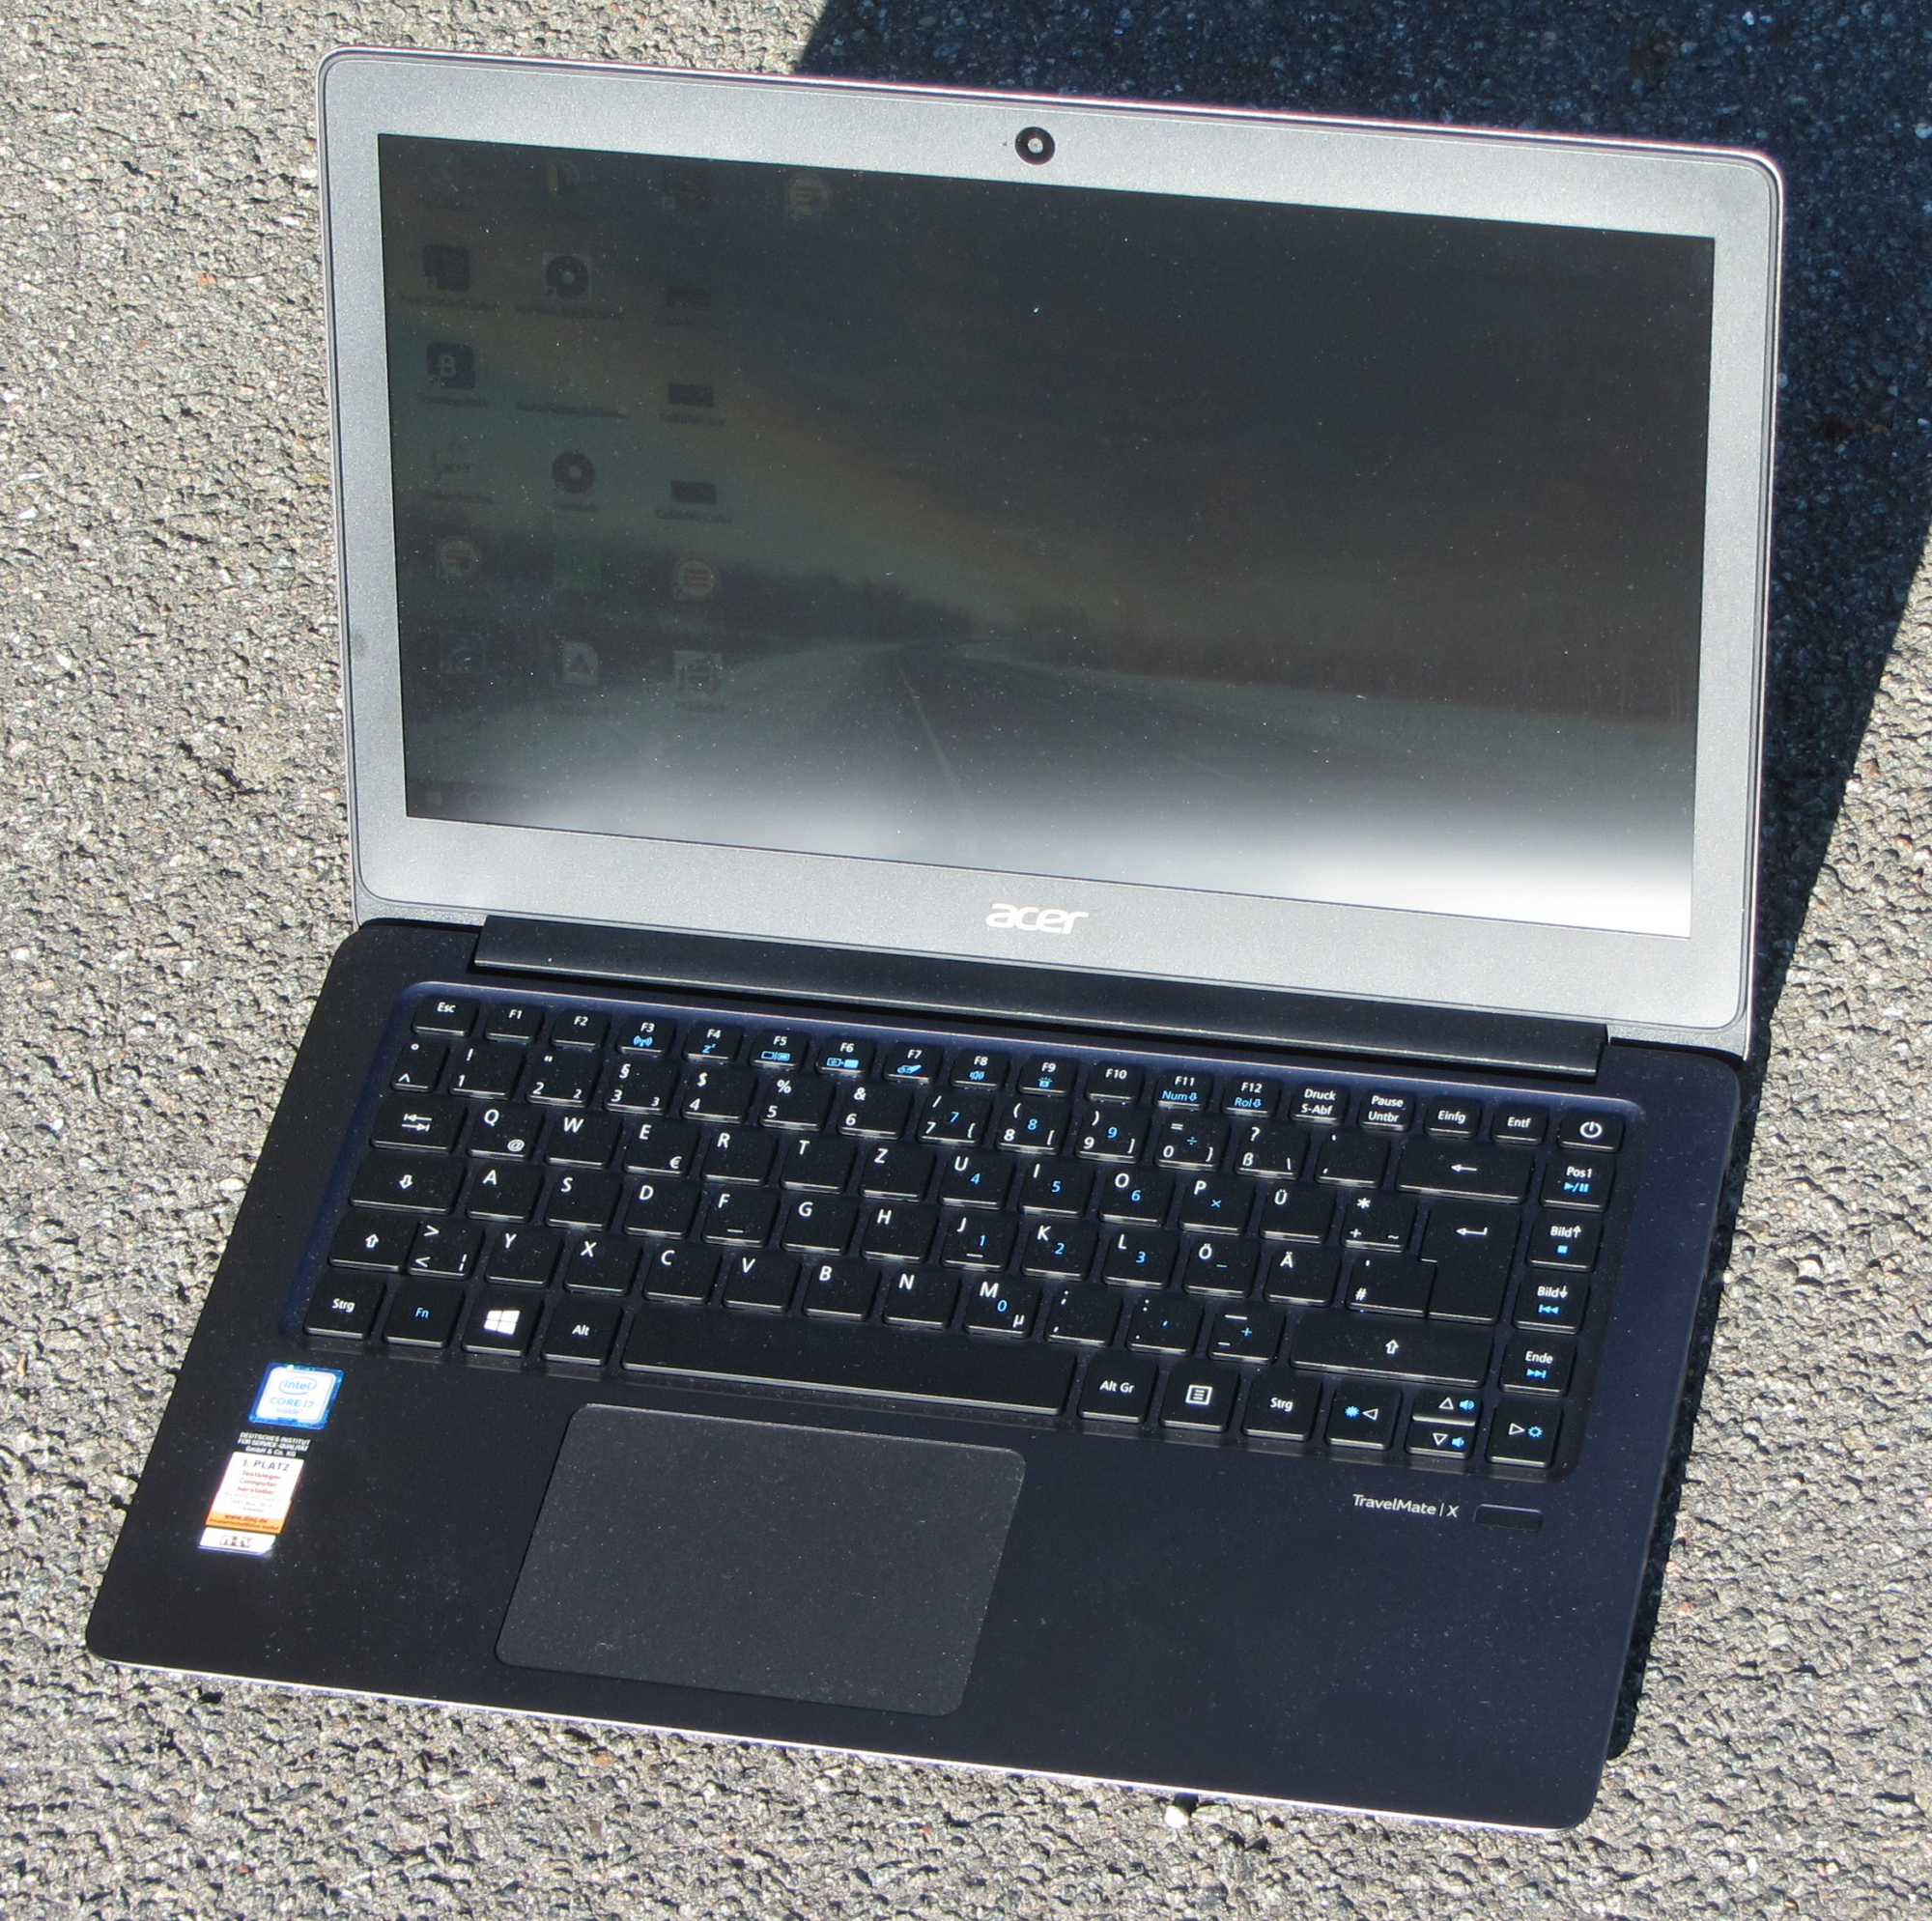
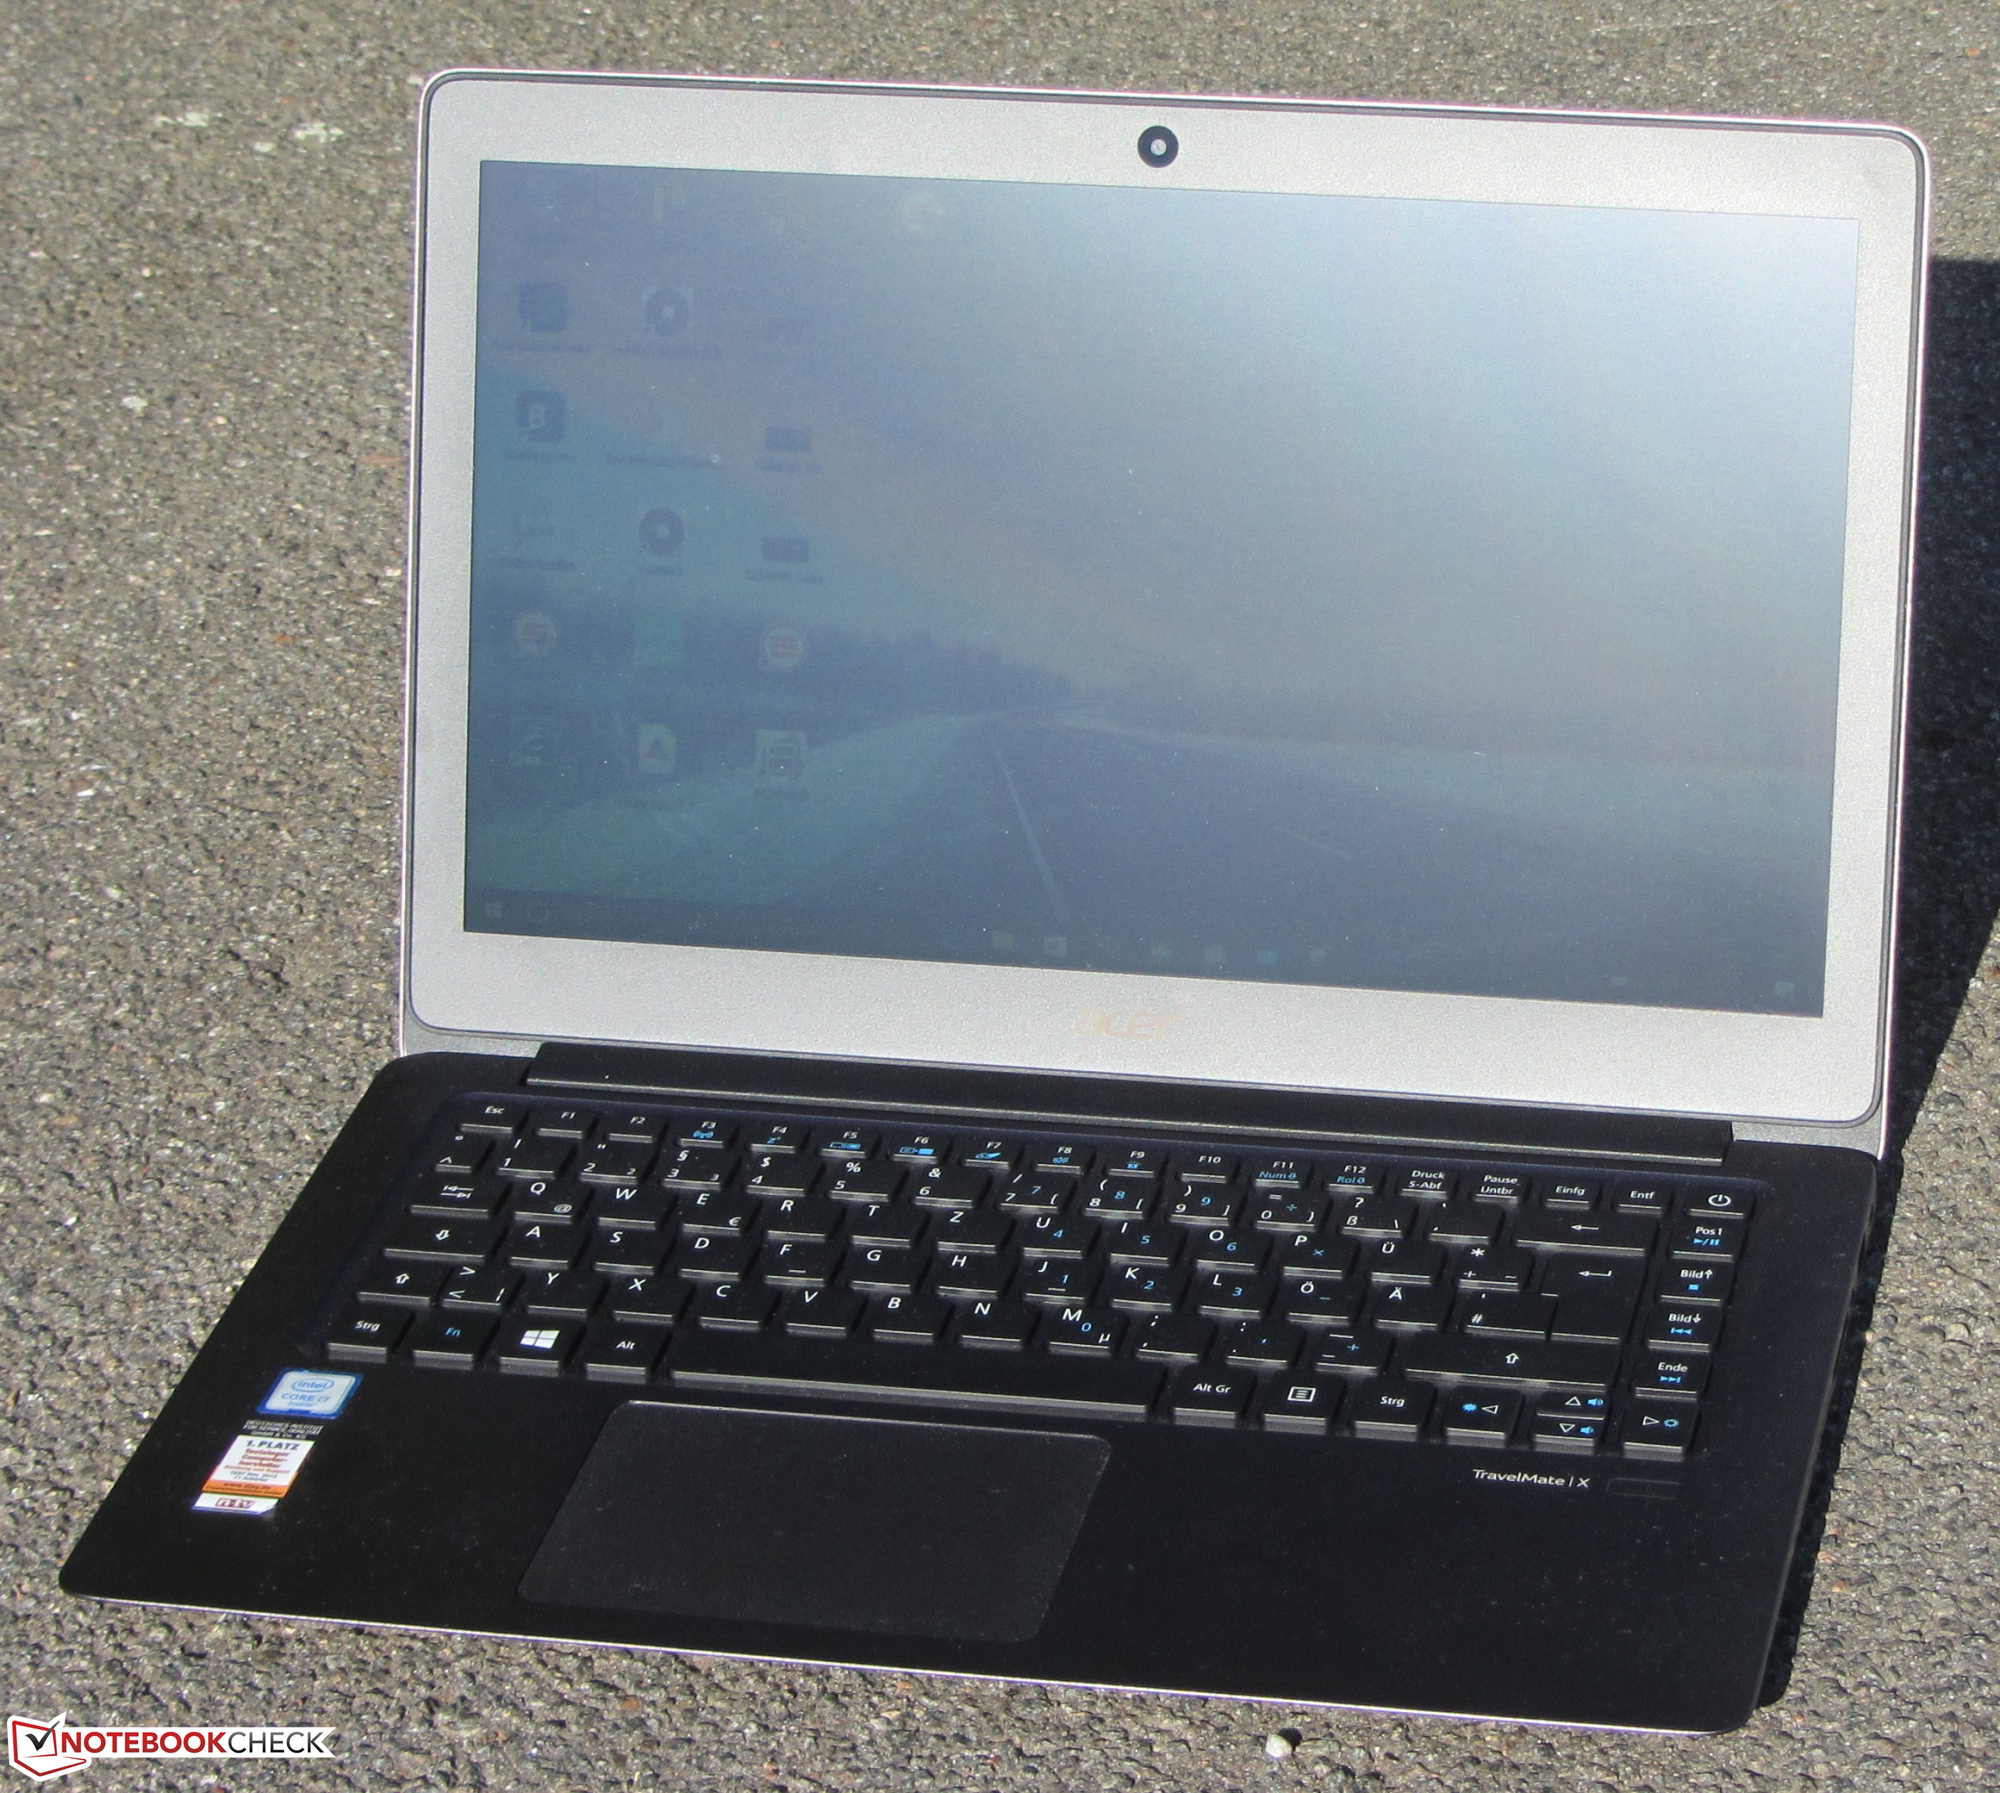
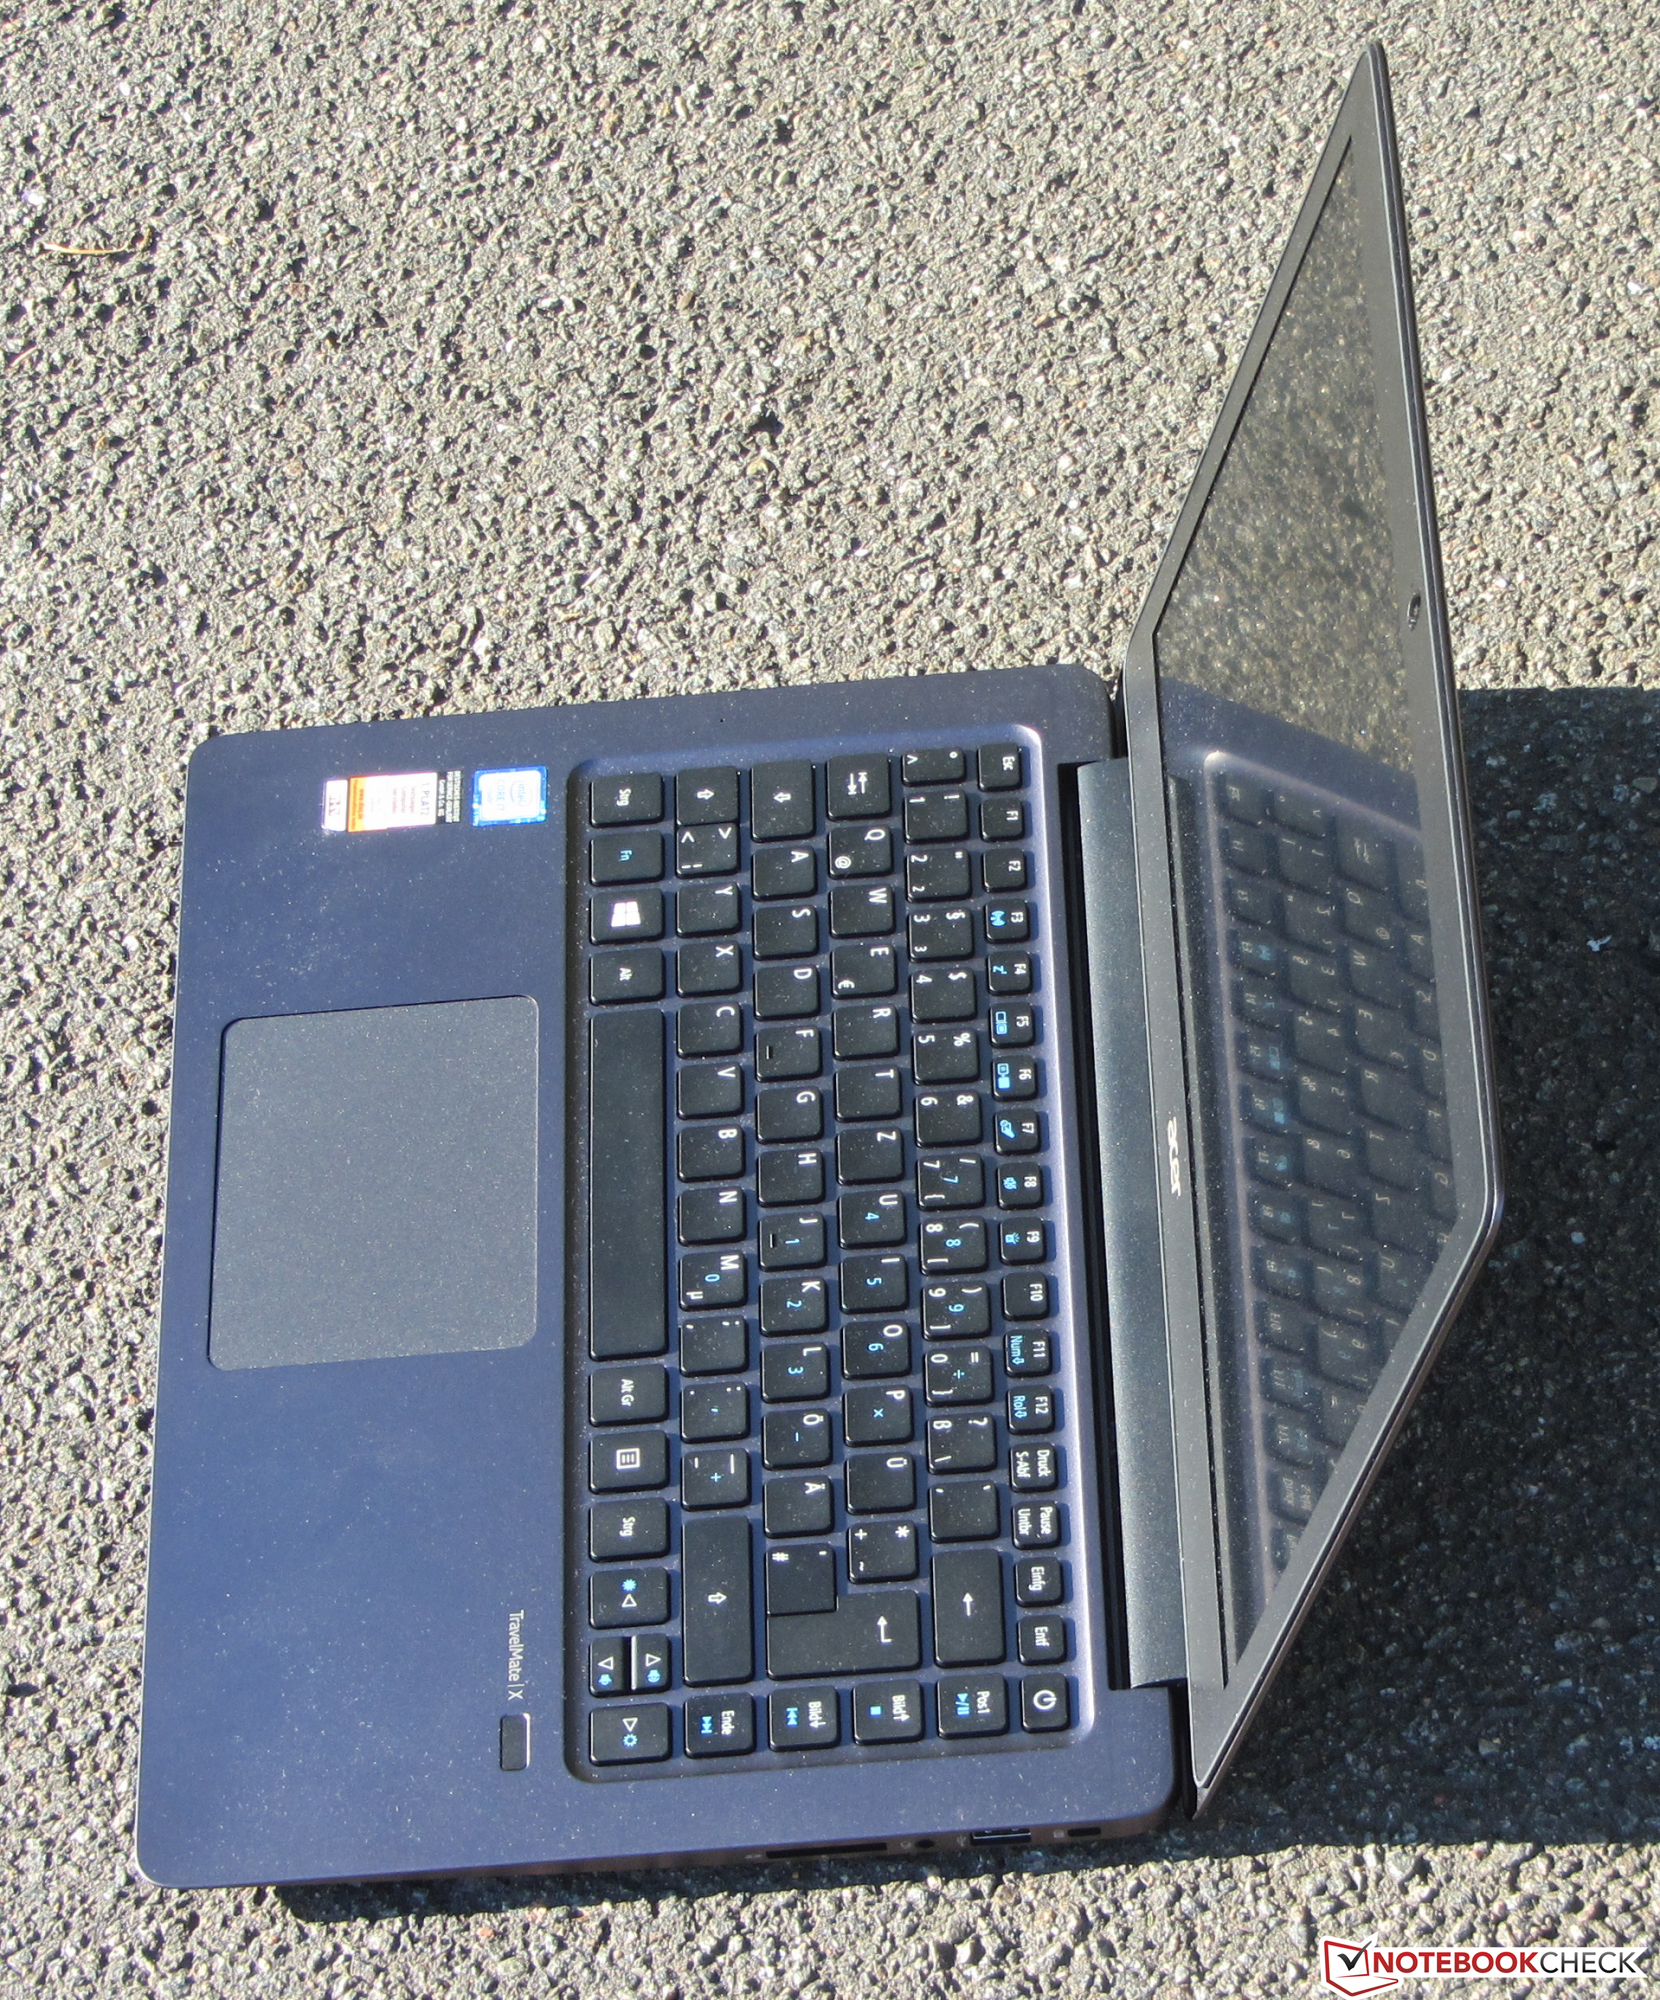
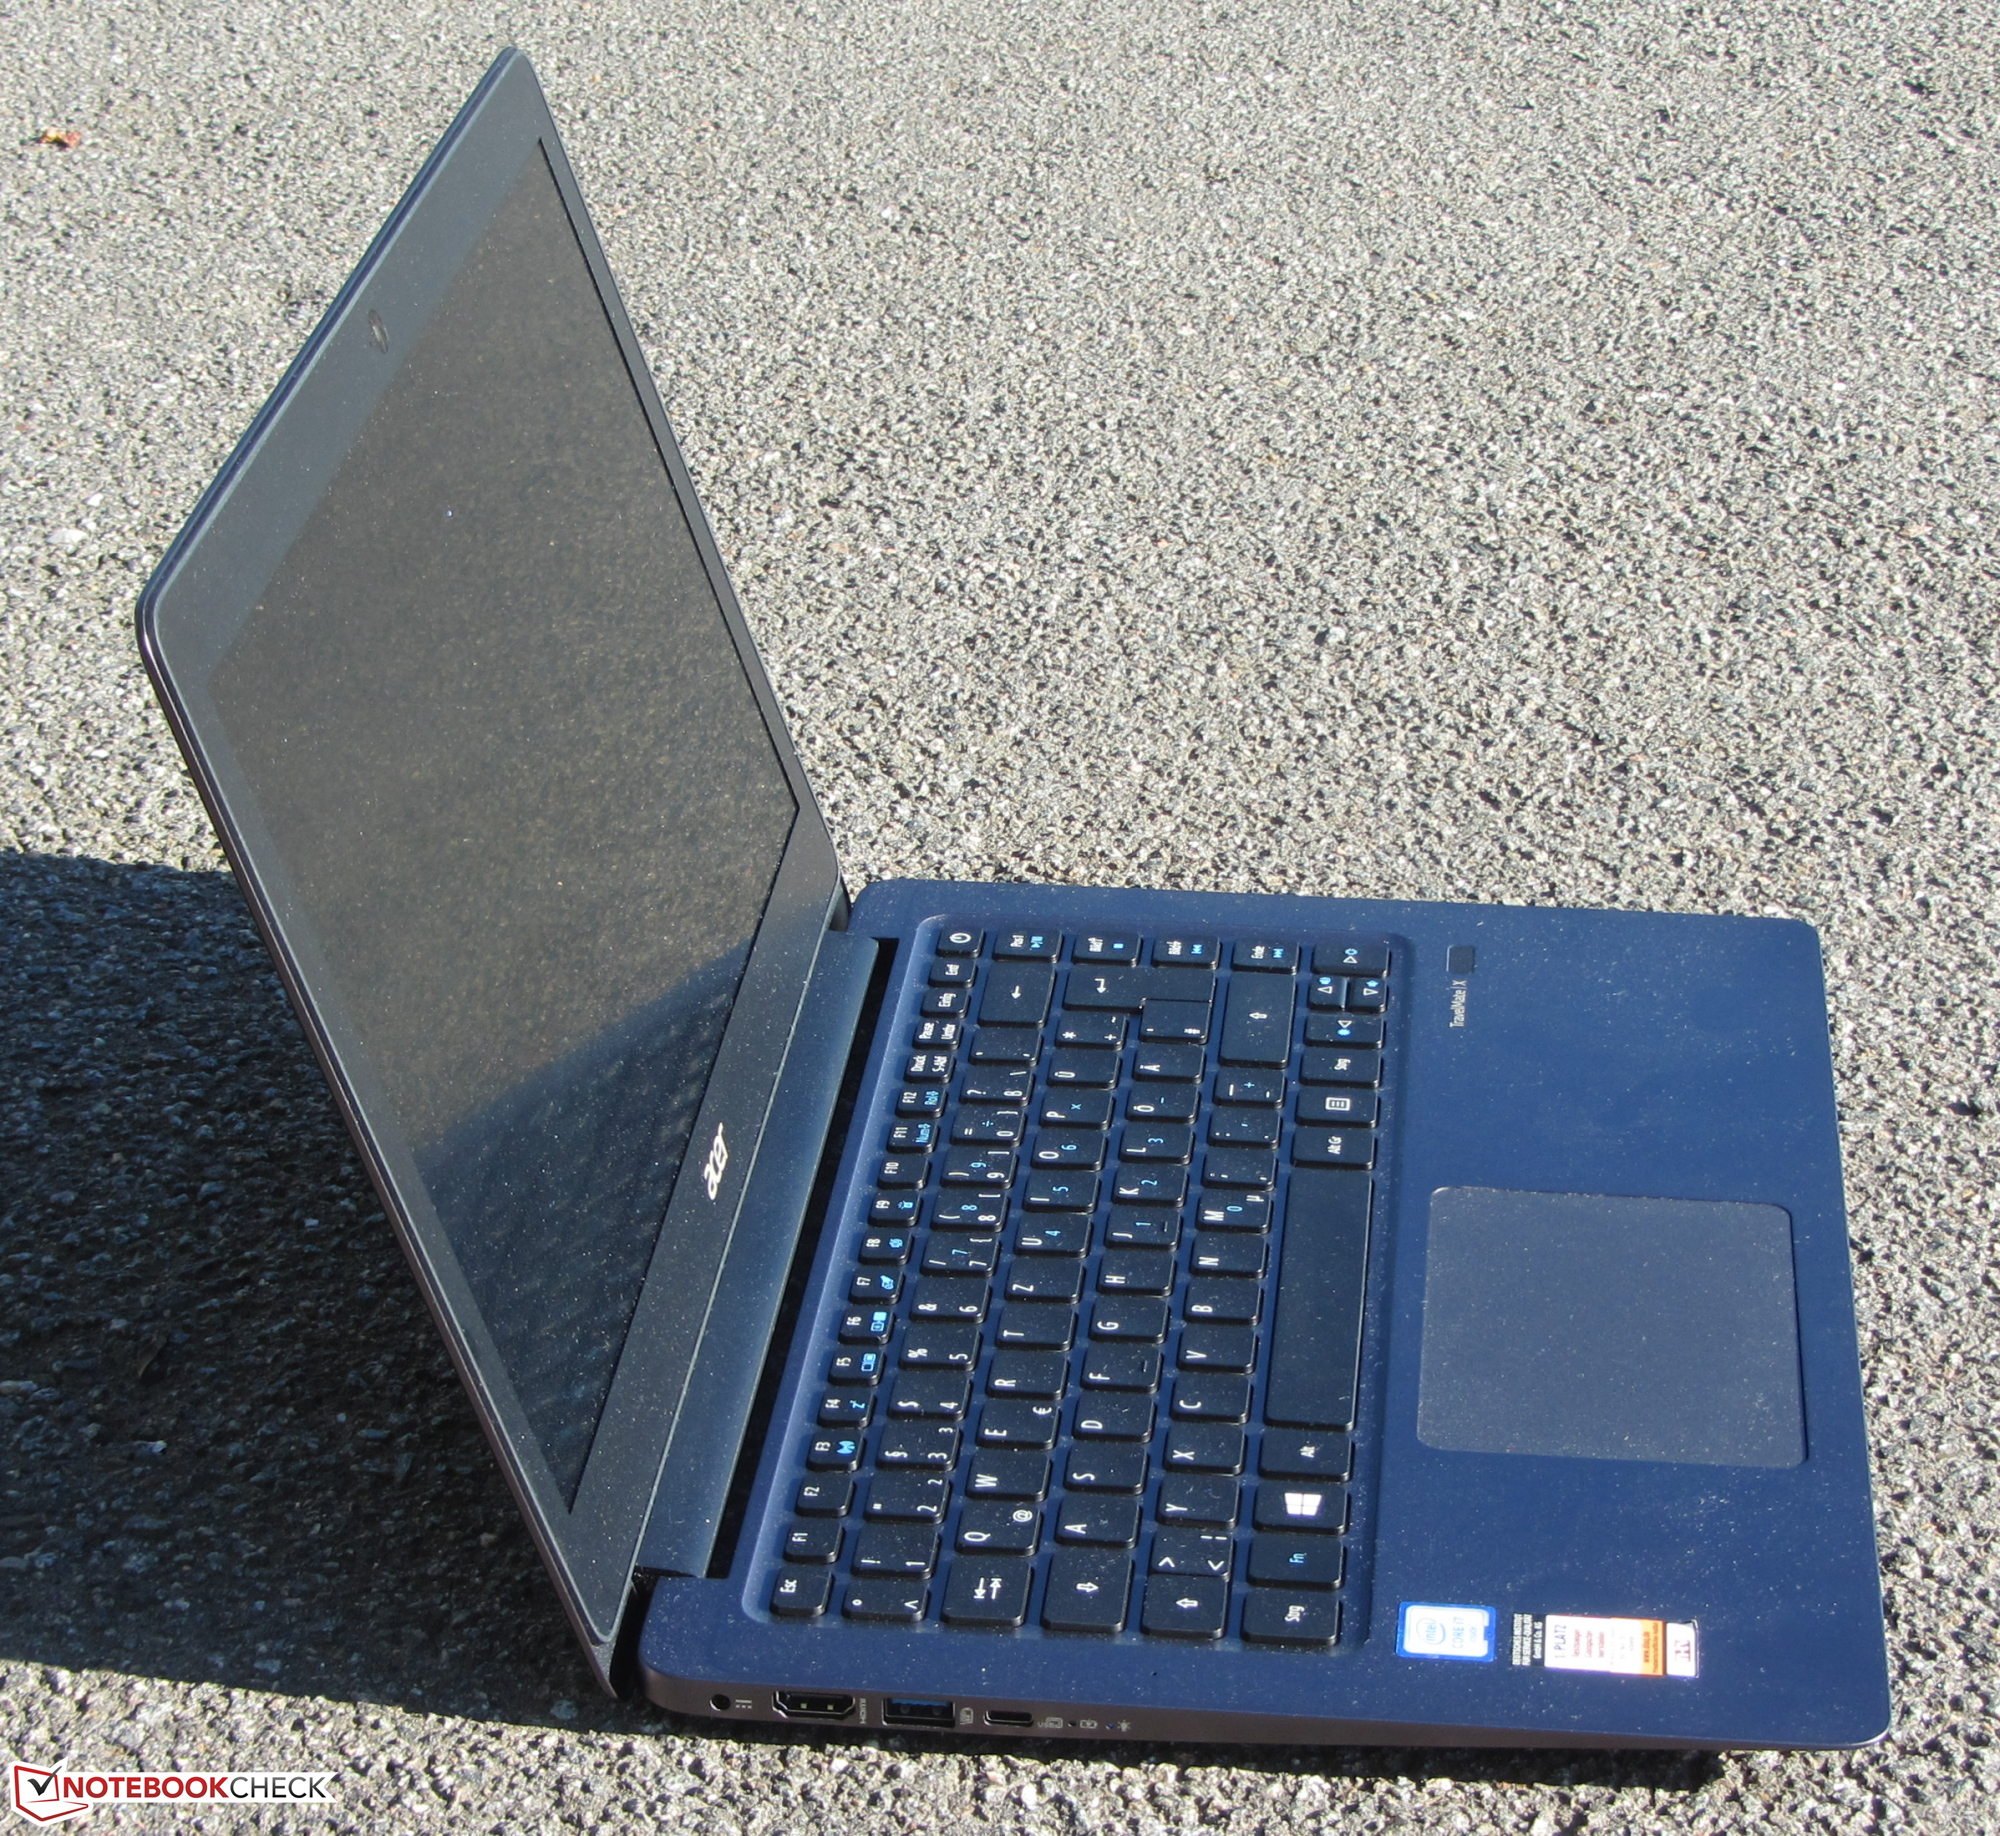
Breve Análise do Portátil Acer TravelMate X3 X349-M-7261

| SD Card Reader | |
| average JPG Copy Test (av. of 3 runs) | |
| Asus Zenbook UX303UB-R4100T | |
| Asus Zenbook UX305UA-FC040T | |
| Lenovo ThinkPad 13-20GKS01100 | |
| Acer TravelMate P238-M-5575 | |
| Acer TravelMate X3 X349-M-7261 | |
| maximum AS SSD Seq Read Test (1GB) | |
| Asus Zenbook UX303UB-R4100T | |
| Asus Zenbook UX305UA-FC040T | |
| Lenovo ThinkPad 13-20GKS01100 | |
| Acer TravelMate P238-M-5575 | |
| Acer TravelMate X3 X349-M-7261 | |
| Networking | |
| iperf Server (receive) TCP 1 m | |
| Acer TravelMate X3 X349-M-7261 (jseb) | |
| iperf Client (transmit) TCP 1 m | |
| Acer TravelMate X3 X349-M-7261 (jseb) | |
| |||||||||||||||||||||||||
iluminação: 86 %
iluminação com acumulador: 230 cd/m²
Contraste: 1150:1 (Preto: 0.2 cd/m²)
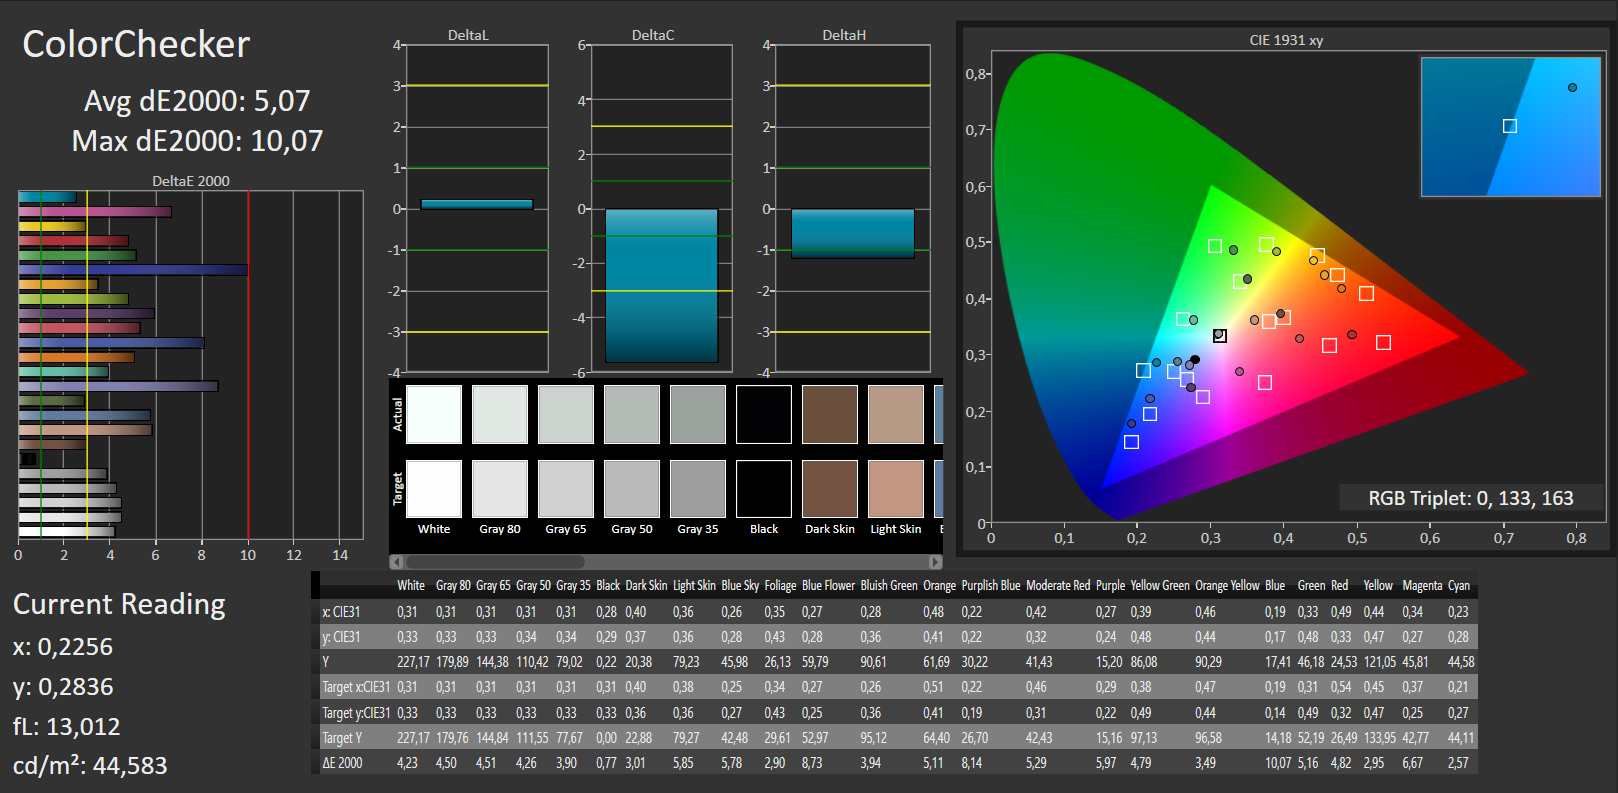
ΔE ColorChecker Calman: 5.07 | ∀{0.5-29.43 Ø4.71}
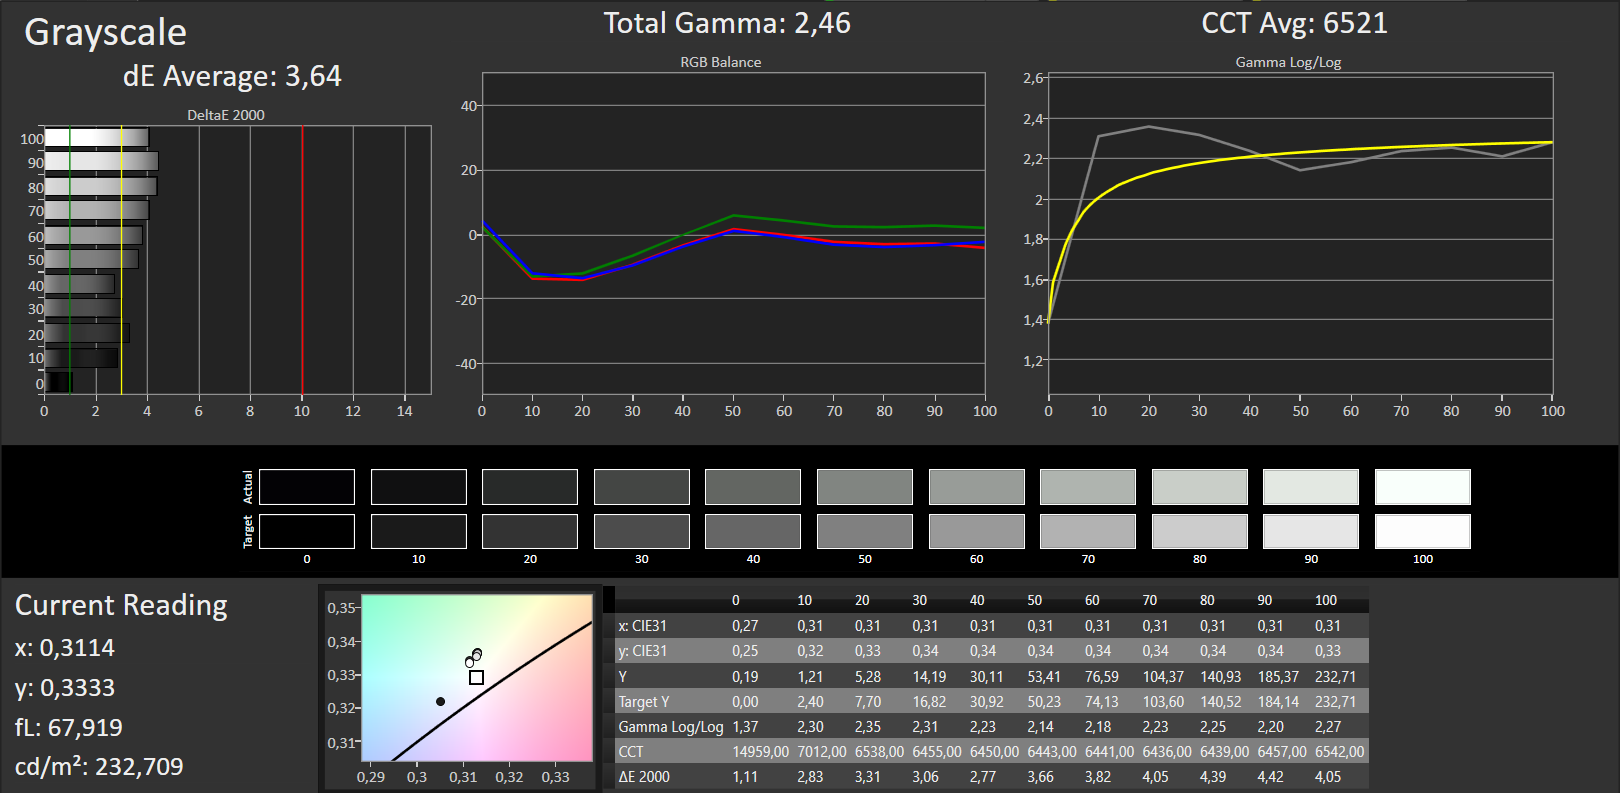
ΔE Greyscale Calman: 3.64 | ∀{0.09-98 Ø4.96}
55% sRGB (Argyll 1.6.3 3D)
35% AdobeRGB 1998 (Argyll 1.6.3 3D)
38.2% AdobeRGB 1998 (Argyll 3D)
55.6% sRGB (Argyll 3D)
36.97% Display P3 (Argyll 3D)
Gamma: 2.46
CCT: 6521 K
| Acer TravelMate X3 X349-M-7261 IPS, 1920x1080, 14" | Apple MacBook Air 13 inch 2015-03 TN LED, 1440x900, 13.3" | Lenovo ThinkPad 13-20GKS01100 1920x1080, 13.3" | Acer TravelMate P238-M-5575 TN LED, 1366x768, 13.3" | Asus Zenbook UX305UA-FC040T IPS, 1920x1080, 13.3" | Asus Zenbook UX303UB-R4100T IPS, 1920x1080, 13.3" | |
|---|---|---|---|---|---|---|
| Display | 8% | 4% | 1% | 72% | 75% | |
| Display P3 Coverage (%) | 36.97 | 40.1 8% | 38.35 4% | 37.25 1% | 65.1 76% | 66.9 81% |
| sRGB Coverage (%) | 55.6 | 59.8 8% | 57.4 3% | 56.1 1% | 92.8 67% | 92.3 66% |
| AdobeRGB 1998 Coverage (%) | 38.2 | 41.51 9% | 39.66 4% | 38.49 1% | 66.3 74% | 67.6 77% |
| Response Times | 1% | 0% | 20% | -44% | ||
| Response Time Grey 50% / Grey 80% * (ms) | 42 ? | 43.2 ? -3% | 42 ? -0% | 25 ? 40% | 68 ? -62% | |
| Response Time Black / White * (ms) | 28 ? | 26.8 ? 4% | 28 ? -0% | 28 ? -0% | 35 ? -25% | |
| PWM Frequency (Hz) | 50 ? | 178 ? | ||||
| Screen | 1% | -7% | -78% | -4% | 20% | |
| Brightness middle (cd/m²) | 230 | 329 43% | 233 1% | 226 -2% | 358 56% | 385 67% |
| Brightness (cd/m²) | 226 | 310 37% | 227 0% | 216 -4% | 351 55% | 394 74% |
| Brightness Distribution (%) | 86 | 82 -5% | 86 0% | 91 6% | 86 0% | 89 3% |
| Black Level * (cd/m²) | 0.2 | 0.405 -103% | 0.22 -10% | 0.49 -145% | 0.4 -100% | 0.41 -105% |
| Contrast (:1) | 1150 | 812 -29% | 1059 -8% | 461 -60% | 895 -22% | 939 -18% |
| Colorchecker dE 2000 * | 5.07 | 3.96 22% | 5.41 -7% | 13.15 -159% | 5.96 -18% | 3.84 24% |
| Colorchecker dE 2000 max. * | 10.07 | 7.51 25% | 13.61 -35% | 21.96 -118% | 10.99 -9% | |
| Greyscale dE 2000 * | 3.64 | 3.51 4% | 4.15 -14% | 14.47 -298% | 8.93 -145% | 3.79 -4% |
| Gamma | 2.46 89% | 3.83 57% | 2.45 90% | 2.73 81% | 2.28 96% | 2.23 99% |
| CCT | 6521 100% | 6711 97% | 6773 96% | 19989 33% | 6548 99% | 6499 100% |
| Color Space (Percent of AdobeRGB 1998) (%) | 35 | 38.4 10% | 36.52 4% | 36 3% | 60 71% | 60 71% |
| Color Space (Percent of sRGB) (%) | 55 | 59.8 9% | 57.16 4% | 56 2% | 93 69% | 92 67% |
| Média Total (Programa/Configurações) | 5% /
3% | -1% /
-4% | -26% /
-51% | 29% /
14% | 17% /
23% |
* ... menor é melhor
Cintilação da tela / PWM (modulação por largura de pulso)
| Tela tremeluzindo / PWM não detectado | ||
[pwm_comparison] Em comparação: 52 % de todos os dispositivos testados não usam PWM para escurecer a tela. Se PWM foi detectado, uma média de 7754 (mínimo: 5 - máximo: 343500) Hz foi medida. | ||
Exibir tempos de resposta
| ↔ Tempo de resposta preto para branco | ||
|---|---|---|
| 28 ms ... ascensão ↗ e queda ↘ combinadas | ↗ 8 ms ascensão | 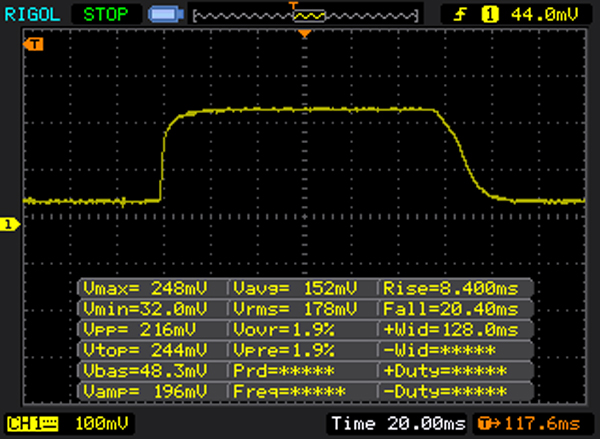 |
| ↘ 20 ms queda | ||
| A tela mostra taxas de resposta relativamente lentas em nossos testes e pode ser muito lenta para os jogadores. Em comparação, todos os dispositivos testados variam de 0.1 (mínimo) a 240 (máximo) ms. » 71 % de todos os dispositivos são melhores. Isso significa que o tempo de resposta medido é pior que a média de todos os dispositivos testados (19.8 ms). | ||
| ↔ Tempo de resposta 50% cinza a 80% cinza | ||
| 42 ms ... ascensão ↗ e queda ↘ combinadas | ↗ 15 ms ascensão | 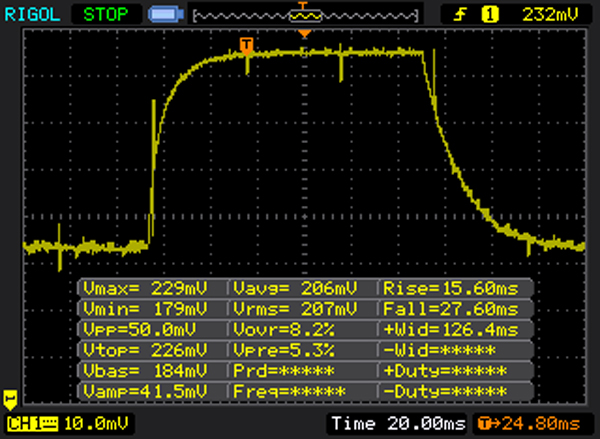 |
| ↘ 27 ms queda | ||
| A tela mostra taxas de resposta lentas em nossos testes e será insatisfatória para os jogadores. Em comparação, todos os dispositivos testados variam de 0.165 (mínimo) a 636 (máximo) ms. » 67 % de todos os dispositivos são melhores. Isso significa que o tempo de resposta medido é pior que a média de todos os dispositivos testados (31 ms). | ||
| Cinebench R15 | |
| CPU Single 64Bit | |
| Acer TravelMate X3 X349-M-7261 | |
| Asus Zenbook UX303UB-R4100T | |
| Asus Zenbook UX305UA-FC040T | |
| Acer TravelMate P238-M-5575 | |
| Lenovo ThinkPad 13-20GKS01100 | |
| Apple MacBook Air 13 inch 2015-03 | |
| CPU Multi 64Bit | |
| Acer TravelMate X3 X349-M-7261 | |
| Asus Zenbook UX305UA-FC040T | |
| Apple MacBook Air 13 inch 2015-03 | |
| Acer TravelMate P238-M-5575 | |
| Lenovo ThinkPad 13-20GKS01100 | |
| Asus Zenbook UX303UB-R4100T | |
| Cinebench R10 | |
| Rendering Multiple CPUs 32Bit | |
| Acer TravelMate X3 X349-M-7261 | |
| Acer TravelMate P238-M-5575 | |
| Apple MacBook Air 13 inch 2015-03 | |
| Asus Zenbook UX303UB-R4100T | |
| Asus Zenbook UX305UA-FC040T | |
| Rendering Single 32Bit | |
| Apple MacBook Air 13 inch 2015-03 | |
| Acer TravelMate X3 X349-M-7261 | |
| Asus Zenbook UX303UB-R4100T | |
| Asus Zenbook UX305UA-FC040T | |
| Acer TravelMate P238-M-5575 | |
| Geekbench 3 | |
| 32 Bit Single-Core Score | |
| Acer TravelMate X3 X349-M-7261 | |
| Asus Zenbook UX305UA-FC040T | |
| Apple MacBook Air 13 inch 2015-03 | |
| Asus Zenbook UX303UB-R4100T | |
| Acer TravelMate P238-M-5575 | |
| 32 Bit Multi-Core Score | |
| Acer TravelMate X3 X349-M-7261 | |
| Asus Zenbook UX305UA-FC040T | |
| Asus Zenbook UX303UB-R4100T | |
| Apple MacBook Air 13 inch 2015-03 | |
| Acer TravelMate P238-M-5575 | |
| Geekbench 4.0 | |
| 64 Bit Single-Core Score | |
| Acer TravelMate X3 X349-M-7261 | |
| 64 Bit Multi-Core Score | |
| Acer TravelMate X3 X349-M-7261 | |
| JetStream 1.1 - 1.1 Total | |
| Asus Zenbook UX303UB-R4100T | |
| Acer TravelMate X3 X349-M-7261 | |
| Asus Zenbook UX305UA-FC040T | |
| Lenovo ThinkPad 13-20GKS01100 | |
| Acer TravelMate P238-M-5575 | |
| PCMark 7 Score | 5281 pontos | |
| PCMark 8 Home Score Accelerated v2 | 3545 pontos | |
| PCMark 8 Creative Score Accelerated v2 | 4166 pontos | |
| PCMark 8 Work Score Accelerated v2 | 4361 pontos | |
Ajuda | ||
| PCMark 8 | |
| Home Score Accelerated v2 | |
| Acer TravelMate P238-M-5575 | |
| Apple MacBook Air 13 inch 2015-03 | |
| Acer TravelMate X3 X349-M-7261 | |
| Asus Zenbook UX305UA-FC040T | |
| Asus Zenbook UX303UB-R4100T | |
| Lenovo ThinkPad 13-20GKS01100 | |
| Work Score Accelerated v2 | |
| Acer TravelMate P238-M-5575 | |
| Apple MacBook Air 13 inch 2015-03 | |
| Acer TravelMate X3 X349-M-7261 | |
| Asus Zenbook UX303UB-R4100T | |
| Asus Zenbook UX305UA-FC040T | |
| Lenovo ThinkPad 13-20GKS01100 | |

| Acer TravelMate X3 X349-M-7261 Liteonit CV3-8D512 | Apple MacBook Air 13 inch 2015-03 Apple SSD SD0256F | Lenovo ThinkPad 13-20GKS01100 Samsung SSD PM871 MZNLN256HCHP | Acer TravelMate P238-M-5575 Samsung SSD PM871 MZNLN256HCHP | Asus Zenbook UX305UA-FC040T SK Hynix Canvas SC300 512GB M.2 (HFS512G39MND) | Asus Zenbook UX303UB-R4100T Micron M600 MTFDDAK512MBF | |
|---|---|---|---|---|---|---|
| CrystalDiskMark 3.0 | 70% | -9% | -6% | -10% | -1% | |
| Read Seq (MB/s) | 484.1 | 1352 179% | 461.7 -5% | 517 7% | 469.1 -3% | 484.2 0% |
| Write Seq (MB/s) | 449.8 | 1111 147% | 297.8 -34% | 307.6 -32% | 412.1 -8% | 444.9 -1% |
| Read 512 (MB/s) | 399.1 | 880 120% | 351.6 -12% | 459.9 15% | 301.6 -24% | 387.8 -3% |
| Write 512 (MB/s) | 355.1 | 1023 188% | 298.4 -16% | 305.1 -14% | 327.1 -8% | 386.3 9% |
| Read 4k (MB/s) | 33.44 | 21.93 -34% | 31.85 -5% | 33.03 -1% | 28.08 -16% | 28.74 -14% |
| Write 4k (MB/s) | 67.5 | 30.94 -54% | 68.5 1% | 85.2 26% | 71.9 7% | 90.5 34% |
| Read 4k QD32 (MB/s) | 368.5 | 339.5 -8% | 360.9 -2% | 235.6 -36% | 262 -29% | 300.5 -18% |
| Write 4k QD32 (MB/s) | 280.6 | 342.9 22% | 276.2 -2% | 234.4 -16% | 274.7 -2% | 243.3 -13% |
| 3DMark 06 Standard Score | 9977 pontos | |
| 3DMark 11 Performance | 1648 pontos | |
| 3DMark Ice Storm Standard Score | 57874 pontos | |
| 3DMark Cloud Gate Standard Score | 5745 pontos | |
| 3DMark Fire Strike Score | 807 pontos | |
Ajuda | ||
| 3DMark 11 - 1280x720 Performance GPU | |
| Asus Zenbook UX303UB-R4100T | |
| Acer TravelMate X3 X349-M-7261 | |
| Asus Zenbook UX305UA-FC040T | |
| Apple MacBook Air 13 inch 2015-03 | |
| Acer TravelMate P238-M-5575 | |
| Lenovo ThinkPad 13-20GKS01100 | |
| 3DMark | |
| 1280x720 Cloud Gate Standard Graphics | |
| Asus Zenbook UX303UB-R4100T | |
| Acer TravelMate P238-M-5575 | |
| Apple MacBook Air 13 inch 2015-03 | |
| Acer TravelMate X3 X349-M-7261 | |
| Asus Zenbook UX305UA-FC040T | |
| Lenovo ThinkPad 13-20GKS01100 | |
| 1920x1080 Fire Strike Graphics | |
| Asus Zenbook UX303UB-R4100T | |
| Apple MacBook Air 13 inch 2015-03 | |
| Asus Zenbook UX305UA-FC040T | |
| Acer TravelMate X3 X349-M-7261 | |
| Acer TravelMate P238-M-5575 | |
| Lenovo ThinkPad 13-20GKS01100 | |
| baixo | média | alto | ultra | |
|---|---|---|---|---|
| Tomb Raider (2013) | 78.1 | 39.8 | 24.3 | 12.2 |
| BioShock Infinite (2013) | 49.9 | 28.3 | 23.4 | 7.6 |
| Battlefield 4 (2013) | 43.1 | 30.7 | 20.2 | 6.1 |
| GTA V (2015) | 35 | 29.5 | 6.9 | |
| Doom (2016) | 21.3 | 17.3 | 9.9 | |
| Deus Ex Mankind Divided (2016) | 12.9 | 8.8 | ||
| FIFA 17 (2016) | 60.8 | 50 | ||
| Mafia 3 (2016) | 8.2 | 6.1 |
Barulho
| Ocioso |
| 31.5 / 31.5 / 31.5 dB |
| Carga |
| 31.7 / 34.1 dB |
 | ||
30 dB silencioso 40 dB(A) audível 50 dB(A) ruidosamente alto |
||
min: | ||
| Acer TravelMate X3 X349-M-7261 6500U, HD Graphics 520 | Apple MacBook Air 13 inch 2015-03 5650U, HD Graphics 6000 | Lenovo ThinkPad 13-20GKS01100 6200U, HD Graphics 520 | Acer TravelMate P238-M-5575 6200U, HD Graphics 520 | Asus Zenbook UX305UA-FC040T 6500U, HD Graphics 520 | Asus Zenbook UX303UB-R4100T 6500U, GeForce 940M | |
|---|---|---|---|---|---|---|
| Noise | -8% | 6% | -4% | -5% | -5% | |
| desligado / ambiente * (dB) | 31.15 | 29.1 7% | 31.2 -0% | 31.3 -0% | ||
| Idle Minimum * (dB) | 31.5 | 29.2 7% | 29.1 8% | 31.2 1% | 31.3 1% | 31.5 -0% |
| Idle Average * (dB) | 31.5 | 29.2 7% | 29.1 8% | 31.2 1% | 31.3 1% | 31.5 -0% |
| Idle Maximum * (dB) | 31.5 | 29.2 7% | 29.1 8% | 31.2 1% | 32.2 -2% | 31.5 -0% |
| Load Average * (dB) | 31.7 | 40.2 -27% | 31.5 1% | 35.71 -13% | 37.6 -19% | 35.9 -13% |
| Load Maximum * (dB) | 34.1 | 46.3 -36% | 33.5 2% | 38.1 -12% | 38 -11% | 38.2 -12% |
* ... menor é melhor
(+) A temperatura máxima no lado superior é 38.6 °C / 101 F, em comparação com a média de 35.9 °C / 97 F , variando de 21.4 a 59 °C para a classe Subnotebook.
(+) A parte inferior aquece até um máximo de 39.5 °C / 103 F, em comparação com a média de 39.2 °C / 103 F
(+) Em uso inativo, a temperatura média para o lado superior é 24.2 °C / 76 F, em comparação com a média do dispositivo de 30.8 °C / ### class_avg_f### F.
(+) Os apoios para as mãos e o touchpad são mais frios que a temperatura da pele, com um máximo de 28.3 °C / 82.9 F e, portanto, são frios ao toque.
(±) A temperatura média da área do apoio para as mãos de dispositivos semelhantes foi 28.2 °C / 82.8 F (-0.1 °C / -0.1 F).
| Acer TravelMate X3 X349-M-7261 6500U, HD Graphics 520 | Apple MacBook Air 13 inch 2015-03 5650U, HD Graphics 6000 | Lenovo ThinkPad 13-20GKS01100 6200U, HD Graphics 520 | Acer TravelMate P238-M-5575 6200U, HD Graphics 520 | Asus Zenbook UX305UA-FC040T 6500U, HD Graphics 520 | Asus Zenbook UX303UB-R4100T 6500U, GeForce 940M | |
|---|---|---|---|---|---|---|
| Heat | -12% | -20% | 4% | 0% | -19% | |
| Maximum Upper Side * (°C) | 38.6 | 43.8 -13% | 43.7 -13% | 34.2 11% | 40.8 -6% | 56.6 -47% |
| Maximum Bottom * (°C) | 39.5 | 42.1 -7% | 44.2 -12% | 31 22% | 37 6% | 54.3 -37% |
| Idle Upper Side * (°C) | 24.8 | 28.5 -15% | 31.4 -27% | 27.1 -9% | 25.2 -2% | 24 3% |
| Idle Bottom * (°C) | 25.4 | 28.9 -14% | 32.1 -26% | 27.7 -9% | 24.9 2% | 24.2 5% |
* ... menor é melhor
Acer TravelMate X3 X349-M-7261 análise de áudio
(-) | alto-falantes não muito altos (###valor### dB)
Graves 100 - 315Hz
(-) | quase nenhum baixo - em média 17.8% menor que a mediana
(±) | a linearidade dos graves é média (12.9% delta para a frequência anterior)
Médios 400 - 2.000 Hz
(+) | médios equilibrados - apenas 4.9% longe da mediana
(±) | a linearidade dos médios é média (10.9% delta para frequência anterior)
Altos 2 - 16 kHz
(+) | agudos equilibrados - apenas 4.8% longe da mediana
(±) | a linearidade dos máximos é média (8.1% delta para frequência anterior)
Geral 100 - 16.000 Hz
(±) | a linearidade do som geral é média (25.1% diferença em relação à mediana)
Comparado com a mesma classe
» 84% de todos os dispositivos testados nesta classe foram melhores, 4% semelhantes, 12% piores
» O melhor teve um delta de 5%, a média foi 18%, o pior foi 53%
Comparado com todos os dispositivos testados
» 77% de todos os dispositivos testados foram melhores, 5% semelhantes, 18% piores
» O melhor teve um delta de 4%, a média foi 23%, o pior foi 134%
Apple MacBook 12 (Early 2016) 1.1 GHz análise de áudio
(+) | os alto-falantes podem tocar relativamente alto (###valor### dB)
Graves 100 - 315Hz
(±) | graves reduzidos - em média 11.3% menor que a mediana
(±) | a linearidade dos graves é média (14.2% delta para a frequência anterior)
Médios 400 - 2.000 Hz
(+) | médios equilibrados - apenas 2.4% longe da mediana
(+) | médios são lineares (5.5% delta para frequência anterior)
Altos 2 - 16 kHz
(+) | agudos equilibrados - apenas 2% longe da mediana
(+) | os máximos são lineares (4.5% delta da frequência anterior)
Geral 100 - 16.000 Hz
(+) | o som geral é linear (10.2% diferença em relação à mediana)
Comparado com a mesma classe
» 7% de todos os dispositivos testados nesta classe foram melhores, 2% semelhantes, 90% piores
» O melhor teve um delta de 5%, a média foi 18%, o pior foi 53%
Comparado com todos os dispositivos testados
» 5% de todos os dispositivos testados foram melhores, 1% semelhantes, 94% piores
» O melhor teve um delta de 4%, a média foi 23%, o pior foi 134%
| desligado | |
| Ocioso | |
| Carga |
|
Key:
min: | |
| Acer TravelMate X3 X349-M-7261 6500U, HD Graphics 520 | Apple MacBook Air 13 inch 2015-03 5650U, HD Graphics 6000 | Lenovo ThinkPad 13-20GKS01100 6200U, HD Graphics 520 | Acer TravelMate P238-M-5575 6200U, HD Graphics 520 | Asus Zenbook UX305UA-FC040T 6500U, HD Graphics 520 | Asus Zenbook UX303UB-R4100T 6500U, GeForce 940M | |
|---|---|---|---|---|---|---|
| Power Consumption | 16% | 21% | 19% | 14% | -18% | |
| Idle Minimum * (Watt) | 4.9 | 2.7 45% | 3.1 37% | 3.2 35% | 3.2 35% | 3.2 35% |
| Idle Average * (Watt) | 7.3 | 5.7 22% | 5.5 25% | 5.5 25% | 6.5 11% | 7.6 -4% |
| Idle Maximum * (Watt) | 9.4 | 6 36% | 6 36% | 6 36% | 6.7 29% | 8 15% |
| Load Average * (Watt) | 26 | 32.1 -23% | 25.8 1% | 29.5 -13% | 30.6 -18% | 47 -81% |
| Load Maximum * (Watt) | 36 | 36.2 -1% | 33.6 7% | 30.9 14% | 31 14% | 55 -53% |
* ... menor é melhor
| Acer TravelMate X3 X349-M-7261 6500U, HD Graphics 520, 48.9 Wh | Apple MacBook Air 13 inch 2015-03 5650U, HD Graphics 6000, 54 Wh | Lenovo ThinkPad 13-20GKS01100 6200U, HD Graphics 520, 42 Wh | Acer TravelMate P238-M-5575 6200U, HD Graphics 520, 49.7 Wh | Asus Zenbook UX305UA-FC040T 6500U, HD Graphics 520, 56 Wh | Asus Zenbook UX303UB-R4100T 6500U, GeForce 940M, 50 Wh | |
|---|---|---|---|---|---|---|
| Duração da bateria | 60% | 18% | 56% | 51% | 17% | |
| Reader / Idle (h) | 11.3 | 26.2 132% | 15.7 39% | 21.5 90% | 23.8 111% | 16.6 47% |
| H.264 (h) | 6.7 | 7.8 16% | 9.3 39% | 9.1 36% | 6.9 3% | |
| WiFi v1.3 (h) | 6.5 | 10.3 58% | 6.2 -5% | 10.1 55% | 9.4 45% | 6.8 5% |
| Load (h) | 1.8 | 1.6 -11% | 2.2 22% | 2.5 39% | 2 11% | 2 11% |
Pro
Contra
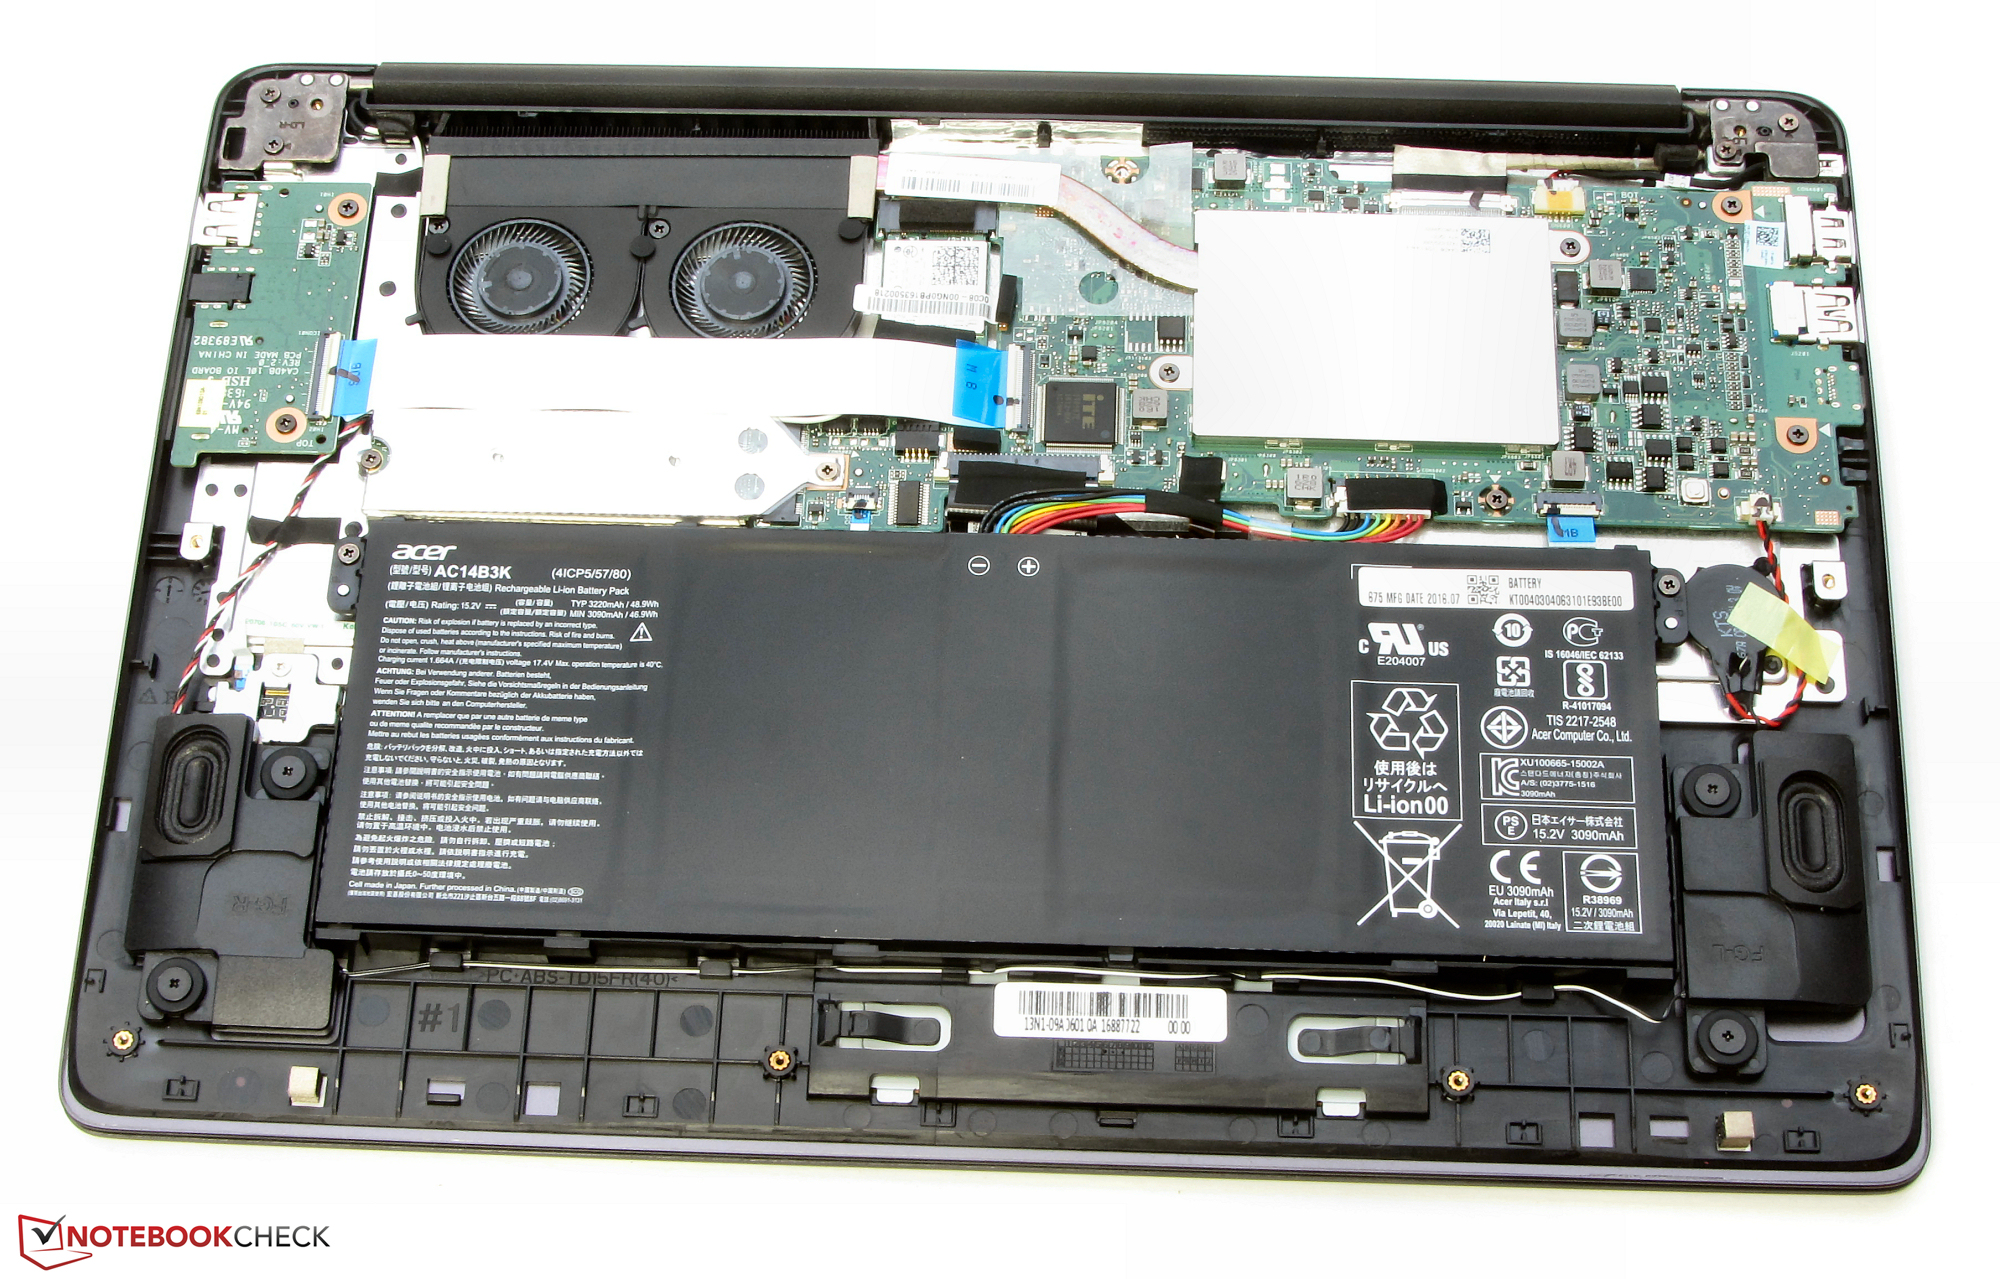
A tecnologia do TravelMate está dentro de uma elegante carcaça de alumínio. Não falta poder de cômputo: O Core i7 fornece suficiente poder de processamento em os campos de aplicação comuns. O portátil funciona de forma silenciosa e somente esquenta de forma moderada. Um veloz SSD garante um sistema veloz. É possível substituir o SSD depois de abrir a carcaça do portátil. O teclado iluminado deixa uma boa impressão. A boa duração da bateria complementa isso. O painel IPS mate com ângulos de visão estáveis brilha com alto contraste e uma reprodução de cores muito boa. Infelizmente o brilho da tela é muito baixo. Uma garantia de três anos completa o pacote.
A Acer construiu um aparelho fino e muito elegante que deve encontrar muitos fanáticos.
Testamos o modelo premium da gama. Com um preço de 1050 Euros (~$1155), não é um dos portáteis mais baratos. O modelo de nível de entrada (TravelMate X3 X349-M-3373) na linha, provavelmente seja mais atraente para a maioria dos compradores potenciais e custa menos de 600 Euros (~$660). A configuração de nível de entrada do TravelMate (Core i3-6100U, 4 GB, SSD de 128 GB, IPS Full HD será mais que suficiente para o seu campo de aplicação principal.
Acer TravelMate X3 X349-M-7261
- 10/14/2016 v5.1 (old)
Sascha Mölck