Breve Análise do Portátil Lenovo IdeaPad 520s-14IKB (Core i5-7200U, 940MX)

| SD Card Reader | |
| average JPG Copy Test (av. of 3 runs) | |
| Dell XPS 13 9360 FHD i5 (Toshiba Exceria Pro SDXC 64 GB UHS-II) | |
| Lenovo IdeaPad 520s-14IKB 80X200C1GE (Toshiba Exceria Pro SDXC 64 GB UHS-II) | |
| HP Envy 13-ad065nr (Toshiba THN-M401S0640E2) | |
| maximum AS SSD Seq Read Test (1GB) | |
| Dell XPS 13 9360 FHD i5 (Toshiba Exceria Pro SDXC 64 GB UHS-II) | |
| Lenovo IdeaPad 520s-14IKB 80X200C1GE (Toshiba Exceria Pro SDXC 64 GB UHS-II) | |
| HP Envy 13-ad065nr (Toshiba THN-M401S0640E2) | |
| Networking | |
| iperf3 transmit AX12 | |
| Dell XPS 13 9360 FHD i5 | |
| HP Envy 13-ad065nr | |
| Lenovo IdeaPad 520s-14IKB 80X200C1GE | |
| iperf3 receive AX12 | |
| HP Envy 13-ad065nr | |
| Dell XPS 13 9360 FHD i5 | |
| Lenovo IdeaPad 520s-14IKB 80X200C1GE | |
Cintilação da tela / PWM (modulação por largura de pulso)
| Tela tremeluzindo/PWM detectado | 24510 Hz | ≤ 60 % configuração de brilho | 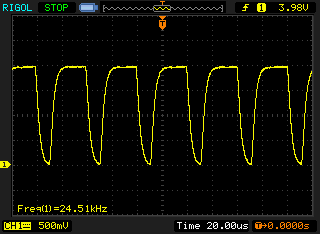 |
A luz de fundo da tela pisca em 24510 Hz (pior caso, por exemplo, utilizando PWM) Cintilação detectada em uma configuração de brilho de 60 % e abaixo. Não deve haver cintilação ou PWM acima desta configuração de brilho. A frequência de 24510 Hz é bastante alta, então a maioria dos usuários sensíveis ao PWM não deve notar nenhuma oscilação. [pwm_comparison] Em comparação: 52 % de todos os dispositivos testados não usam PWM para escurecer a tela. Se PWM foi detectado, uma média de 7798 (mínimo: 5 - máximo: 343500) Hz foi medida. | |||
| |||||||||||||||||||||||||
iluminação: 83 %
iluminação com acumulador: 273 cd/m²
Contraste: 1522:1 (Preto: 0.18 cd/m²)
ΔE ColorChecker Calman: 6.7 | ∀{0.5-29.43 Ø4.73}
ΔE Greyscale Calman: 6.3 | ∀{0.09-98 Ø4.97}
61.5% sRGB (Argyll 1.6.3 3D)
39.6% AdobeRGB 1998 (Argyll 1.6.3 3D)
43.05% AdobeRGB 1998 (Argyll 3D)
61.8% sRGB (Argyll 3D)
41.58% Display P3 (Argyll 3D)
Gamma: 2.04
CCT: 6363 K
| Lenovo IdeaPad 520s-14IKB 80X200C1GE N140HCA-EAC, , 1920x1080, 14" | Asus X302UV-FN016T InfoVision M133NWN1 R3, , 1366x768, 13.3" | Xiaomi Mi Notebook Air 13.3 2016 Samsung LTN133HL09-M01, , 1920x1080, 13.3" | Lenovo IdeaPad 510S-14ISK NV140FHM-N41, , 1920x1080, 14" | Dell XPS 13 9360 FHD i5 Sharp SHP1449 LQ133M1, , 1920x1080, 13.3" | HP Envy 13-ad065nr LG Philips LGD0576, , 1920x1080, 13.3" | |
|---|---|---|---|---|---|---|
| Display | 16% | 57% | 3% | 18% | 45% | |
| Display P3 Coverage (%) | 41.58 | 48.37 16% | 66 59% | 42.88 3% | 48.94 18% | 65.5 58% |
| sRGB Coverage (%) | 61.8 | 72.6 17% | 95.5 55% | 64.1 4% | 73.3 19% | 83.8 36% |
| AdobeRGB 1998 Coverage (%) | 43.05 | 49.98 16% | 67.8 57% | 44.3 3% | 50.5 17% | 61.3 42% |
| Response Times | 1% | -16% | -8% | -6% | 21% | |
| Response Time Grey 50% / Grey 80% * (ms) | 38 ? | 42 ? -11% | 49 ? -29% | 45 ? -18% | 32.8 ? 14% | 28 ? 26% |
| Response Time Black / White * (ms) | 26.4 ? | 23 ? 13% | 27 ? -2% | 26 ? 2% | 33.2 ? -26% | 22.4 ? 15% |
| PWM Frequency (Hz) | 24510 ? | 50 ? | 50 ? | 50 ? | 10200 ? | |
| Screen | -13% | 26% | 3% | 14% | 7% | |
| Brightness middle (cd/m²) | 274 | 218 -20% | 347 27% | 257 -6% | 351.2 28% | 290 6% |
| Brightness (cd/m²) | 256 | 210 -18% | 334 30% | 263 3% | 325 27% | 270 5% |
| Brightness Distribution (%) | 83 | 88 6% | 80 -4% | 90 8% | 89 7% | 78 -6% |
| Black Level * (cd/m²) | 0.18 | 0.5 -178% | 0.27 -50% | 0.24 -33% | 0.195 -8% | 0.32 -78% |
| Contrast (:1) | 1522 | 436 -71% | 1285 -16% | 1071 -30% | 1801 18% | 906 -40% |
| Colorchecker dE 2000 * | 6.7 | 3.89 42% | 3.29 51% | 5.44 19% | 7.4 -10% | 4.8 28% |
| Colorchecker dE 2000 max. * | 14.8 | 7.11 52% | 4.69 68% | 10.93 26% | 9.08 39% | 11.2 24% |
| Greyscale dE 2000 * | 6.3 | 4.9 22% | 3.62 43% | 3.95 37% | 6.71 -7% | 2.8 56% |
| Gamma | 2.04 108% | 2.41 91% | 2.23 99% | 2.29 96% | 2.74 80% | 2.19 100% |
| CCT | 6363 102% | 7860 83% | 7307 89% | 6896 94% | 7222 90% | 6382 102% |
| Color Space (Percent of AdobeRGB 1998) (%) | 39.6 | 46 16% | 62 57% | 40 1% | 50.48 27% | 54.9 39% |
| Color Space (Percent of sRGB) (%) | 61.5 | 73 19% | 95 54% | 64 4% | 73.31 19% | 83.5 36% |
| Média Total (Programa/Configurações) | 1% /
-5% | 22% /
27% | -1% /
2% | 9% /
12% | 24% /
16% |
* ... menor é melhor
Exibir tempos de resposta
| ↔ Tempo de resposta preto para branco | ||
|---|---|---|
| 26.4 ms ... ascensão ↗ e queda ↘ combinadas | ↗ 14.8 ms ascensão | 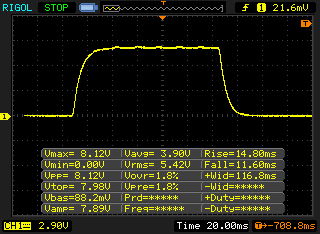 |
| ↘ 11.6 ms queda | ||
| A tela mostra taxas de resposta relativamente lentas em nossos testes e pode ser muito lenta para os jogadores. Em comparação, todos os dispositivos testados variam de 0.1 (mínimo) a 240 (máximo) ms. » 66 % de todos os dispositivos são melhores. Isso significa que o tempo de resposta medido é pior que a média de todos os dispositivos testados (19.9 ms). | ||
| ↔ Tempo de resposta 50% cinza a 80% cinza | ||
| 38 ms ... ascensão ↗ e queda ↘ combinadas | ↗ 20 ms ascensão | 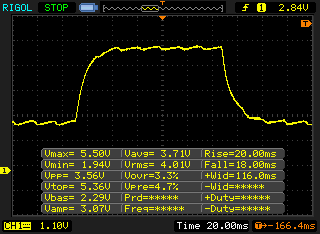 |
| ↘ 18 ms queda | ||
| A tela mostra taxas de resposta lentas em nossos testes e será insatisfatória para os jogadores. Em comparação, todos os dispositivos testados variam de 0.165 (mínimo) a 636 (máximo) ms. » 55 % de todos os dispositivos são melhores. Isso significa que o tempo de resposta medido é pior que a média de todos os dispositivos testados (31.1 ms). | ||
| Cinebench R15 | |
| CPU Single 64Bit | |
| Lenovo IdeaPad 520s-14IKB 80X200C1GE | |
| HP Pavilion 14-al103ng | |
| Acer TravelMate X349-G2 | |
| Lenovo IdeaPad 510S-14ISK | |
| Xiaomi Mi Notebook Air 13.3 2016 | |
| Asus X302UV-FN016T | |
| CPU Multi 64Bit | |
| Lenovo IdeaPad 520s-14IKB 80X200C1GE | |
| HP Pavilion 14-al103ng | |
| Acer TravelMate X349-G2 | |
| Lenovo IdeaPad 510S-14ISK | |
| Xiaomi Mi Notebook Air 13.3 2016 | |
| Asus X302UV-FN016T | |
| PCMark 8 | |
| Home Score Accelerated v2 | |
| HP Envy 13-ad065nr | |
| Lenovo IdeaPad 510S-14ISK | |
| Lenovo IdeaPad 520s-14IKB 80X200C1GE | |
| Dell XPS 13 9360 FHD i5 | |
| Asus X302UV-FN016T | |
| Xiaomi Mi Notebook Air 13.3 2016 | |
| Work Score Accelerated v2 | |
| HP Envy 13-ad065nr | |
| Lenovo IdeaPad 520s-14IKB 80X200C1GE | |
| Lenovo IdeaPad 510S-14ISK | |
| Dell XPS 13 9360 FHD i5 | |
| Asus X302UV-FN016T | |
| Xiaomi Mi Notebook Air 13.3 2016 | |
| PCMark 8 Home Score Accelerated v2 | 3554 pontos | |
| PCMark 8 Work Score Accelerated v2 | 4628 pontos | |
| PCMark 10 Score | 2844 pontos | |
Ajuda | ||
| Lenovo IdeaPad 520s-14IKB 80X200C1GE Ramaxel RTNTE256PCA8EADL | Lenovo IdeaPad 510S-14ISK Samsung MZYTY256HDHP | Acer TravelMate X349-G2 Intel SSD 600p SSDPEKKW512G7 | HP Pavilion 14-al103ng Western Digital Scorpio Blue WD5000LPCX-24C6HT0 | Xiaomi Mi Notebook Air 13.3 2016 Samsung PM951 NVMe MZVLV256 | Asus X302UV-FN016T Hynix HFS128G3MND | |
|---|---|---|---|---|---|---|
| CrystalDiskMark 3.0 | 29% | 113% | -88% | 76% | -26% | |
| Read Seq (MB/s) | 472.3 | 510 8% | 1818 285% | 113.3 -76% | 1209 156% | 428.2 -9% |
| Write Seq (MB/s) | 254.1 | 458.8 81% | 582 129% | 110.2 -57% | 314 24% | 178.6 -30% |
| Read 512 (MB/s) | 347.8 | 399.7 15% | 1134 226% | 30.83 -91% | 282.6 -19% | |
| Write 512 (MB/s) | 252.8 | 299.3 18% | 586 132% | 47.13 -81% | 179.1 -29% | |
| Read 4k (MB/s) | 24.74 | 35.27 43% | 34.93 41% | 0.34 -99% | 43.4 75% | 6.559 -73% |
| Write 4k (MB/s) | 77.7 | 90.2 16% | 133.4 72% | 0.981 -99% | 153.4 97% | 71.2 -8% |
| Read 4k QD32 (MB/s) | 279.6 | 397.7 42% | 373.7 34% | 0.72 -100% | 487.6 74% | 253 -10% |
| Write 4k QD32 (MB/s) | 244.8 | 257.3 5% | 210.8 -14% | 1.026 -100% | 312.2 28% | 174 -29% |

| 3DMark 11 - 1280x720 Performance GPU | |
| Acer Aspire 5 A515-51G-51RL | |
| Lenovo IdeaPad 520s-14IKB 80X200C1GE | |
| Xiaomi Mi Notebook Air 13.3 2016 | |
| Lenovo IdeaPad 510S-14ISK | |
| Asus X302UV-FN016T | |
| Dell XPS 13 9360 FHD i5 | |
| HP Envy 13-ad065nr | |
| 3DMark | |
| 1280x720 Cloud Gate Standard Graphics | |
| Acer Aspire 5 A515-51G-51RL | |
| Lenovo IdeaPad 520s-14IKB 80X200C1GE | |
| Xiaomi Mi Notebook Air 13.3 2016 | |
| Lenovo IdeaPad 510S-14ISK | |
| Dell XPS 13 9360 FHD i5 | |
| HP Envy 13-ad065nr | |
| Asus X302UV-FN016T | |
| 1920x1080 Fire Strike Graphics | |
| Acer Aspire 5 A515-51G-51RL | |
| Lenovo IdeaPad 520s-14IKB 80X200C1GE | |
| Xiaomi Mi Notebook Air 13.3 2016 | |
| Asus X302UV-FN016T | |
| Lenovo IdeaPad 510S-14ISK | |
| Dell XPS 13 9360 FHD i5 | |
| HP Envy 13-ad065nr | |
| 3DMark 11 Performance | 2700 pontos | |
| 3DMark Cloud Gate Standard Score | 7222 pontos | |
| 3DMark Fire Strike Score | 1936 pontos | |
Ajuda | ||
| BioShock Infinite - 1920x1080 Ultra Preset, DX11 (DDOF) | |
| Acer Aspire 5 A515-51G-51RL | |
| Lenovo IdeaPad 520s-14IKB 80X200C1GE | |
| Xiaomi Mi Notebook Air 13.3 2016 | |
| Lenovo IdeaPad 510S-14ISK | |
| Rise of the Tomb Raider - 1366x768 Medium Preset AF:2x | |
| Acer Aspire 5 A515-51G-51RL | |
| Lenovo IdeaPad 520s-14IKB 80X200C1GE | |
| Xiaomi Mi Notebook Air 13.3 2016 | |
| Lenovo IdeaPad 510S-14ISK | |
| baixo | média | alto | ultra | |
|---|---|---|---|---|
| BioShock Infinite (2013) | 135.8 | 73.4 | 63.8 | 23.49 |
| Company of Heroes 2 (2013) | 39.82 | 32.42 | 19.43 | |
| The Witcher 3 (2015) | 44.21 | 25.01 | 13.45 | 8 |
| Rise of the Tomb Raider (2016) | 45.79 | 25.49 | 13.63 |
Barulho
| Ocioso |
| 29.9 / 29.9 / 30.7 dB |
| Carga |
| 35.1 / 36.2 dB |
 | ||
30 dB silencioso 40 dB(A) audível 50 dB(A) ruidosamente alto |
||
min: | ||
(-) A temperatura máxima no lado superior é 49.3 °C / 121 F, em comparação com a média de 36.8 °C / 98 F , variando de 21 a 71 °C para a classe Multimedia.
(-) A parte inferior aquece até um máximo de 53.9 °C / 129 F, em comparação com a média de 39.1 °C / 102 F
(+) Em uso inativo, a temperatura média para o lado superior é 25.8 °C / 78 F, em comparação com a média do dispositivo de 31.3 °C / ### class_avg_f### F.
(±) Jogando The Witcher 3, a temperatura média para o lado superior é 36.3 °C / 97 F, em comparação com a média do dispositivo de 31.3 °C / ## #class_avg_f### F.
(+) Os apoios para as mãos e o touchpad estão atingindo a temperatura máxima da pele (33.6 °C / 92.5 F) e, portanto, não estão quentes.
(-) A temperatura média da área do apoio para as mãos de dispositivos semelhantes foi 28.7 °C / 83.7 F (-4.9 °C / -8.8 F).
Lenovo IdeaPad 520s-14IKB 80X200C1GE análise de áudio
(-) | alto-falantes não muito altos (###valor### dB)
Graves 100 - 315Hz
(±) | graves reduzidos - em média 12.7% menor que a mediana
(±) | a linearidade dos graves é média (12.7% delta para a frequência anterior)
Médios 400 - 2.000 Hz
(+) | médios equilibrados - apenas 3% longe da mediana
(±) | a linearidade dos médios é média (9.6% delta para frequência anterior)
Altos 2 - 16 kHz
(+) | agudos equilibrados - apenas 1.5% longe da mediana
(+) | os máximos são lineares (5.8% delta da frequência anterior)
Geral 100 - 16.000 Hz
(±) | a linearidade do som geral é média (16.6% diferença em relação à mediana)
Comparado com a mesma classe
» 44% de todos os dispositivos testados nesta classe foram melhores, 7% semelhantes, 49% piores
» O melhor teve um delta de 5%, a média foi 17%, o pior foi 45%
Comparado com todos os dispositivos testados
» 29% de todos os dispositivos testados foram melhores, 6% semelhantes, 66% piores
» O melhor teve um delta de 4%, a média foi 24%, o pior foi 134%
Dell XPS 13 9360 FHD i5 análise de áudio
(-) | alto-falantes não muito altos (###valor### dB)
Graves 100 - 315Hz
(±) | graves reduzidos - em média 6.9% menor que a mediana
(±) | a linearidade dos graves é média (10.5% delta para a frequência anterior)
Médios 400 - 2.000 Hz
(+) | médios equilibrados - apenas 3.7% longe da mediana
(+) | médios são lineares (4% delta para frequência anterior)
Altos 2 - 16 kHz
(+) | agudos equilibrados - apenas 2% longe da mediana
(±) | a linearidade dos máximos é média (10.3% delta para frequência anterior)
Geral 100 - 16.000 Hz
(±) | a linearidade do som geral é média (18.3% diferença em relação à mediana)
Comparado com a mesma classe
» 53% de todos os dispositivos testados nesta classe foram melhores, 7% semelhantes, 40% piores
» O melhor teve um delta de 5%, a média foi 18%, o pior foi 53%
Comparado com todos os dispositivos testados
» 40% de todos os dispositivos testados foram melhores, 8% semelhantes, 52% piores
» O melhor teve um delta de 4%, a média foi 24%, o pior foi 134%
| desligado | |
| Ocioso | |
| Carga |
|
Key:
min: | |
| Lenovo IdeaPad 520s-14IKB 80X200C1GE i5-7200U, GeForce 940MX, Ramaxel RTNTE256PCA8EADL, IPS LED, 1920x1080, 14" | Lenovo IdeaPad 510S-14ISK 6267U, Iris Graphics 550, Samsung MZYTY256HDHP, a-Si TFT-LCD, IPS, LED, 1920x1080, 14" | Xiaomi Mi Notebook Air 13.3 2016 6200U, GeForce 940MX, Samsung PM951 NVMe MZVLV256, IPS, 1920x1080, 13.3" | Dell XPS 13 9360 FHD i5 i5-7200U, HD Graphics 620, Toshiba NVMe THNSN5256GPUK, IPS, 1920x1080, 13.3" | HP Envy 13-ad065nr i5-7200U, HD Graphics 620, SanDisk X400 SD8SN8U-128G-1006, IPS, 1920x1080, 13.3" | Asus X302UV-FN016T 6200U, GeForce 920MX, Hynix HFS128G3MND, TN LED, 1366x768, 13.3" | |
|---|---|---|---|---|---|---|
| Power Consumption | 2% | -6% | 25% | 18% | 18% | |
| Idle Minimum * (Watt) | 3.37 | 3.9 -16% | 4 -19% | 4.1 -22% | 2.8 17% | 3.3 2% |
| Idle Average * (Watt) | 5.2 | 7.1 -37% | 6.6 -27% | 4.2 19% | 5.8 -12% | 5.1 2% |
| Idle Maximum * (Watt) | 7.1 | 8.8 -24% | 7.4 -4% | 5.1 28% | 6.4 10% | 5.2 27% |
| Load Average * (Watt) | 46.2 | 27.6 40% | 41.7 10% | 22.1 52% | 31.3 32% | 29.5 36% |
| Witcher 3 ultra * (Watt) | 38.5 | |||||
| Load Maximum * (Watt) | 57 | 30.2 47% | 52.4 8% | 29.4 48% | 31.7 44% | 44 23% |
* ... menor é melhor
| Lenovo IdeaPad 520s-14IKB 80X200C1GE i5-7200U, GeForce 940MX, 52.5 Wh | Lenovo IdeaPad 510S-14ISK 6267U, Iris Graphics 550, 30 Wh | Xiaomi Mi Notebook Air 13.3 2016 6200U, GeForce 940MX, 40 Wh | Asus X302UV-FN016T 6200U, GeForce 920MX, 38 Wh | Dell XPS 13 9360 FHD i5 i5-7200U, HD Graphics 620, 60 Wh | HP Envy 13-ad065nr i5-7200U, HD Graphics 620, 53.6 Wh | |
|---|---|---|---|---|---|---|
| Duração da bateria | -36% | -28% | -32% | 27% | 21% | |
| Reader / Idle (h) | 14.4 | 10.6 -26% | 12 -17% | 21.6 50% | 24.8 72% | |
| H.264 (h) | 9.3 | 3.9 -58% | 7.1 -24% | |||
| WiFi v1.3 (h) | 9.5 | 6.4 -33% | 6.5 -32% | 6.5 -32% | 11.3 19% | 9.5 0% |
| Load (h) | 2.3 | 1.7 -26% | 1.4 -39% | 2.6 13% | 2.1 -9% |
Pro
Contra
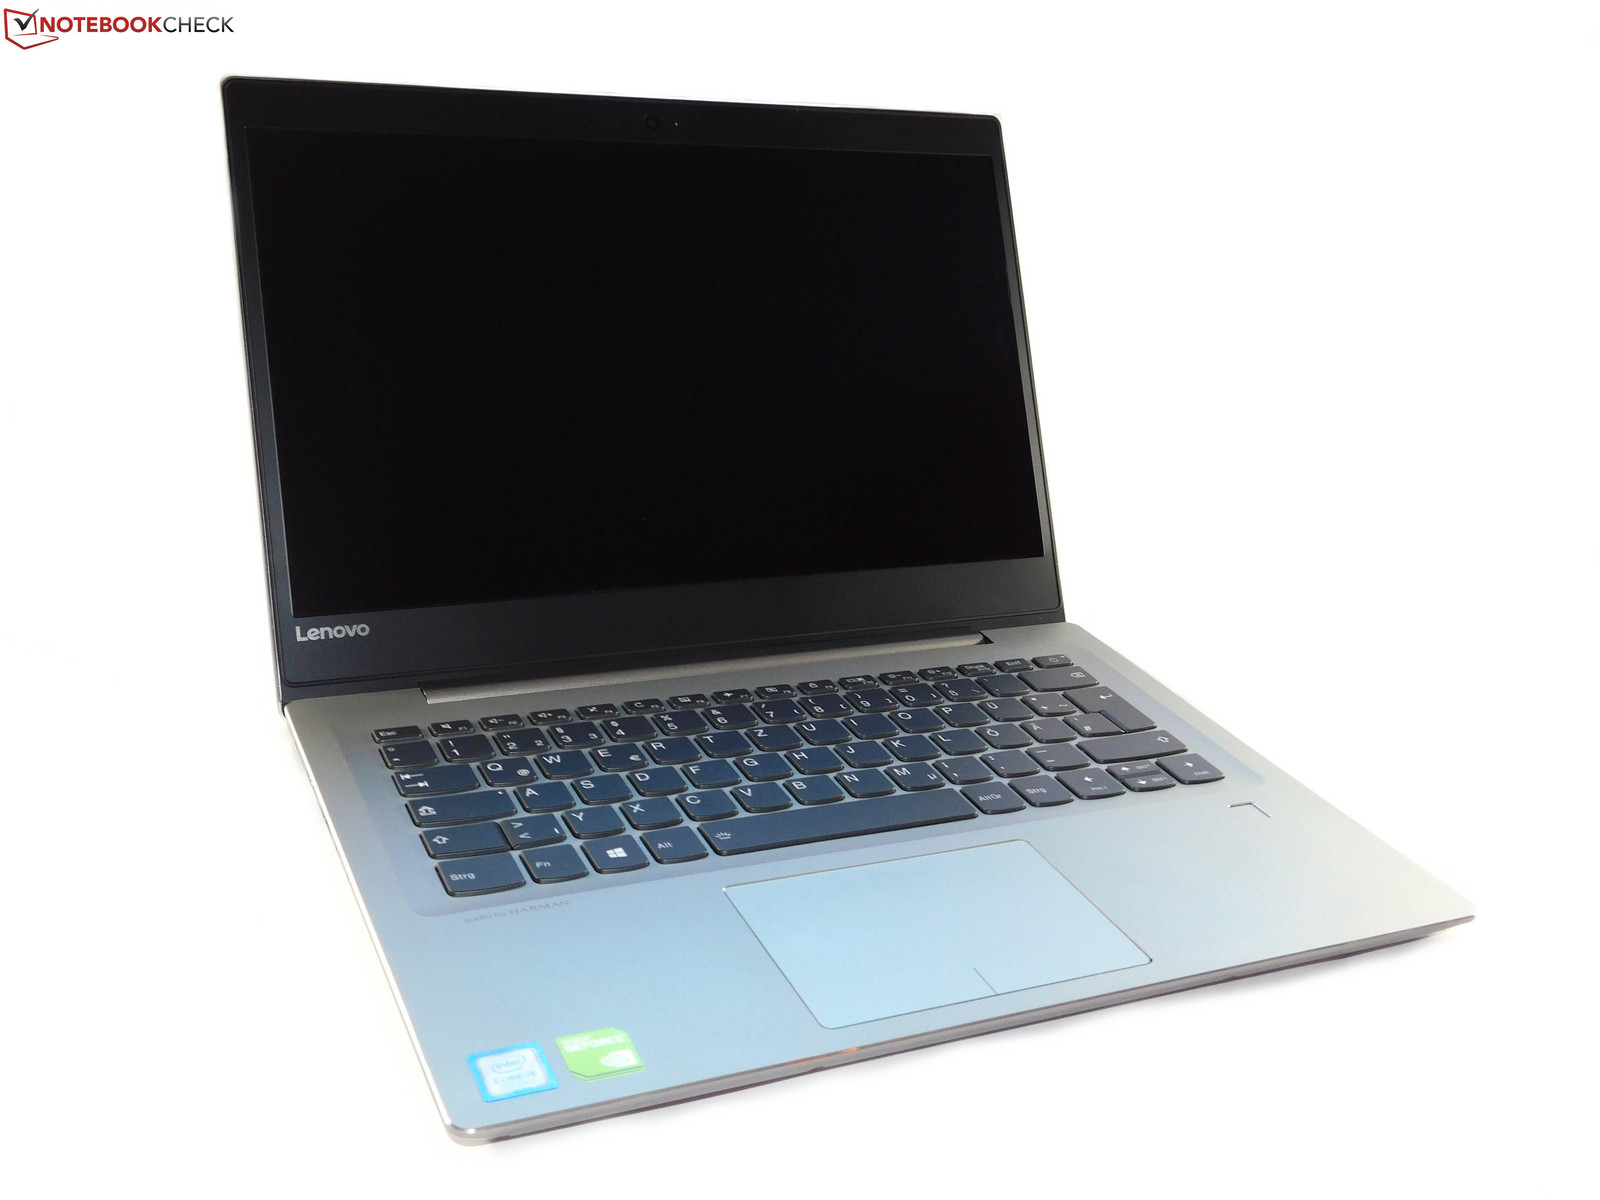
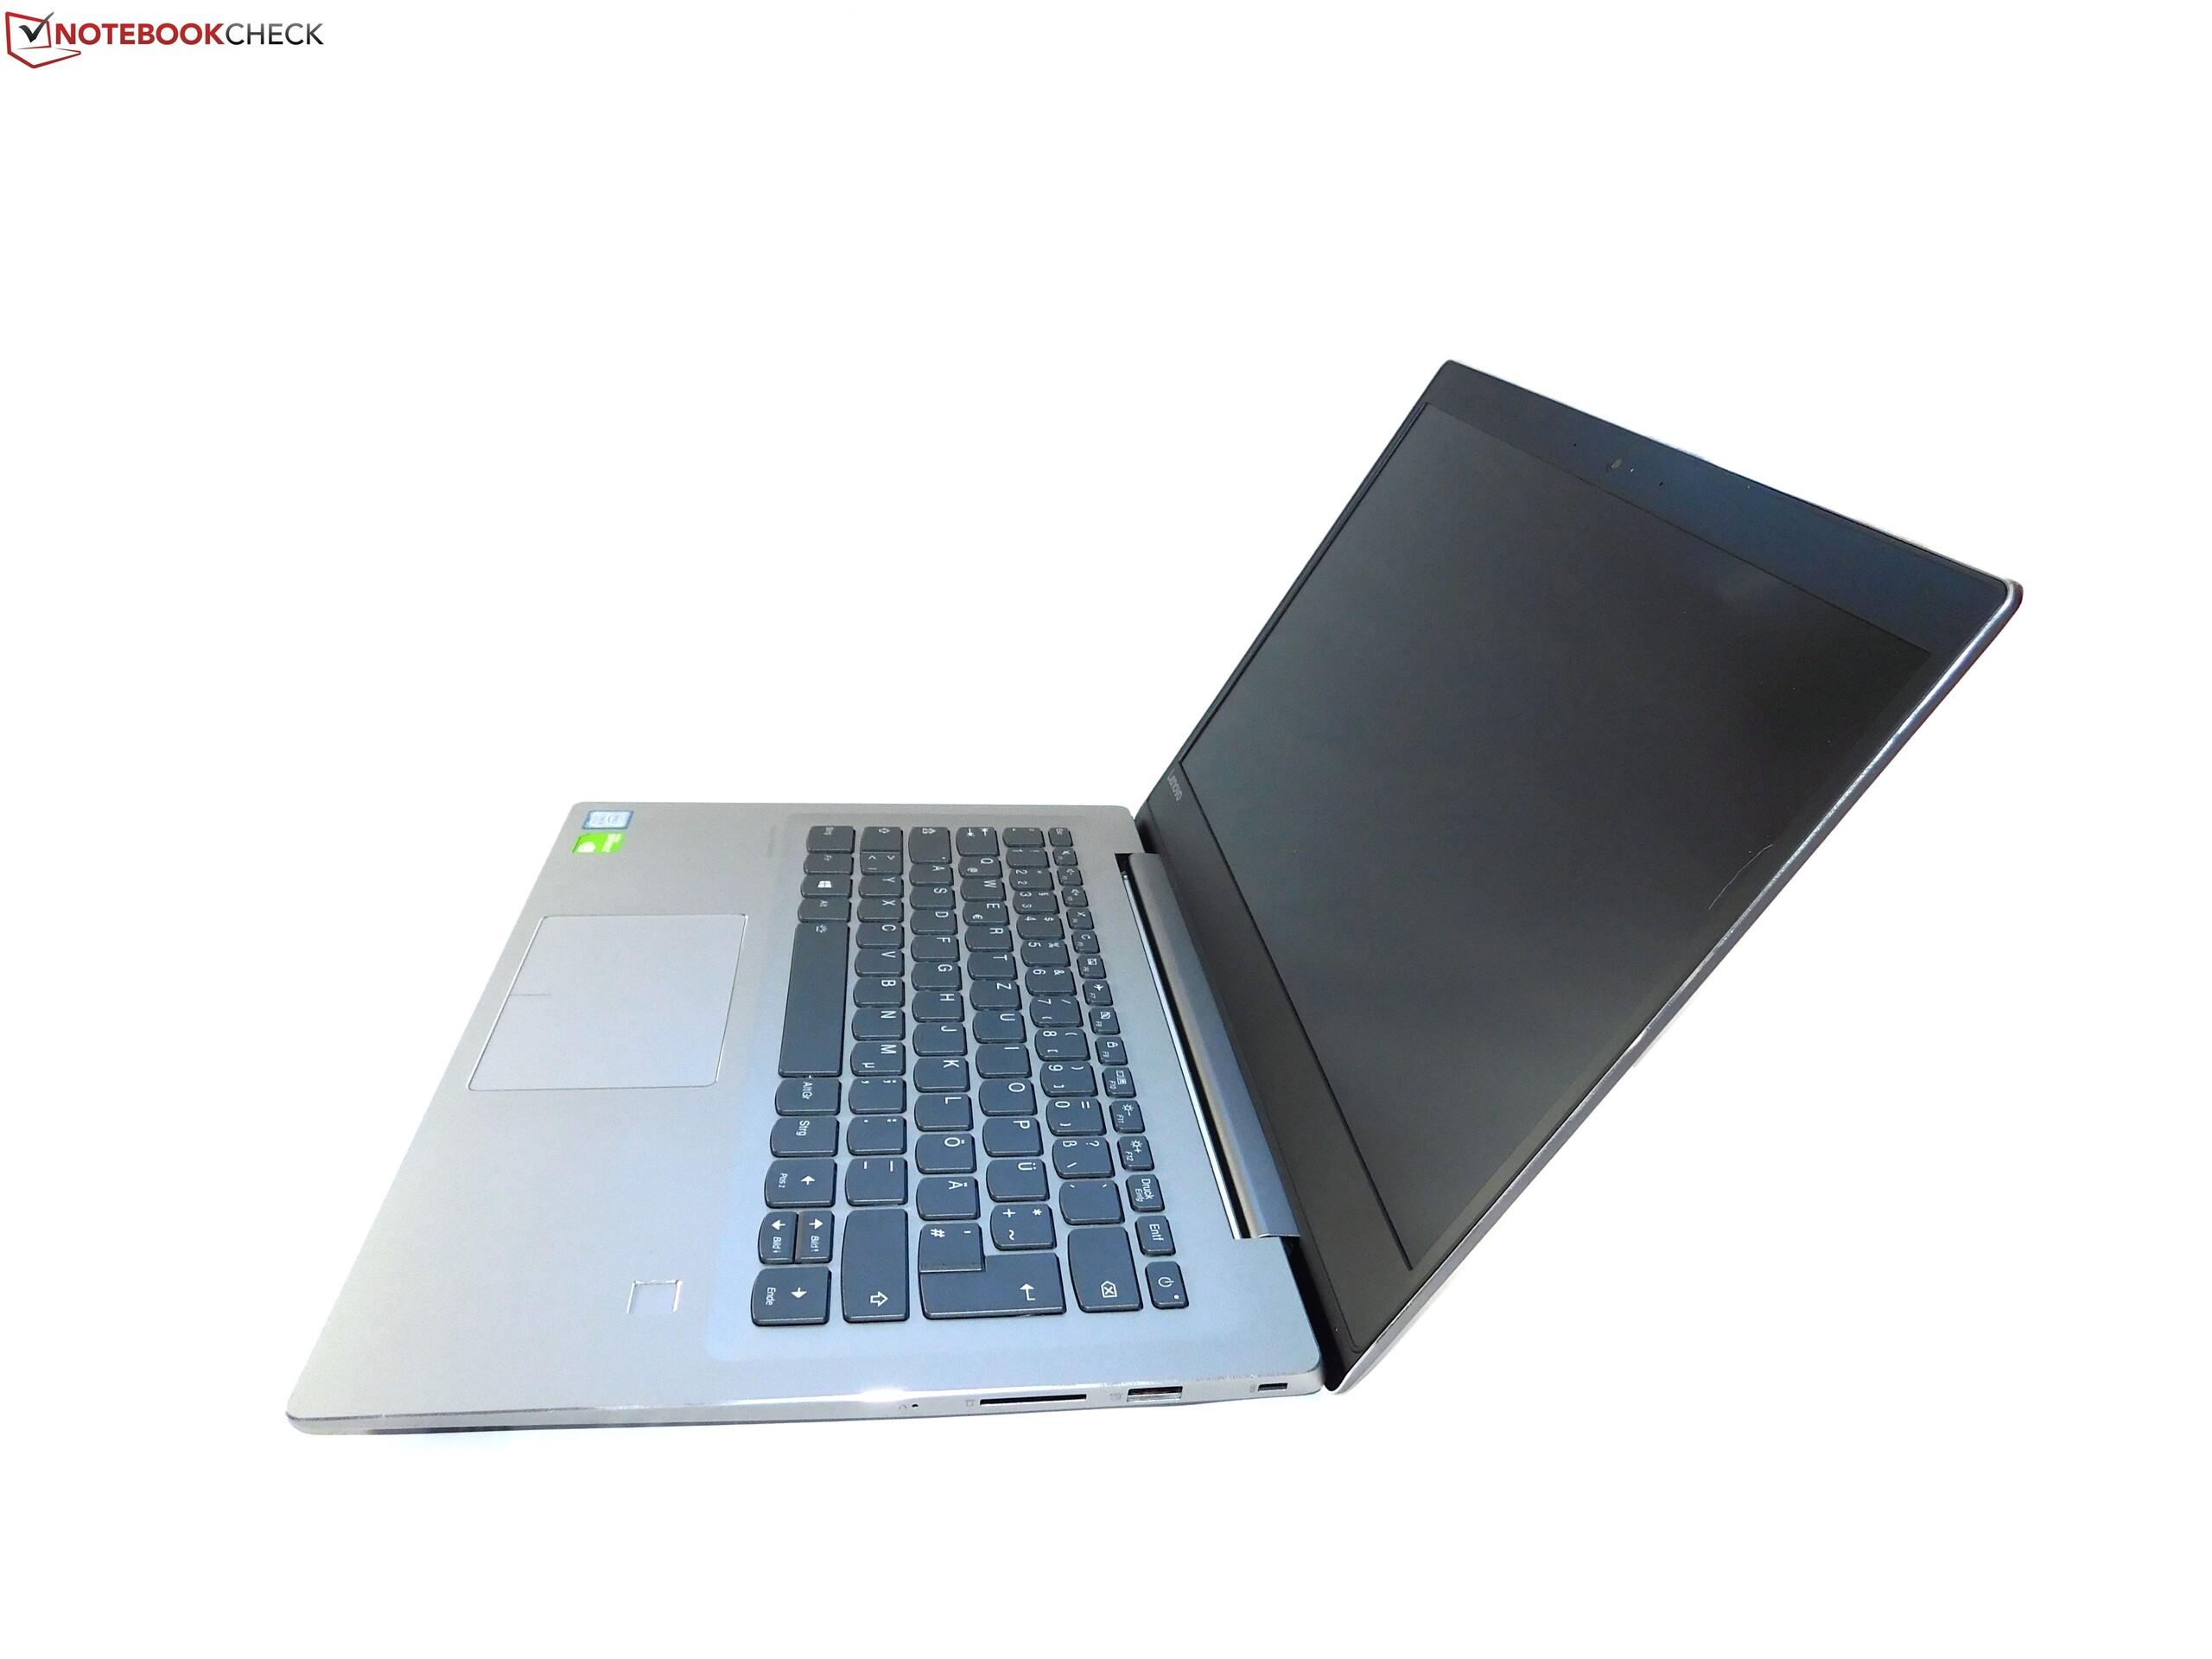
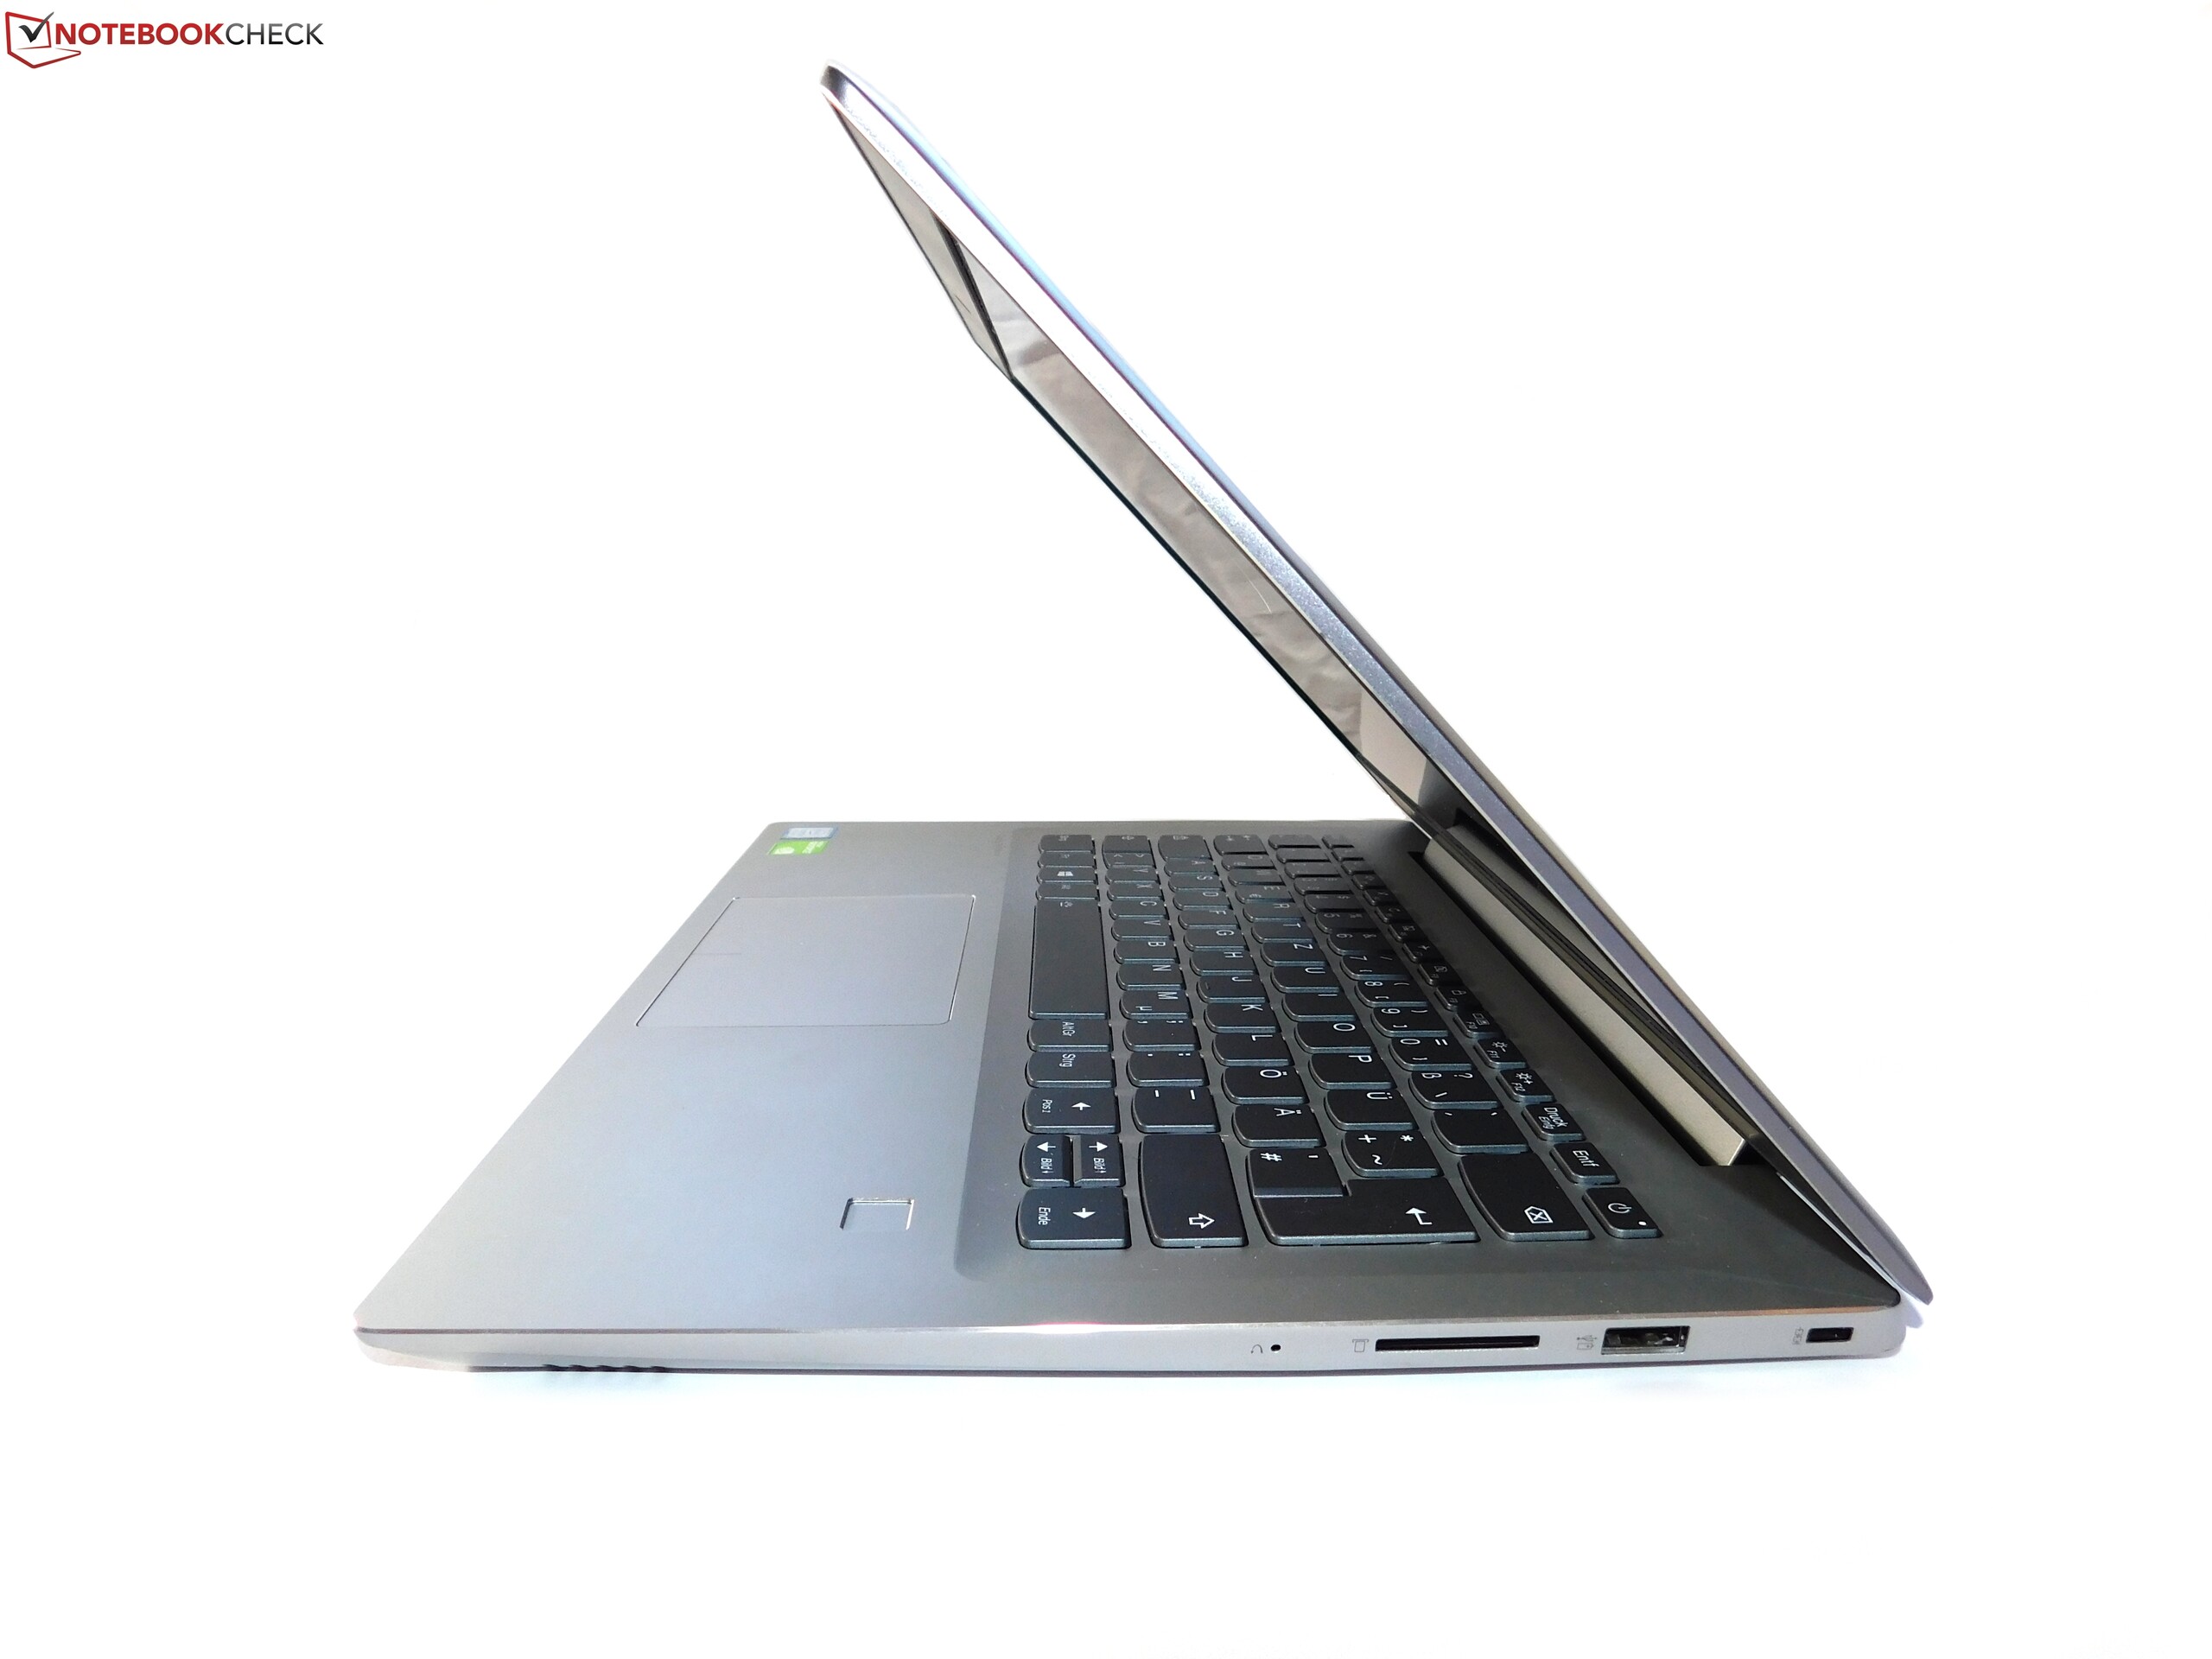
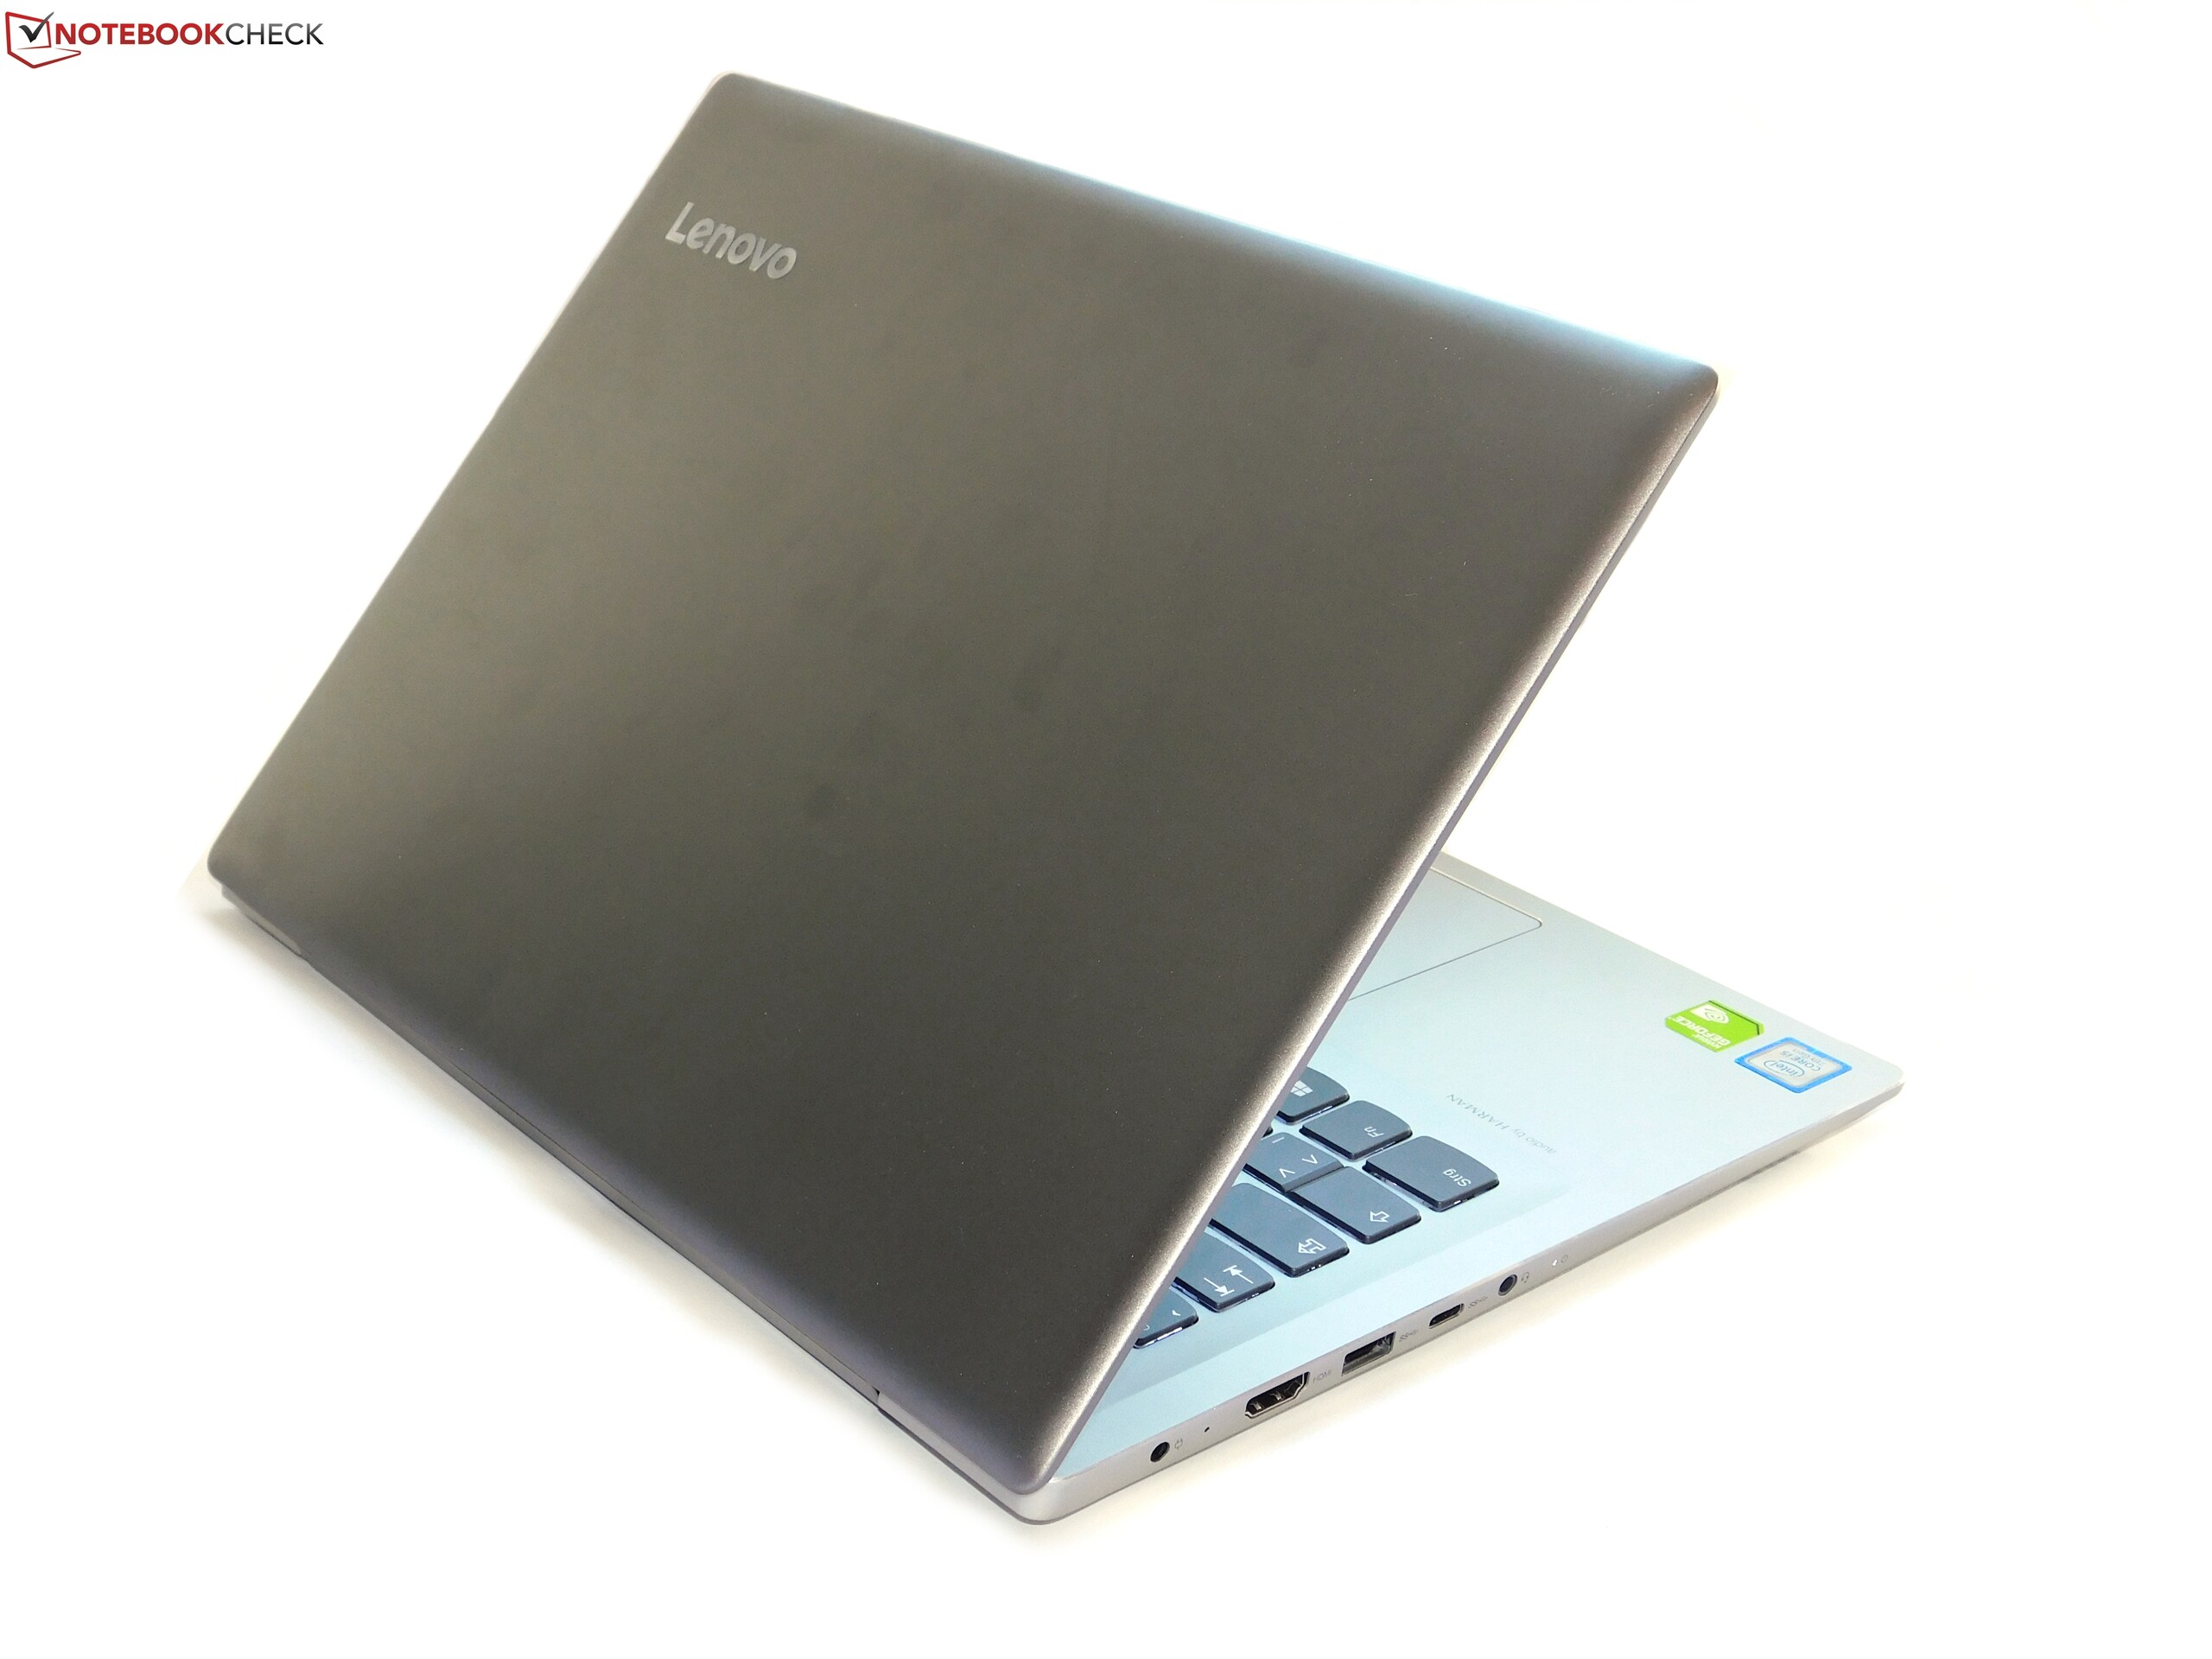
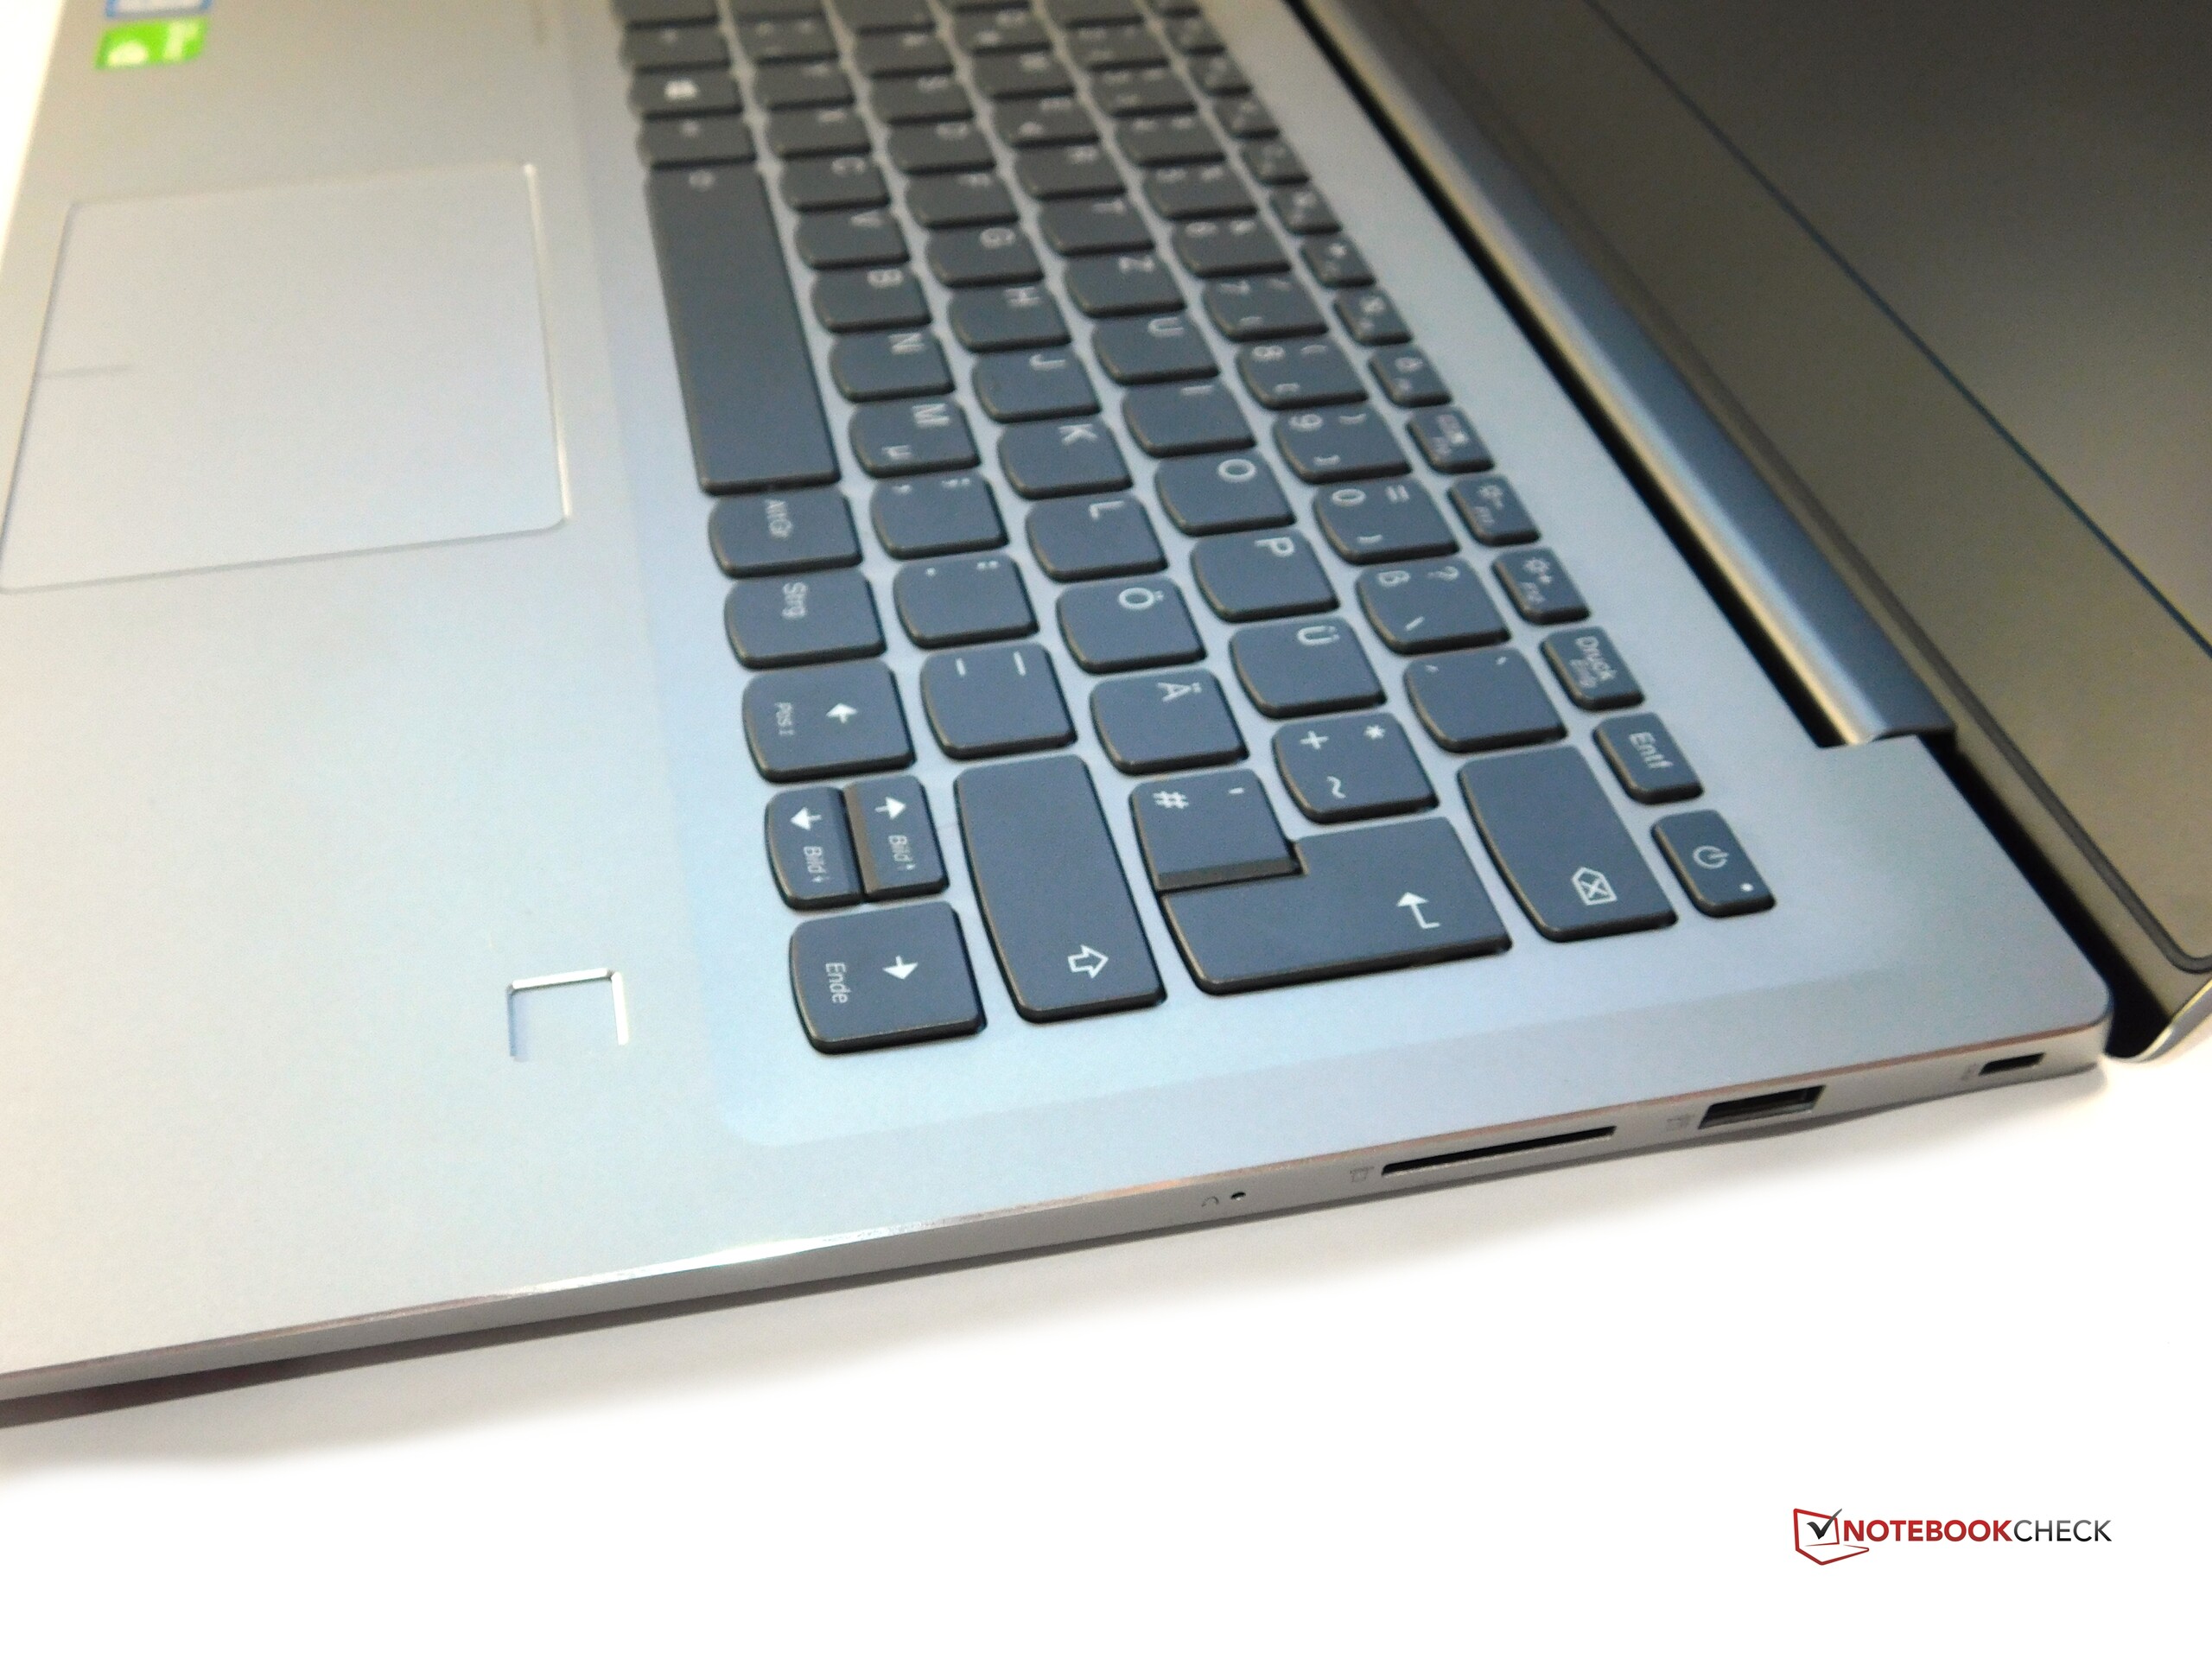
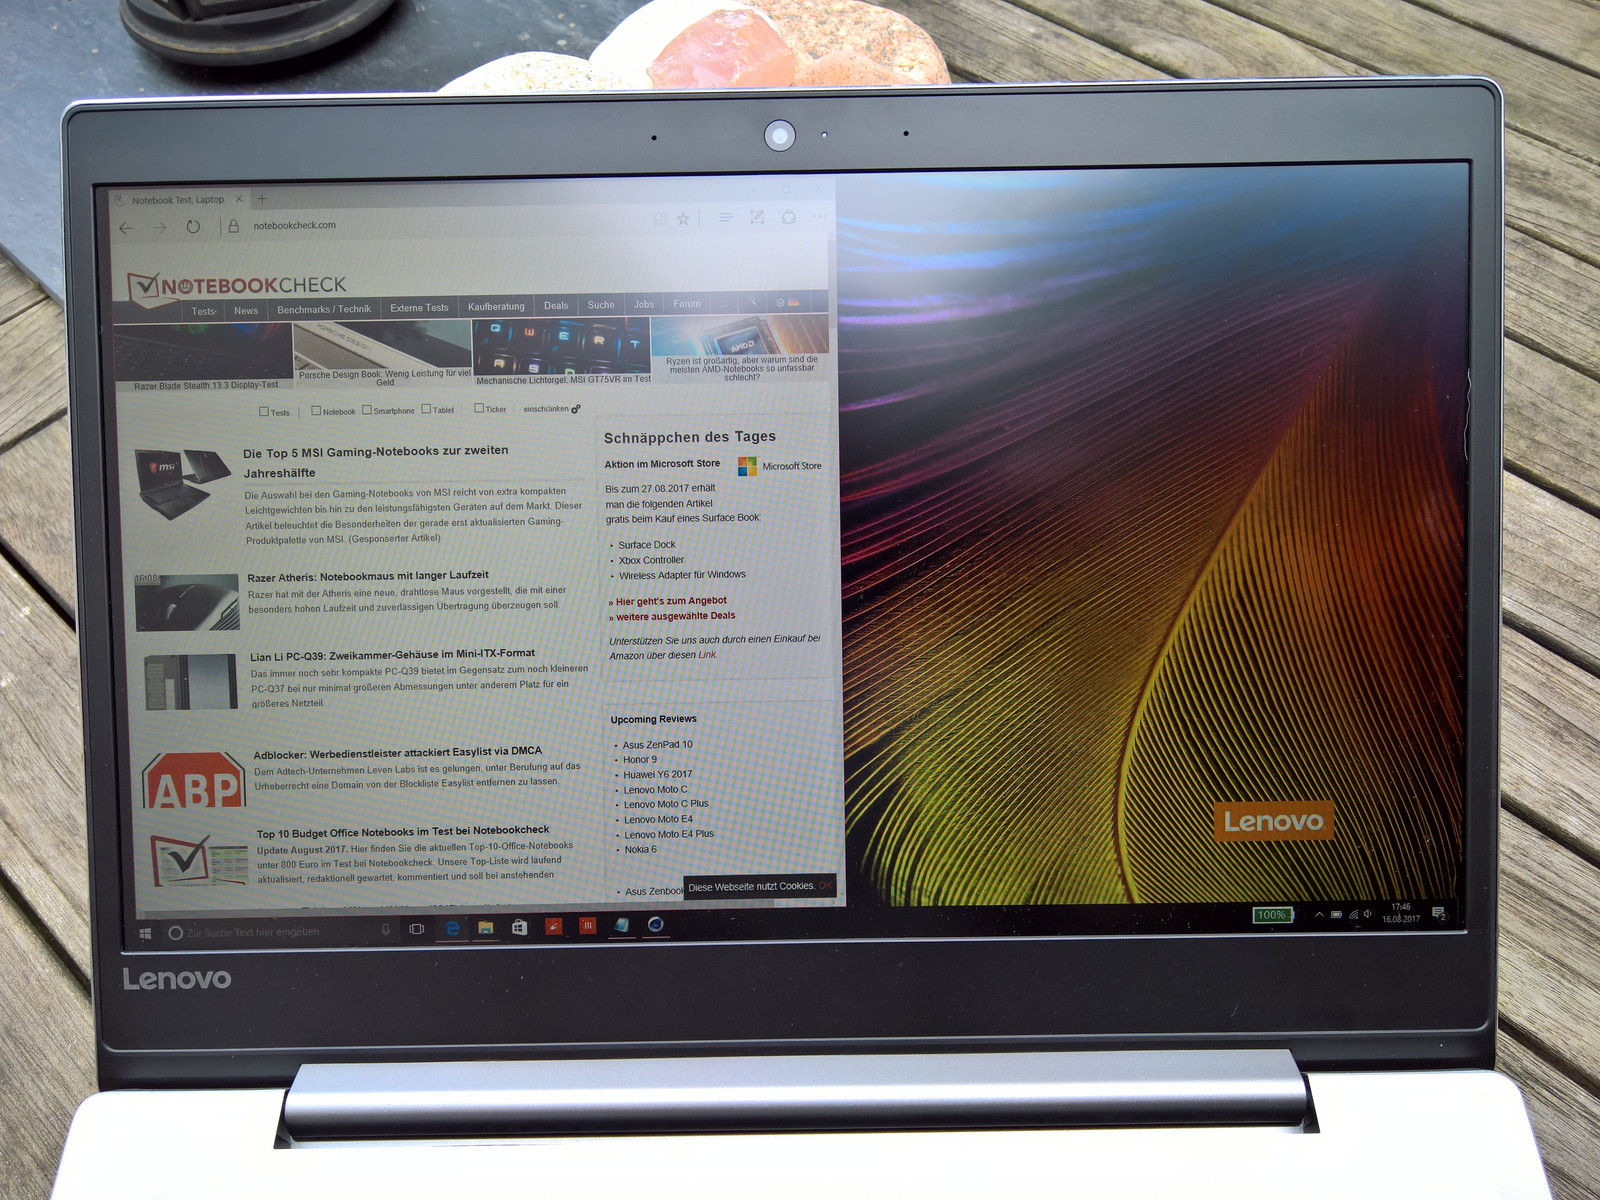
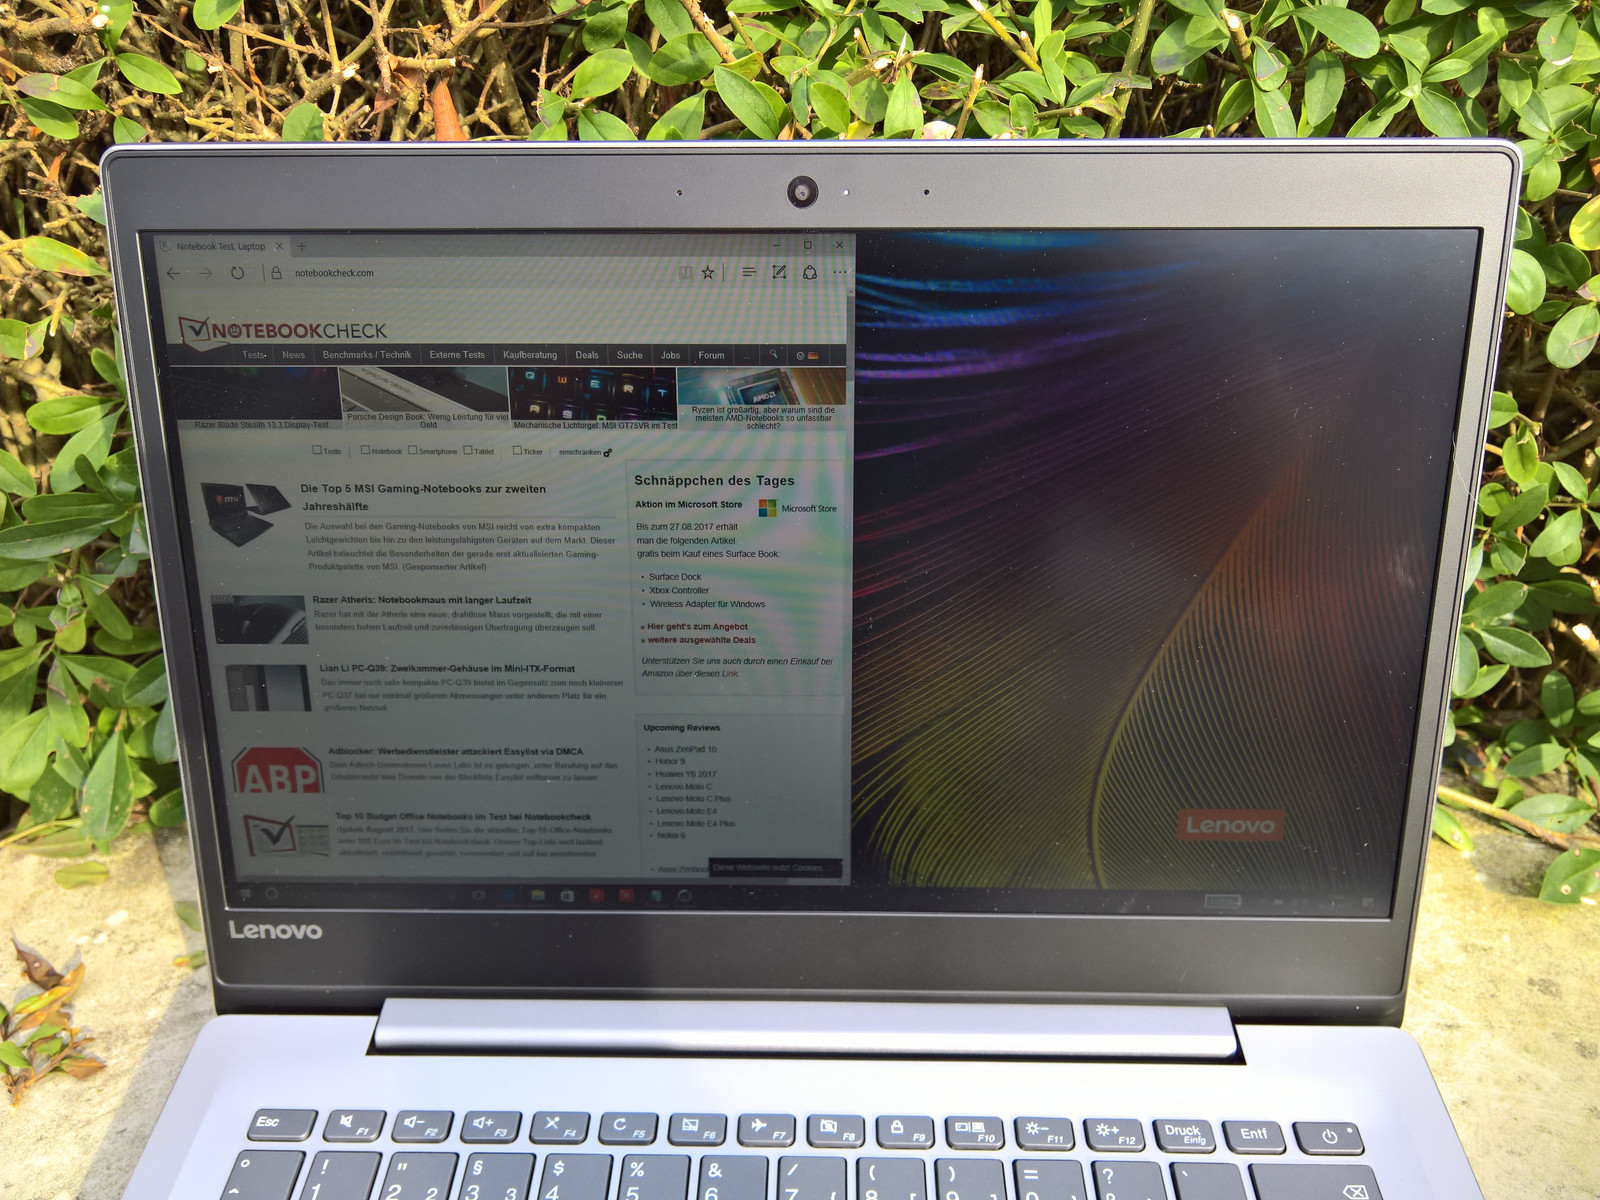
O IdeaPad 520s-14IKB é um bom pacote geral que faz muitas coisas, mas tem fraquezas em alguns detalhes. No entanto, essas fraquezas podem ser desculpadas em grande medida pelo preço. Primeiro o positivo: Em comparação com o antecessor, o design é mais atraente e a carcaça não mostra fraquezas em termos de estabilidade e acabamento. A boa estabilidade também ajuda com a experiência de digitação, de modo que você também pode contar o teclado com os aspectos positivos, e o Touchpad que está de acordo com o padrão Precision da Microsoft. A duração da bateria é muito boa e melhorou claramente em comparação com o antecessor, dado que a Lenovo colocou uma bateria maior. O ventilador é muitas vezes desligado e quando funciona, ele funciona com um zumbido agradável e silencioso. Mesmo que a tela esteja longe de ser perfeita (cobertura de espaço de cores baixa), ela ainda pode mostrar os bons ângulos de visualização típicos do IPS e um contraste surpreendentemente alto.
Em princípio, a Lenovo fez todas as coisas mais importantes. Porém, há pequenas deficiências em alguns detalhes: Por exemplo, a carcaça esquenta muito quando sob uso intenso. No geral, o resfriamento não é muito adequado. Embora seja silencioso, houve um forte afogamento no teste de estresse. Já no Cinebench loop, a CPU não consegue manter seu desempenho máximo. Ainda é incompreensível para nós que a conexão USB-C integrada não suporte o DisplayPort, nem possa ser usada para carregar. Que pena! Também é lamentável que a Lenovo apenas inclua uma placa WLAN 1x1.
No geral, o IdeaPad 520s é um bom poli funcional que convence com uma boa duração da bateria e um design atraente.
Os pontos negativos não são suficientes para conseguir uma recomendação para o IdeaPad 520s-14IKB. Simplesmente é um Ultrabook relativamente bem sucedido, que pode ser interessante para estudantes em particular, com boa duração da bateria, a dGPU e o teclado confortável. Se o comparar, por exemplo, com o popular Dell XPS 13, o IdeaPad é maior e mais pesado, mas ainda é muito portável e quase adequado para jogos com a GPU GeForce. Também é muito mais barato.
Precisamos mencionar um pequeno qualificador para a recomendação, dado que, no momento do teste, o IdeaPad 520s-14IKB já está desatualizado. Uma nova versão do mesmo portátil com Core i5-8250U e GeForce MX150 seria muito mais atraente. No entanto, também precisamos perguntar o quão bem o resfriamento poderia lidar com os componentes mais novos.
Lenovo IdeaPad 520s-14IKB 80X200C1GE
- 09/05/2017 v6 (old)
Benjamin Herzig