Breve Análise do Portátil Acer Aspire 5 A515-51G (7200U, MX150, FHD)
| SD Card Reader | |
| average JPG Copy Test (av. of 3 runs) | |
| Acer Aspire 5 A515-51G-51RL (Toshiba Exceria Pro SDXC 64 GB UHS-II) | |
| HP Pavilion 15t-au100 CTO (W0P31AV) (Toshiba Exceria Pro SDXC 64 GB UHS-II) | |
| Lenovo IdeaPad 510-15IKB 80SV0087GE (Toshiba Exceria Pro SDXC 64 GB UHS-II) | |
| Acer Aspire E5-575G-549D (Toshiba Exceria Pro SDXC 64 GB UHS-II) | |
| Medion Erazer P6661 MD 99873 | |
| Dell Inspiron 15 5000 5567-1753 (Toshiba Exceria Pro SDXC 64 GB UHS-II) | |
| maximum AS SSD Seq Read Test (1GB) | |
| HP Pavilion 15t-au100 CTO (W0P31AV) (Toshiba Exceria Pro SDXC 64 GB UHS-II) | |
| Acer Aspire 5 A515-51G-51RL (Toshiba Exceria Pro SDXC 64 GB UHS-II) | |
| Acer Aspire E5-575G-549D (Toshiba Exceria Pro SDXC 64 GB UHS-II) | |
| Medion Erazer P6661 MD 99873 | |
| Dell Inspiron 15 5000 5567-1753 (Toshiba Exceria Pro SDXC 64 GB UHS-II) | |
| Lenovo IdeaPad 510-15IKB 80SV0087GE (Toshiba Exceria Pro SDXC 64 GB UHS-II) | |
| Networking | |
| iperf3 transmit AX12 | |
| Acer Aspire 5 A515-51G-51RL | |
| Dell Inspiron 15 5000 5567-1753 | |
| HP Pavilion 15t-au100 CTO (W0P31AV) | |
| iperf3 receive AX12 | |
| Dell Inspiron 15 5000 5567-1753 | |
| Acer Aspire 5 A515-51G-51RL | |
| HP Pavilion 15t-au100 CTO (W0P31AV) | |
| |||||||||||||||||||||||||
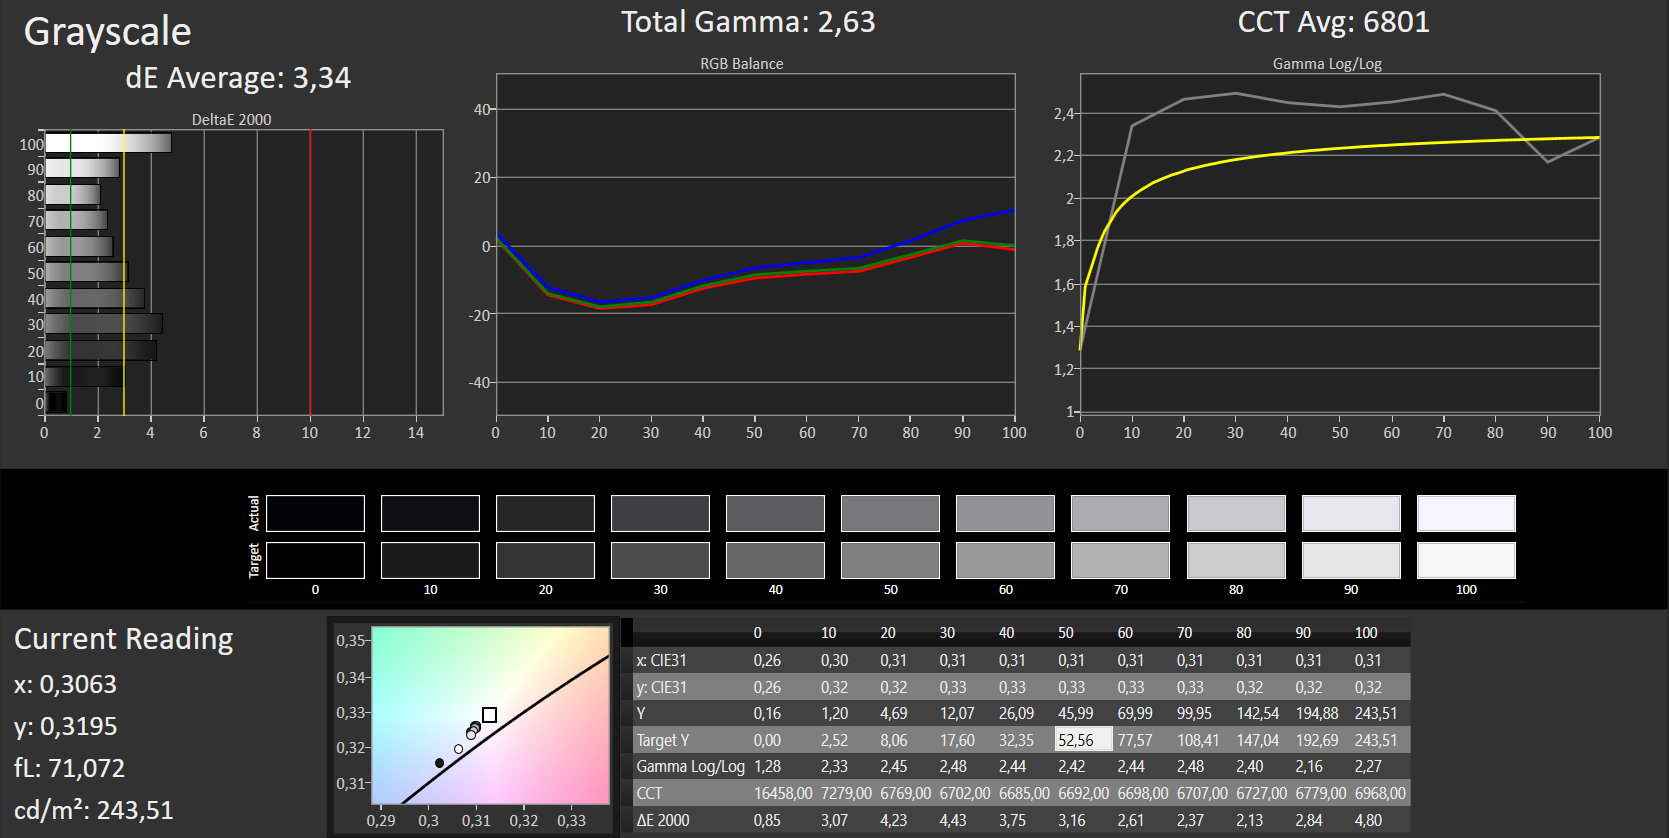
iluminação: 80 %
iluminação com acumulador: 235 cd/m²
Contraste: 1382:1 (Preto: 0.17 cd/m²)
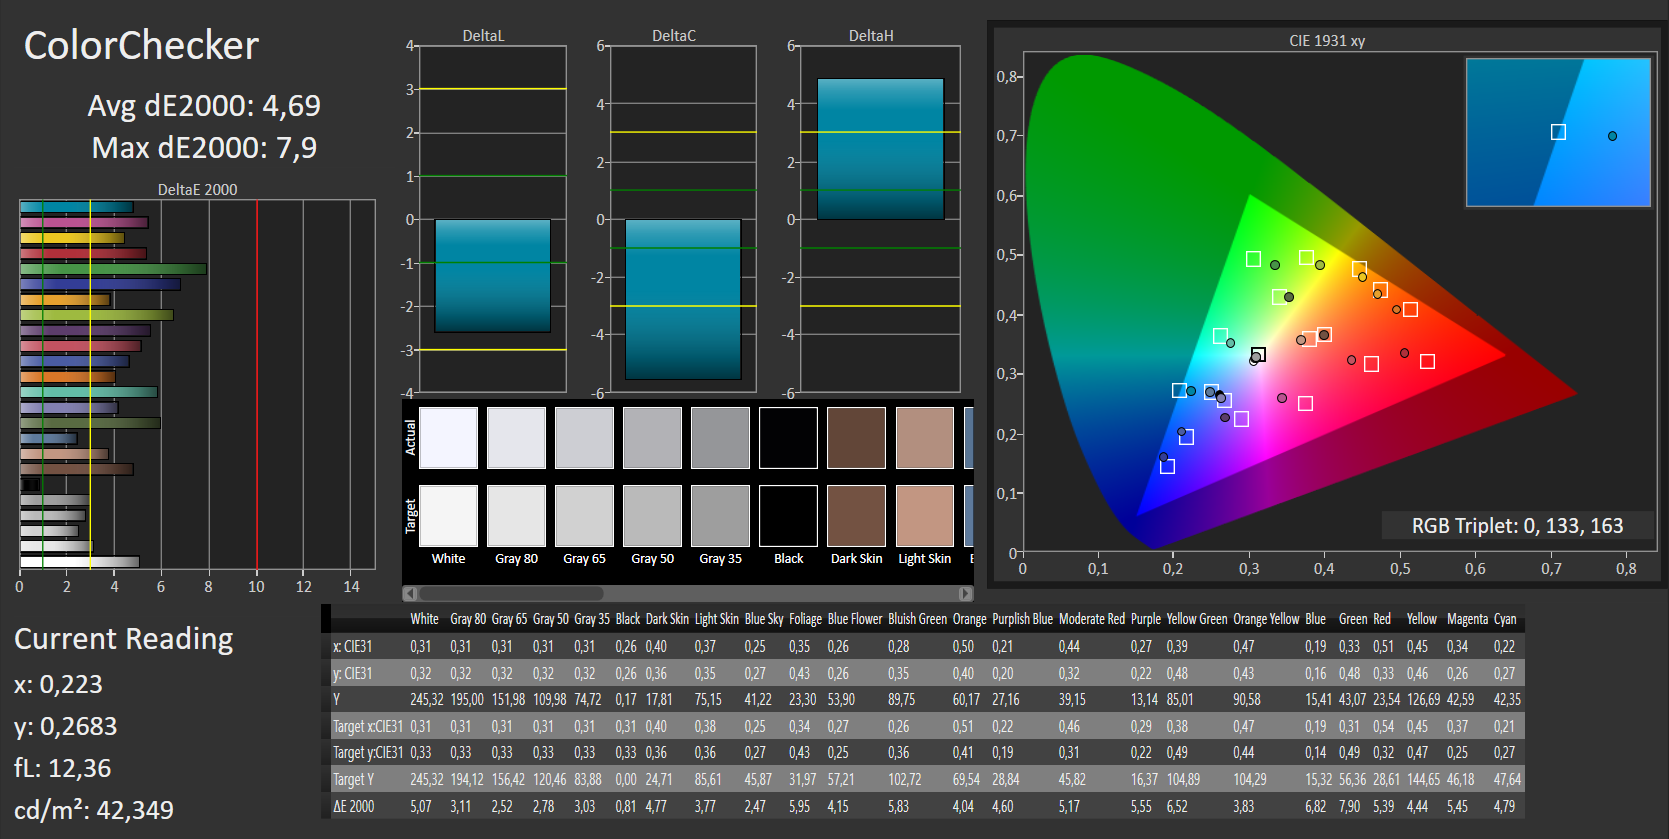
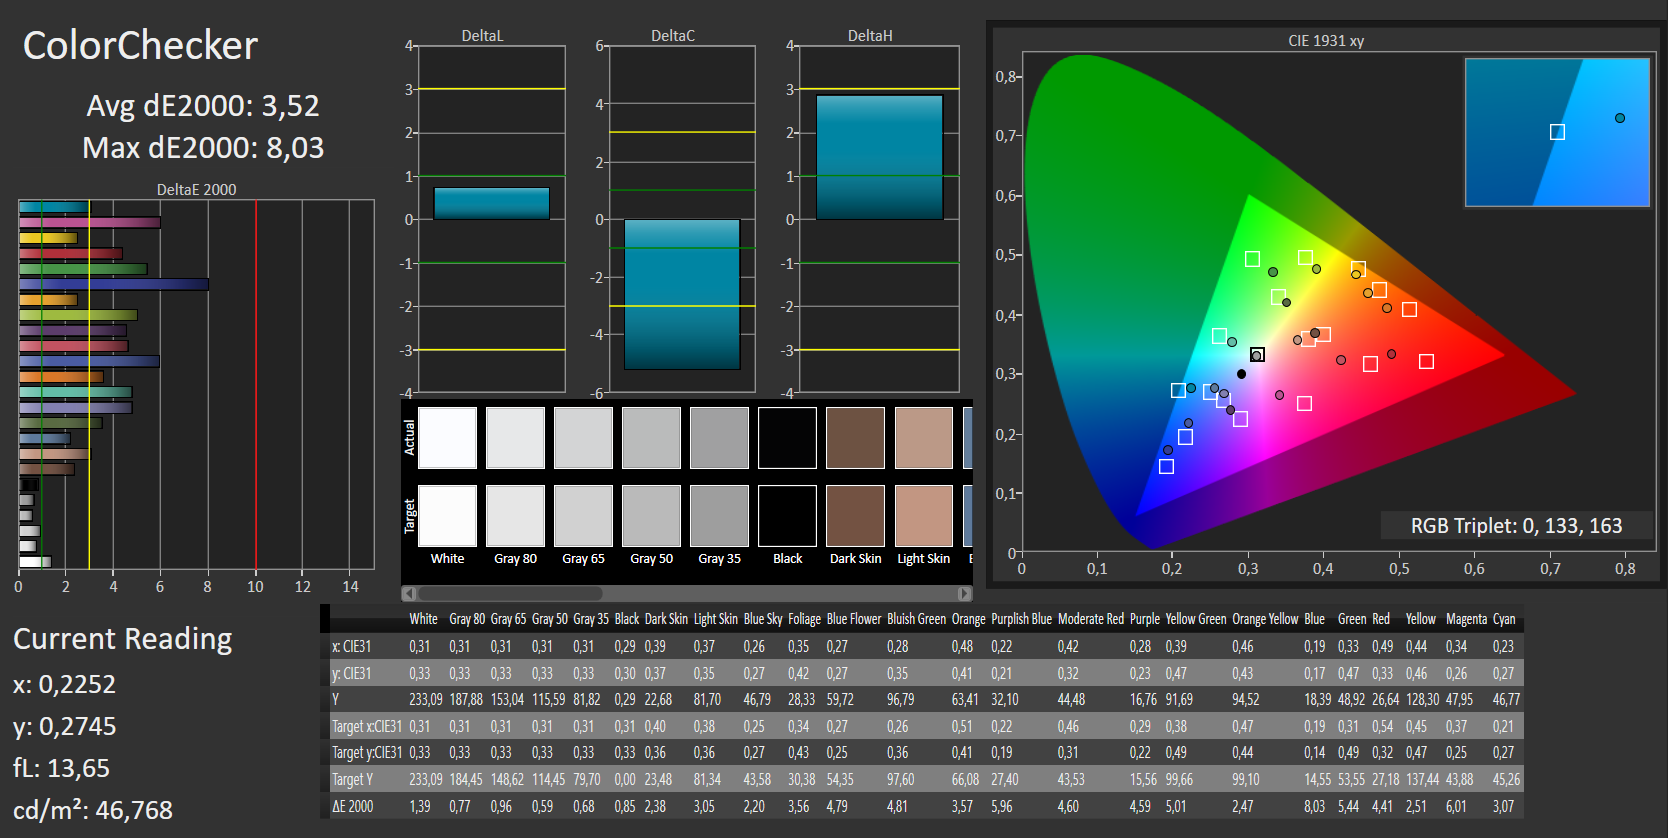
ΔE ColorChecker Calman: 4.69 | ∀{0.5-29.43 Ø4.71}
ΔE Greyscale Calman: 3.34 | ∀{0.09-98 Ø4.96}
57% sRGB (Argyll 1.6.3 3D)
36% AdobeRGB 1998 (Argyll 1.6.3 3D)
39.57% AdobeRGB 1998 (Argyll 3D)
57.6% sRGB (Argyll 3D)
38.3% Display P3 (Argyll 3D)
Gamma: 2.63
CCT: 6801 K
| Acer Aspire 5 A515-51G-51RL IPS, 1920x1080, 15.6" | Lenovo IdeaPad 510-15IKB 80SV0087GE IPS, 1920x1080, 15.6" | Acer Aspire E5-575G-549D TN, 1920x1080, 15.6" | Medion Erazer P6661 MD 99873 AH-IPS, WLED, 1920x1080, 15.6" | Dell Inspiron 15 5000 5567-1753 TN LED, 1920x1080, 15.6" | HP Pavilion 15t-au100 CTO (W0P31AV) IPS, 1920x1080, 15.6" | |
|---|---|---|---|---|---|---|
| Display | 11% | 1% | 3% | -5% | 13% | |
| Display P3 Coverage (%) | 38.3 | 42.66 11% | 38.57 1% | 39.48 3% | 36.24 -5% | 43.27 13% |
| sRGB Coverage (%) | 57.6 | 64.1 11% | 57.4 0% | 59 2% | 54.6 -5% | 64.9 13% |
| AdobeRGB 1998 Coverage (%) | 39.57 | 44.08 11% | 39.89 1% | 40.81 3% | 37.44 -5% | 44.71 13% |
| Response Times | -35% | 7% | 10% | 21% | -16% | |
| Response Time Grey 50% / Grey 80% * (ms) | 41 ? | 51 ? -24% | 39 ? 5% | 36 ? 12% | 43 ? -5% | 42 ? -2% |
| Response Time Black / White * (ms) | 26 ? | 38 ? -46% | 24 ? 8% | 24 ? 8% | 14 ? 46% | 33.6 ? -29% |
| PWM Frequency (Hz) | 50 ? | 50 ? | 198.4 | |||
| Screen | -0% | -62% | -49% | -82% | -29% | |
| Brightness middle (cd/m²) | 235 | 291 24% | 176 -25% | 291 24% | 145 -38% | 186.5 -21% |
| Brightness (cd/m²) | 236 | 265 12% | 169 -28% | 270 14% | 144 -39% | 174 -26% |
| Brightness Distribution (%) | 80 | 86 8% | 91 14% | 85 6% | 90 13% | 69 -14% |
| Black Level * (cd/m²) | 0.17 | 0.23 -35% | 0.47 -176% | 0.38 -124% | 0.49 -188% | 0.18 -6% |
| Contrast (:1) | 1382 | 1265 -8% | 374 -73% | 766 -45% | 296 -79% | 1036 -25% |
| Colorchecker dE 2000 * | 4.69 | 4.78 -2% | 8.83 -88% | 8.6 -83% | 9.27 -98% | 5.7 -22% |
| Colorchecker dE 2000 max. * | 7.9 | 9.51 -20% | 14.01 -77% | 17.39 -120% | 16.9 -114% | 22.5 -185% |
| Greyscale dE 2000 * | 3.34 | 3.49 -4% | 8.97 -169% | 8.5 -154% | 12.28 -268% | 4.4 -32% |
| Gamma | 2.63 84% | 2.58 85% | 2.43 91% | 2.31 95% | 2.03 108% | 2.35 94% |
| CCT | 6801 96% | 6013 108% | 10234 64% | 6184 105% | 10732 61% | 6963 93% |
| Color Space (Percent of AdobeRGB 1998) (%) | 36 | 40 11% | 36.8 2% | 32 -11% | 35 -3% | 44.71 24% |
| Color Space (Percent of sRGB) (%) | 57 | 64 12% | 57.3 1% | 59 4% | 55 -4% | 64.95 14% |
| Média Total (Programa/Configurações) | -8% /
-3% | -18% /
-40% | -12% /
-31% | -22% /
-53% | -11% /
-19% |
* ... menor é melhor
Cintilação da tela / PWM (modulação por largura de pulso)
| Tela tremeluzindo / PWM não detectado | ||
[pwm_comparison] Em comparação: 52 % de todos os dispositivos testados não usam PWM para escurecer a tela. Se PWM foi detectado, uma média de 7754 (mínimo: 5 - máximo: 343500) Hz foi medida. | ||

Exibir tempos de resposta
| ↔ Tempo de resposta preto para branco | ||
|---|---|---|
| 26 ms ... ascensão ↗ e queda ↘ combinadas | ↗ 15 ms ascensão | 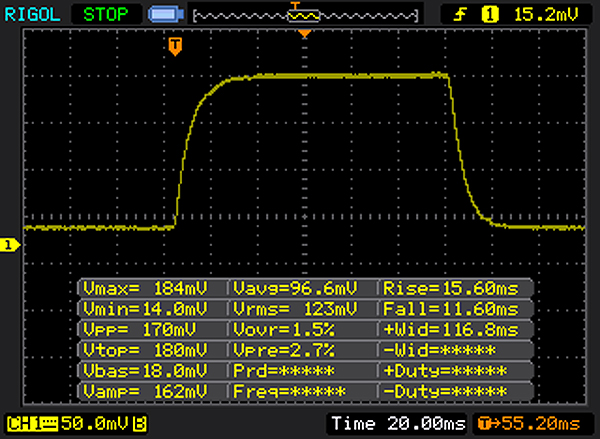 |
| ↘ 11 ms queda | ||
| A tela mostra taxas de resposta relativamente lentas em nossos testes e pode ser muito lenta para os jogadores. Em comparação, todos os dispositivos testados variam de 0.1 (mínimo) a 240 (máximo) ms. » 63 % de todos os dispositivos são melhores. Isso significa que o tempo de resposta medido é pior que a média de todos os dispositivos testados (19.8 ms). | ||
| ↔ Tempo de resposta 50% cinza a 80% cinza | ||
| 41 ms ... ascensão ↗ e queda ↘ combinadas | ↗ 18 ms ascensão | 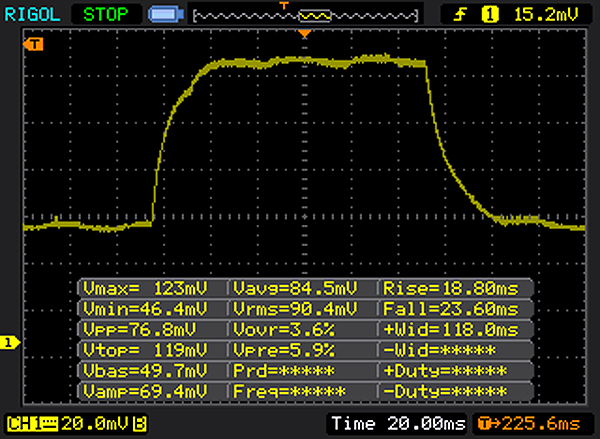 |
| ↘ 23 ms queda | ||
| A tela mostra taxas de resposta lentas em nossos testes e será insatisfatória para os jogadores. Em comparação, todos os dispositivos testados variam de 0.165 (mínimo) a 636 (máximo) ms. » 65 % de todos os dispositivos são melhores. Isso significa que o tempo de resposta medido é pior que a média de todos os dispositivos testados (31 ms). | ||
| Cinebench R15 | |
| CPU Single 64Bit | |
| HP Pavilion Power 15t-cb2000 | |
| Lenovo IdeaPad 510-15IKB 80SV0087GE | |
| Acer Aspire VX15 VX5-591G-589S | |
| Dell Inspiron 15 5000 5567-1753 | |
| HP Pavilion 15t-au100 CTO (W0P31AV) | |
| Medion Erazer P6661 MD 99873 | |
| Acer Aspire E5-575G-549D | |
| Acer Aspire 5 A515-51G-51RL | |
| CPU Multi 64Bit | |
| HP Pavilion Power 15t-cb2000 | |
| Acer Aspire VX15 VX5-591G-589S | |
| HP Pavilion 15t-au100 CTO (W0P31AV) | |
| Lenovo IdeaPad 510-15IKB 80SV0087GE | |
| Dell Inspiron 15 5000 5567-1753 | |
| Acer Aspire E5-575G-549D | |
| Acer Aspire 5 A515-51G-51RL | |
| Medion Erazer P6661 MD 99873 | |
| Cinebench R10 | |
| Rendering Multiple CPUs 32Bit | |
| Acer Aspire VX15 VX5-591G-589S | |
| Dell Inspiron 15 5000 5567-1753 | |
| HP Pavilion 15t-au100 CTO (W0P31AV) | |
| Acer Aspire E5-575G-549D | |
| Acer Aspire 5 A515-51G-51RL | |
| Lenovo IdeaPad 510-15IKB 80SV0087GE | |
| Medion Erazer P6661 MD 99873 | |
| Rendering Single 32Bit | |
| Lenovo IdeaPad 510-15IKB 80SV0087GE | |
| HP Pavilion 15t-au100 CTO (W0P31AV) | |
| Dell Inspiron 15 5000 5567-1753 | |
| Acer Aspire VX15 VX5-591G-589S | |
| Acer Aspire E5-575G-549D | |
| Acer Aspire 5 A515-51G-51RL | |
| Medion Erazer P6661 MD 99873 | |
| Geekbench 3 | |
| 32 Bit Multi-Core Score | |
| Acer Aspire VX15 VX5-591G-589S | |
| Lenovo IdeaPad 510-15IKB 80SV0087GE | |
| Acer Aspire 5 A515-51G-51RL | |
| Acer Aspire E5-575G-549D | |
| 32 Bit Single-Core Score | |
| Lenovo IdeaPad 510-15IKB 80SV0087GE | |
| Acer Aspire VX15 VX5-591G-589S | |
| Acer Aspire 5 A515-51G-51RL | |
| Acer Aspire E5-575G-549D | |
| Geekbench 4.0 | |
| 64 Bit Multi-Core Score | |
| Lenovo IdeaPad 510-15IKB 80SV0087GE | |
| Acer Aspire VX15 VX5-591G-589S | |
| Acer Aspire 5 A515-51G-51RL | |
| Acer Aspire E5-575G-549D | |
| 64 Bit Single-Core Score | |
| Lenovo IdeaPad 510-15IKB 80SV0087GE | |
| Acer Aspire 5 A515-51G-51RL | |
| Acer Aspire E5-575G-549D | |
| Acer Aspire VX15 VX5-591G-589S | |
| Geekbench 4.4 | |
| 64 Bit Multi-Core Score | |
| Acer Aspire VX15 VX5-591G-589S | |
| Acer Aspire 5 A515-51G-51RL | |
| 64 Bit Single-Core Score | |
| Acer Aspire 5 A515-51G-51RL | |
| Acer Aspire VX15 VX5-591G-589S | |
| JetStream 1.1 - 1.1 Total | |
| HP Pavilion Power 15t-cb2000 | |
| Acer Aspire VX15 VX5-591G-589S | |
| Lenovo IdeaPad 510-15IKB 80SV0087GE | |
| HP Pavilion 15t-au100 CTO (W0P31AV) | |
| Dell Inspiron 15 5000 5567-1753 | |
| Acer Aspire E5-575G-549D | |
| Acer Aspire 5 A515-51G-51RL | |
| Medion Erazer P6661 MD 99873 | |
| PCMark 7 Score | 5413 pontos | |
| PCMark 8 Home Score Accelerated v2 | 3650 pontos | |
| PCMark 8 Creative Score Accelerated v2 | 4443 pontos | |
| PCMark 8 Work Score Accelerated v2 | 4590 pontos | |
| PCMark 10 Score | 3075 pontos | |
Ajuda | ||
| PCMark 8 | |
| Home Score Accelerated v2 | |
| Dell Inspiron 15 5000 5567-1753 | |
| Lenovo IdeaPad 510-15IKB 80SV0087GE | |
| Acer Aspire 5 A515-51G-51RL | |
| HP Pavilion 15t-au100 CTO (W0P31AV) | |
| Medion Erazer P6661 MD 99873 | |
| Acer Aspire E5-575G-549D | |
| Work Score Accelerated v2 | |
| Dell Inspiron 15 5000 5567-1753 | |
| Acer Aspire 5 A515-51G-51RL | |
| Medion Erazer P6661 MD 99873 | |
| HP Pavilion 15t-au100 CTO (W0P31AV) | |
| Acer Aspire E5-575G-549D | |
| PCMark 10 - Score | |
| Acer Aspire 5 A515-51G-51RL | |

| Acer Aspire 5 A515-51G-51RL Kingston RBUSNS8180DS3128GH | Lenovo IdeaPad 510-15IKB 80SV0087GE Liteonit CV3-DE256 | Acer Aspire E5-575G-549D Toshiba MQ01ABD100 | Medion Erazer P6661 MD 99873 Phison 128GB PS3109-S9 | Dell Inspiron 15 5000 5567-1753 SanDisk X400 SED 256GB, SATA (SD8TB8U-256G) | HP Pavilion 15t-au100 CTO (W0P31AV) Toshiba MQ01ABD100 | |
|---|---|---|---|---|---|---|
| CrystalDiskMark 3.0 | 74% | -87% | -16% | 88% | -83% | |
| Read Seq (MB/s) | 407.5 | 469.2 15% | 95.3 -77% | 433.2 6% | 502 23% | 109.5 -73% |
| Write Seq (MB/s) | 283.5 | 431.5 52% | 85.6 -70% | 131.9 -53% | 458.1 62% | 105.2 -63% |
| Read 512 (MB/s) | 282.4 | 338.3 20% | 29.32 -90% | 250 -11% | 382.8 36% | 34.08 -88% |
| Write 512 (MB/s) | 72.7 | 297.9 310% | 25.93 -64% | 90.6 25% | 385.7 431% | 40.02 -45% |
| Read 4k (MB/s) | 26.81 | 28.68 7% | 0.366 -99% | 30.69 14% | 29.25 9% | 0.429 -98% |
| Write 4k (MB/s) | 73.7 | 66.8 -9% | 0.726 -99% | 51.2 -31% | 55.9 -24% | 1.008 -99% |
| Read 4k QD32 (MB/s) | 294.8 | 364.7 24% | 0.647 -100% | 112.2 -62% | 285.2 -3% | 0.81 -100% |
| Write 4k QD32 (MB/s) | 89.6 | 245.9 174% | 0.722 -99% | 73.2 -18% | 239.6 167% | 0.893 -99% |
| 3DMark 06 Standard Score | 19415 pontos | |
| 3DMark Vantage P Result | 14144 pontos | |
| 3DMark 11 Performance | 4506 pontos | |
| 3DMark Ice Storm Standard Score | 51765 pontos | |
| 3DMark Cloud Gate Standard Score | 9837 pontos | |
| 3DMark Fire Strike Score | 3114 pontos | |
| 3DMark Fire Strike Extreme Score | 1637 pontos | |
| 3DMark Time Spy Score | 1124 pontos | |
Ajuda | ||
| 3DMark 11 - 1280x720 Performance GPU | |
| Apple MacBook Pro 15 2016 (2.7 GHz, 455) | |
| MSI PL62 MX150 7700HQ | |
| Acer Aspire 5 A515-51G-51RL | |
| Apple MacBook Pro 15 2016 (2.6 GHz, 450) | |
| Medion Erazer P6661 MD 99873 | |
| Acer Aspire E5-575G-549D | |
| HP Pavilion 15t-au100 CTO (W0P31AV) | |
| Lenovo IdeaPad 510-15IKB 80SV0087GE | |
| Dell Inspiron 15 5000 5567-1753 | |
| 3DMark | |
| 1280x720 Cloud Gate Standard Graphics | |
| Apple MacBook Pro 15 2016 (2.7 GHz, 455) | |
| Acer Aspire E5-575G-549D | |
| MSI PL62 MX150 7700HQ | |
| Apple MacBook Pro 15 2016 (2.6 GHz, 450) | |
| Medion Erazer P6661 MD 99873 | |
| Acer Aspire 5 A515-51G-51RL | |
| Dell Inspiron 15 5000 5567-1753 | |
| HP Pavilion 15t-au100 CTO (W0P31AV) | |
| 1920x1080 Fire Strike Graphics | |
| Apple MacBook Pro 15 2016 (2.7 GHz, 455) | |
| MSI PL62 MX150 7700HQ | |
| Acer Aspire 5 A515-51G-51RL | |
| Acer Aspire E5-575G-549D | |
| Apple MacBook Pro 15 2016 (2.6 GHz, 450) | |
| Medion Erazer P6661 MD 99873 | |
| HP Pavilion 15t-au100 CTO (W0P31AV) | |
| Dell Inspiron 15 5000 5567-1753 | |
| GFXBench (DX / GLBenchmark) 2.7 | |
| 1920x1080 T-Rex Offscreen | |
| Acer Aspire 5 A515-51G-51RL | |
| Apple MacBook Pro 15 2016 (2.7 GHz, 455) | |
| T-Rex Onscreen | |
| Acer Aspire 5 A515-51G-51RL | |
| Apple MacBook Pro 15 2016 (2.7 GHz, 455) | |
| GFXBench 3.0 | |
| 1920x1080 1080p Manhattan Offscreen | |
| Acer Aspire 5 A515-51G-51RL | |
| Apple MacBook Pro 15 2016 (2.7 GHz, 455) | |
| on screen Manhattan Onscreen OGL | |
| Acer Aspire 5 A515-51G-51RL | |
| Apple MacBook Pro 15 2016 (2.7 GHz, 455) | |
| GFXBench 3.1 | |
| 1920x1080 Manhattan ES 3.1 Offscreen | |
| Acer Aspire 5 A515-51G-51RL | |
| on screen Manhattan ES 3.1 Onscreen | |
| Acer Aspire 5 A515-51G-51RL | |
| GFXBench | |
| 1920x1080 Car Chase Offscreen | |
| Acer Aspire 5 A515-51G-51RL | |
| on screen Car Chase Onscreen | |
| Acer Aspire 5 A515-51G-51RL | |
| LuxMark v2.0 64Bit | |
| Room GPUs-only | |
| MSI PL62 MX150 7700HQ | |
| MSI PL62 MX150 7700HQ | |
| Apple MacBook Pro 15 2016 (2.7 GHz, 455) | |
| Acer Aspire 5 A515-51G-51RL | |
| HP Pavilion 15t-au100 CTO (W0P31AV) | |
| Apple MacBook Pro 15 2016 (2.6 GHz, 450) | |
| Sala GPUs-only | |
| MSI PL62 MX150 7700HQ | |
| MSI PL62 MX150 7700HQ | |
| HP Pavilion 15t-au100 CTO (W0P31AV) | |
| Apple MacBook Pro 15 2016 (2.7 GHz, 455) | |
| Acer Aspire 5 A515-51G-51RL | |
| Apple MacBook Pro 15 2016 (2.6 GHz, 450) | |
| Geekbench 4.0 - Compute OpenCL Score | |
| Acer Aspire 5 A515-51G-51RL | |
| Apple MacBook Pro 15 2016 (2.7 GHz, 455) | |
| Apple MacBook Pro 15 2016 (2.6 GHz, 450) | |
| Apple MacBook Pro 15 2016 (2.6 GHz, 450) | |
| Acer Aspire E5-575G-549D | |
| Lenovo IdeaPad 510-15IKB 80SV0087GE | |
| Geekbench 4.4 - Compute OpenCL Score | |
| Acer Aspire 5 A515-51G-51RL | |
| Unigine Heaven 2.1 - 1280x1024 high, Tesselation (normal), DirectX11 AA:off AF:1x | |
| Acer Aspire 5 A515-51G-51RL | |
| Unigine Heaven 3.0 - 1920x1080 DX 11, Normal Tessellation, High Shaders AA:Off AF:Off | |
| Acer Aspire 5 A515-51G-51RL | |
| Unigine Valley 1.0 - 1920x1080 Extreme HD DirectX AA:x8 | |
| Acer Aspire 5 A515-51G-51RL | |
| Apple MacBook Pro 15 2016 (2.7 GHz, 455) | |
| Dell Inspiron 15 5000 5567-1753 | |
| baixo | média | alto | ultra | |
|---|---|---|---|---|
| Diablo III (2012) | 143 | 123 | 120.2 | 81.2 |
| Tomb Raider (2013) | 232.2 | 129.3 | 87.2 | 40.8 |
| BioShock Infinite (2013) | 160.5 | 97 | 82.2 | 30.2 |
| Middle-earth: Shadow of Mordor (2014) | 82.1 | 54.9 | 32.9 | 24.9 |
| GTA V (2015) | 92.2 | 83 | 35 | 6.9 |
| The Witcher 3 (2015) | 60.7 | 36.9 | 20.3 | 17 |
| Batman: Arkham Knight (2015) | 54 | 46 | 21 | |
| Mad Max (2015) | 72.6 | 37.1 | 34.5 | |
| Dota 2 Reborn (2015) | 125.6 | 97 | 78.5 | 68.9 |
| World of Warships (2015) | 130.8 | 106.4 | 68.1 | 45 |
| Anno 2205 (2015) | 60.6 | 46 | 27.2 | 9.1 |
| Star Wars Battlefront (2015) | 94.4 | 62.2 | 29.3 | 25.5 |
| Rainbow Six Siege (2015) | 118.1 | 78.8 | 42.4 | 25.1 |
| Rise of the Tomb Raider (2016) | 51.3 | 33.6 | 20.4 | 17.2 |
| Far Cry Primal (2016) | 57 | 26 | 23 | 18 |
| The Division (2016) | 65.2 | 42.8 | 20 | 15.5 |
| Ashes of the Singularity (2016) | 28.9 | 19.3 | 16.3 | |
| Doom (2016) | 68.6 | 24.5 | 18.2 | 14 |
| Deus Ex Mankind Divided (2016) | 40.8 | 30.5 | 17 | 6.8 |
| Battlefield 1 (2016) | 71.9 | 53.9 | 25.4 | 20.9 |
| Farming Simulator 17 (2016) | 193.2 | 150.9 | 73.9 | 53.3 |
| Resident Evil 7 (2017) | 157.5 | 71.5 | 42 | 5.3 |
| For Honor (2017) | 85.1 | 31.1 | 29.4 | 21.4 |
| Ghost Recon Wildlands (2017) | 48.1 | 19.5 | 14.4 | 2.8 |
| Warhammer 40.000: Dawn of War III (2017) | 70 | 26.3 | 23.2 | |
| Prey (2017) | 100.4 | 41 | 34.9 | 28.2 |
| Rocket League (2017) | 127.6 | 54.3 | 37.8 | |
| Dirt 4 (2017) | 107.2 | 46.3 | 24.1 | 14 |
| BioShock Infinite | |
| 1920x1080 Ultra Preset, DX11 (DDOF) | |
| Apple MacBook Pro 15 2016 (2.7 GHz, 455) | |
| Lenovo ThinkPad E570-20H6S00000 | |
| Acer Aspire E5-575G-549D | |
| Acer Aspire 5 A515-51G-51RL | |
| Medion Erazer P6661 MD 99873 | |
| HP Pavilion 15t-au100 CTO (W0P31AV) | |
| Dell Inspiron 15 5000 5567-1753 | |
| Lenovo IdeaPad 510-15IKB 80SV0087GE | |
| 1366x768 High Preset | |
| Lenovo ThinkPad E570-20H6S00000 | |
| Acer Aspire E5-575G-549D | |
| Acer Aspire 5 A515-51G-51RL | |
| Medion Erazer P6661 MD 99873 | |
| Dell Inspiron 15 5000 5567-1753 | |
| HP Pavilion 15t-au100 CTO (W0P31AV) | |
| Lenovo IdeaPad 510-15IKB 80SV0087GE | |
| The Witcher 3 - 1024x768 Low Graphics & Postprocessing | |
| MSI PL62 MX150 7700HQ | |
| Apple MacBook Pro 15 2016 (2.7 GHz, 455) | |
| Acer Aspire 5 A515-51G-51RL | |
| Acer Aspire F5-771G-50RD | |
| Apple MacBook Pro 15 2016 (2.6 GHz, 450) | |
| Dell Inspiron 15 5000 5567-1753 | |
| Tomb Raider - 1920x1080 Ultra Preset AA:FX AF:16x | |
| Acer Aspire 5 A515-51G-51RL | |
| HP Pavilion 15t-au100 CTO (W0P31AV) | |
| Doom - 1280x720 Low Preset | |
| Acer Aspire 5 A515-51G-51RL | |
| Apple MacBook Pro 15 2016 (2.6 GHz, 450) | |
| Apple MacBook Pro 15 2016 (2.7 GHz, 455) | |
| Dell Inspiron 15 5000 5567-1753 | |
| For Honor - 1280x720 Low Preset | |
| MSI PL62 MX150 7700HQ | |
| Acer Aspire 5 A515-51G-51RL | |
| Apple MacBook Pro 15 2016 (2.6 GHz, 450) | |
Barulho
| Ocioso |
| 30.1 / 30.2 / 30.5 dB |
| HDD |
| 30.5 dB |
| Carga |
| 41.1 / 41.2 dB |
 | ||
30 dB silencioso 40 dB(A) audível 50 dB(A) ruidosamente alto |
||
min: | ||
| Acer Aspire 5 A515-51G-51RL i5-7200U, GeForce MX150 | Lenovo IdeaPad 510-15IKB 80SV0087GE i7-7500U, GeForce 940MX | Acer Aspire E5-575G-549D i5-7200U, GeForce GTX 950M | Medion Erazer P6661 MD 99873 6500U, GeForce GTX 950M | Dell Inspiron 15 5000 5567-1753 i7-7500U, Radeon R7 M445 | HP Pavilion 15t-au100 CTO (W0P31AV) i7-7500U, GeForce 940MX | |
|---|---|---|---|---|---|---|
| Noise | -1% | 4% | -17% | -1% | -4% | |
| desligado / ambiente * (dB) | 30.1 | 31.6 -5% | 28.9 4% | 31.2 -4% | 30.6 -2% | |
| Idle Minimum * (dB) | 30.1 | 32.6 -8% | 30.8 -2% | 39 -30% | 30.6 -2% | 32.2 -7% |
| Idle Average * (dB) | 30.2 | 32.6 -8% | 30.8 -2% | 39 -29% | 30.6 -1% | 32.2 -7% |
| Idle Maximum * (dB) | 30.5 | 32.6 -7% | 30.8 -1% | 40 -31% | 30.6 -0% | 33.7 -10% |
| Load Average * (dB) | 41.1 | 35.3 14% | 33.4 19% | 42.5 -3% | 41.9 -2% | 39.4 4% |
| Witcher 3 ultra * (dB) | 40.4 | |||||
| Load Maximum * (dB) | 41.2 | 37.1 10% | 40.1 3% | 42.4 -3% | 41.8 -1% | 42.2 -2% |
* ... menor é melhor
(±) A temperatura máxima no lado superior é 41.3 °C / 106 F, em comparação com a média de 36.8 °C / 98 F , variando de 21 a 71 °C para a classe Multimedia.
(-) A parte inferior aquece até um máximo de 48.7 °C / 120 F, em comparação com a média de 39.1 °C / 102 F
(+) Em uso inativo, a temperatura média para o lado superior é 24.9 °C / 77 F, em comparação com a média do dispositivo de 31.3 °C / ### class_avg_f### F.
(±) Jogando The Witcher 3, a temperatura média para o lado superior é 32.9 °C / 91 F, em comparação com a média do dispositivo de 31.3 °C / ## #class_avg_f### F.
(±) Os apoios para as mãos e o touchpad podem ficar muito quentes ao toque, com um máximo de 37.3 °C / 99.1 F.
(-) A temperatura média da área do apoio para as mãos de dispositivos semelhantes foi 28.7 °C / 83.7 F (-8.6 °C / -15.4 F).
| Acer Aspire 5 A515-51G-51RL i5-7200U, GeForce MX150 | Lenovo IdeaPad 510-15IKB 80SV0087GE i7-7500U, GeForce 940MX | Acer Aspire E5-575G-549D i5-7200U, GeForce GTX 950M | Medion Erazer P6661 MD 99873 6500U, GeForce GTX 950M | Dell Inspiron 15 5000 5567-1753 i7-7500U, Radeon R7 M445 | HP Pavilion 15t-au100 CTO (W0P31AV) i7-7500U, GeForce 940MX | |
|---|---|---|---|---|---|---|
| Heat | 16% | -13% | -1% | -3% | 13% | |
| Maximum Upper Side * (°C) | 41.3 | 38.3 7% | 48.1 -16% | 44.6 -8% | 41.6 -1% | 40 3% |
| Maximum Bottom * (°C) | 48.7 | 36 26% | 60.8 -25% | 50.8 -4% | 51.3 -5% | 34.8 29% |
| Idle Upper Side * (°C) | 28.7 | 24.9 13% | 30.8 -7% | 28.1 2% | 29.4 -2% | 27.2 5% |
| Idle Bottom * (°C) | 30.8 | 25.6 17% | 31.9 -4% | 28.5 7% | 32.4 -5% | 26 16% |
* ... menor é melhor
Acer Aspire 5 A515-51G-51RL análise de áudio
(-) | alto-falantes não muito altos (###valor### dB)
Graves 100 - 315Hz
(-) | quase nenhum baixo - em média 24% menor que a mediana
(±) | a linearidade dos graves é média (10.3% delta para a frequência anterior)
Médios 400 - 2.000 Hz
(+) | médios equilibrados - apenas 4% longe da mediana
(+) | médios são lineares (6.2% delta para frequência anterior)
Altos 2 - 16 kHz
(+) | agudos equilibrados - apenas 3.6% longe da mediana
(±) | a linearidade dos máximos é média (8.5% delta para frequência anterior)
Geral 100 - 16.000 Hz
(±) | a linearidade do som geral é média (22.7% diferença em relação à mediana)
Comparado com a mesma classe
» 81% de todos os dispositivos testados nesta classe foram melhores, 5% semelhantes, 15% piores
» O melhor teve um delta de 5%, a média foi 17%, o pior foi 45%
Comparado com todos os dispositivos testados
» 67% de todos os dispositivos testados foram melhores, 6% semelhantes, 27% piores
» O melhor teve um delta de 4%, a média foi 23%, o pior foi 134%
Apple MacBook 12 (Early 2016) 1.1 GHz análise de áudio
(+) | os alto-falantes podem tocar relativamente alto (###valor### dB)
Graves 100 - 315Hz
(±) | graves reduzidos - em média 11.3% menor que a mediana
(±) | a linearidade dos graves é média (14.2% delta para a frequência anterior)
Médios 400 - 2.000 Hz
(+) | médios equilibrados - apenas 2.4% longe da mediana
(+) | médios são lineares (5.5% delta para frequência anterior)
Altos 2 - 16 kHz
(+) | agudos equilibrados - apenas 2% longe da mediana
(+) | os máximos são lineares (4.5% delta da frequência anterior)
Geral 100 - 16.000 Hz
(+) | o som geral é linear (10.2% diferença em relação à mediana)
Comparado com a mesma classe
» 7% de todos os dispositivos testados nesta classe foram melhores, 2% semelhantes, 90% piores
» O melhor teve um delta de 5%, a média foi 18%, o pior foi 53%
Comparado com todos os dispositivos testados
» 5% de todos os dispositivos testados foram melhores, 1% semelhantes, 94% piores
» O melhor teve um delta de 4%, a média foi 23%, o pior foi 134%
| desligado | |
| Ocioso | |
| Carga |
|
Key:
min: | |
| Acer Aspire 5 A515-51G-51RL i5-7200U, GeForce MX150 | Lenovo IdeaPad 510-15IKB 80SV0087GE i7-7500U, GeForce 940MX | Acer Aspire E5-575G-549D i5-7200U, GeForce GTX 950M | Medion Erazer P6661 MD 99873 6500U, GeForce GTX 950M | Dell Inspiron 15 5000 5567-1753 i7-7500U, Radeon R7 M445 | HP Pavilion 15t-au100 CTO (W0P31AV) i7-7500U, GeForce 940MX | |
|---|---|---|---|---|---|---|
| Power Consumption | -11% | -44% | -105% | -9% | -36% | |
| Idle Minimum * (Watt) | 2.9 | 3.9 -34% | 6 -107% | 8.7 -200% | 4 -38% | 6.16 -112% |
| Idle Average * (Watt) | 5.9 | 7.4 -25% | 8.1 -37% | 14.5 -146% | 5.4 8% | 8.48 -44% |
| Idle Maximum * (Watt) | 6.4 | 9.5 -48% | 9.8 -53% | 15.6 -144% | 8.3 -30% | 9.62 -50% |
| Load Average * (Watt) | 54 | 41 24% | 52.5 3% | 61 -13% | 54 -0% | 41.63 23% |
| Witcher 3 ultra * (Watt) | 51 | |||||
| Load Maximum * (Watt) | 66 | 48 27% | 81.6 -24% | 82 -24% | 55.4 16% | 63.22 4% |
* ... menor é melhor
| Acer Aspire 5 A515-51G-51RL i5-7200U, GeForce MX150, 48 Wh | Lenovo IdeaPad 510-15IKB 80SV0087GE i7-7500U, GeForce 940MX, 30 Wh | Acer Aspire E5-575G-549D i5-7200U, GeForce GTX 950M, 62 Wh | Medion Erazer P6661 MD 99873 6500U, GeForce GTX 950M, 44 Wh | Dell Inspiron 15 5000 5567-1753 i7-7500U, Radeon R7 M445, 42 Wh | HP Pavilion 15t-au100 CTO (W0P31AV) i7-7500U, GeForce 940MX, 41 Wh | |
|---|---|---|---|---|---|---|
| Duração da bateria | -47% | -26% | -56% | -38% | -49% | |
| Reader / Idle (h) | 20.9 | 12.8 -39% | 8.7 -58% | 7.8 -63% | 7.3 -65% | |
| H.264 (h) | 8.2 | 7.7 -6% | 1.9 -77% | 5.3 -35% | ||
| WiFi v1.3 (h) | 8.6 | 4.6 -47% | 7.5 -13% | 3.8 -56% | 7 -19% | 3.7 -57% |
| Load (h) | 2.4 | 1.3 -46% | 1.6 -33% | 1.6 -33% | 1.8 -25% |
Pro
Contra
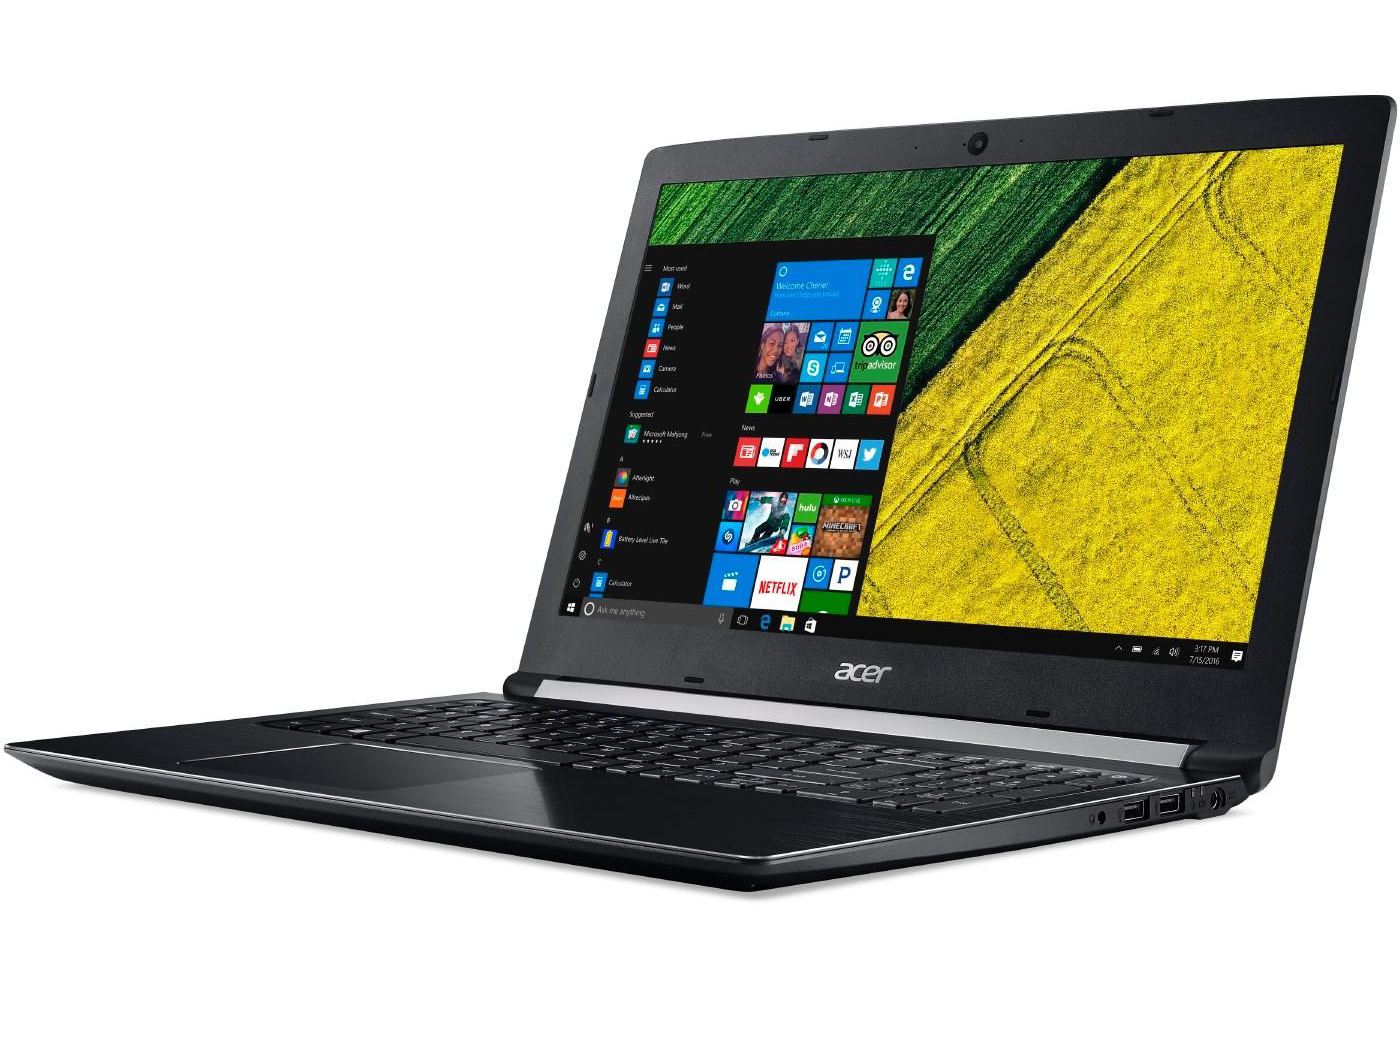
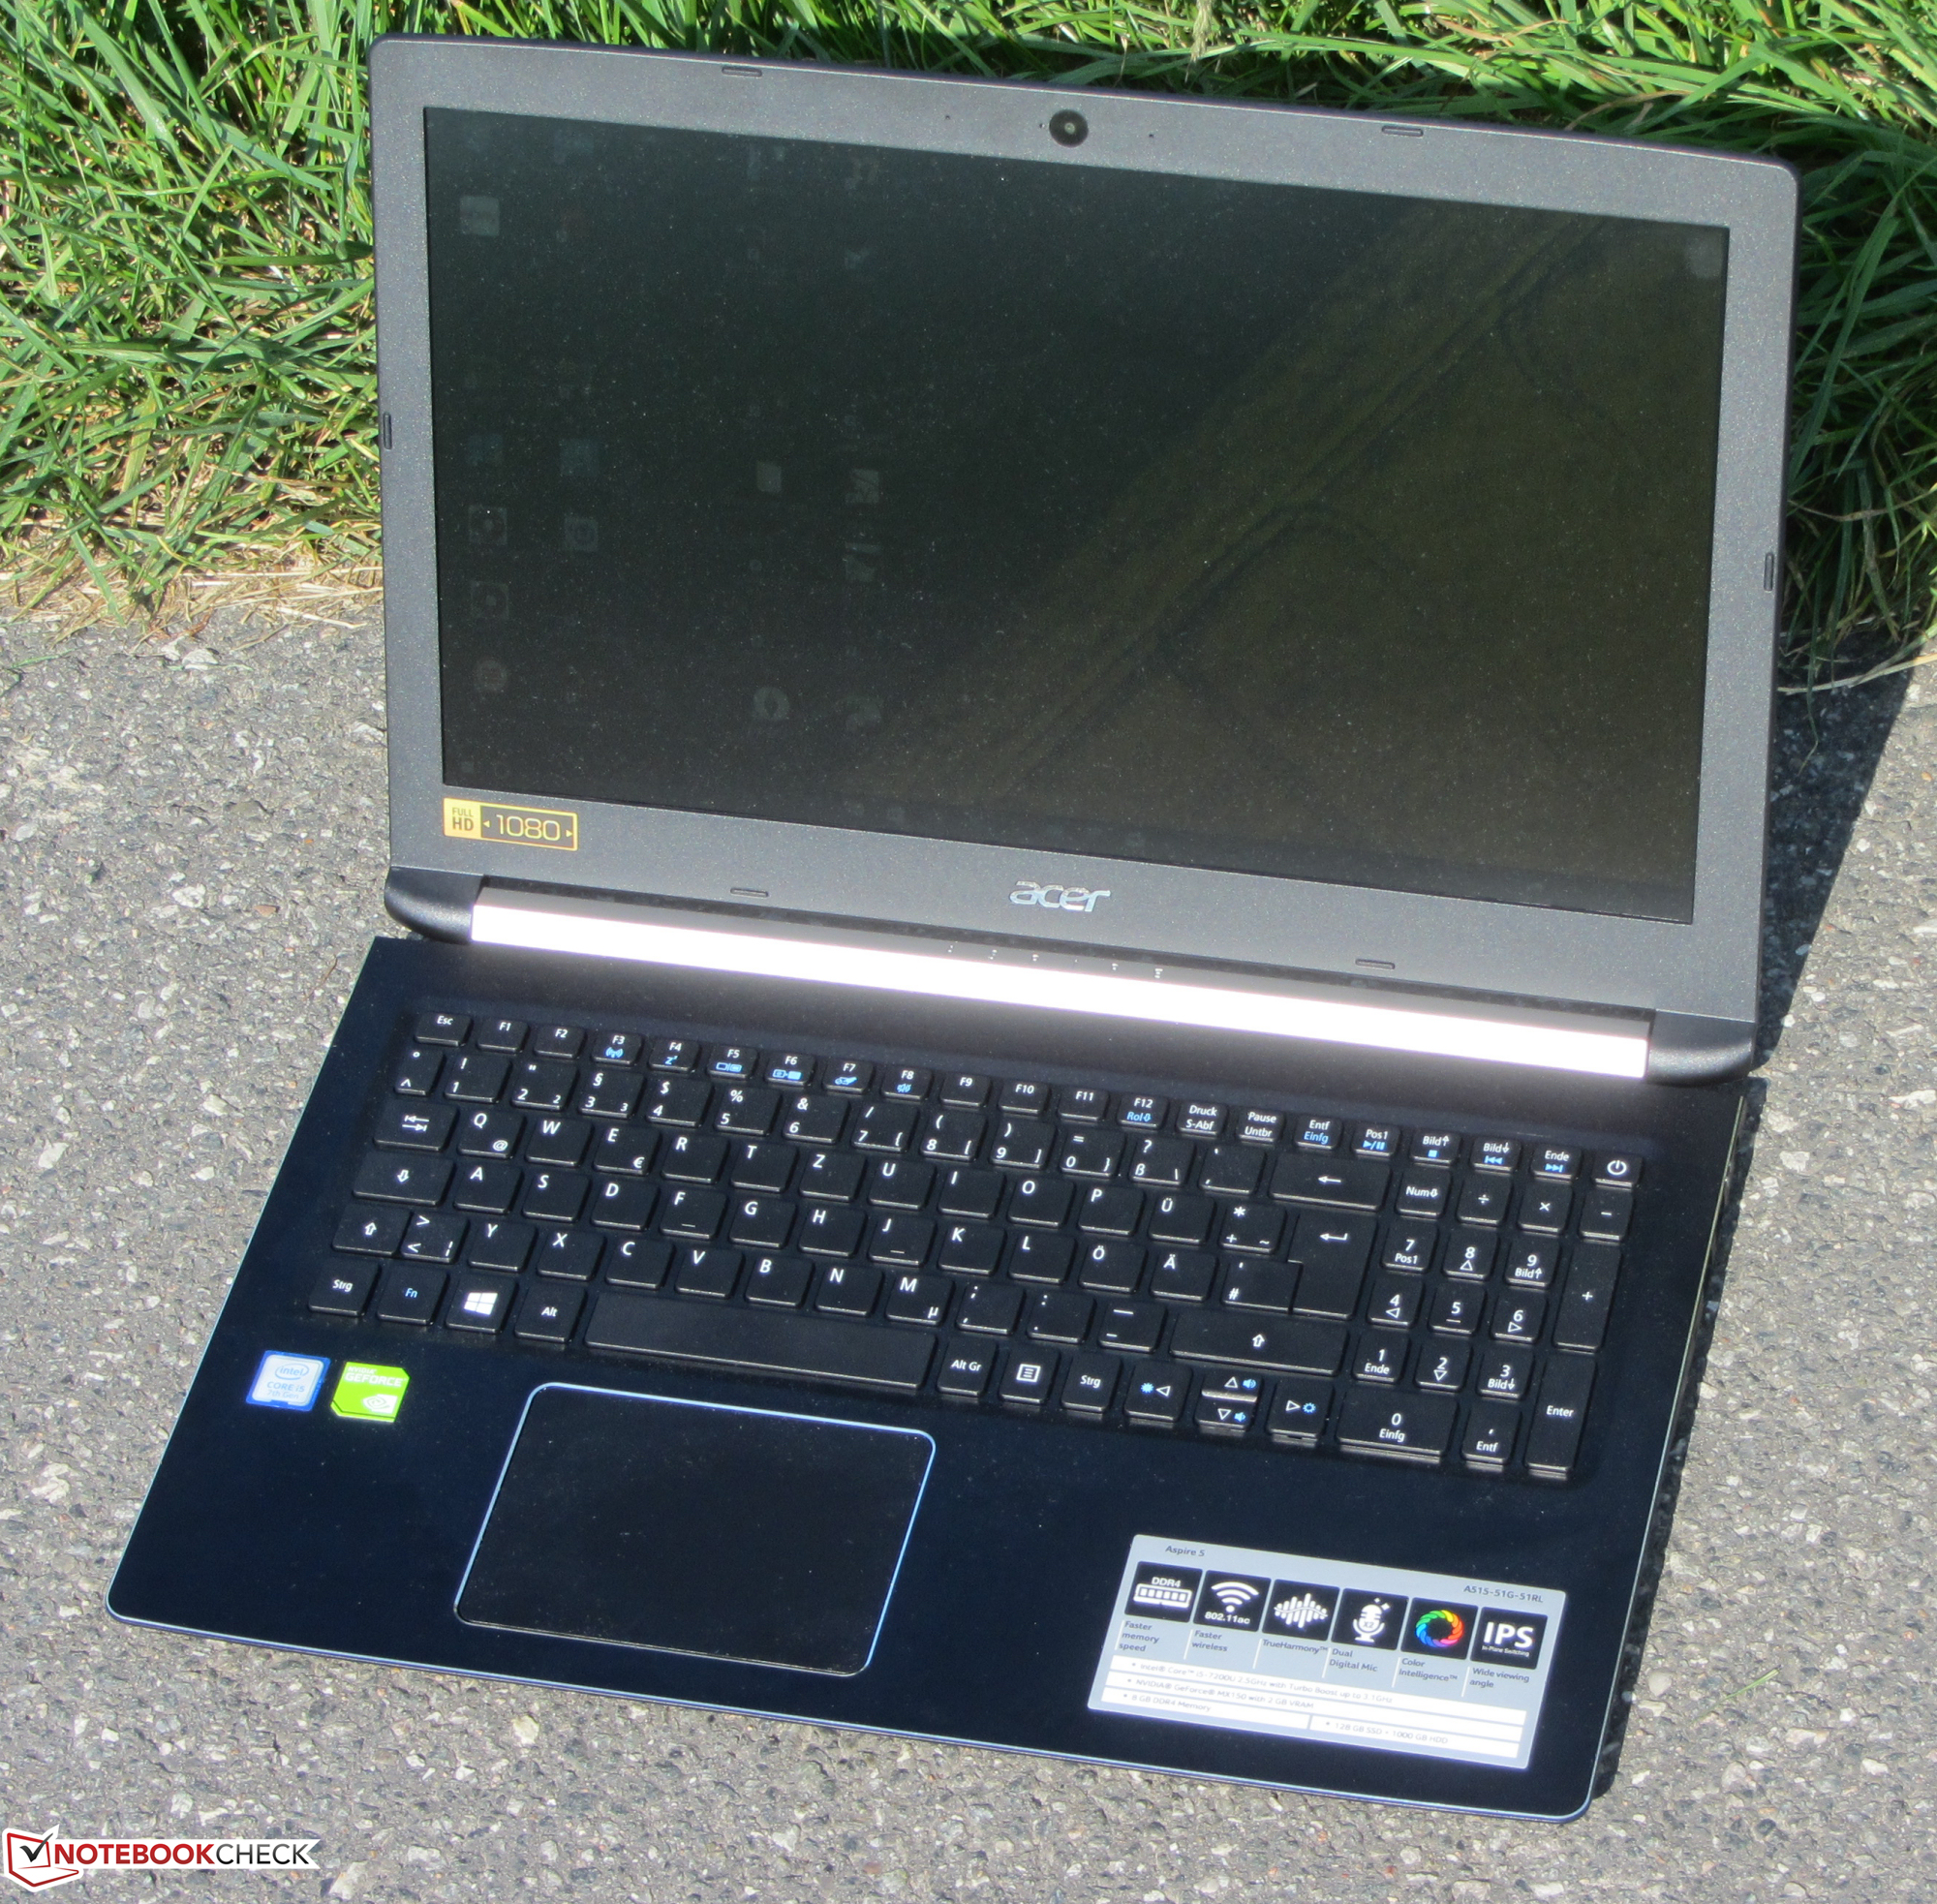
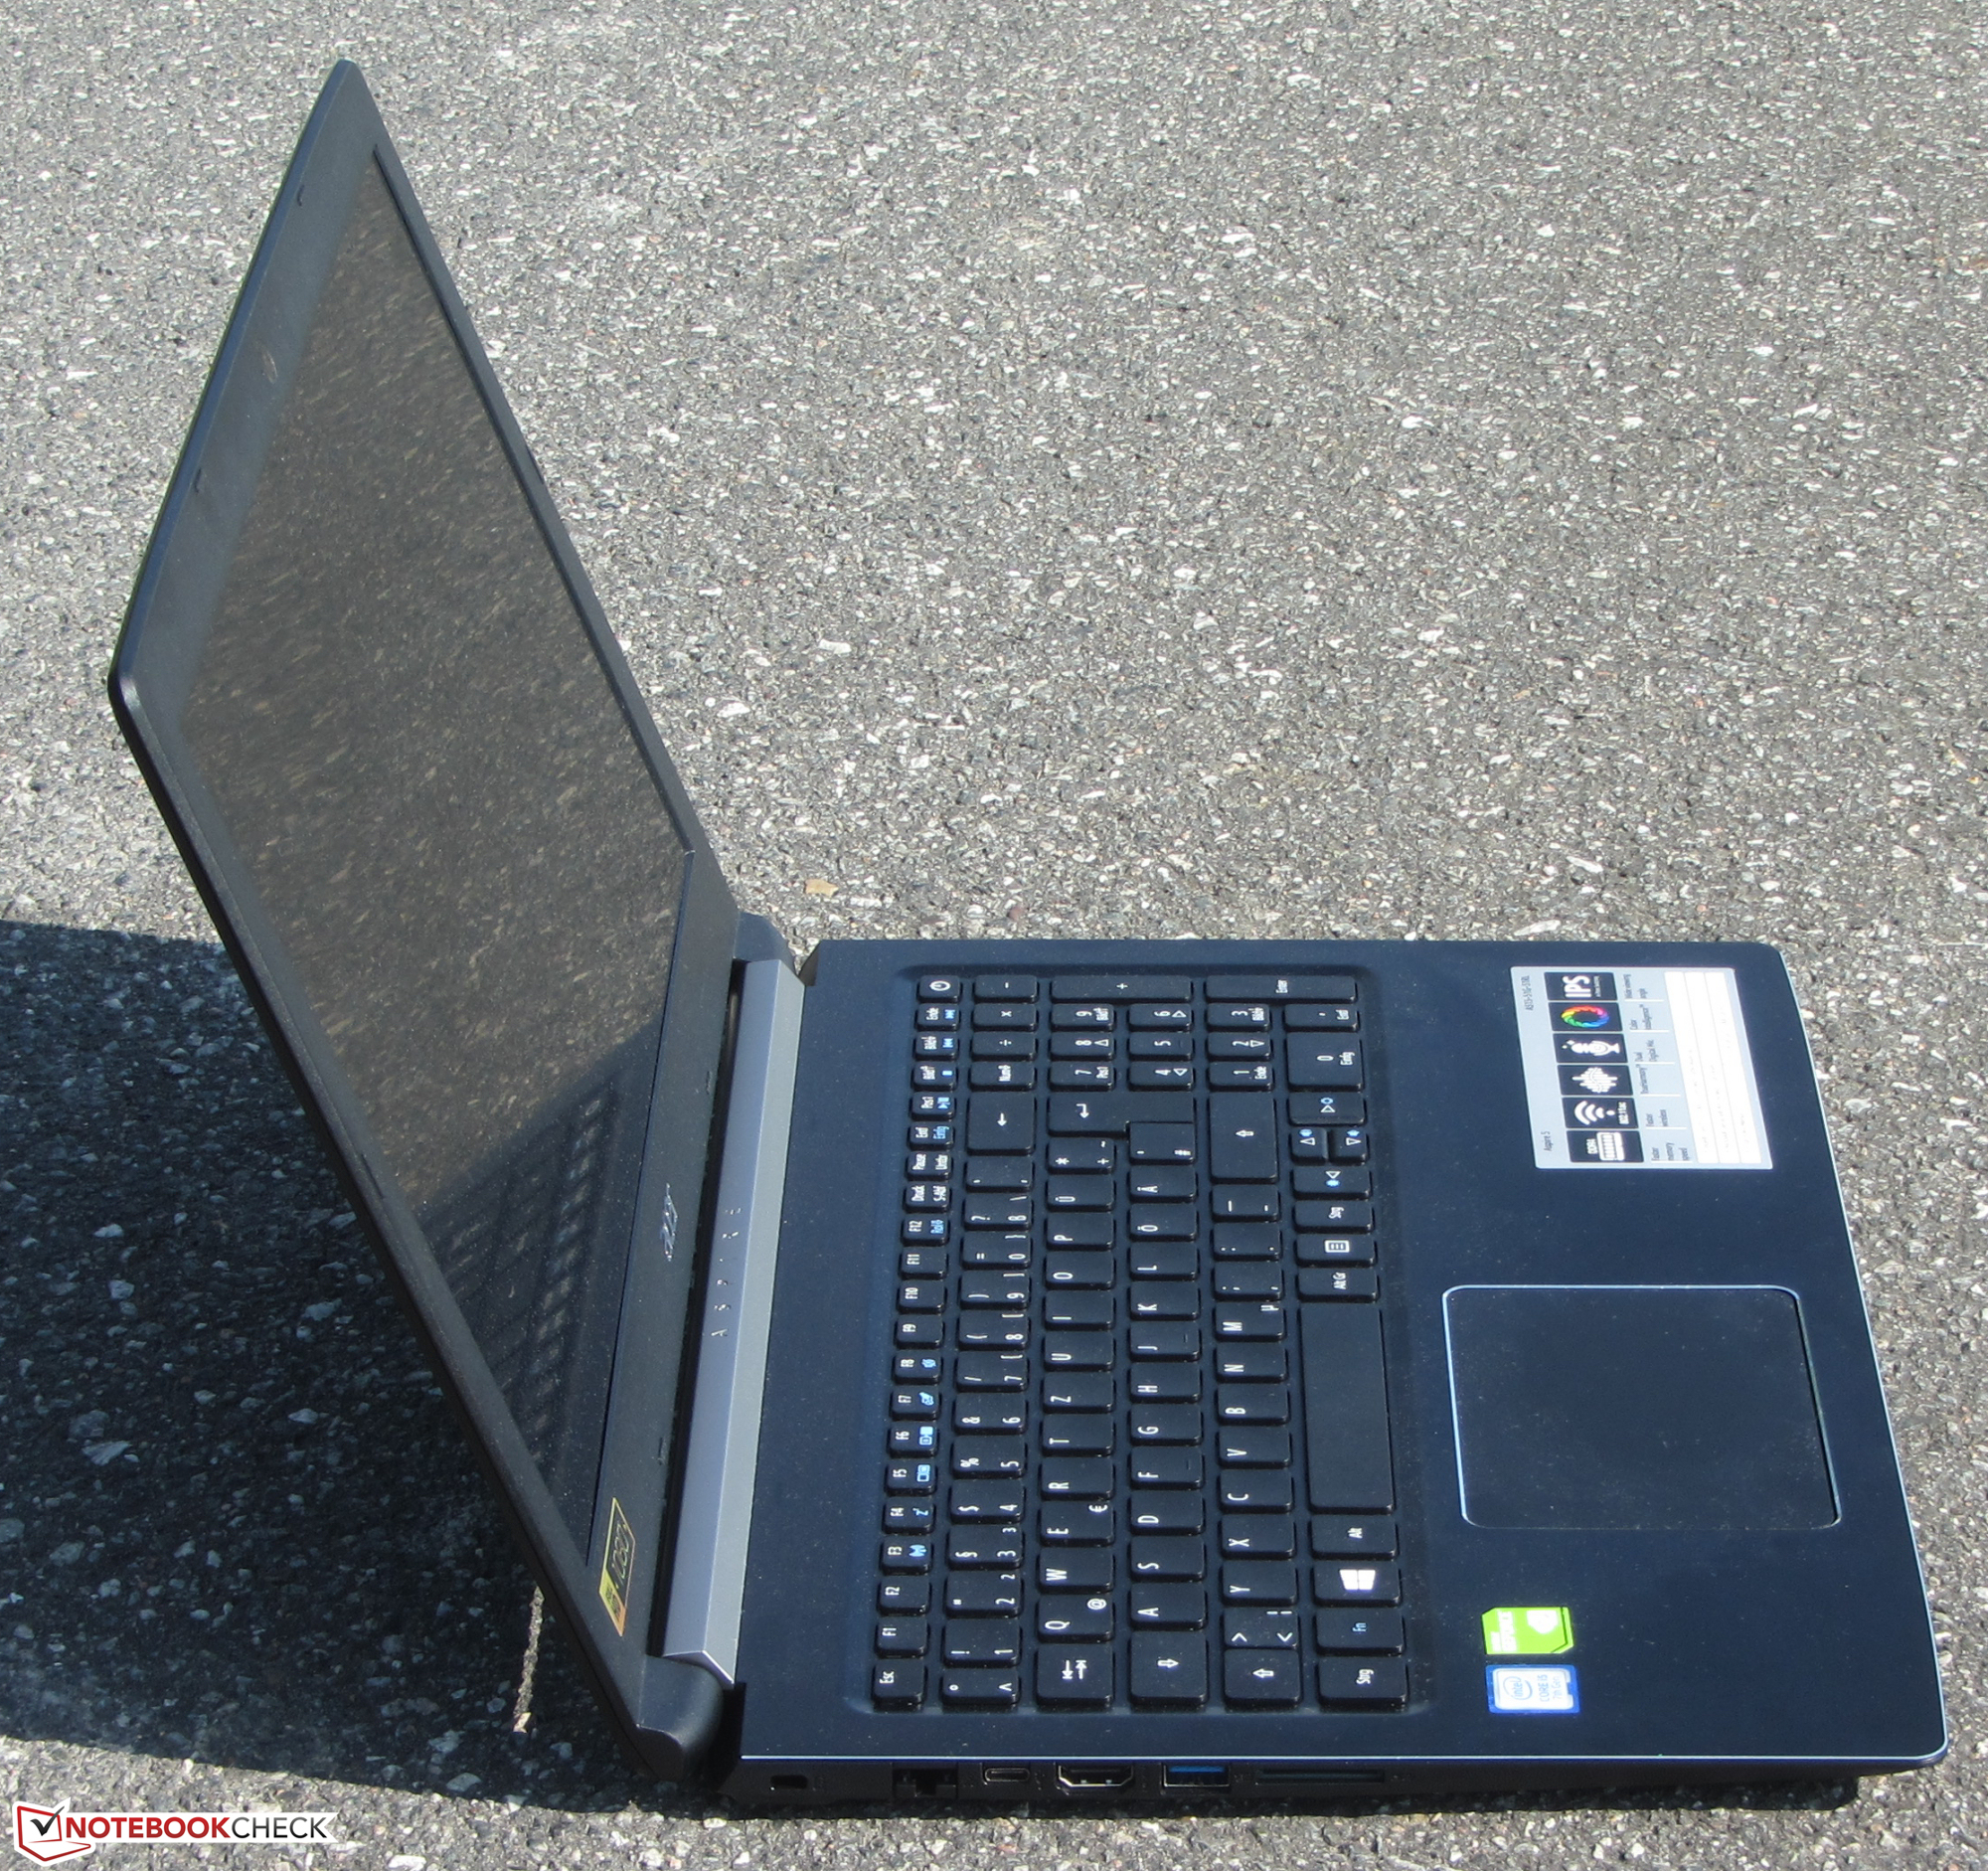
O Acer Aspire 5 515-51G-51RL é um poli funcional multimídia com uma tela mate FHD de 15,6 polegadas e uma carcaça fina, lembram o design do Aspire V15 Nitro. O processador Core i5 incorporado é poderoso o suficiente para a maioria dos cenários de uso comum e, combinado com a GPU GeForce MX150 consegue rodar todos os jogos atuais sem problemas. Ele permanece surpreendentemente frio e silencioso, e é completamente silencioso, enquanto encontra seu caminho para cargas de trabalho regulares de escritório.
O mais recente Aspire 5 da Acer é um poli funcional multimídia decente com apenas pequenas desvantagens.
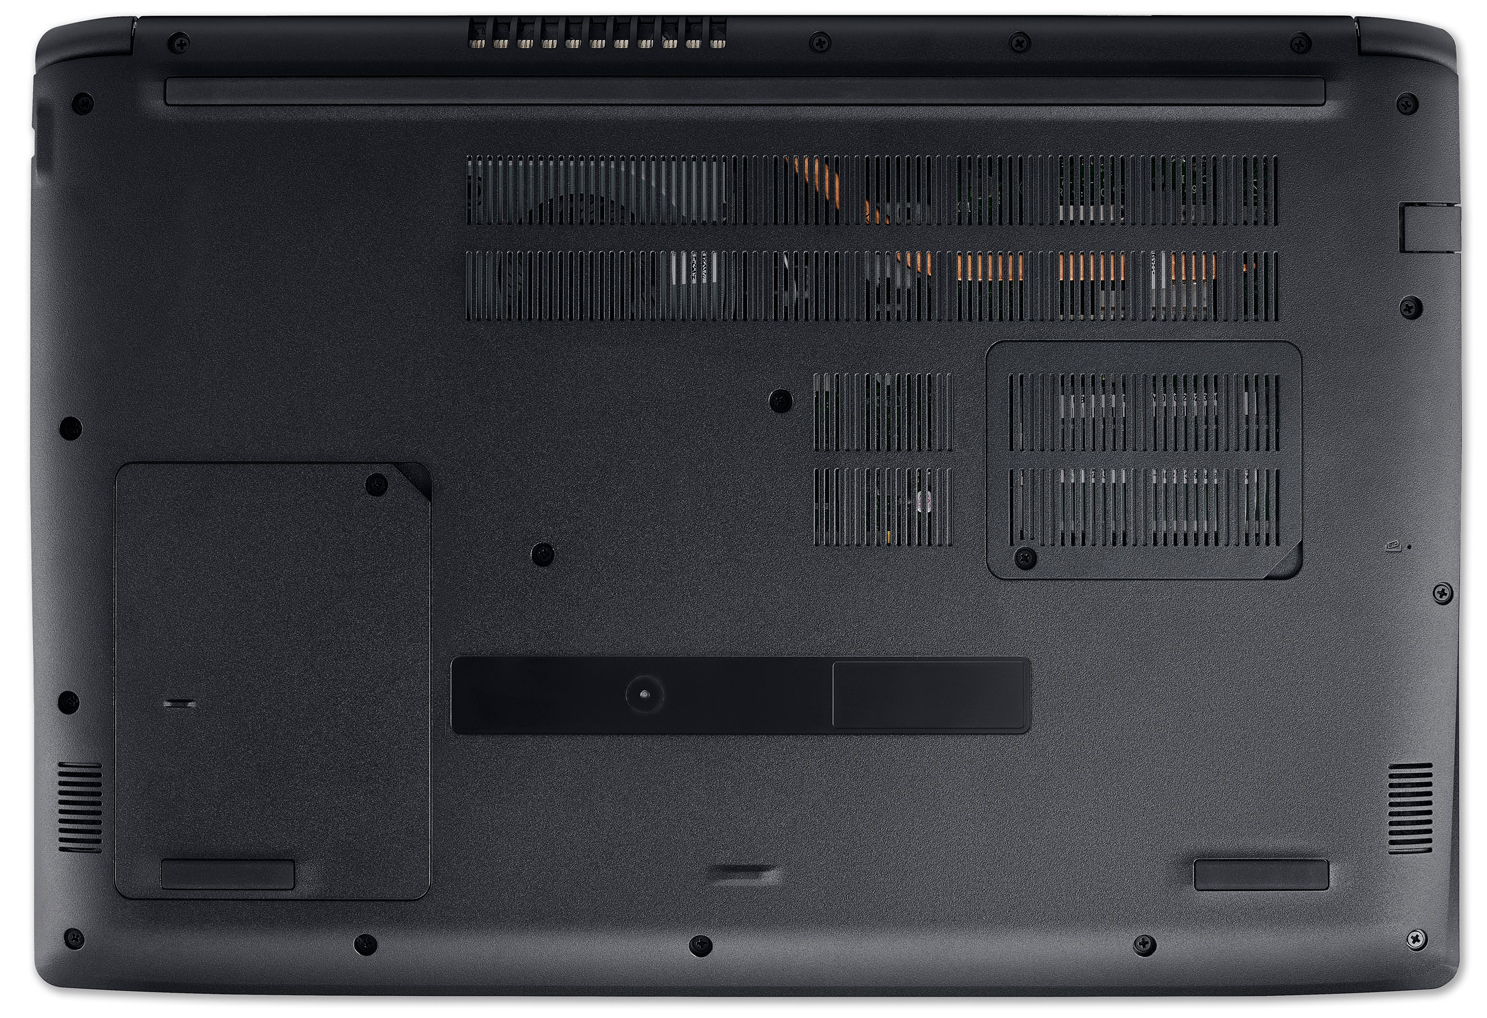
É bastante rápido graças ao seu SSD e oferece muito espaço de armazenamento graças à unidade de disco rígido de 1 TB de 2,5 polegadas que pode ser facilmente substituída após a remoção de uma única escotilha de manutenção. Infelizmente, a carcaça deve ser desmontada para substituir o SSD. Durando impressionantes 8:37 horas em nosso teste Wi-Fi, a duração da bateria foi excelente para um portátil multimídia.
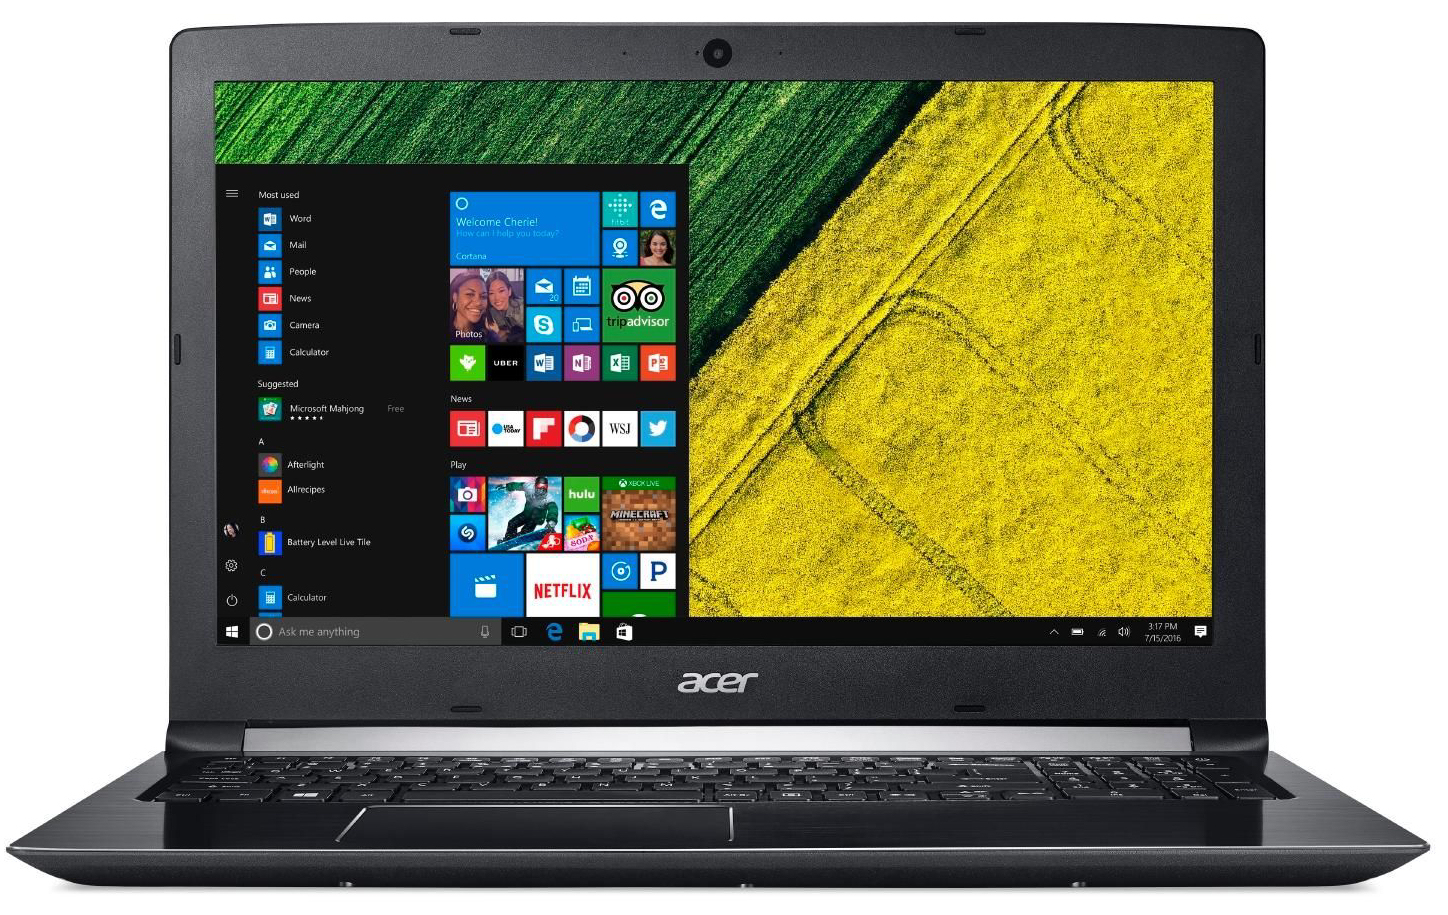
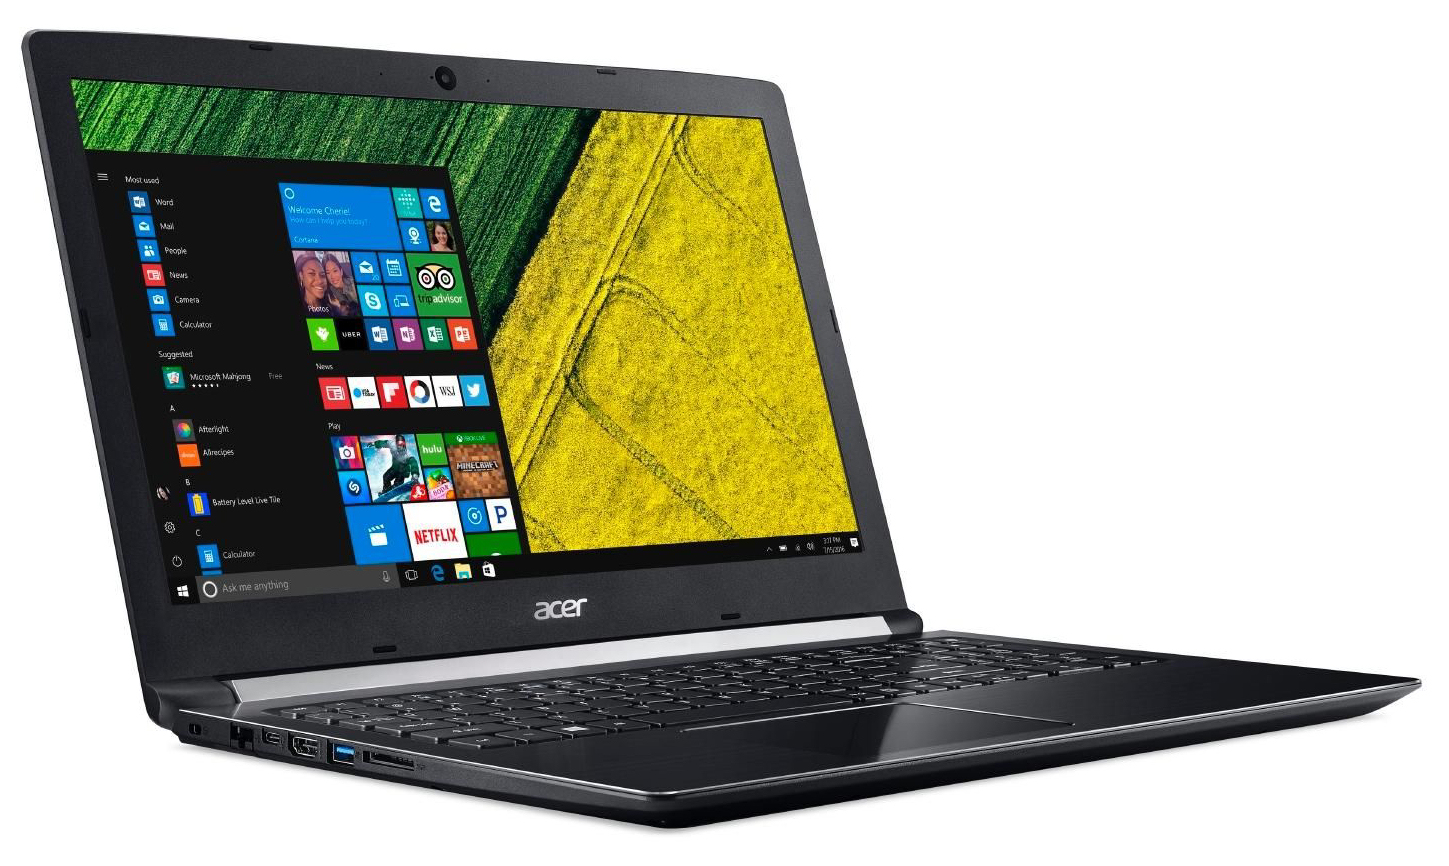
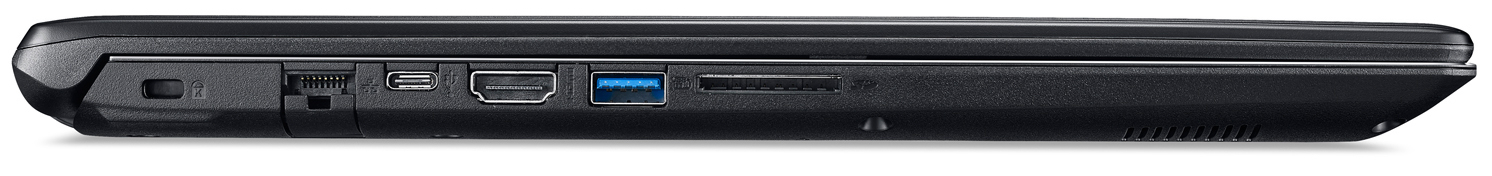
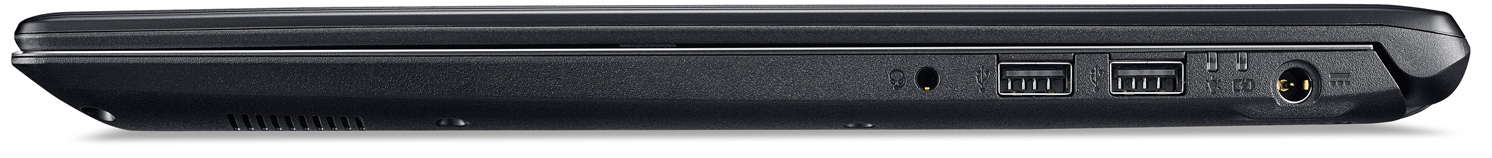
O teclado é decente e adequado para escritores prolíficos, mas não conta com iluminação de fundo que deveria ter sido incluída em um aparelho como este. O painel de IPS mate oferece ângulos de visão decentes, uma boa relação de alto contraste e uma cobertura de espaço de cor meio decente. No entanto, o brilho máximo é significativamente muito baixo para um aparelho no nível de preços do Aspire. Também é um mistério para nós porque a Acer incluiu apenas um único USB 3.1 Gen. 1, em vez da muito mais veloz porta Gen. 2
Acer Aspire 5 A515-51G-51RL
- 07/26/2017 v6 (old)
Sascha Mölck
Price comparison
