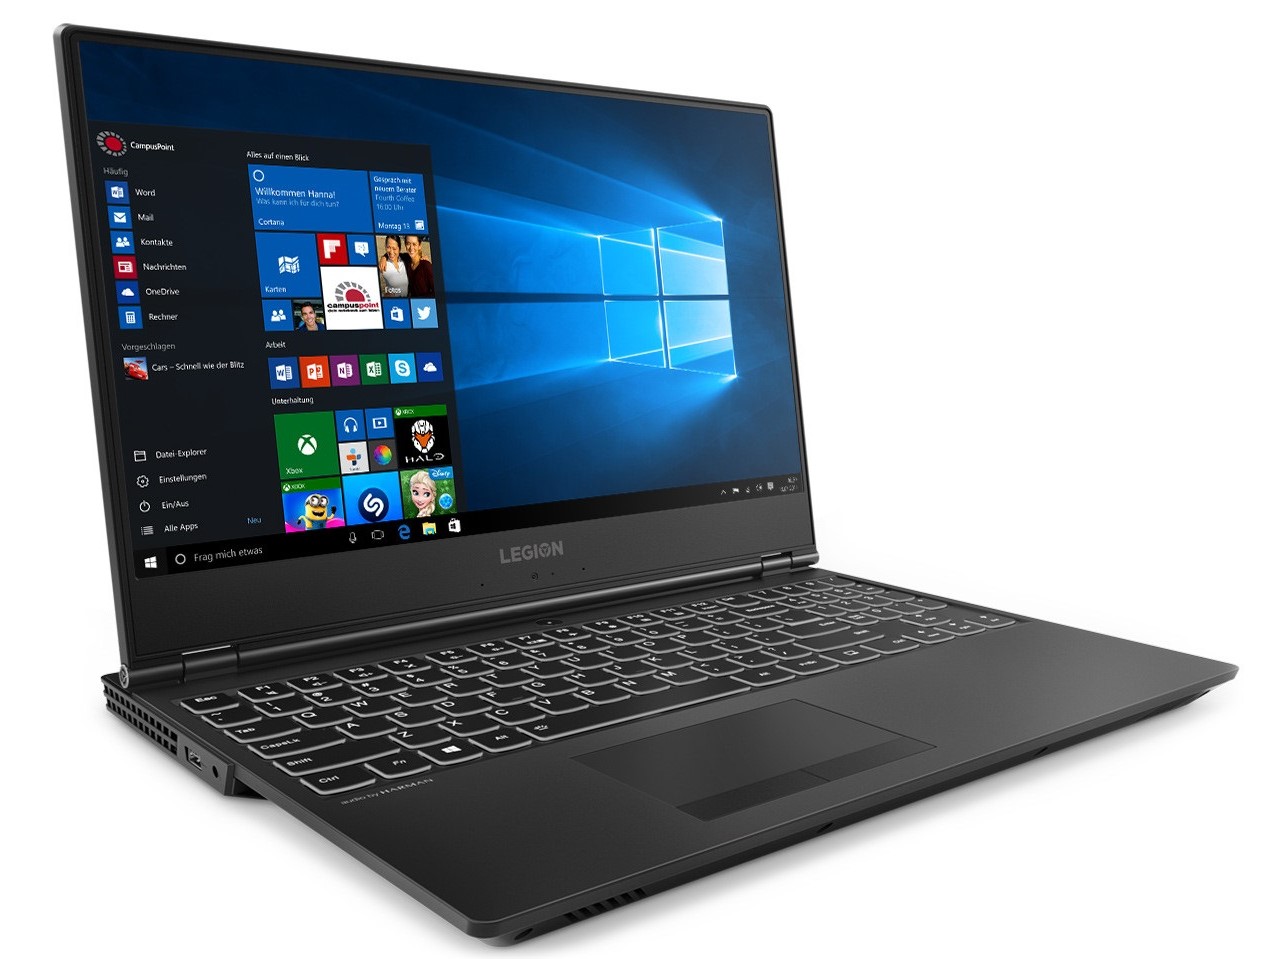
Breve Análise do Portátil Lenovo Legion Y540-15IRH: Ugamingm bom portátil de jogos com uma GPU GeForce GTX 1660 Ti
| Networking | |
| iperf3 transmit AX12 | |
| Lenovo Legion Y540-15IRH | |
| HP Gaming Pavilion 15-dk0009ng | |
| Lenovo Legion Y540-15IRH-81SX00B2GE | |
| CUK Model Z GK5CQ7Z | |
| Asus Strix GL531GV-PB74 | |
| Lenovo Legion Y530-15ICH | |
| iperf3 receive AX12 | |
| Lenovo Legion Y540-15IRH | |
| Asus Strix GL531GV-PB74 | |
| CUK Model Z GK5CQ7Z | |
| Lenovo Legion Y540-15IRH-81SX00B2GE | |
| HP Gaming Pavilion 15-dk0009ng | |
| Lenovo Legion Y530-15ICH | |
| |||||||||||||||||||||||||
iluminação: 89 %
iluminação com acumulador: 299 cd/m²
Contraste: 1031:1 (Preto: 0.29 cd/m²)
ΔE ColorChecker Calman: 3.7 | ∀{0.5-29.43 Ø4.72}
calibrated: 2
ΔE Greyscale Calman: 4.1 | ∀{0.09-98 Ø4.97}
91.5% sRGB (Argyll 1.6.3 3D)
59.3% AdobeRGB 1998 (Argyll 1.6.3 3D)
65.2% AdobeRGB 1998 (Argyll 3D)
91.7% sRGB (Argyll 3D)
63.6% Display P3 (Argyll 3D)
Gamma: 2.19
CCT: 7166 K
| Lenovo Legion Y540-15IRH-81SX00B2GE BOE 084D, , 1920x1080, 15.6" | Asus Strix GL531GV-PB74 Panda LM156LF-GL02, , 1920x1080, 15.6" | CUK Model Z GK5CQ7Z LG Philips LGD05C0, , 1920x1080, 15.6" | HP Gaming Pavilion 15-dk0009ng LG Philips LGD05FE, , 1920x1080, 15.6" | Lenovo Legion Y530-15ICH LG Display LP156WFG-SPB2, , 1920x1080, 15.6" | Lenovo Legion Y540-15IRH BOE NV156FHM-N4G (BOE084D), , 1920x1080, 15.6" | |
|---|---|---|---|---|---|---|
| Display | -36% | 1% | 2% | -1% | 1% | |
| Display P3 Coverage (%) | 63.6 | 40.13 -37% | 64.5 1% | 64.2 1% | 62.5 -2% | 64.5 1% |
| sRGB Coverage (%) | 91.7 | 60.3 -34% | 93 1% | 95.1 4% | 93 1% | 91.6 0% |
| AdobeRGB 1998 Coverage (%) | 65.2 | 41.48 -36% | 65.7 1% | 65.8 1% | 63.8 -2% | 65.9 1% |
| Response Times | -154% | -28% | -37% | -31% | 9% | |
| Response Time Grey 50% / Grey 80% * (ms) | 8.8 ? | 26 ? -195% | 13.6 ? -55% | 16.4 ? -86% | 15 ? -70% | 8.8 ? -0% |
| Response Time Black / White * (ms) | 12 ? | 25.6 ? -113% | 12 ? -0% | 10.4 ? 13% | 11 ? 8% | 10 ? 17% |
| PWM Frequency (Hz) | ||||||
| Screen | -49% | 1% | 19% | -11% | 1% | |
| Brightness middle (cd/m²) | 299 | 290.1 -3% | 306.8 3% | 345 15% | 305 2% | 284 -5% |
| Brightness (cd/m²) | 290 | 274 -6% | 309 7% | 324 12% | 284 -2% | 277 -4% |
| Brightness Distribution (%) | 89 | 86 -3% | 87 -2% | 86 -3% | 83 -7% | 87 -2% |
| Black Level * (cd/m²) | 0.29 | 0.54 -86% | 0.38 -31% | 0.42 -45% | 0.52 -79% | 0.3 -3% |
| Contrast (:1) | 1031 | 537 -48% | 807 -22% | 821 -20% | 587 -43% | 947 -8% |
| Colorchecker dE 2000 * | 3.7 | 5.16 -39% | 3.16 15% | 1.3 65% | 3.63 2% | 3.53 5% |
| Colorchecker dE 2000 max. * | 7 | 18.09 -158% | 6.05 14% | 2.8 60% | 8.18 -17% | 6.11 13% |
| Colorchecker dE 2000 calibrated * | 2 | 4.35 -117% | 2.4 -20% | 1.1 45% | 1.31 34% | 1.81 9% |
| Greyscale dE 2000 * | 4.1 | 4.4 -7% | 2.3 44% | 1.2 71% | 4.77 -16% | 3.56 13% |
| Gamma | 2.19 100% | 2.1 105% | 2.17 101% | 2.31 95% | 2.54 87% | 2.47 89% |
| CCT | 7166 91% | 7362 88% | 6557 99% | 6476 100% | 7500 87% | 7257 90% |
| Color Space (Percent of AdobeRGB 1998) (%) | 59.3 | 38.1 -36% | 60 1% | 60.5 2% | 59 -1% | 59 -1% |
| Color Space (Percent of sRGB) (%) | 91.5 | 60 -34% | 92.6 1% | 94.9 4% | 93 2% | 91 -1% |
| Média Total (Programa/Configurações) | -80% /
-60% | -9% /
-3% | -5% /
9% | -14% /
-12% | 4% /
2% |
* ... menor é melhor
Exibir tempos de resposta
| ↔ Tempo de resposta preto para branco | ||
|---|---|---|
| 12 ms ... ascensão ↗ e queda ↘ combinadas | ↗ 6.8 ms ascensão | 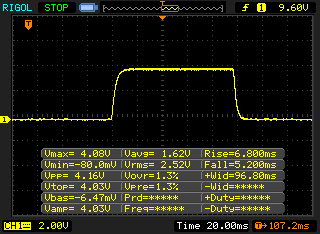 |
| ↘ 5.2 ms queda | ||
| A tela mostra boas taxas de resposta em nossos testes, mas pode ser muito lenta para jogadores competitivos. Em comparação, todos os dispositivos testados variam de 0.1 (mínimo) a 240 (máximo) ms. » 31 % de todos os dispositivos são melhores. Isso significa que o tempo de resposta medido é melhor que a média de todos os dispositivos testados (19.8 ms). | ||
| ↔ Tempo de resposta 50% cinza a 80% cinza | ||
| 8.8 ms ... ascensão ↗ e queda ↘ combinadas | ↗ 4 ms ascensão | 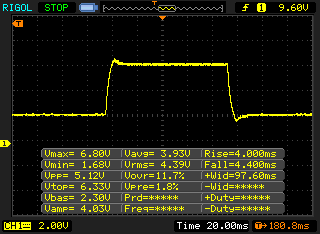 |
| ↘ 4.4 ms queda | ||
| A tela mostra taxas de resposta rápidas em nossos testes e deve ser adequada para jogos. Em comparação, todos os dispositivos testados variam de 0.165 (mínimo) a 636 (máximo) ms. » 22 % de todos os dispositivos são melhores. Isso significa que o tempo de resposta medido é melhor que a média de todos os dispositivos testados (31 ms). | ||
Cintilação da tela / PWM (modulação por largura de pulso)
| Tela tremeluzindo / PWM não detectado | 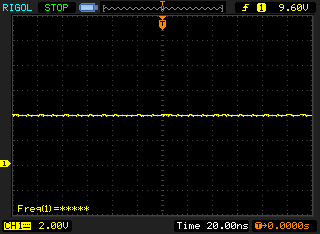 | ||
[pwm_comparison] Em comparação: 52 % de todos os dispositivos testados não usam PWM para escurecer a tela. Se PWM foi detectado, uma média de 7781 (mínimo: 5 - máximo: 343500) Hz foi medida. | |||
| PCMark 8 Home Score Accelerated v2 | 4507 pontos | |
| PCMark 8 Work Score Accelerated v2 | 5041 pontos | |
| PCMark 10 Score | 5716 pontos | |
Ajuda | ||
| Lenovo Legion Y540-15IRH-81SX00B2GE WDC PC SN720 SDAPNTW-512G | Asus Strix GL531GV-PB74 Intel SSD 660p SSDPEKNW512G8 | CUK Model Z GK5CQ7Z Intel SSD 660p 2TB SSDPEKNW020T8 | HP Gaming Pavilion 15-dk0009ng Samsung SSD PM981 MZVLB256HAHQ | Lenovo Legion Y530-15ICH Samsung SSD PM981 MZVLB256HAHQ | Lenovo Legion Y540-15IRH Samsung PM981a MZVLB1T0HBLR | Média WDC PC SN720 SDAPNTW-512G | |
|---|---|---|---|---|---|---|---|
| CrystalDiskMark 5.2 / 6 | -16% | 12% | -18% | -16% | 11% | -4% | |
| Write 4K (MB/s) | 158.8 | 121.9 -23% | 134.4 -15% | 100 -37% | 108.9 -31% | 131.7 -17% | 110 ? -31% |
| Read 4K (MB/s) | 29.11 | 53.6 84% | 56.8 95% | 31.39 8% | 40.23 38% | 48.06 65% | 36.9 ? 27% |
| Write Seq (MB/s) | 1584 | 967 -39% | 1742 10% | 1308 -17% | 1390 -12% | 1234 -22% | 1976 ? 25% |
| Read Seq (MB/s) | 1694 | 1461 -14% | 1687 0% | 1083 -36% | 964 -43% | 973 -43% | 1710 ? 1% |
| Write 4K Q32T1 (MB/s) | 536 | 431.4 -20% | 535 0% | 362.9 -32% | 314.2 -41% | 576 7% | 339 ? -37% |
| Read 4K Q32T1 (MB/s) | 363.9 | 337.3 -7% | 639 76% | 425.7 17% | 369.2 1% | 655 80% | 417 ? 15% |
| Write Seq Q32T1 (MB/s) | 2536 | 972 -62% | 1903 -25% | 1411 -44% | 1506 -41% | 3012 19% | 2218 ? -13% |
| Read Seq Q32T1 (MB/s) | 3458 | 1727 -50% | 1849 -47% | 3240 -6% | 3446 0% | 3481 1% | 2940 ? -15% |
| AS SSD | -44% | -26% | -43% | -45% | 13% | -22% | |
| Seq Read (MB/s) | 2927 | 1280 -56% | 1283 -56% | 2088 -29% | 1808 -38% | 1954 -33% | 2544 ? -13% |
| Seq Write (MB/s) | 2149 | 905 -58% | 1730 -19% | 1347 -37% | 1429 -34% | 2484 16% | 2034 ? -5% |
| 4K Read (MB/s) | 42.43 | 48.73 15% | 49.89 18% | 36.14 -15% | 46.1 9% | 56.7 34% | 36.5 ? -14% |
| 4K Write (MB/s) | 147.1 | 107 -27% | 110.1 -25% | 96.5 -34% | 97 -34% | 124.3 -15% | 110.8 ? -25% |
| 4K-64 Read (MB/s) | 1286 | 321.1 -75% | 904 -30% | 565 -56% | 536 -58% | 1599 24% | 1112 ? -14% |
| 4K-64 Write (MB/s) | 1432 | 761 -47% | 792 -45% | 588 -59% | 273.6 -81% | 1883 31% | 1222 ? -15% |
| Access Time Read * (ms) | 0.065 | 0.058 11% | 0.036 45% | 0.093 -43% | 0.085 -31% | 0.039 40% | 0.0965 ? -48% |
| Access Time Write * (ms) | 0.026 | 0.046 -77% | 0.042 -62% | 0.038 -46% | 0.038 -46% | 0.03 -15% | 0.04212 ? -62% |
| Score Read (Points) | 1621 | 498 -69% | 1082 -33% | 810 -50% | 763 -53% | 1851 14% | 1403 ? -13% |
| Score Write (Points) | 1794 | 958 -47% | 1075 -40% | 819 -54% | 514 -71% | 2256 26% | 1536 ? -14% |
| Score Total (Points) | 4208 | 1711 -59% | 2745 -35% | 2014 -52% | 1663 -60% | 5087 21% | 3633 ? -14% |
| Copy ISO MB/s (MB/s) | 1519 | 3089 | 1043 | 1506 ? | |||
| Copy Program MB/s (MB/s) | 749 | 549 | 371.7 | 410 ? | |||
| Copy Game MB/s (MB/s) | 943 | 1171 | 399.9 | 894 ? | |||
| Média Total (Programa/Configurações) | -30% /
-33% | -7% /
-10% | -31% /
-33% | -31% /
-33% | 12% /
12% | -13% /
-14% |
* ... menor é melhor

| 3DMark | |
| 1280x720 Cloud Gate Standard Graphics | |
| Média da turma Gaming (86886 - 223650, n=62, últimos 2 anos) | |
| CUK Model Z GK5CQ7Z | |
| Asus Strix GL531GV-PB74 | |
| Lenovo Legion Y540-15IRH | |
| Média NVIDIA GeForce GTX 1660 Ti Mobile (59839 - 104780, n=18) | |
| Lenovo Legion Y540-15IRH-81SX00B2GE | |
| HP Gaming Pavilion 15-dk0009ng | |
| Lenovo Legion Y530-15ICH | |
| 1920x1080 Fire Strike Graphics | |
| Média da turma Gaming (12242 - 62849, n=119, últimos 2 anos) | |
| CUK Model Z GK5CQ7Z | |
| Asus Strix GL531GV-PB74 | |
| Lenovo Legion Y540-15IRH | |
| Média NVIDIA GeForce GTX 1660 Ti Mobile (14186 - 16488, n=24) | |
| Lenovo Legion Y540-15IRH-81SX00B2GE | |
| HP Gaming Pavilion 15-dk0009ng | |
| Lenovo Legion Y530-15ICH | |
| 2560x1440 Time Spy Graphics | |
| Média da turma Gaming (5012 - 26212, n=118, últimos 2 anos) | |
| CUK Model Z GK5CQ7Z | |
| Asus Strix GL531GV-PB74 | |
| Média NVIDIA GeForce GTX 1660 Ti Mobile (5335 - 6123, n=22) | |
| HP Gaming Pavilion 15-dk0009ng | |
| 3DMark 11 Performance | 17291 pontos | |
| 3DMark Cloud Gate Standard Score | 32884 pontos | |
| 3DMark Fire Strike Score | 12884 pontos | |
Ajuda | ||
| The Witcher 3 - 1920x1080 Ultra Graphics & Postprocessing (HBAO+) | |
| Média da turma Gaming (95 - 240, n=8, últimos 2 anos) | |
| Asus Strix GL531GV-PB74 | |
| CUK Model Z GK5CQ7Z | |
| Lenovo Legion Y540-15IRH | |
| Média NVIDIA GeForce GTX 1660 Ti Mobile (51.6 - 65.1, n=21) | |
| HP Gaming Pavilion 15-dk0009ng | |
| Lenovo Legion Y540-15IRH-81SX00B2GE | |
| Lenovo Legion Y530-15ICH | |
| Anno 1800 - 1920x1080 Ultra Graphics Quality (DX11) | |
| Média da turma Gaming (n=1últimos 2 anos) | |
| Lenovo Legion Y540-15IRH-81SX00B2GE | |
| Média NVIDIA GeForce GTX 1660 Ti Mobile (31.1 - 54, n=4) | |
| HP Gaming Pavilion 15-dk0009ng | |
| BioShock Infinite | |
| 1920x1080 Ultra Preset, DX11 (DDOF) | |
| CUK Model Z GK5CQ7Z | |
| Asus Strix GL531GV-PB74 | |
| Lenovo Legion Y540-15IRH-81SX00B2GE | |
| Média NVIDIA GeForce GTX 1660 Ti Mobile (121.6 - 144.2, n=14) | |
| HP Gaming Pavilion 15-dk0009ng | |
| Lenovo Legion Y530-15ICH | |
| 1366x768 High Preset | |
| Asus Strix GL531GV-PB74 | |
| CUK Model Z GK5CQ7Z | |
| Média NVIDIA GeForce GTX 1660 Ti Mobile (202 - 275, n=13) | |
| HP Gaming Pavilion 15-dk0009ng | |
| Lenovo Legion Y530-15ICH | |
| baixo | média | alto | ultra | 4K | |
|---|---|---|---|---|---|
| BioShock Infinite (2013) | 138 | ||||
| The Witcher 3 (2015) | 53.1 | ||||
| Dota 2 Reborn (2015) | 137.2 | 130.2 | 121.3 | 118.2 | 85 |
| X-Plane 11.11 (2018) | 117 | 106 | 85 | ||
| Anno 1800 (2019) | 54 |
Barulho
| Ocioso |
| 29.3 / 29.3 / 29.3 dB |
| Carga |
| 35.7 / 45.6 dB |
 | ||
30 dB silencioso 40 dB(A) audível 50 dB(A) ruidosamente alto |
||
min: | ||
(±) A temperatura máxima no lado superior é 42.7 °C / 109 F, em comparação com a média de 40.4 °C / 105 F , variando de 21.2 a 68.8 °C para a classe Gaming.
(-) A parte inferior aquece até um máximo de 52.7 °C / 127 F, em comparação com a média de 43.2 °C / 110 F
(+) Em uso inativo, a temperatura média para o lado superior é 29.6 °C / 85 F, em comparação com a média do dispositivo de 33.9 °C / ### class_avg_f### F.
(±) Jogando The Witcher 3, a temperatura média para o lado superior é 35.2 °C / 95 F, em comparação com a média do dispositivo de 33.9 °C / ## #class_avg_f### F.
(+) Os apoios para as mãos e o touchpad estão atingindo a temperatura máxima da pele (34.8 °C / 94.6 F) e, portanto, não estão quentes.
(-) A temperatura média da área do apoio para as mãos de dispositivos semelhantes foi 28.8 °C / 83.8 F (-6 °C / -10.8 F).
Lenovo Legion Y540-15IRH-81SX00B2GE análise de áudio
(±) | o volume do alto-falante é médio, mas bom (###valor### dB)
Graves 100 - 315Hz
(-) | quase nenhum baixo - em média 17.7% menor que a mediana
(±) | a linearidade dos graves é média (11.6% delta para a frequência anterior)
Médios 400 - 2.000 Hz
(+) | médios equilibrados - apenas 3.7% longe da mediana
(+) | médios são lineares (4.5% delta para frequência anterior)
Altos 2 - 16 kHz
(+) | agudos equilibrados - apenas 3.3% longe da mediana
(+) | os máximos são lineares (5.9% delta da frequência anterior)
Geral 100 - 16.000 Hz
(±) | a linearidade do som geral é média (18.1% diferença em relação à mediana)
Comparado com a mesma classe
» 57% de todos os dispositivos testados nesta classe foram melhores, 8% semelhantes, 35% piores
» O melhor teve um delta de 6%, a média foi 18%, o pior foi 132%
Comparado com todos os dispositivos testados
» 38% de todos os dispositivos testados foram melhores, 8% semelhantes, 54% piores
» O melhor teve um delta de 4%, a média foi 24%, o pior foi 134%
Apple MacBook 12 (Early 2016) 1.1 GHz análise de áudio
(+) | os alto-falantes podem tocar relativamente alto (###valor### dB)
Graves 100 - 315Hz
(±) | graves reduzidos - em média 11.3% menor que a mediana
(±) | a linearidade dos graves é média (14.2% delta para a frequência anterior)
Médios 400 - 2.000 Hz
(+) | médios equilibrados - apenas 2.4% longe da mediana
(+) | médios são lineares (5.5% delta para frequência anterior)
Altos 2 - 16 kHz
(+) | agudos equilibrados - apenas 2% longe da mediana
(+) | os máximos são lineares (4.5% delta da frequência anterior)
Geral 100 - 16.000 Hz
(+) | o som geral é linear (10.2% diferença em relação à mediana)
Comparado com a mesma classe
» 7% de todos os dispositivos testados nesta classe foram melhores, 2% semelhantes, 91% piores
» O melhor teve um delta de 5%, a média foi 18%, o pior foi 53%
Comparado com todos os dispositivos testados
» 5% de todos os dispositivos testados foram melhores, 1% semelhantes, 94% piores
» O melhor teve um delta de 4%, a média foi 24%, o pior foi 134%
| desligado | |
| Ocioso | |
| Carga |
|
Key:
min: | |
| Lenovo Legion Y540-15IRH-81SX00B2GE i7-9750H, GeForce GTX 1660 Ti Mobile, WDC PC SN720 SDAPNTW-512G, IPS, 1920x1080, 15.6" | Asus Strix GL531GV-PB74 i7-9750H, GeForce RTX 2060 Mobile, Intel SSD 660p SSDPEKNW512G8, IPS, 1920x1080, 15.6" | CUK Model Z GK5CQ7Z i7-9750H, GeForce RTX 2070 Max-Q, Intel SSD 660p 2TB SSDPEKNW020T8, IPS, 1920x1080, 15.6" | HP Gaming Pavilion 15-dk0009ng i7-9750H, GeForce GTX 1660 Ti Max-Q, Samsung SSD PM981 MZVLB256HAHQ, IPS, 1920x1080, 15.6" | Lenovo Legion Y530-15ICH i7-8750H, GeForce GTX 1060 Mobile, Samsung SSD PM981 MZVLB256HAHQ, IPS, 1920x1080, 15.6" | Lenovo Legion Y540-15IRH i7-9750H, GeForce RTX 2060 Mobile, Samsung PM981a MZVLB1T0HBLR, IPS, 1920x1080, 15.6" | Média NVIDIA GeForce GTX 1660 Ti Mobile | Média da turma Gaming | |
|---|---|---|---|---|---|---|---|---|
| Power Consumption | -13% | -34% | 24% | 22% | -14% | -3% | -14% | |
| Idle Minimum * (Watt) | 14.5 | 10.9 25% | 23.5 -62% | 6.8 53% | 7.3 50% | 15 -3% | 12.4 ? 14% | 13.2 ? 9% |
| Idle Average * (Watt) | 18.5 | 14.7 21% | 28 -51% | 10.7 42% | 11.1 40% | 20 -8% | 18 ? 3% | 18.9 ? -2% |
| Idle Maximum * (Watt) | 20 | 32.4 -62% | 32 -60% | 12.5 37% | 12.6 37% | 33 -65% | 25.3 ? -27% | 24.3 ? -22% |
| Load Average * (Watt) | 81.6 | 121.9 -49% | 102.4 -25% | 87.2 -7% | 109 -34% | 88 -8% | 93.5 ? -15% | 108.3 ? -33% |
| Witcher 3 ultra * (Watt) | 132 | 143.5 -9% | 142.8 -8% | 121 8% | 128 3% | |||
| Load Maximum * (Watt) | 208.1 | 209.6 -1% | 209 -0% | 191.4 8% | 168 19% | 213 -2% | 191.9 ? 8% | 254 ? -22% |
* ... menor é melhor
| Lenovo Legion Y540-15IRH-81SX00B2GE i7-9750H, GeForce GTX 1660 Ti Mobile, 57 Wh | Asus Strix GL531GV-PB74 i7-9750H, GeForce RTX 2060 Mobile, 66 Wh | CUK Model Z GK5CQ7Z i7-9750H, GeForce RTX 2070 Max-Q, 46.74 Wh | HP Gaming Pavilion 15-dk0009ng i7-9750H, GeForce GTX 1660 Ti Max-Q, 52.5 Wh | Lenovo Legion Y530-15ICH i7-8750H, GeForce GTX 1060 Mobile, 52 Wh | Lenovo Legion Y540-15IRH i7-9750H, GeForce RTX 2060 Mobile, 57 Wh | Média da turma Gaming | |
|---|---|---|---|---|---|---|---|
| Duração da bateria | -21% | 25% | 72% | 32% | 5% | 108% | |
| Reader / Idle (h) | 4 | 8.7 117% | 8.3 108% | 3.9 -2% | 8.71 ? 118% | ||
| WiFi v1.3 (h) | 2.4 | 1.9 -21% | 3 25% | 4.8 100% | 3.8 58% | 3.2 33% | 7.04 ? 193% |
| Load (h) | 1.3 | 1.3 0% | 0.4 -69% | 1.1 -15% | 1.47 ? 13% | ||
| Witcher 3 ultra (h) | 1 |
Pro
Contra
O Lenovo Legion Y540-15IRH continua sendo um poderoso portátil para jogos que pode rodar todos os jogos modernos triplo A em 1080p, apesar da mudança para uma GPU GeForce GTX 1660 Ti. Enquanto a placa não suporta DLSS ou “ray tracing” como a RTX 2060, a última não é poderosa o suficiente para utilizar completamente estas novas tecnologias, então você não perderia recursos escolhendo a GTX 1660 Ti sobre a RTX 2060.
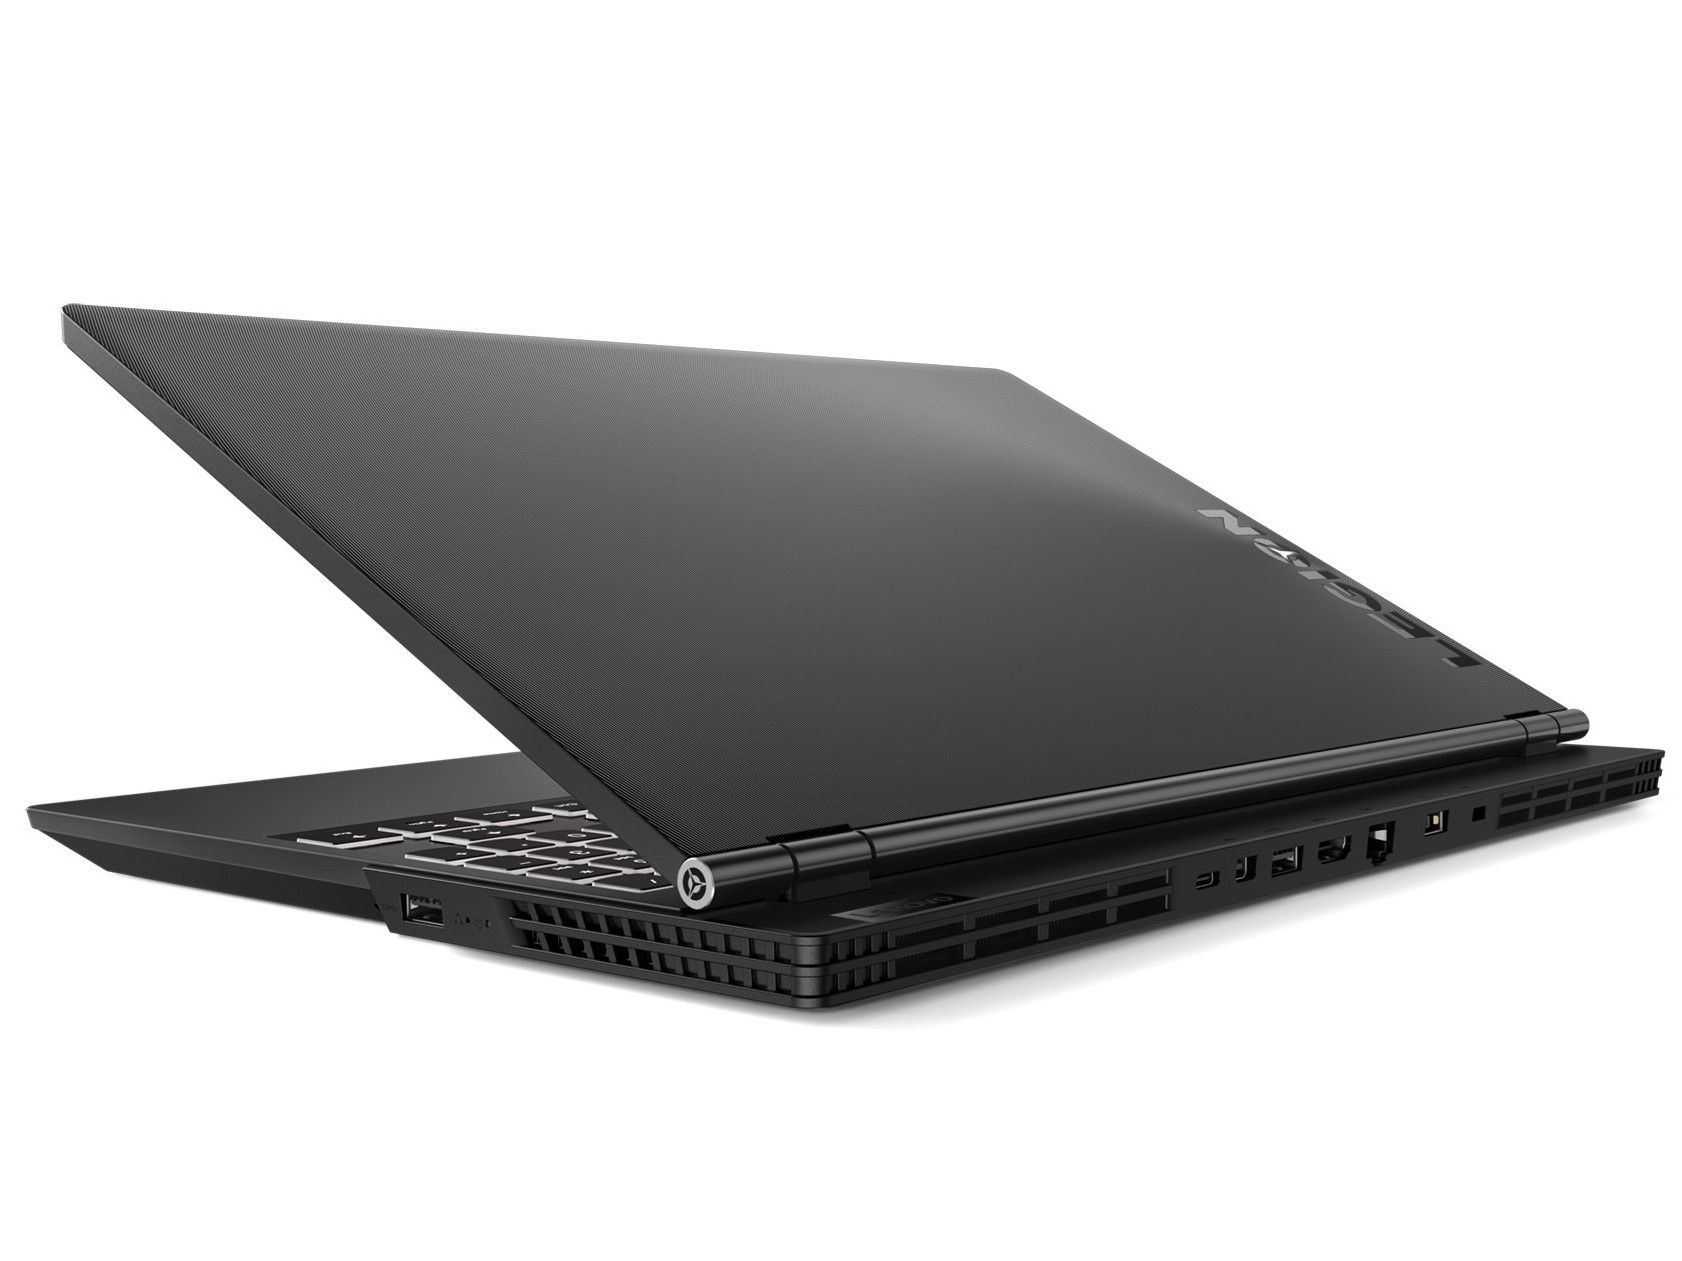
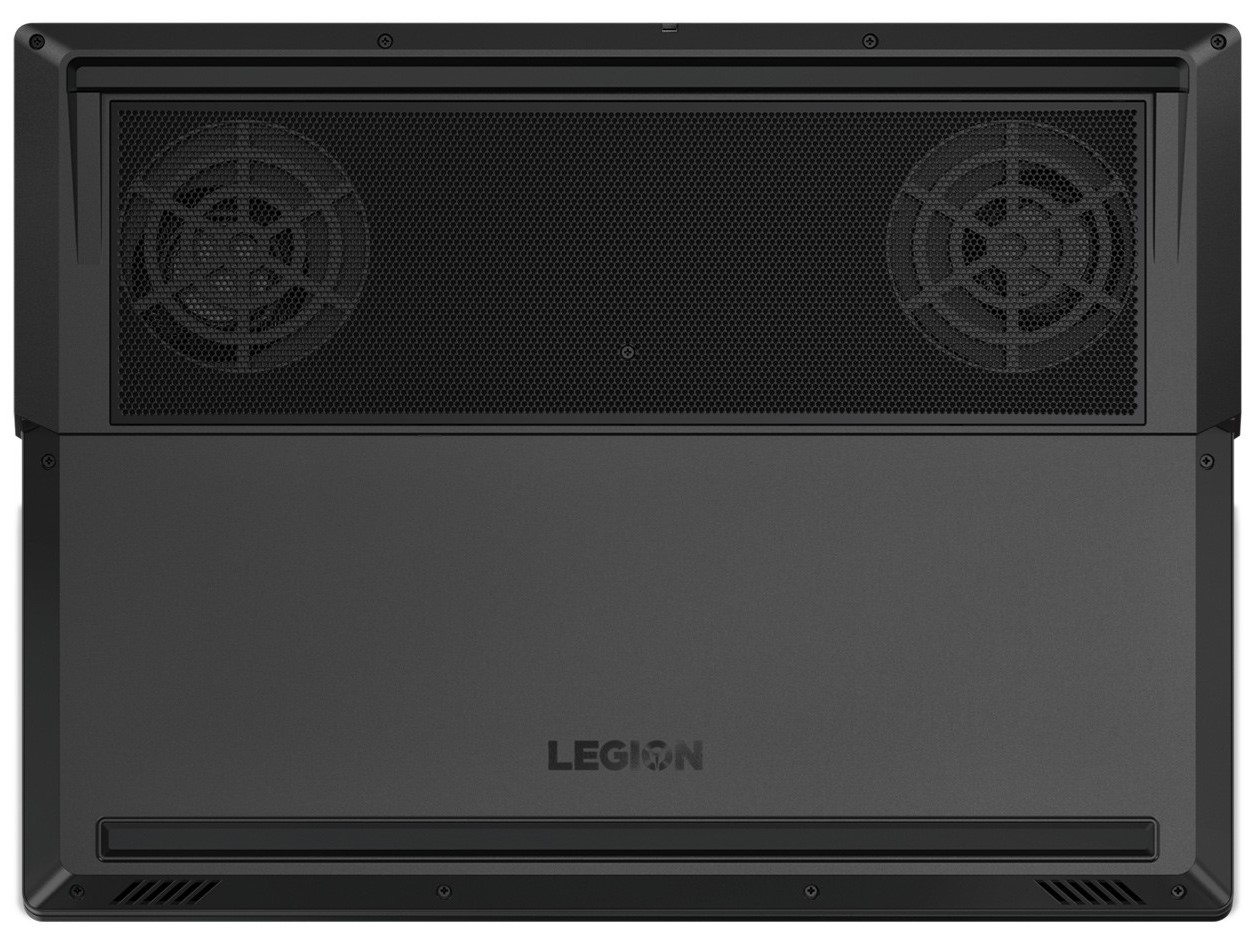
Resumindo, o Y540-15IRH é um portátil de jogos de gama média que pode manter o seu potencial durante períodos prolongados graças ao seu sistema de resfriamento decente. O dispositivo também possui boas opções de manutenção e uma baia de unidade de 2,5 polegadas, caso você precise de armazenamento adicional.
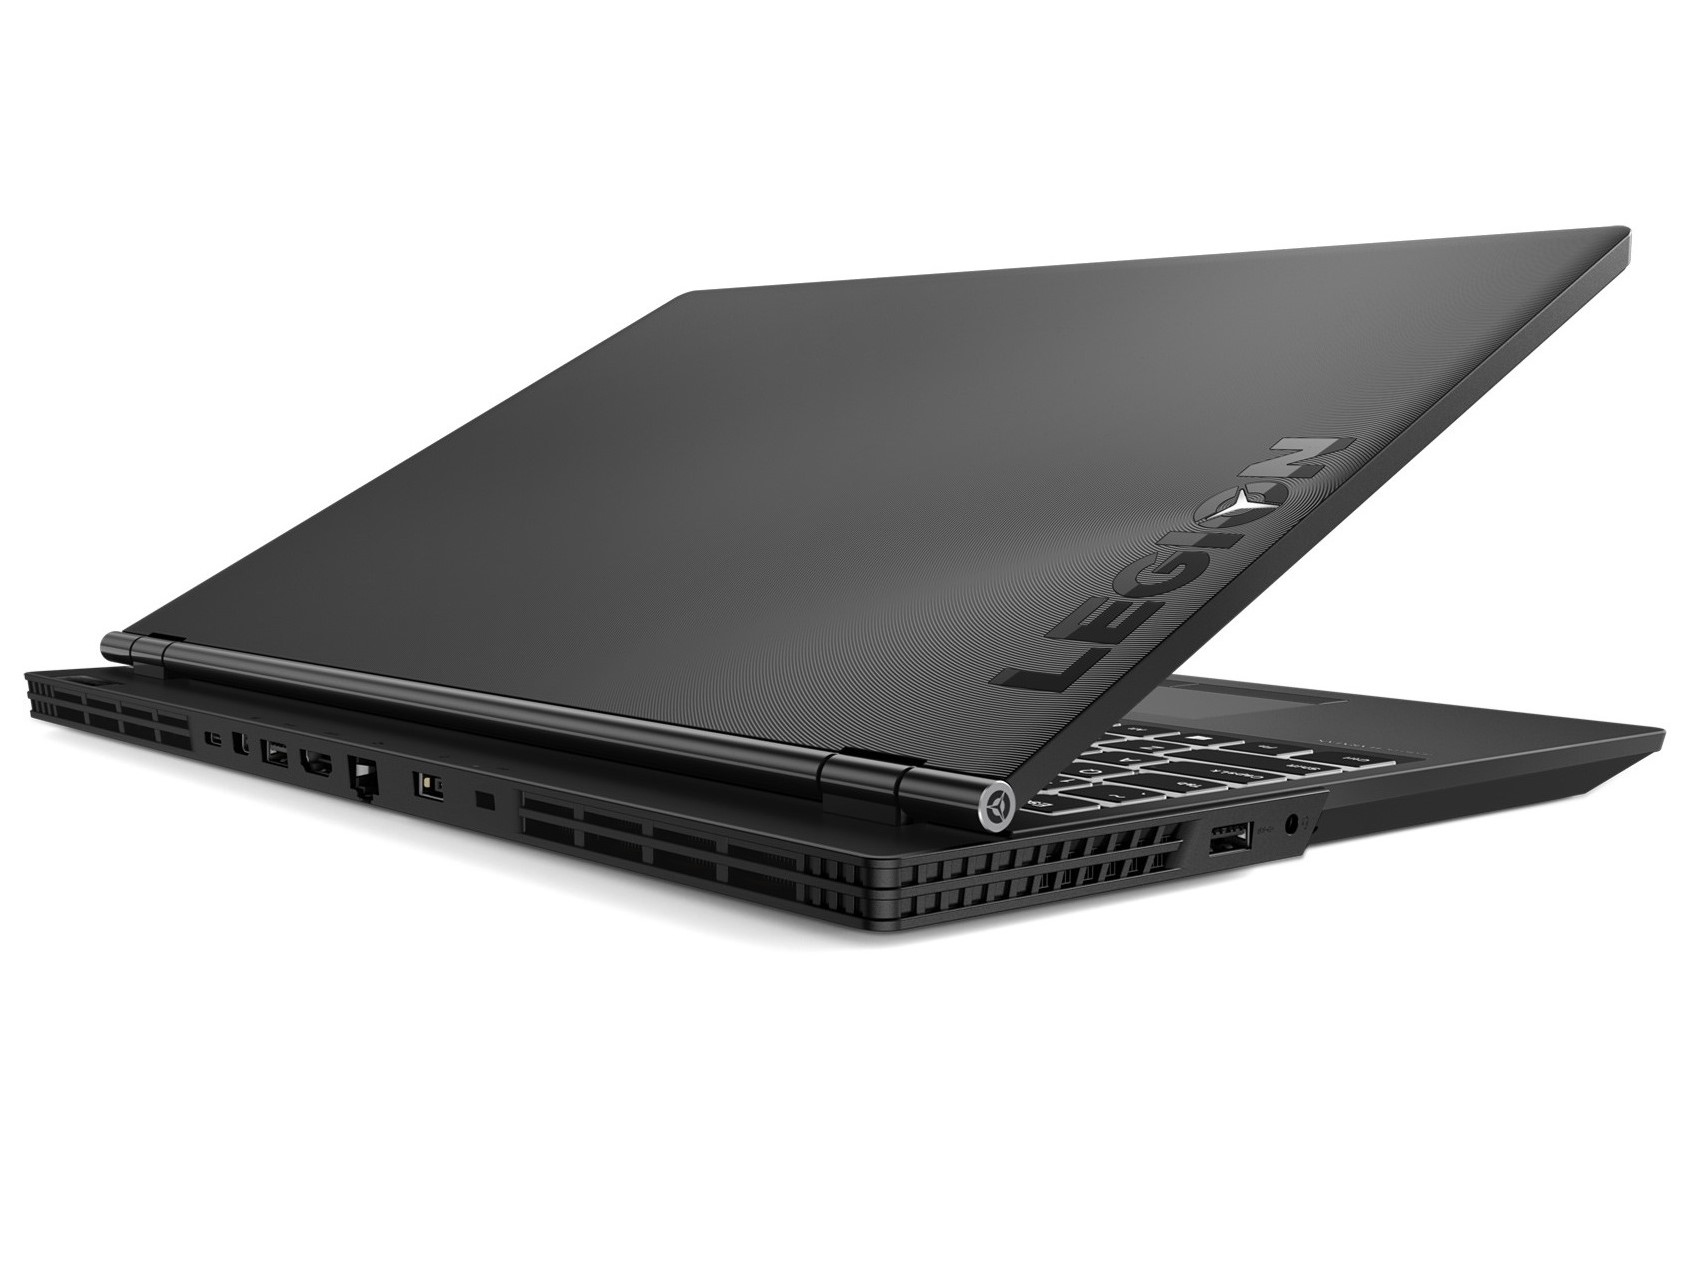
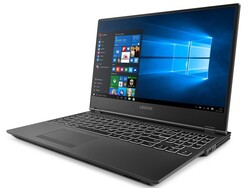
O Lenovo Legion Y540-15IRH-81SX00B2GE é um poderoso portátil de jogos, apesar da ausência de gráficos RTX.
A principal estranheza sobre o Y540-15IRH é a decisão da Lenovo de desativar a GPU integrada por padrão, o que deixa a GTX 1660 Ti permanentemente ativa. Correspondentemente, nossa unidade de teste tem uma duração de bateria ruim com as configurações de fábrica, mas é possível ativar a GPU integrada no BIOS, o que melhora drasticamente as durações. Impraticabilidades à parte, o Lenovo Legion Y540-15IRH é um excelente dispositivo pelo seu valor e um que recomendamos se você estiver no mercado procurando por um portátil de jogos de 15,6 polegadas.
Lenovo Legion Y540-15IRH-81SX00B2GE
- 05/15/2020 v7 (old)
Mike Wobker
Price comparison
