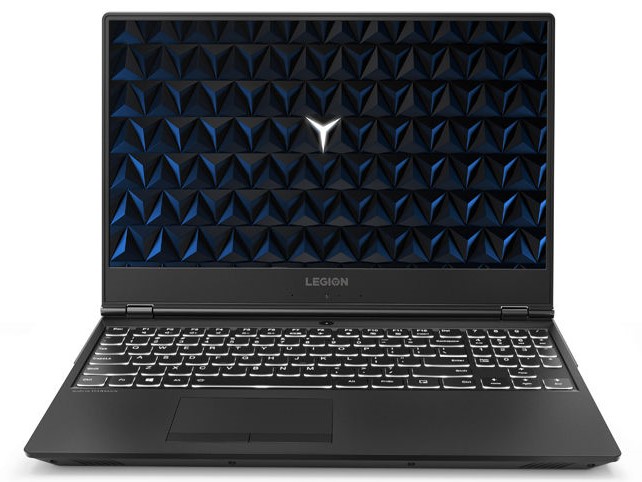
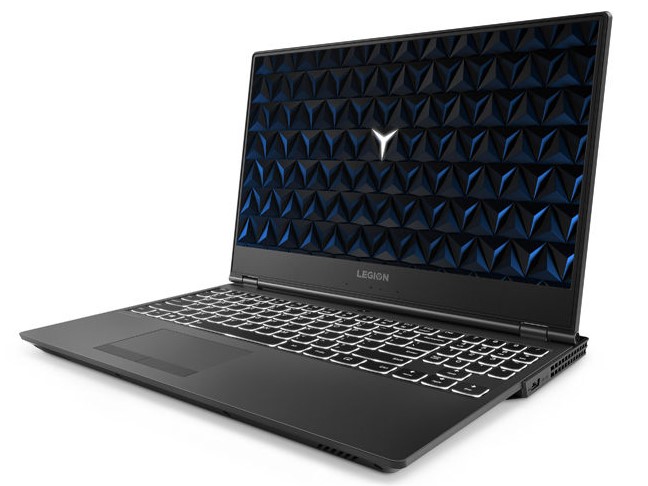
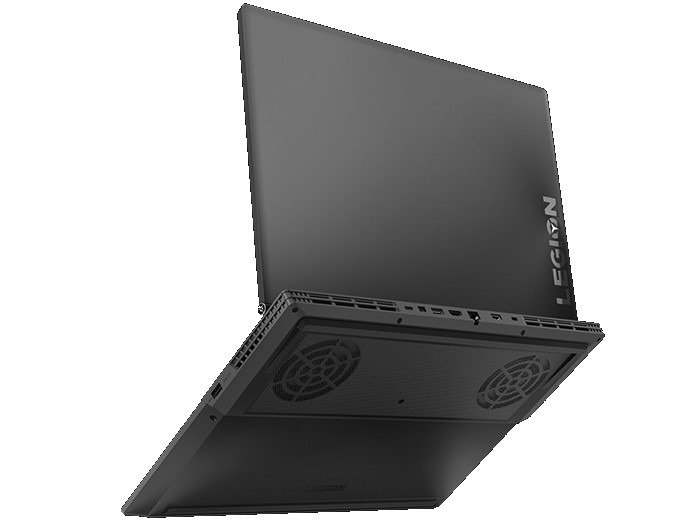
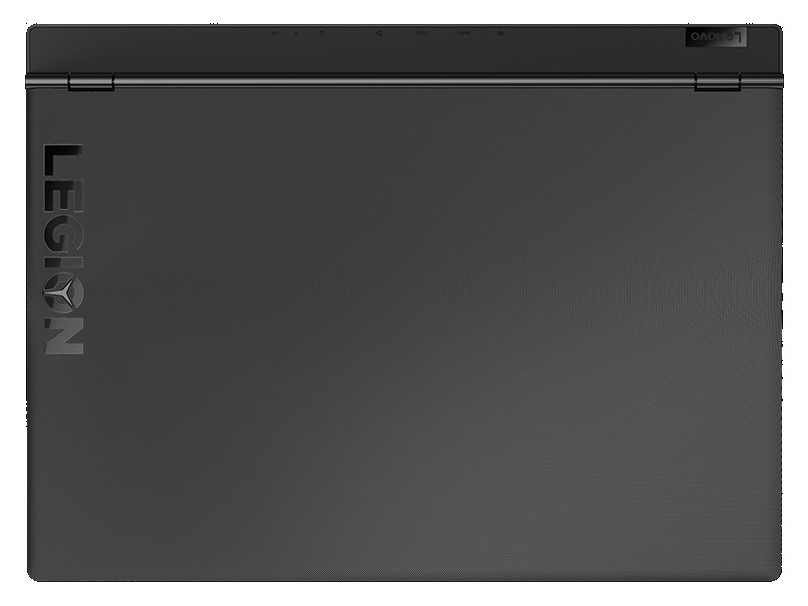
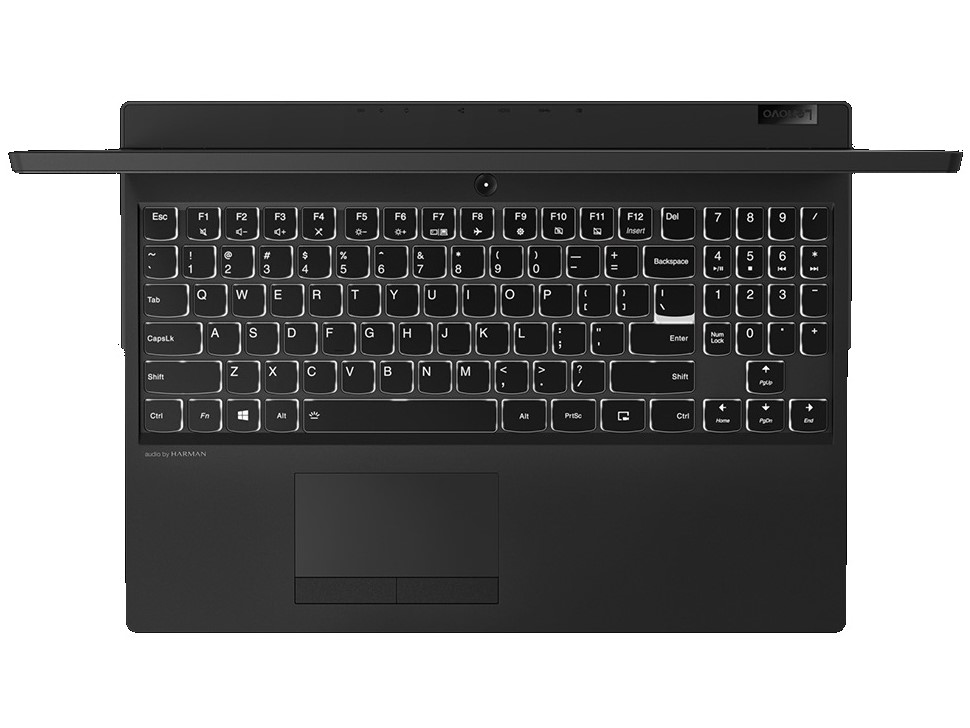
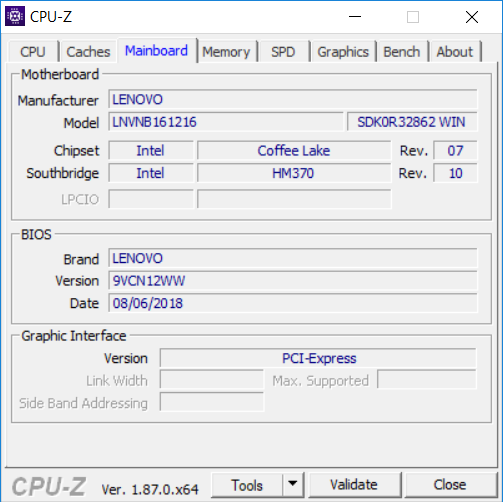
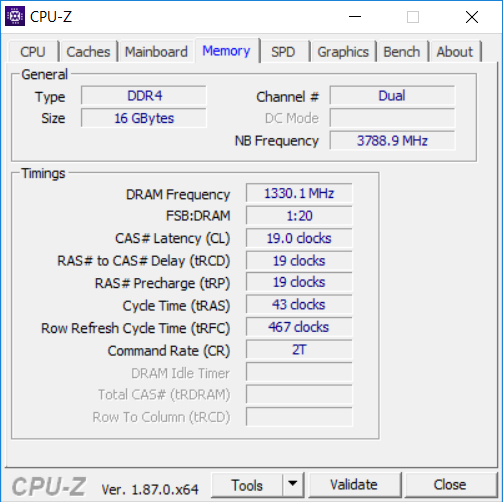
Breve Análise do Portátil Lenovo Legion Y530 (i7-8750H, GTX1060)


| Networking | |
| iperf3 transmit AX12 | |
| HP Pavilion Gaming 15-cx0003ng | |
| Razer Blade 15 Base Model | |
| Lenovo Legion Y7000P-1060 | |
| Medion Erazer P6705-MD61131 | |
| Lenovo Legion Y530-15ICH | |
| Lenovo Legion Y530-15ICH | |
| iperf3 receive AX12 | |
| Medion Erazer P6705-MD61131 | |
| Razer Blade 15 Base Model | |
| Lenovo Legion Y530-15ICH | |
| Lenovo Legion Y7000P-1060 | |
| HP Pavilion Gaming 15-cx0003ng | |
| MSI P65 8RF-451 - Creator | |
| Lenovo Legion Y530-15ICH | |
| |||||||||||||||||||||||||
iluminação: 83 %
iluminação com acumulador: 308 cd/m²
Contraste: 587:1 (Preto: 0.52 cd/m²)
ΔE ColorChecker Calman: 3.63 | ∀{0.5-29.43 Ø4.71}
calibrated: 1.31
ΔE Greyscale Calman: 4.77 | ∀{0.09-98 Ø4.96}
93% sRGB (Argyll 1.6.3 3D)
59% AdobeRGB 1998 (Argyll 1.6.3 3D)
63.8% AdobeRGB 1998 (Argyll 3D)
93% sRGB (Argyll 3D)
62.5% Display P3 (Argyll 3D)
Gamma: 2.54
CCT: 7500 K
| Lenovo Legion Y530-15ICH LG Display LP156WFG-SPB2, , 1920x1080, 15.6" | HP Pavilion Gaming 15-cx0003ng BOE07A1, , 1920x1080, 15.6" | Lenovo Legion Y7000P-1060 BOE NV156FHM-N61, , 1920x1080, 15.6" | Medion Erazer P6705-MD61131 AU Optronics B156HTN03.8 (AUO38ED), , 1920x1080, 15.6" | MSI P65 8RF-451 - Creator AU Optronics B156HAN08.0 (AUO80ED), , 1920x1080, 15.6" | Razer Blade 15 Base Model BOE NV156FHM-N61, , 1920x1080, 15.6" | Lenovo Legion Y530-15ICH B156HAN02.1, , 1920x1080, 15.6" | |
|---|---|---|---|---|---|---|---|
| Display | -36% | -1% | -41% | 2% | -1% | -38% | |
| Display P3 Coverage (%) | 62.5 | 39.72 -36% | 66.1 6% | 36.4 -42% | 65.1 4% | 66.3 6% | 38.31 -39% |
| sRGB Coverage (%) | 93 | 59.3 -36% | 86.4 -7% | 54.8 -41% | 91.1 -2% | 86.6 -7% | 57.3 -38% |
| AdobeRGB 1998 Coverage (%) | 63.8 | 41.04 -36% | 63.1 -1% | 37.61 -41% | 65.9 3% | 63.3 -1% | 39.58 -38% |
| Response Times | -198% | -206% | -122% | -4% | -191% | -193% | |
| Response Time Grey 50% / Grey 80% * (ms) | 15 ? | 47 ? -213% | 42.8 ? -185% | 44.8 ? -199% | 16 ? -7% | 39.2 ? -161% | 43.6 ? -191% |
| Response Time Black / White * (ms) | 11 ? | 31 ? -182% | 36 ? -227% | 16 ? -45% | 11 ? -0% | 35.2 ? -220% | 32.4 ? -195% |
| PWM Frequency (Hz) | 208 ? | 21740 ? | 21190 ? | ||||
| Screen | 7% | -17% | -71% | -5% | -5% | -36% | |
| Brightness middle (cd/m²) | 305 | 241 -21% | 312.9 3% | 200 -34% | 235 -23% | 273.6 -10% | 282.8 -7% |
| Brightness (cd/m²) | 284 | 236 -17% | 296 4% | 186 -35% | 235 -17% | 262 -8% | 264 -7% |
| Brightness Distribution (%) | 83 | 75 -10% | 88 6% | 85 2% | 85 2% | 86 4% | 88 6% |
| Black Level * (cd/m²) | 0.52 | 0.15 71% | 0.37 29% | 0.43 17% | 0.22 58% | 0.3 42% | 0.42 19% |
| Contrast (:1) | 587 | 1607 174% | 846 44% | 465 -21% | 1068 82% | 912 55% | 673 15% |
| Colorchecker dE 2000 * | 3.63 | 4.85 -34% | 5.49 -51% | 11.39 -214% | 2.82 22% | 3.22 11% | 4.93 -36% |
| Colorchecker dE 2000 max. * | 8.18 | 8.82 -8% | 8.78 -7% | 19.36 -137% | 4.82 41% | 7.61 7% | 17.65 -116% |
| Colorchecker dE 2000 calibrated * | 1.31 | 3.99 -205% | 3.05 -133% | 4.88 -273% | 4.1 -213% | 4.07 -211% | |
| Greyscale dE 2000 * | 4.77 | 5.15 -8% | 4.7 1% | 11.73 -146% | 2.32 51% | 1.4 71% | 3.8 20% |
| Gamma | 2.54 87% | 2.49 88% | 2.29 96% | 1.97 112% | 2.49 88% | 2.24 98% | 2.449 90% |
| CCT | 7500 87% | 7042 92% | 6779 96% | 12614 52% | 6310 103% | 6636 98% | 6112 106% |
| Color Space (Percent of AdobeRGB 1998) (%) | 59 | 38 -36% | 56.3 -5% | 35 -41% | 59 0% | 56.4 -4% | 36 -39% |
| Color Space (Percent of sRGB) (%) | 93 | 59 -37% | 86.1 -7% | 55 -41% | 92 -1% | 86.2 -7% | 57 -39% |
| Média Total (Programa/Configurações) | -76% /
-29% | -75% /
-38% | -78% /
-72% | -2% /
-4% | -66% /
-27% | -89% /
-56% |
* ... menor é melhor
Exibir tempos de resposta
| ↔ Tempo de resposta preto para branco | ||
|---|---|---|
| 11 ms ... ascensão ↗ e queda ↘ combinadas | ↗ 7 ms ascensão | 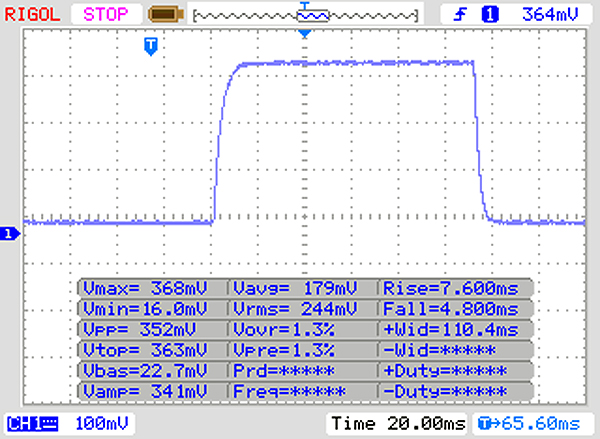 |
| ↘ 4 ms queda | ||
| A tela mostra boas taxas de resposta em nossos testes, mas pode ser muito lenta para jogadores competitivos. Em comparação, todos os dispositivos testados variam de 0.1 (mínimo) a 240 (máximo) ms. » 30 % de todos os dispositivos são melhores. Isso significa que o tempo de resposta medido é melhor que a média de todos os dispositivos testados (19.8 ms). | ||
| ↔ Tempo de resposta 50% cinza a 80% cinza | ||
| 15 ms ... ascensão ↗ e queda ↘ combinadas | ↗ 8 ms ascensão | 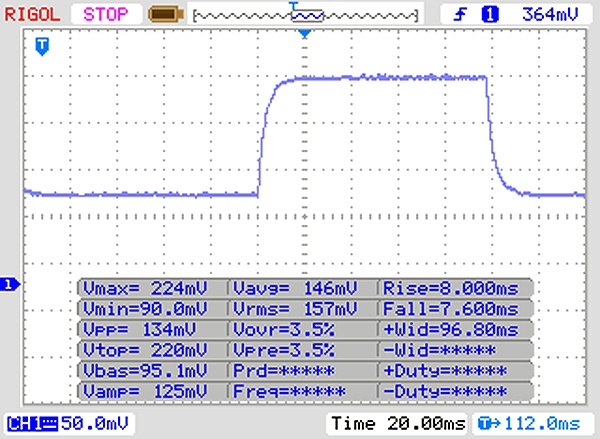 |
| ↘ 7 ms queda | ||
| A tela mostra boas taxas de resposta em nossos testes, mas pode ser muito lenta para jogadores competitivos. Em comparação, todos os dispositivos testados variam de 0.165 (mínimo) a 636 (máximo) ms. » 29 % de todos os dispositivos são melhores. Isso significa que o tempo de resposta medido é melhor que a média de todos os dispositivos testados (31 ms). | ||
Cintilação da tela / PWM (modulação por largura de pulso)
| Tela tremeluzindo / PWM não detectado | 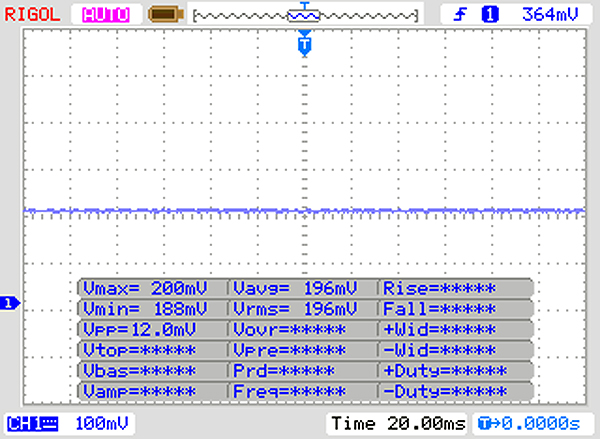 | ||
[pwm_comparison] Em comparação: 52 % de todos os dispositivos testados não usam PWM para escurecer a tela. Se PWM foi detectado, uma média de 7754 (mínimo: 5 - máximo: 343500) Hz foi medida. | |||


| PCMark 8 Home Score Accelerated v2 | 4440 pontos | |
| PCMark 8 Work Score Accelerated v2 | 5543 pontos | |
| PCMark 10 Score | 5125 pontos | |
Ajuda | ||
| Lenovo Legion Y530-15ICH Samsung SSD PM981 MZVLB256HAHQ | HP Pavilion Gaming 15-cx0003ng Intel Optane 16 GB MEMPEK1J016GAH + HGST HTS721010A9E630 1 TB HDD | Lenovo Legion Y7000P-1060 Samsung SSD PM981 MZVLB256HAHQ | Medion Erazer P6705-MD61131 Samsung SSD PM981 MZVLB256HAHQ | MSI P65 8RF-451 - Creator Kingston RBUSNS8154P3512GJ | Razer Blade 15 Base Model Samsung SSD PM981 MZVLB256HAHQ | Lenovo Legion Y530-15ICH Toshiba KBG30ZMT128G | Média Samsung SSD PM981 MZVLB256HAHQ | |
|---|---|---|---|---|---|---|---|---|
| CrystalDiskMark 5.2 / 6 | -31% | -8% | 11% | -16% | 9% | -46% | 58% | |
| Write 4K (MB/s) | 108.9 | 59.2 -46% | 92.3 -15% | 107 -2% | 89.2 -18% | 112.5 3% | 71.8 -34% | 116.1 ? 7% |
| Read 4K (MB/s) | 40.23 | 91.3 127% | 39.04 -3% | 39.91 -1% | 34.36 -15% | 43.09 7% | 41.03 2% | 189.5 ? 371% |
| Write Seq (MB/s) | 1390 | 158.3 -89% | 1218 -12% | 1439 4% | 949 -32% | 1450 4% | 349 -75% | 1409 ? 1% |
| Read Seq (MB/s) | 964 | 880 -9% | 755 -22% | 2011 109% | 899 -7% | 1392 44% | 736 -24% | 1624 ? 68% |
| Write 4K Q32T1 (MB/s) | 314.2 | 161.8 -49% | 280.7 -11% | 282.1 -10% | 371.4 18% | 356.1 13% | 105.3 -66% | 360 ? 15% |
| Read 4K Q32T1 (MB/s) | 369.2 | 286.5 -22% | 328 -11% | 326.6 -12% | 399 8% | 406.9 10% | 308 -17% | 396 ? 7% |
| Write Seq Q32T1 (MB/s) | 1506 | 159.8 -89% | 1698 13% | 1441 -4% | 1035 -31% | 1451 -4% | 151.4 -90% | 1492 ? -1% |
| Read Seq Q32T1 (MB/s) | 3446 | 929 -73% | 3430 0% | 3516 2% | 1603 -53% | 3272 -5% | 1262 -63% | 3313 ? -4% |
| Write 4K Q8T8 (MB/s) | 760 | 1152 ? | ||||||
| Read 4K Q8T8 (MB/s) | 811 | 736 ? | ||||||
| AS SSD | -1631% | 60% | 19% | 11% | 58% | -160% | 50% | |
| Seq Read (MB/s) | 1808 | 854 -53% | 864 -52% | 2724 51% | 850 -53% | 1803 0% | 1231 -32% | 2032 ? 12% |
| Seq Write (MB/s) | 1429 | 147 -90% | 1646 15% | 1365 -4% | 869 -39% | 1367 -4% | 131.6 -91% | 1339 ? -6% |
| 4K Read (MB/s) | 46.1 | 105.1 128% | 32.4 -30% | 46.14 0% | 36.43 -21% | 40.75 -12% | 38.71 -16% | 46.1 ? 0% |
| 4K Write (MB/s) | 97 | 59.5 -39% | 88 -9% | 102.6 6% | 84.4 -13% | 93 -4% | 35.74 -63% | 107.4 ? 11% |
| 4K-64 Read (MB/s) | 536 | 42.09 -92% | 770 44% | 567 6% | 839 57% | 749 40% | 335.3 -37% | 712 ? 33% |
| 4K-64 Write (MB/s) | 273.6 | 137.3 -50% | 1392 409% | 459.8 68% | 602 120% | 1270 364% | 78.9 -71% | 999 ? 265% |
| Access Time Read * (ms) | 0.085 | 14.99 -17535% | 0.103 -21% | 0.08 6% | 0.104 -22% | 0.113 -33% | 0.626 -636% | 0.07076 ? 17% |
| Access Time Write * (ms) | 0.038 | 0.043 -13% | 0.044 -16% | 0.037 3% | 0.044 -16% | 0.04 -5% | 0.287 -655% | 0.04352 ? -15% |
| Score Read (Points) | 763 | 233 -69% | 888 16% | 886 16% | 960 26% | 970 27% | 497 -35% | 961 ? 26% |
| Score Write (Points) | 514 | 211 -59% | 1644 220% | 699 36% | 773 50% | 1499 192% | 128 -75% | 1240 ? 141% |
| Score Total (Points) | 1663 | 577 -65% | 3032 82% | 1983 19% | 2233 34% | 2952 78% | 838 -50% | 2671 ? 61% |
| Copy ISO MB/s (MB/s) | 110.1 | 1677 | 840 | 1892 | 1297 ? | |||
| Copy Program MB/s (MB/s) | 94.1 | 764 | 306.9 | 495.5 | 409 ? | |||
| Copy Game MB/s (MB/s) | 81.7 | 1298 | 622 | 1070 | 786 ? | |||
| Média Total (Programa/Configurações) | -831% /
-957% | 26% /
31% | 15% /
15% | -3% /
-0% | 34% /
38% | -103% /
-112% | 54% /
53% |
* ... menor é melhor

| 3DMark 11 - 1280x720 Performance GPU | |
| Média da turma Gaming (21841 - 80022, n=104, últimos 2 anos) | |
| MSI P65 8RF-451 - Creator | |
| Média NVIDIA GeForce GTX 1060 Mobile (12620 - 15607, n=77) | |
| Lenovo Legion Y530-15ICH | |
| Lenovo Legion Y7000P-1060 | |
| Razer Blade 15 Base Model | |
| Lenovo Legion Y530-15ICH | |
| Medion Erazer P6705-MD61131 | |
| HP Pavilion Gaming 15-cx0003ng | |
| 3DMark 11 Performance | 13743 pontos | |
| 3DMark Cloud Gate Standard Score | 34124 pontos | |
| 3DMark Fire Strike Score | 10389 pontos | |
Ajuda | ||
| The Witcher 3 | |
| 1920x1080 High Graphics & Postprocessing (Nvidia HairWorks Off) | |
| Média da turma Gaming (341 - 404, n=2, últimos 2 anos) | |
| MSI P65 8RF-451 - Creator | |
| Lenovo Legion Y530-15ICH | |
| Lenovo Legion Y7000P-1060 | |
| Razer Blade 15 Base Model | |
| Média NVIDIA GeForce GTX 1060 Mobile (52.6 - 80.6, n=49) | |
| Medion Erazer P6705-MD61131 | |
| HP Pavilion Gaming 15-cx0003ng | |
| 1920x1080 Ultra Graphics & Postprocessing (HBAO+) | |
| Média da turma Gaming (104.7 - 240, n=7, últimos 2 anos) | |
| MSI P65 8RF-451 - Creator | |
| Lenovo Legion Y530-15ICH | |
| Média NVIDIA GeForce GTX 1060 Mobile (24 - 42.3, n=60) | |
| Razer Blade 15 Base Model | |
| Lenovo Legion Y530-15ICH | |
| Lenovo Legion Y7000P-1060 | |
| Medion Erazer P6705-MD61131 | |
| HP Pavilion Gaming 15-cx0003ng | |
| baixo | média | alto | ultra | |
|---|---|---|---|---|
| BioShock Infinite (2013) | 280.5 | 232.6 | 224.8 | 114.2 |
| Thief (2014) | 98.4 | 77.9 | ||
| The Witcher 3 (2015) | 78 | 41.4 | ||
| Rise of the Tomb Raider (2016) | 64.8 |
Barulho
| Ocioso |
| 30.9 / 30.9 / 31.6 dB |
| HDD |
| 31.3 dB |
| Carga |
| 42.3 / 40 dB |
 | ||
30 dB silencioso 40 dB(A) audível 50 dB(A) ruidosamente alto |
||
min: | ||
(-) A temperatura máxima no lado superior é 48.4 °C / 119 F, em comparação com a média de 40.4 °C / 105 F , variando de 21.2 a 68.8 °C para a classe Gaming.
(-) A parte inferior aquece até um máximo de 48 °C / 118 F, em comparação com a média de 43.2 °C / 110 F
(+) Em uso inativo, a temperatura média para o lado superior é 25.8 °C / 78 F, em comparação com a média do dispositivo de 33.9 °C / ### class_avg_f### F.
(+) Os apoios para as mãos e o touchpad são mais frios que a temperatura da pele, com um máximo de 29.6 °C / 85.3 F e, portanto, são frios ao toque.
(±) A temperatura média da área do apoio para as mãos de dispositivos semelhantes foi 28.8 °C / 83.8 F (-0.8 °C / -1.5 F).
Lenovo Legion Y530-15ICH análise de áudio
(-) | alto-falantes não muito altos (###valor### dB)
Graves 100 - 315Hz
(±) | graves reduzidos - em média 11.5% menor que a mediana
(+) | o baixo é linear (6.4% delta para a frequência anterior)
Médios 400 - 2.000 Hz
(±) | médios mais altos - em média 5% maior que a mediana
(+) | médios são lineares (6.9% delta para frequência anterior)
Altos 2 - 16 kHz
(+) | agudos equilibrados - apenas 3% longe da mediana
(+) | os máximos são lineares (4.6% delta da frequência anterior)
Geral 100 - 16.000 Hz
(±) | a linearidade do som geral é média (16% diferença em relação à mediana)
Comparado com a mesma classe
» 38% de todos os dispositivos testados nesta classe foram melhores, 6% semelhantes, 55% piores
» O melhor teve um delta de 6%, a média foi 18%, o pior foi 132%
Comparado com todos os dispositivos testados
» 25% de todos os dispositivos testados foram melhores, 5% semelhantes, 69% piores
» O melhor teve um delta de 4%, a média foi 23%, o pior foi 134%
| desligado | |
| Ocioso | |
| Carga |
|
Key:
min: | |
| Lenovo Legion Y530-15ICH i7-8750H, GeForce GTX 1060 Mobile, Samsung SSD PM981 MZVLB256HAHQ, IPS, 1920x1080, 15.6" | HP Pavilion Gaming 15-cx0003ng i7-8750H, GeForce GTX 1050 Ti Mobile, Intel Optane 16 GB MEMPEK1J016GAH + HGST HTS721010A9E630 1 TB HDD, IPS, 1920x1080, 15.6" | Lenovo Legion Y7000P-1060 i7-8750H, GeForce GTX 1060 Mobile, Samsung SSD PM981 MZVLB256HAHQ, IPS, 1920x1080, 15.6" | Medion Erazer P6705-MD61131 i7-8750H, GeForce GTX 1050 Ti Mobile, Samsung SSD PM981 MZVLB256HAHQ, TN, 1920x1080, 15.6" | MSI P65 8RF-451 - Creator i7-8750H, GeForce GTX 1070 Max-Q, Kingston RBUSNS8154P3512GJ, IPS, 1920x1080, 15.6" | Razer Blade 15 Base Model i7-8750H, GeForce GTX 1060 Max-Q, Samsung SSD PM981 MZVLB256HAHQ, IPS, 1920x1080, 15.6" | Lenovo Legion Y530-15ICH i5-8300H, GeForce GTX 1050 Ti Mobile, Toshiba KBG30ZMT128G, IPS, 1920x1080, 15.6" | Média NVIDIA GeForce GTX 1060 Mobile | Média da turma Gaming | |
|---|---|---|---|---|---|---|---|---|---|
| Power Consumption | 16% | 5% | 27% | -6% | -14% | 16% | -36% | -60% | |
| Idle Minimum * (Watt) | 7.3 | 5.5 25% | 4.9 33% | 4 45% | 7.4 -1% | 10.2 -40% | 4.5 38% | 12.7 ? -74% | 13 ? -78% |
| Idle Average * (Watt) | 11.1 | 8.5 23% | 8.1 27% | 7 37% | 11.7 -5% | 13.2 -19% | 10 10% | 17.5 ? -58% | 19 ? -71% |
| Idle Maximum * (Watt) | 12.6 | 11.9 6% | 16.5 -31% | 11 13% | 16.8 -33% | 17.6 -40% | 13.8 -10% | 21.8 ? -73% | 24.6 ? -95% |
| Load Average * (Watt) | 109 | 94 14% | 109.2 -0% | 72 34% | 94 14% | 99.5 9% | 92.5 15% | 91.7 ? 16% | 110.7 ? -2% |
| Load Maximum * (Watt) | 168 | 144 14% | 175.2 -4% | 158 6% | 177 -5% | 133.3 21% | 123.2 27% | 156.4 ? 7% | 259 ? -54% |
| Witcher 3 ultra * (Watt) | 86 | 124.6 | 79 | 113.6 | 108.1 |
* ... menor é melhor
| Lenovo Legion Y530-15ICH i7-8750H, GeForce GTX 1060 Mobile, 52 Wh | HP Pavilion Gaming 15-cx0003ng i7-8750H, GeForce GTX 1050 Ti Mobile, 52.5 Wh | Lenovo Legion Y7000P-1060 i7-8750H, GeForce GTX 1060 Mobile, 57 Wh | Medion Erazer P6705-MD61131 i7-8750H, GeForce GTX 1050 Ti Mobile, 62 Wh | MSI P65 8RF-451 - Creator i7-8750H, GeForce GTX 1070 Max-Q, 82 Wh | Razer Blade 15 Base Model i7-8750H, GeForce GTX 1060 Max-Q, 65 Wh | Lenovo Legion Y530-15ICH i5-8300H, GeForce GTX 1050 Ti Mobile, 52.5 Wh | Média da turma Gaming | |
|---|---|---|---|---|---|---|---|---|
| Duração da bateria | 106% | 72% | 203% | 109% | 120% | 8% | 121% | |
| Reader / Idle (h) | 8.3 | 10.8 30% | 13.6 64% | 8.9 7% | 7.5 -10% | 11.5 39% | 8.27 ? 0% | |
| WiFi v1.3 (h) | 3.8 | 5.3 39% | 5.8 53% | 6.7 76% | 7.1 87% | 5.5 45% | 4.1 8% | 7.11 ? 87% |
| Load (h) | 0.4 | 1.4 250% | 0.8 100% | 2.5 525% | 1.4 250% | 1.5 275% | 1.502 ? 276% |
Pro
Contra
O Lenovo Legion Y530 é um poderoso laptop para jogos em todas as configurações, que pode utilizar o poder de seus componentes muito bem e, portanto, os resultados nos testes de desempenho sintéticos e testes de jogos são muito bons. A tela reproduz belas fotos com boas cores.
Considerando o baixo preço, podemos recomendar o Lenovo Legion Y530 com a Nvidia GeForce GTX 1060.
A solução de resfriamento deve funcionar bem para manter o desempenho, mas isso resulta em ventiladores barulhentos sob carga. Você pode querer usar fones de ouvido para sessões prolongadas de jogos. A duração da bateria também é comparativamente curta, embora não seja incomum para um dispositivo desse segmento.
Lenovo Legion Y530-15ICH
- 12/14/2018 v6 (old)
Mike Wobker
Price comparison
