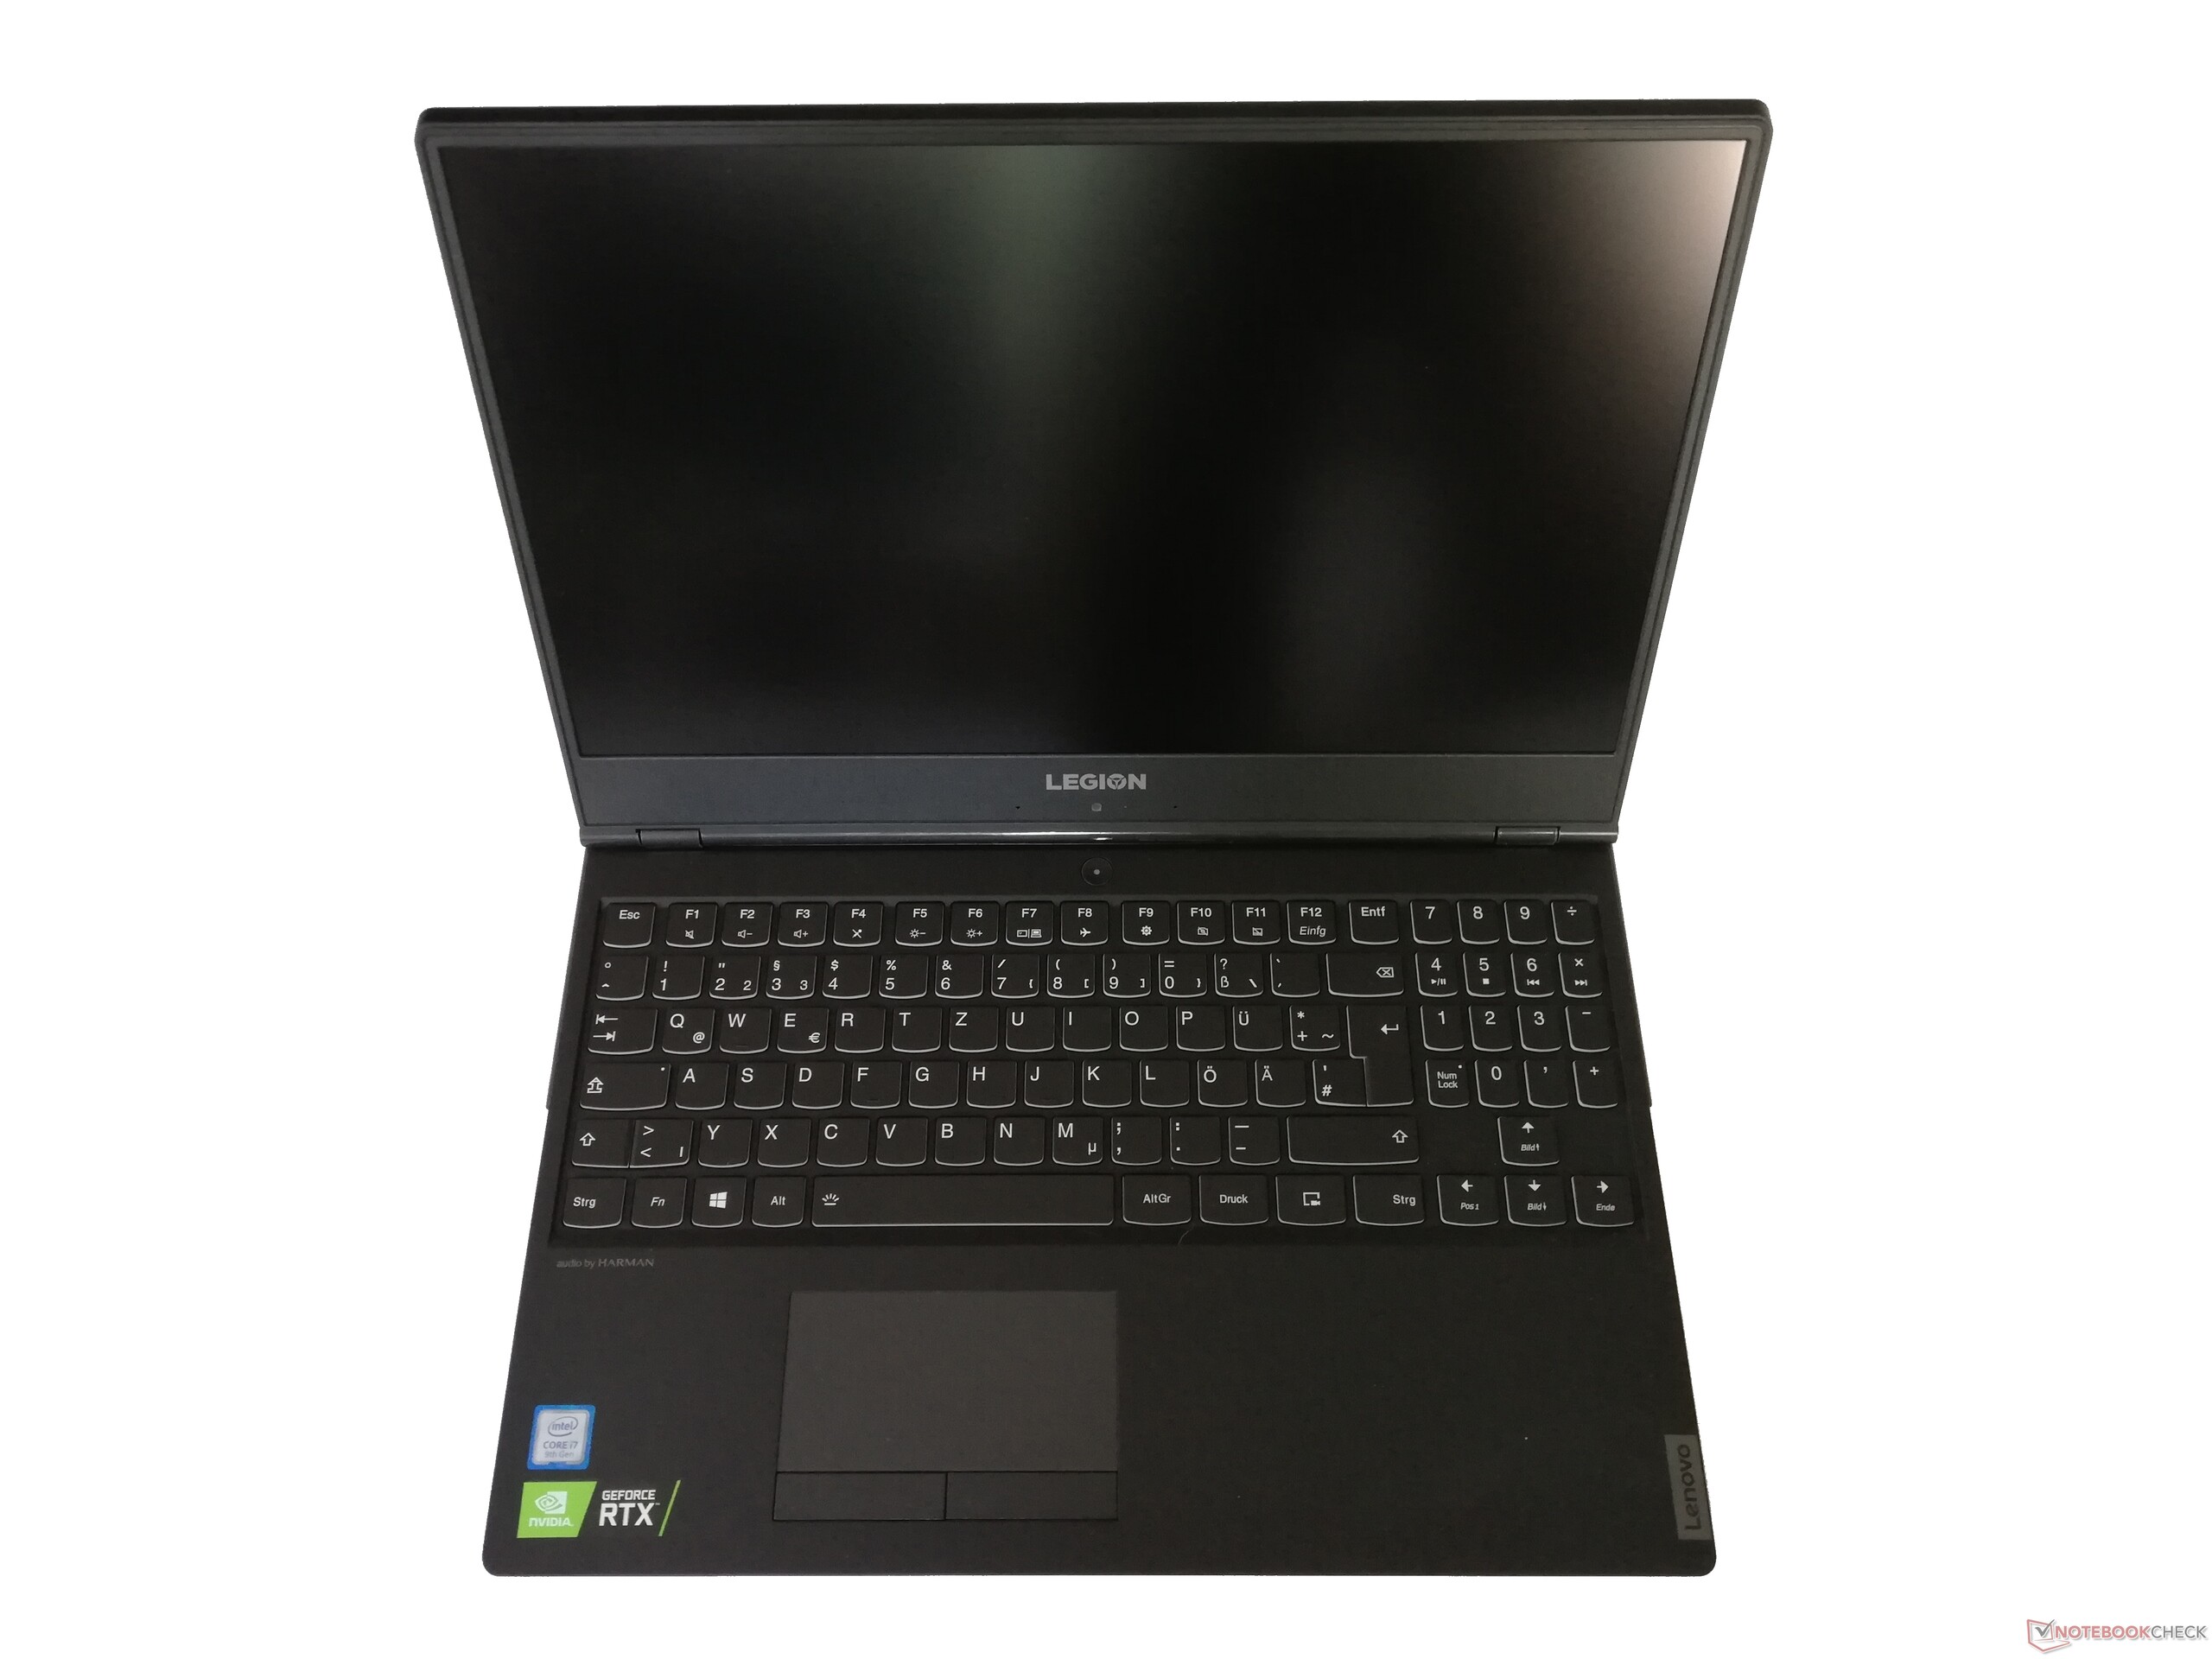
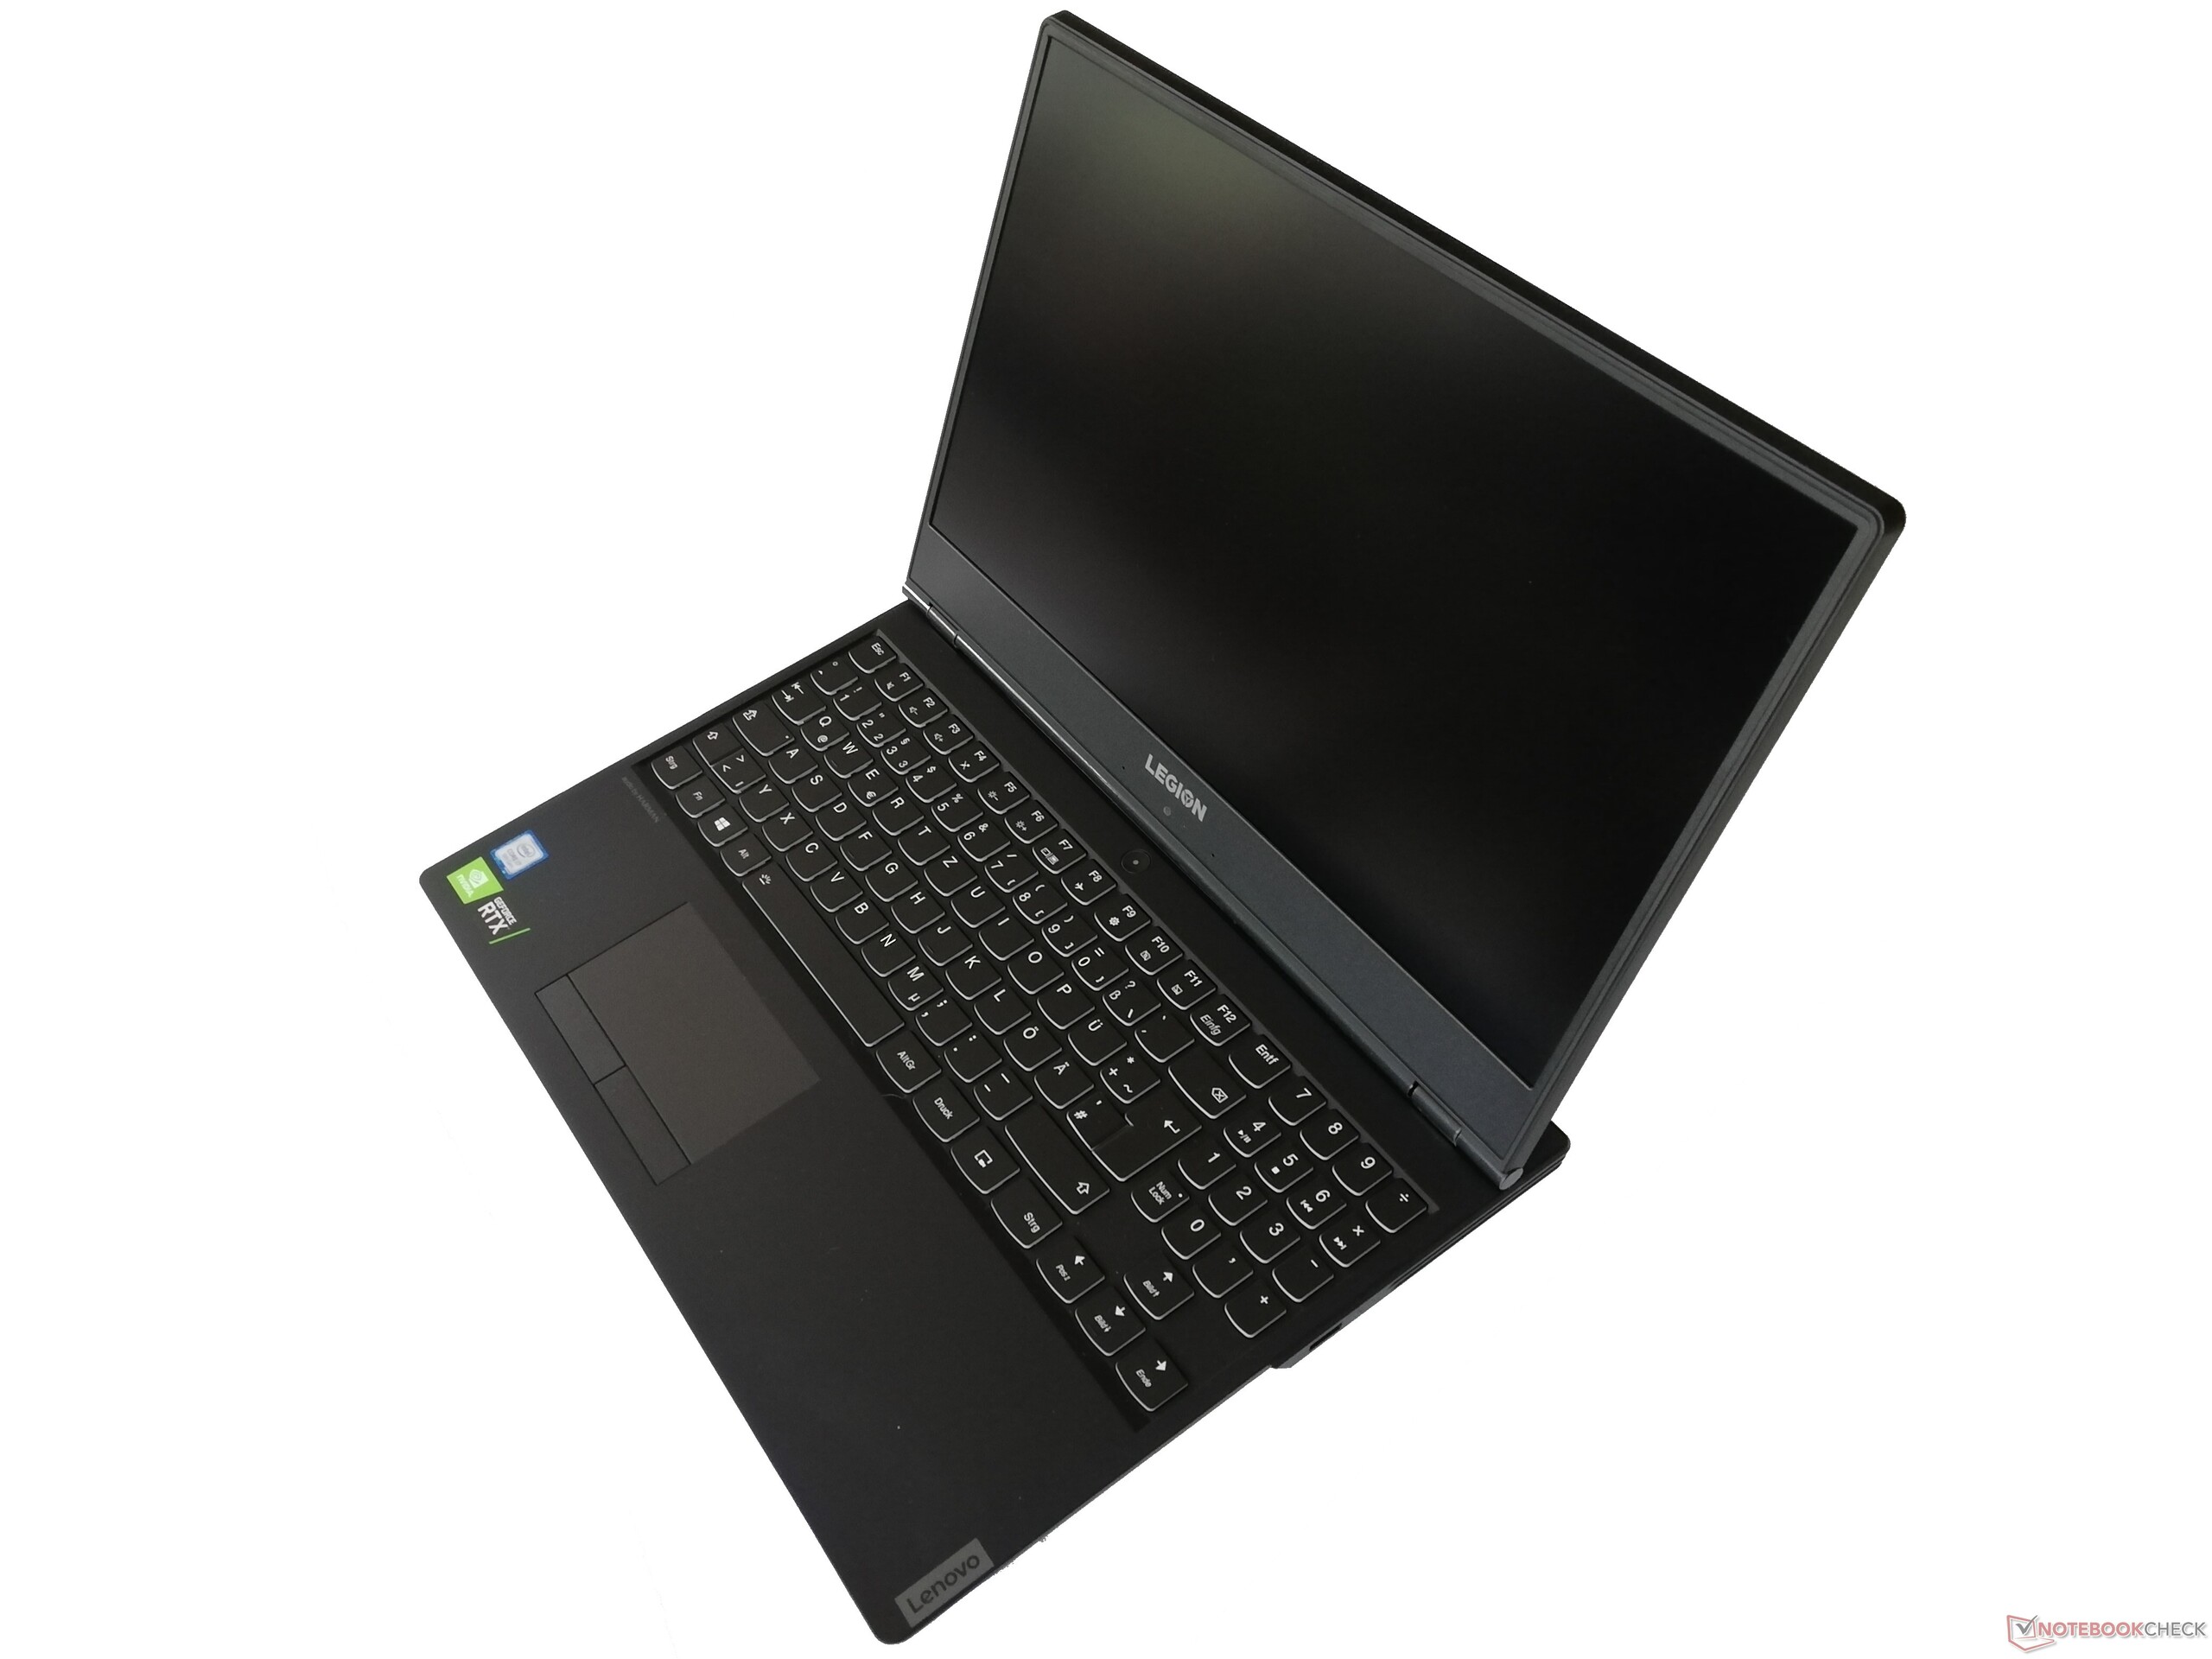
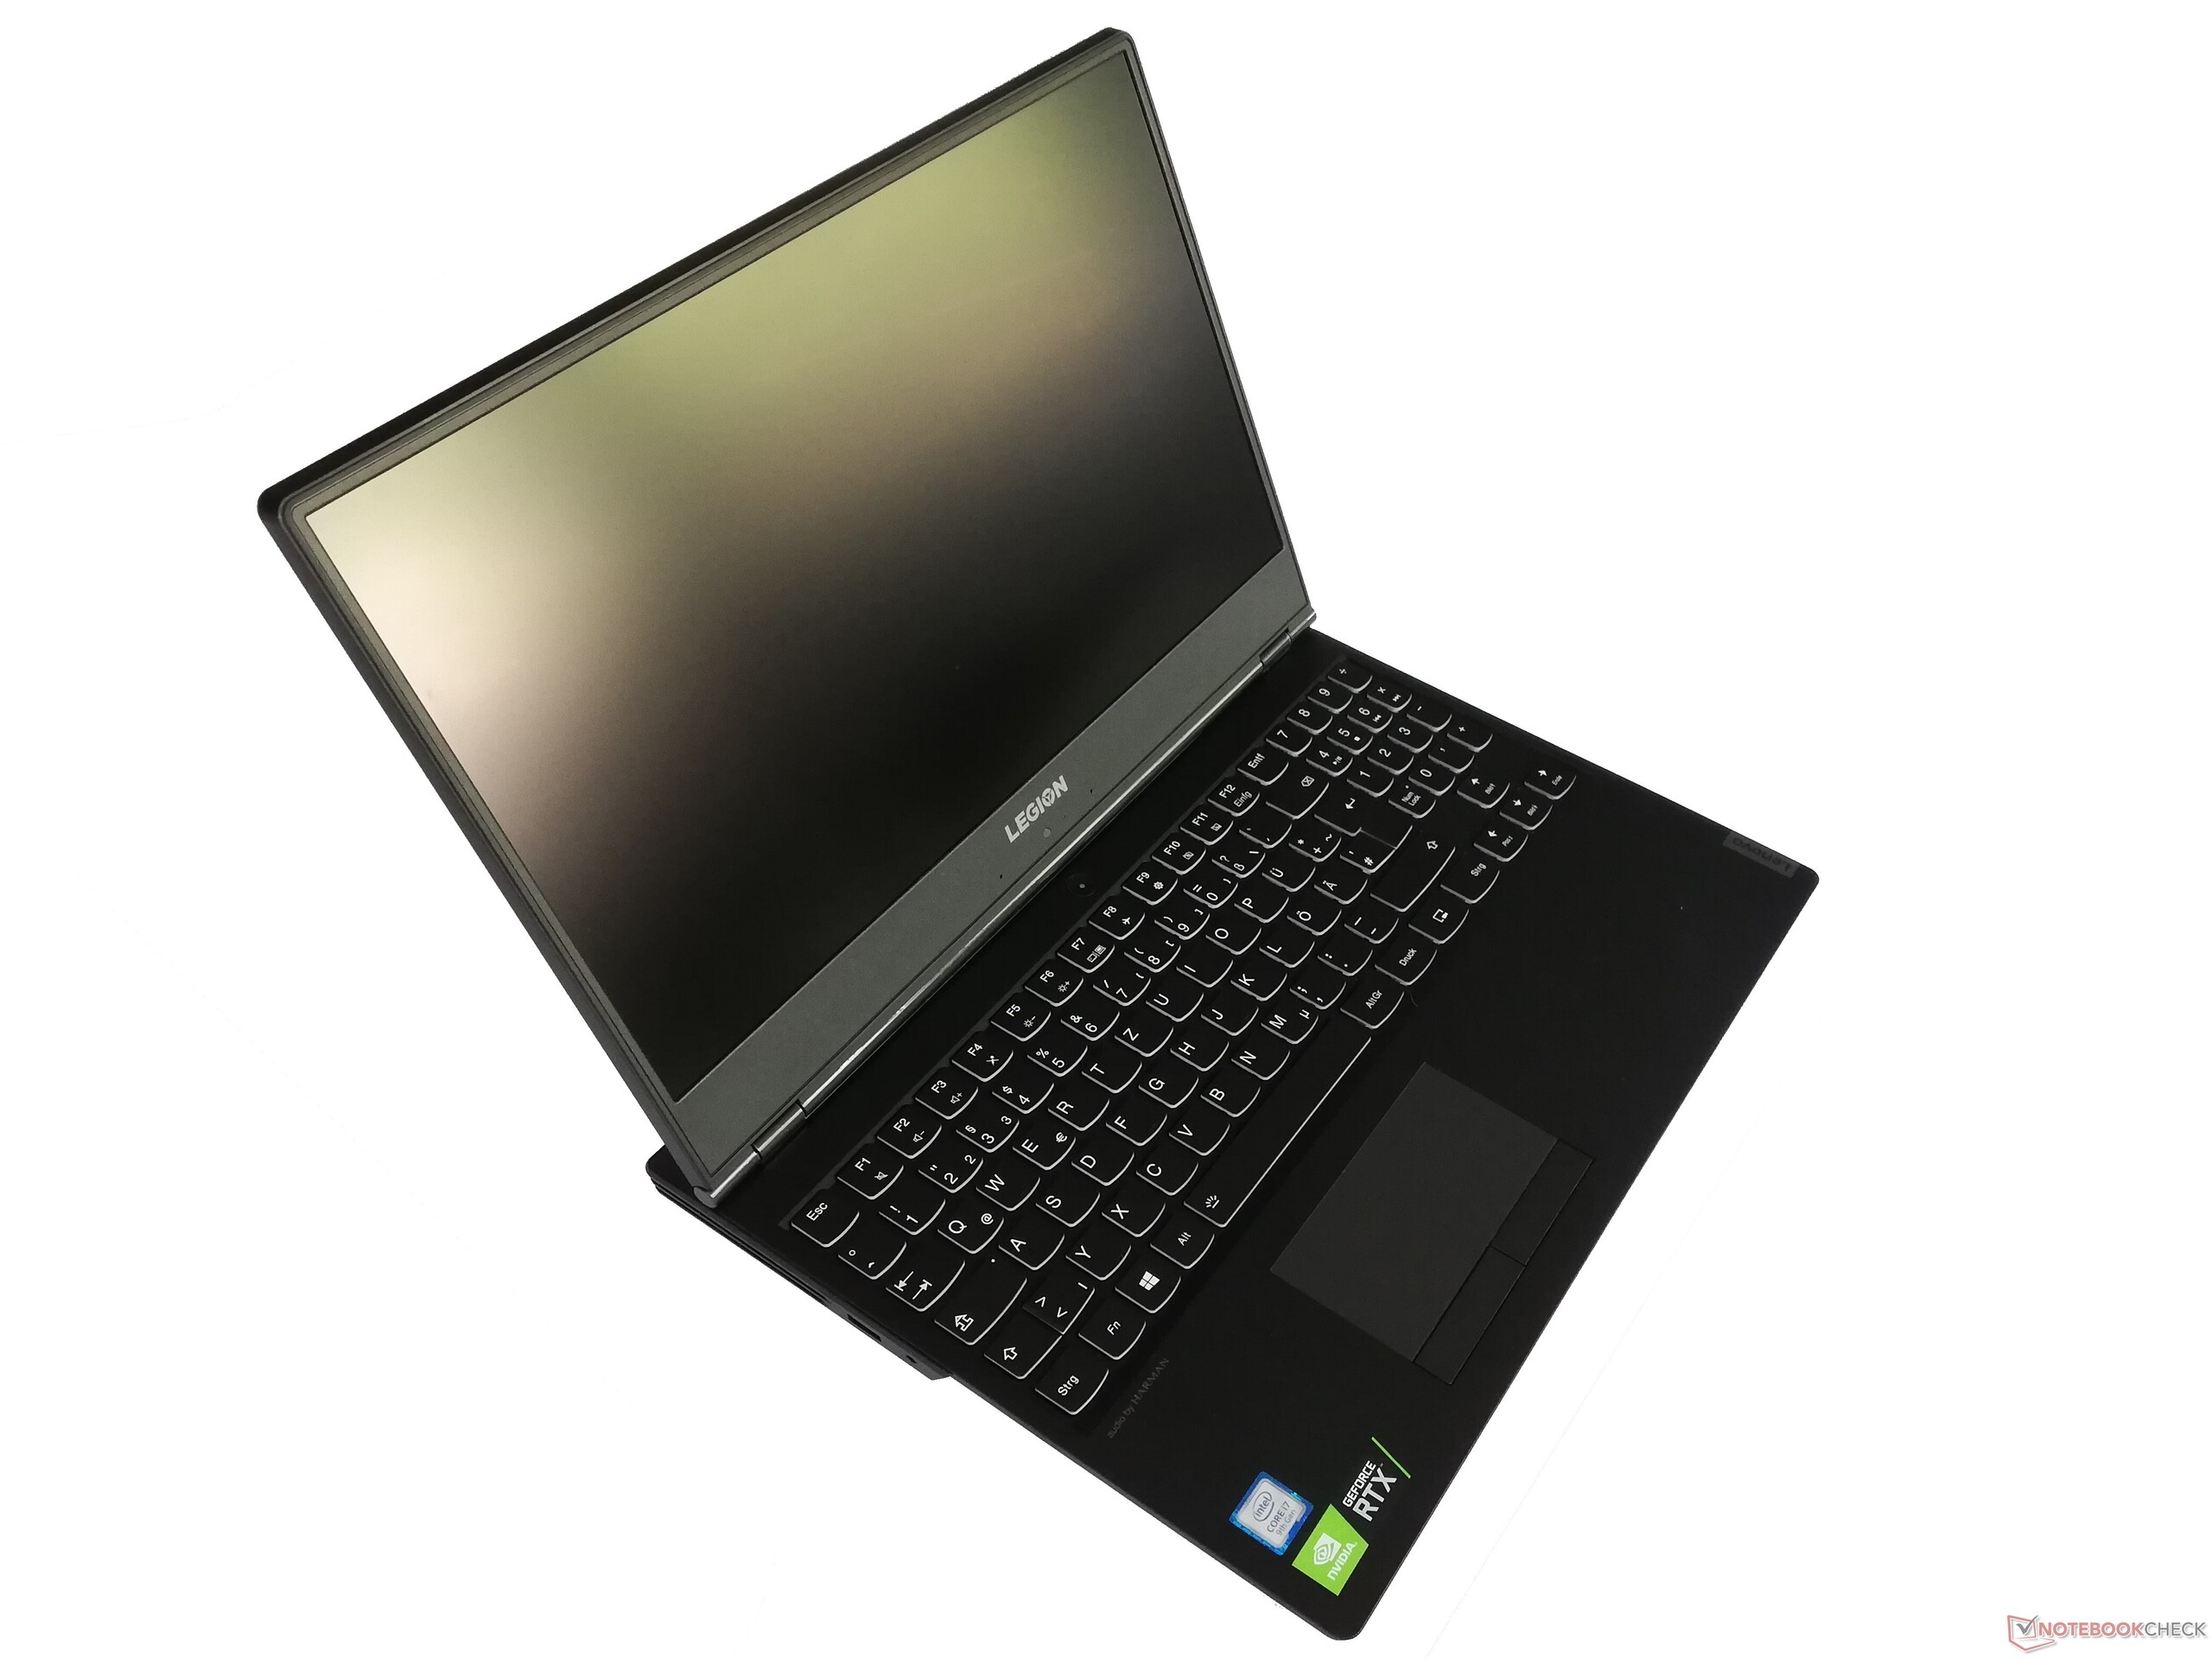
Breve Análise do Portátil Lenovo Legion Y540 com RTX 2060: Portátil de jogos com bom som e painel de 144 Hz
| Networking | |
| iperf3 transmit AX12 | |
| Lenovo Legion Y540-17IRH | |
| Lenovo Legion Y540-15IRH | |
| Aorus 15 W9 | |
| Dell G5 15 5590 | |
| MSI GL73 8SE-010US | |
| CUK Model Z GK5CQ7Z | |
| HP Omen 15-dc1303ng | |
| iperf3 receive AX12 | |
| Lenovo Legion Y540-17IRH | |
| Lenovo Legion Y540-15IRH | |
| Aorus 15 W9 | |
| HP Omen 15-dc1303ng | |
| Dell G5 15 5590 | |
| MSI GL73 8SE-010US | |
| CUK Model Z GK5CQ7Z | |
| |||||||||||||||||||||||||
iluminação: 87 %
iluminação com acumulador: 284 cd/m²
Contraste: 947:1 (Preto: 0.3 cd/m²)
ΔE ColorChecker Calman: 3.53 | ∀{0.5-29.43 Ø4.71}
calibrated: 1.81
ΔE Greyscale Calman: 3.56 | ∀{0.09-98 Ø4.96}
91% sRGB (Argyll 1.6.3 3D)
59% AdobeRGB 1998 (Argyll 1.6.3 3D)
65.9% AdobeRGB 1998 (Argyll 3D)
91.6% sRGB (Argyll 3D)
64.5% Display P3 (Argyll 3D)
Gamma: 2.47
CCT: 7257 K
| Lenovo Legion Y540-15IRH BOE NV156FHM-N4G (BOE084D), IPS, 1920x1080 | Aorus 15 W9 LG Philips LP156WFG-SPB2 (LGD05E8), IPS, 1920x1080 | CUK Model Z GK5CQ7Z LG Philips LGD05C0, IPS, 1920x1080 | Dell G5 15 5590 AU Optronics B156HAN, IPS, 1920x1080 | HP Omen 15-dc1303ng LG Philips LGD05C0, IPS, 1920x1080 | MSI GL73 8SE-010US CMN1747, TN LED, 1920x1080 | Lenovo Legion Y540-17IRH AU Optronics B173HAN04.4 (AUO449D), IPS, 1920x1080 | |
|---|---|---|---|---|---|---|---|
| Display | 1% | 1% | -37% | 0% | 27% | 7% | |
| Display P3 Coverage (%) | 64.5 | 64.3 0% | 64.5 0% | 39.26 -39% | 63.8 -1% | 91.1 41% | 69 7% |
| sRGB Coverage (%) | 91.6 | 93.5 2% | 93 2% | 59.1 -35% | 93.4 2% | 100 9% | 98.3 7% |
| AdobeRGB 1998 Coverage (%) | 65.9 | 65.6 0% | 65.7 0% | 40.56 -38% | 65 -1% | 85.4 30% | 70.7 7% |
| Response Times | -60% | -38% | -306% | -35% | -14% | -67% | |
| Response Time Grey 50% / Grey 80% * (ms) | 8.8 ? | 16.8 ? -91% | 13.6 ? -55% | 45 ? -411% | 14 ? -59% | 12.8 ? -45% | 18 ? -105% |
| Response Time Black / White * (ms) | 10 ? | 12.8 ? -28% | 12 ? -20% | 30 ? -200% | 11 ? -10% | 8.2 ? 18% | 12.8 ? -28% |
| PWM Frequency (Hz) | 25770 ? | ||||||
| Screen | -6% | -0% | -57% | 3% | -37% | 8% | |
| Brightness middle (cd/m²) | 284 | 295 4% | 306.8 8% | 234 -18% | 316 11% | 326.4 15% | 286 1% |
| Brightness (cd/m²) | 277 | 292 5% | 309 12% | 219 -21% | 295 6% | 317 14% | 282 2% |
| Brightness Distribution (%) | 87 | 80 -8% | 87 0% | 82 -6% | 84 -3% | 90 3% | 87 0% |
| Black Level * (cd/m²) | 0.3 | 0.34 -13% | 0.38 -27% | 0.17 43% | 0.42 -40% | 0.28 7% | 0.19 37% |
| Contrast (:1) | 947 | 868 -8% | 807 -15% | 1376 45% | 752 -21% | 1166 23% | 1505 59% |
| Colorchecker dE 2000 * | 3.53 | 3.89 -10% | 3.16 10% | 8.6 -144% | 2.7 24% | 7.83 -122% | 3.57 -1% |
| Colorchecker dE 2000 max. * | 6.11 | 7.28 -19% | 6.05 1% | 17.49 -186% | 5.65 8% | 13.36 -119% | 7.5 -23% |
| Colorchecker dE 2000 calibrated * | 1.81 | 1.44 20% | 2.4 -33% | 4.06 -124% | 1.58 13% | 2.83 -56% | 1.31 28% |
| Greyscale dE 2000 * | 3.56 | 4.98 -40% | 2.3 35% | 8.55 -140% | 2.35 34% | 10.9 -206% | 4.51 -27% |
| Gamma | 2.47 89% | 2.45 90% | 2.17 101% | 3.02 73% | 2.41 91% | 1.97 112% | 2.36 93% |
| CCT | 7257 90% | 6407 101% | 6557 99% | 7802 83% | 6904 94% | 11056 59% | 7411 88% |
| Color Space (Percent of AdobeRGB 1998) (%) | 59 | 60 2% | 60 2% | 37 -37% | 60 2% | 75.8 28% | 64 8% |
| Color Space (Percent of sRGB) (%) | 91 | 93 2% | 92.6 2% | 59 -35% | 93 2% | 100 10% | 98 8% |
| Média Total (Programa/Configurações) | -22% /
-11% | -12% /
-5% | -133% /
-84% | -11% /
-2% | -8% /
-22% | -17% /
-1% |
* ... menor é melhor
Exibir tempos de resposta
| ↔ Tempo de resposta preto para branco | ||
|---|---|---|
| 10 ms ... ascensão ↗ e queda ↘ combinadas | ↗ 5.6 ms ascensão | 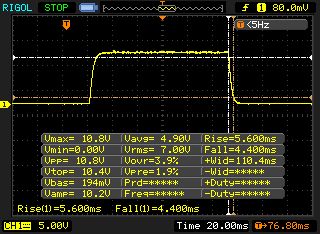 |
| ↘ 4.4 ms queda | ||
| A tela mostra boas taxas de resposta em nossos testes, mas pode ser muito lenta para jogadores competitivos. Em comparação, todos os dispositivos testados variam de 0.1 (mínimo) a 240 (máximo) ms. » 27 % de todos os dispositivos são melhores. Isso significa que o tempo de resposta medido é melhor que a média de todos os dispositivos testados (19.8 ms). | ||
| ↔ Tempo de resposta 50% cinza a 80% cinza | ||
| 8.8 ms ... ascensão ↗ e queda ↘ combinadas | ↗ 4.4 ms ascensão | 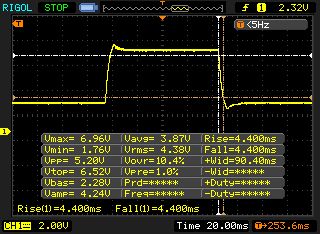 |
| ↘ 4.4 ms queda | ||
| A tela mostra taxas de resposta rápidas em nossos testes e deve ser adequada para jogos. Em comparação, todos os dispositivos testados variam de 0.165 (mínimo) a 636 (máximo) ms. » 22 % de todos os dispositivos são melhores. Isso significa que o tempo de resposta medido é melhor que a média de todos os dispositivos testados (31 ms). | ||
Cintilação da tela / PWM (modulação por largura de pulso)
| Tela tremeluzindo / PWM não detectado | 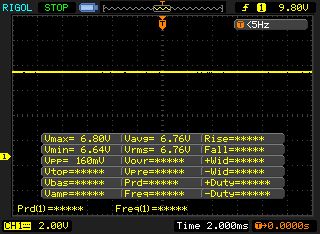 | ||
[pwm_comparison] Em comparação: 52 % de todos os dispositivos testados não usam PWM para escurecer a tela. Se PWM foi detectado, uma média de 7754 (mínimo: 5 - máximo: 343500) Hz foi medida. | |||
| Cinebench R15 | |
| CPU Single 64Bit | |
| Média da turma Gaming (188.8 - 350, n=106, últimos 2 anos) | |
| Lenovo Legion Y540-15IRH | |
| CUK Model Z GK5CQ7Z | |
| HP Omen 15-dc1303ng | |
| Lenovo Legion Y540-17IRH | |
| Aorus 15 W9 | |
| MSI GL73 8SE-010US | |
| Dell G5 15 5590 | |
| CPU Multi 64Bit | |
| Média da turma Gaming (1578 - 6330, n=105, últimos 2 anos) | |
| Lenovo Legion Y540-15IRH | |
| CUK Model Z GK5CQ7Z | |
| Dell G5 15 5590 | |
| Aorus 15 W9 | |
| HP Omen 15-dc1303ng | |
| MSI GL73 8SE-010US | |
| Lenovo Legion Y540-17IRH | |
| PCMark 10 - Score | |
| Média da turma Gaming (5828 - 12414, n=93, últimos 2 anos) | |
| Lenovo Legion Y540-15IRH | |
| Aorus 15 W9 | |
| CUK Model Z GK5CQ7Z | |
| Lenovo Legion Y540-17IRH | |
| HP Omen 15-dc1303ng | |
| MSI GL73 8SE-010US | |
| Dell G5 15 5590 | |
| PCMark 8 | |
| Home Score Accelerated v2 | |
| Média da turma Gaming (n=1últimos 2 anos) | |
| Lenovo Legion Y540-15IRH | |
| Aorus 15 W9 | |
| HP Omen 15-dc1303ng | |
| Lenovo Legion Y540-17IRH | |
| CUK Model Z GK5CQ7Z | |
| Dell G5 15 5590 | |
| MSI GL73 8SE-010US | |
| Work Score Accelerated v2 | |
| Lenovo Legion Y540-15IRH | |
| Aorus 15 W9 | |
| HP Omen 15-dc1303ng | |
| CUK Model Z GK5CQ7Z | |
| MSI GL73 8SE-010US | |
| Dell G5 15 5590 | |
| Lenovo Legion Y540-17IRH | |
| Média da turma Gaming (n=1últimos 2 anos) | |
| PCMark 8 Home Score Accelerated v2 | 5185 pontos | |
| PCMark 8 Work Score Accelerated v2 | 5901 pontos | |
| PCMark 10 Score | 5997 pontos | |
Ajuda | ||
| Lenovo Legion Y540-15IRH Samsung PM981a MZVLB1T0HBLR | Aorus 15 W9 Intel SSD 760p SSDPEKKW512G8 | CUK Model Z GK5CQ7Z Intel SSD 660p 2TB SSDPEKNW020T8 | Dell G5 15 5590 KBG30ZMS128G | HP Omen 15-dc1303ng Samsung SSD PM981 MZVLB256HAHQ | MSI GL73 8SE-010US Kingston RBUSNS8154P3128GJ | Lenovo Legion Y540-17IRH WDC PC SN520 SDAPNUW-512G | |
|---|---|---|---|---|---|---|---|
| CrystalDiskMark 5.2 / 6 | -3% | 5% | -65% | -18% | -64% | -30% | |
| Write 4K (MB/s) | 131.7 | 99.2 -25% | 134.4 2% | 64.3 -51% | 50.2 -62% | 71.2 -46% | 105.1 -20% |
| Read 4K (MB/s) | 48.06 | 54.1 13% | 56.8 18% | 29.3 -39% | 35.32 -27% | 32.7 -32% | 34.41 -28% |
| Write Seq (MB/s) | 1234 | 1524 24% | 1742 41% | 131.1 -89% | 991 -20% | 404.5 -67% | 1298 5% |
| Read Seq (MB/s) | 973 | 2325 139% | 1687 73% | 776 -20% | 1526 57% | 8.3 -99% | 1099 13% |
| Write 4K Q32T1 (MB/s) | 576 | 259.2 -55% | 535 -7% | 96.8 -83% | 445.1 -23% | 204 -65% | 335.7 -42% |
| Read 4K Q32T1 (MB/s) | 655 | 328.9 -50% | 639 -2% | 198.6 -70% | 526 -20% | 303.2 -54% | 231.4 -65% |
| Write Seq Q32T1 (MB/s) | 3012 | 1566 -48% | 1903 -37% | 127.8 -96% | 1647 -45% | 386.5 -87% | 1454 -52% |
| Read Seq Q32T1 (MB/s) | 3481 | 2767 -21% | 1849 -47% | 1044 -70% | 3427 -2% | 1214 -65% | 1740 -50% |

| 3DMark - 1920x1080 Fire Strike Graphics | |
| Média da turma Gaming (12242 - 62849, n=115, últimos 2 anos) | |
| CUK Model Z GK5CQ7Z | |
| MSI GL73 8SE-010US | |
| Aorus 15 W9 | |
| Dell G5 15 5590 | |
| Lenovo Legion Y540-15IRH | |
| Lenovo Legion Y540-17IRH | |
| HP Omen 15-dc1303ng | |
| 3DMark 11 - 1280x720 Performance GPU | |
| Média da turma Gaming (21841 - 80022, n=104, últimos 2 anos) | |
| CUK Model Z GK5CQ7Z | |
| Aorus 15 W9 | |
| Dell G5 15 5590 | |
| MSI GL73 8SE-010US | |
| Lenovo Legion Y540-17IRH | |
| Lenovo Legion Y540-15IRH | |
| HP Omen 15-dc1303ng | |
| 3DMark 11 Performance | 17422 pontos | |
| 3DMark Cloud Gate Standard Score | 36582 pontos | |
| 3DMark Fire Strike Score | 13706 pontos | |
Ajuda | ||
| The Witcher 3 - 1920x1080 Ultra Graphics & Postprocessing (HBAO+) | |
| Média da turma Gaming (104.7 - 240, n=7, últimos 2 anos) | |
| CUK Model Z GK5CQ7Z | |
| Dell G5 15 5590 | |
| Aorus 15 W9 | |
| Lenovo Legion Y540-15IRH | |
| MSI GL73 8SE-010US | |
| Lenovo Legion Y540-17IRH | |
| Dota 2 Reborn - 1920x1080 ultra (3/3) best looking | |
| Média da turma Gaming (84.8 - 248, n=107, últimos 2 anos) | |
| Lenovo Legion Y540-15IRH | |
| HP Omen 15-dc1303ng | |
| Rise of the Tomb Raider - 1920x1080 Very High Preset AA:FX AF:16x | |
| CUK Model Z GK5CQ7Z | |
| Lenovo Legion Y540-15IRH | |
| Thief - 1920x1080 Very High Preset AA:FXAA & High SS AF:8x | |
| Lenovo Legion Y540-15IRH | |
| baixo | média | alto | ultra | |
|---|---|---|---|---|
| Thief (2014) | 97.7 | |||
| The Witcher 3 (2015) | 56.7 | |||
| Dota 2 Reborn (2015) | 139 | 132.5 | 123.2 | 118.9 |
| Rise of the Tomb Raider (2016) | 83.9 |
Barulho
| Ocioso |
| 30 / 32 / 34 dB |
| Carga |
| 44 / 52 dB |
 | ||
30 dB silencioso 40 dB(A) audível 50 dB(A) ruidosamente alto |
||
min: | ||
(-) A temperatura máxima no lado superior é 47 °C / 117 F, em comparação com a média de 40.4 °C / 105 F , variando de 21.2 a 68.8 °C para a classe Gaming.
(-) A parte inferior aquece até um máximo de 60 °C / 140 F, em comparação com a média de 43.2 °C / 110 F
(±) Em uso inativo, a temperatura média para o lado superior é 33.8 °C / 93 F, em comparação com a média do dispositivo de 33.9 °C / ### class_avg_f### F.
(-) Jogando The Witcher 3, a temperatura média para o lado superior é 40.2 °C / 104 F, em comparação com a média do dispositivo de 33.9 °C / ## #class_avg_f### F.
(-) Os apoios para as mãos e o touchpad podem ficar muito quentes ao toque, com um máximo de 41 °C / 105.8 F.
(-) A temperatura média da área do apoio para as mãos de dispositivos semelhantes foi 28.8 °C / 83.8 F (-12.2 °C / -22 F).
Lenovo Legion Y540-15IRH análise de áudio
(+) | os alto-falantes podem tocar relativamente alto (###valor### dB)
Graves 100 - 315Hz
(±) | graves reduzidos - em média 14.6% menor que a mediana
(±) | a linearidade dos graves é média (14.5% delta para a frequência anterior)
Médios 400 - 2.000 Hz
(+) | médios equilibrados - apenas 3.9% longe da mediana
(+) | médios são lineares (3.8% delta para frequência anterior)
Altos 2 - 16 kHz
(+) | agudos equilibrados - apenas 3% longe da mediana
(+) | os máximos são lineares (6.5% delta da frequência anterior)
Geral 100 - 16.000 Hz
(+) | o som geral é linear (14.3% diferença em relação à mediana)
Comparado com a mesma classe
» 26% de todos os dispositivos testados nesta classe foram melhores, 7% semelhantes, 67% piores
» O melhor teve um delta de 6%, a média foi 18%, o pior foi 132%
Comparado com todos os dispositivos testados
» 18% de todos os dispositivos testados foram melhores, 4% semelhantes, 78% piores
» O melhor teve um delta de 4%, a média foi 23%, o pior foi 134%
Lenovo Legion Y540-17IRH análise de áudio
(+) | os alto-falantes podem tocar relativamente alto (###valor### dB)
Graves 100 - 315Hz
(-) | quase nenhum baixo - em média 16.1% menor que a mediana
(±) | a linearidade dos graves é média (13% delta para a frequência anterior)
Médios 400 - 2.000 Hz
(±) | médios mais altos - em média 5% maior que a mediana
(+) | médios são lineares (3.6% delta para frequência anterior)
Altos 2 - 16 kHz
(+) | agudos equilibrados - apenas 3.5% longe da mediana
(+) | os máximos são lineares (5.9% delta da frequência anterior)
Geral 100 - 16.000 Hz
(±) | a linearidade do som geral é média (15.7% diferença em relação à mediana)
Comparado com a mesma classe
» 37% de todos os dispositivos testados nesta classe foram melhores, 7% semelhantes, 57% piores
» O melhor teve um delta de 6%, a média foi 18%, o pior foi 132%
Comparado com todos os dispositivos testados
» 24% de todos os dispositivos testados foram melhores, 5% semelhantes, 71% piores
» O melhor teve um delta de 4%, a média foi 23%, o pior foi 134%
| desligado | |
| Ocioso | |
| Carga |
|
Key:
min: | |
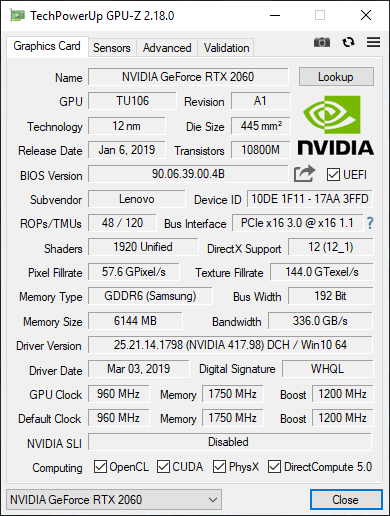
| Lenovo Legion Y540-15IRH i7-9750H, GeForce RTX 2060 Mobile | Aorus 15 W9 i7-8750H, GeForce RTX 2060 Mobile | CUK Model Z GK5CQ7Z i7-9750H, GeForce RTX 2070 Max-Q | Dell G5 15 5590 i7-8750H, GeForce RTX 2060 Mobile | HP Omen 15-dc1303ng i7-8750H, GeForce RTX 2070 Max-Q | MSI GL73 8SE-010US i7-8750H, GeForce RTX 2060 Mobile | Lenovo Legion Y540-17IRH i5-9300H, GeForce GTX 1660 Ti Mobile | Média da turma Gaming | |
|---|---|---|---|---|---|---|---|---|
| Power Consumption | 2% | -20% | 38% | 17% | 17% | -3% | -1% | |
| Idle Minimum * (Watt) | 15 | 18 -20% | 23.5 -57% | 3.5 77% | 14.7 2% | 8.8 41% | 19 -27% | 13 ? 13% |
| Idle Average * (Watt) | 20 | 20 -0% | 28 -40% | 6.9 65% | 18.6 7% | 16.2 19% | 22 -10% | 19 ? 5% |
| Idle Maximum * (Watt) | 33 | 28 15% | 32 3% | 8.5 74% | 22.6 32% | 18.3 45% | 30 9% | 24.6 ? 25% |
| Load Average * (Watt) | 88 | 87 1% | 102.4 -16% | 127 -44% | 90 -2% | 86.1 2% | 79 10% | 110.7 ? -26% |
| Witcher 3 ultra * (Watt) | 128 | 135 -5% | 142.8 -12% | 146.7 -15% | 134 -5% | |||
| Load Maximum * (Watt) | 213 | 175 18% | 209 2% | 179 16% | 120 44% | 186.4 12% | 201 6% | 259 ? -22% |
* ... menor é melhor
| Lenovo Legion Y540-15IRH i7-9750H, GeForce RTX 2060 Mobile, 57 Wh | Aorus 15 W9 i7-8750H, GeForce RTX 2060 Mobile, 62 Wh | CUK Model Z GK5CQ7Z i7-9750H, GeForce RTX 2070 Max-Q, 46.74 Wh | Dell G5 15 5590 i7-8750H, GeForce RTX 2060 Mobile, 60 Wh | HP Omen 15-dc1303ng i7-8750H, GeForce RTX 2070 Max-Q, 70 Wh | MSI GL73 8SE-010US i7-8750H, GeForce RTX 2060 Mobile, 41 Wh | Lenovo Legion Y540-17IRH i5-9300H, GeForce GTX 1660 Ti Mobile, 57 Wh | Média da turma Gaming | |
|---|---|---|---|---|---|---|---|---|
| Duração da bateria | -8% | -6% | 192% | 13% | 3% | 16% | 90% | |
| Reader / Idle (h) | 3.9 | 2.9 -26% | 14.8 279% | 5 28% | 6.5 67% | 5.2 33% | 8.27 ? 112% | |
| WiFi v1.3 (h) | 3.2 | 2.4 -25% | 3 -6% | 7.7 141% | 3.3 3% | 2.8 -13% | 3.7 16% | 7.11 ? 122% |
| Load (h) | 1.1 | 1.4 27% | 2.8 155% | 1.2 9% | 0.6 -45% | 1.1 0% | 1.502 ? 37% |
Pro
Contra
Veredicto - Portátil simples, porém, bom, da Lenovo
O Legion Y540-15IRH provou ser um portátil de jogos sólido com apenas alguns pontos fracos em nossa análise. O desempenho do sistema está em um nível alto e, embora o desempenho da GeForce RTX 2060 não seja usado de maneira ideal, ainda é bem aproveitado. Além disso, a combinação de um SSD rápido e um HD grande oferece diversas possibilidades de armazenamento para quantidades consideráveis de dados, onde os usuários podem posteriormente expandi-los ou trocá-los.
O Lenovo Legion Y540-15IRH deixa uma boa impressão em sua configuração máxima e deixa pouco espaço para críticas.
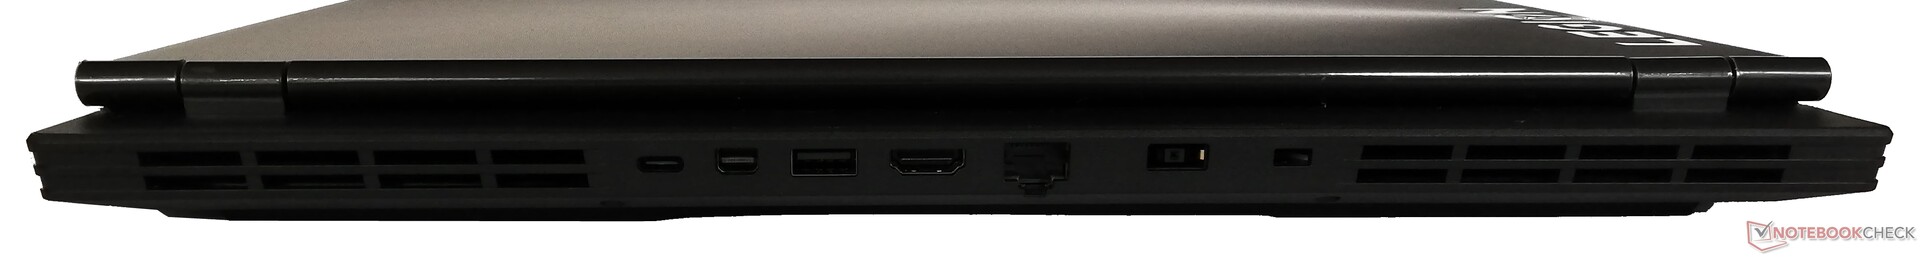
No entanto, é um pouco incompreensível que a duração da bateria seja reduzida a tal ponto ao desativar a unidade gráfica integrada. Os usuários podem agir por conta própria também, mas sem o conhecimento técnico básico, isso não é fácil para todos. A Lenovo também dispensou um leitor de cartões e, em vez de Thunderbolt 3 há “apenas” uma porta USB Type-C com o padrão 3.1 Gen1. Como esses aspectos provavelmente serão menos incômodos para alguns usuários, o Legion Y540 continua sendo um bom portátil para jogos a um preço razoável.
Lenovo Legion Y540-15IRH
- 08/04/2019 v6 (old)
Mike Wobker