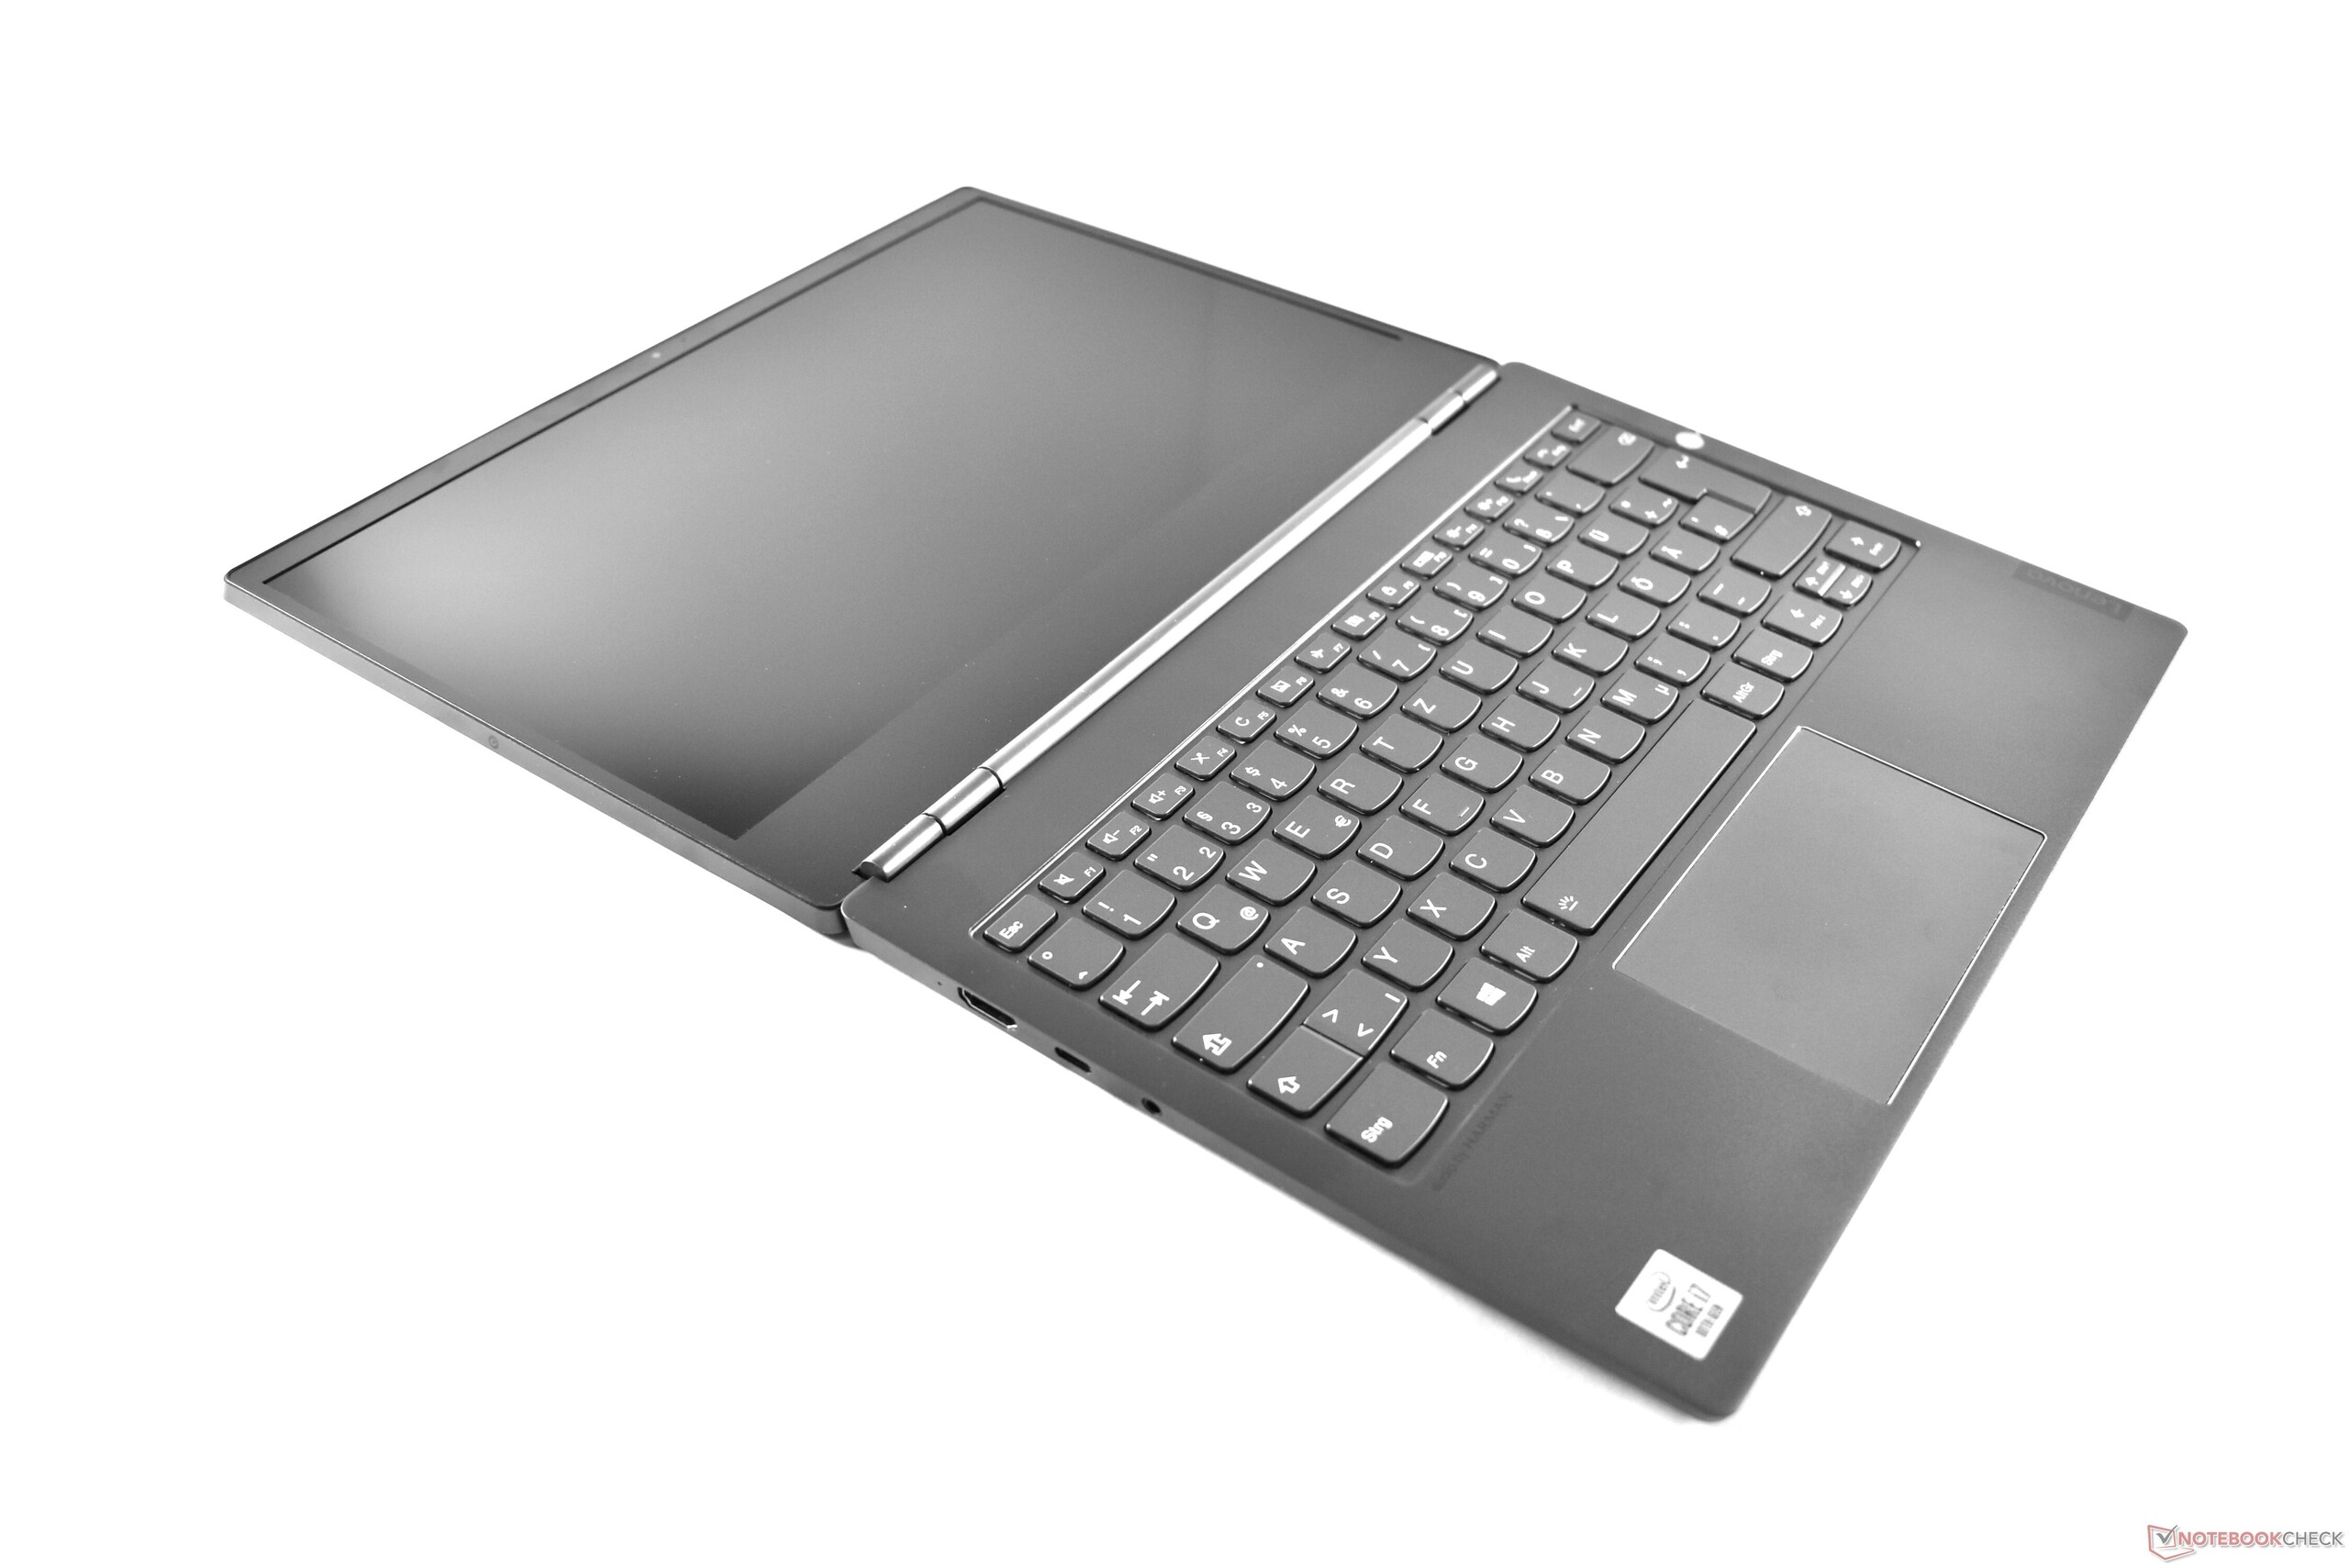
Breve Análise do Portátil Lenovo ThinkBook Plus: Tela E-Ink exclusiva em combinação com hardware médio
Avaliação | Data | Modelo | Peso | Altura | Size | Resolução | Preço |
|---|---|---|---|---|---|---|---|
| 86.9 % v7 (old) | 10/2020 | Lenovo ThinkBook Plus 13 i7 i7-10510U, UHD Graphics 620 | 1.4 kg | 17.4 mm | 13.30" | 1920x1080 | |
| 85.1 % v7 (old) | Dynabook Portege X30L-G1331 i5-10210U, UHD Graphics 620 | 859 g | 17.9 mm | 13.30" | 1920x1080 | ||
| 83.7 % v7 (old) | Fujitsu Lifebook U939 i5 i5-8265U, UHD Graphics 620 | 900 g | 15 mm | 13.30" | 1920x1080 | ||
| 89.5 % v7 (old) | 08/2020 | Lenovo ThinkPad X13-20UGS00800 R7 PRO 4750U, Vega 7 | 1.3 kg | 16.9 mm | 13.30" | 1920x1080 |
| Networking | |
| iperf3 transmit AX12 | |
| Dynabook Portege X30L-G1331 | |
| Média Intel Wi-Fi 6 AX201 (49.8 - 1775, n=324) | |
| Lenovo ThinkPad X13-20UGS00800 | |
| Lenovo ThinkBook Plus 13 i7 | |
| Fujitsu Lifebook U939 i5 | |
| iperf3 receive AX12 | |
| Lenovo ThinkPad X13-20UGS00800 | |
| Média Intel Wi-Fi 6 AX201 (136 - 1743, n=324) | |
| Dynabook Portege X30L-G1331 | |
| Fujitsu Lifebook U939 i5 | |
| Lenovo ThinkBook Plus 13 i7 | |


| |||||||||||||||||||||||||
iluminação: 89 %
iluminação com acumulador: 328 cd/m²
Contraste: 1562:1 (Preto: 0.21 cd/m²)
ΔE ColorChecker Calman: 6.4 | ∀{0.5-29.43 Ø4.71}
calibrated: 1.2
ΔE Greyscale Calman: 6.5 | ∀{0.09-98 Ø4.96}
95.9% sRGB (Argyll 1.6.3 3D)
61.6% AdobeRGB 1998 (Argyll 1.6.3 3D)
67% AdobeRGB 1998 (Argyll 3D)
96.1% sRGB (Argyll 3D)
66% Display P3 (Argyll 3D)
Gamma: 2.87
CCT: 6428 K
| Lenovo ThinkBook Plus 13 i7 LP133WF7-SPB1, IPS LED, 1920x1080, 13.3" | Dynabook Portege X30L-G1331 Toshiba TOS508F, IPS, 1920x1080, 13.3" | Fujitsu Lifebook U939 i5 Sharp SHP14BD, IPS, 1920x1080, 13.3" | Lenovo ThinkPad X13-20UGS00800 B133HAK01.1, IPS LED, 1920x1080, 13.3" | |
|---|---|---|---|---|
| Display | 1% | -1% | -2% | |
| Display P3 Coverage (%) | 66 | 66.9 1% | 65.3 -1% | 64.8 -2% |
| sRGB Coverage (%) | 96.1 | 97.6 2% | 95 -1% | 95.6 -1% |
| AdobeRGB 1998 Coverage (%) | 67 | 67.8 1% | 66 -1% | 65.7 -2% |
| Response Times | -7% | 2% | 0% | |
| Response Time Grey 50% / Grey 80% * (ms) | 53.6 ? | 54.8 ? -2% | 55.2 ? -3% | 56.8 ? -6% |
| Response Time Black / White * (ms) | 32 ? | 35.6 ? -11% | 29.6 ? 7% | 30 ? 6% |
| PWM Frequency (Hz) | 23810 ? | 211.9 ? | ||
| Screen | 17% | -2% | 1% | |
| Brightness middle (cd/m²) | 328 | 482 47% | 384 17% | 331 1% |
| Brightness (cd/m²) | 329 | 452 37% | 362 10% | 315 -4% |
| Brightness Distribution (%) | 89 | 91 2% | 90 1% | 90 1% |
| Black Level * (cd/m²) | 0.21 | 0.4 -90% | 0.31 -48% | 0.21 -0% |
| Contrast (:1) | 1562 | 1205 -23% | 1239 -21% | 1576 1% |
| Colorchecker dE 2000 * | 6.4 | 1.85 71% | 4.8 25% | 6.1 5% |
| Colorchecker dE 2000 max. * | 11.2 | 3.08 72% | 9.4 16% | 10 11% |
| Colorchecker dE 2000 calibrated * | 1.2 | 1.2 -0% | 1.4 -17% | 1.2 -0% |
| Greyscale dE 2000 * | 6.5 | 2 69% | 6.6 -2% | 6.3 3% |
| Gamma | 2.87 77% | 2.1 105% | 2.2 100% | 2.77 79% |
| CCT | 6428 101% | 6822 95% | 7999 81% | 6938 94% |
| Color Space (Percent of AdobeRGB 1998) (%) | 61.6 | 62.5 1% | 61.2 -1% | 60.7 -1% |
| Color Space (Percent of sRGB) (%) | 95.9 | 97.7 2% | 95 -1% | 95.4 -1% |
| Média Total (Programa/Configurações) | 4% /
11% | -0% /
-1% | -0% /
1% |
* ... menor é melhor
Exibir tempos de resposta
| ↔ Tempo de resposta preto para branco | ||
|---|---|---|
| 32 ms ... ascensão ↗ e queda ↘ combinadas | ↗ 18 ms ascensão | 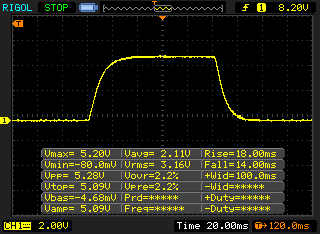 |
| ↘ 14 ms queda | ||
| A tela mostra taxas de resposta lentas em nossos testes e será insatisfatória para os jogadores. Em comparação, todos os dispositivos testados variam de 0.1 (mínimo) a 240 (máximo) ms. » 86 % de todos os dispositivos são melhores. Isso significa que o tempo de resposta medido é pior que a média de todos os dispositivos testados (19.8 ms). | ||
| ↔ Tempo de resposta 50% cinza a 80% cinza | ||
| 53.6 ms ... ascensão ↗ e queda ↘ combinadas | ↗ 26 ms ascensão | 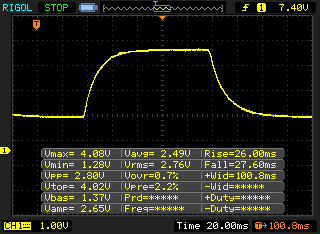 |
| ↘ 27.6 ms queda | ||
| A tela mostra taxas de resposta lentas em nossos testes e será insatisfatória para os jogadores. Em comparação, todos os dispositivos testados variam de 0.165 (mínimo) a 636 (máximo) ms. » 90 % de todos os dispositivos são melhores. Isso significa que o tempo de resposta medido é pior que a média de todos os dispositivos testados (30.9 ms). | ||
Cintilação da tela / PWM (modulação por largura de pulso)
| Tela tremeluzindo / PWM não detectado | 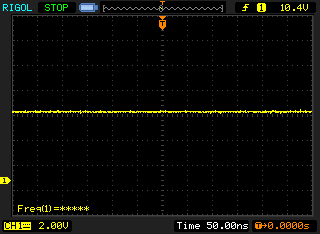 | ||
[pwm_comparison] Em comparação: 52 % de todos os dispositivos testados não usam PWM para escurecer a tela. Se PWM foi detectado, uma média de 7748 (mínimo: 5 - máximo: 343500) Hz foi medida. | |||
Cinebench R15: CPU Multi 64Bit | CPU Single 64Bit
Blender: v2.79 BMW27 CPU
7-Zip 18.03: 7z b 4 -mmt1 | 7z b 4
Geekbench 5.5: Single-Core | Multi-Core
HWBOT x265 Benchmark v2.2: 4k Preset
LibreOffice : 20 Documents To PDF
R Benchmark 2.5: Overall mean
| Cinebench R20 / CPU (Multi Core) | |
| Média da turma Subnotebook (579 - 8541, n=57, últimos 2 anos) | |
| Lenovo ThinkPad X13-20UGS00800 | |
| Acer SF514-55T | |
| Lenovo ThinkBook Plus 13 i7 | |
| Lenovo ThinkBook Plus 13 i7 | |
| Média Intel Core i7-10510U (1015 - 1897, n=38) | |
| Asus ZenBook 13 UX325JA | |
| Fujitsu Lifebook U939 i5 | |
| Dynabook Portege X30L-G1331 | |
| Cinebench R20 / CPU (Single Core) | |
| Média da turma Subnotebook (128 - 832, n=57, últimos 2 anos) | |
| Acer SF514-55T | |
| Lenovo ThinkPad X13-20UGS00800 | |
| Asus ZenBook 13 UX325JA | |
| Média Intel Core i7-10510U (362 - 497, n=37) | |
| Dynabook Portege X30L-G1331 | |
| Lenovo ThinkBook Plus 13 i7 | |
| Fujitsu Lifebook U939 i5 | |
| Cinebench R15 / CPU Multi 64Bit | |
| Média da turma Subnotebook (327 - 3345, n=57, últimos 2 anos) | |
| Lenovo ThinkPad X13-20UGS00800 | |
| Acer SF514-55T | |
| Asus ZenBook 13 UX325JA | |
| Lenovo ThinkBook Plus 13 i7 | |
| Lenovo ThinkBook Plus 13 i7 | |
| Média Intel Core i7-10510U (482 - 856, n=45) | |
| Fujitsu Lifebook U939 i5 | |
| Dynabook Portege X30L-G1331 | |
| Cinebench R15 / CPU Single 64Bit | |
| Média da turma Subnotebook (72.4 - 322, n=57, últimos 2 anos) | |
| Acer SF514-55T | |
| Lenovo ThinkPad X13-20UGS00800 | |
| Asus ZenBook 13 UX325JA | |
| Média Intel Core i7-10510U (113 - 202, n=42) | |
| Dynabook Portege X30L-G1331 | |
| Fujitsu Lifebook U939 i5 | |
| Lenovo ThinkBook Plus 13 i7 | |
| Blender / v2.79 BMW27 CPU | |
| Fujitsu Lifebook U939 i5 | |
| Asus ZenBook 13 UX325JA | |
| Lenovo ThinkBook Plus 13 i7 | |
| Dynabook Portege X30L-G1331 | |
| Média Intel Core i7-10510U (628 - 1051, n=31) | |
| Acer SF514-55T | |
| Lenovo ThinkPad X13-20UGS00800 | |
| Média da turma Subnotebook (159 - 2271, n=58, últimos 2 anos) | |
| 7-Zip 18.03 / 7z b 4 -mmt1 | |
| Média da turma Subnotebook (2643 - 6699, n=59, últimos 2 anos) | |
| Acer SF514-55T | |
| Média Intel Core i7-10510U (3747 - 4981, n=31) | |
| Lenovo ThinkPad X13-20UGS00800 | |
| Dynabook Portege X30L-G1331 | |
| Lenovo ThinkBook Plus 13 i7 | |
| Asus ZenBook 13 UX325JA | |
| Fujitsu Lifebook U939 i5 | |
| 7-Zip 18.03 / 7z b 4 | |
| Média da turma Subnotebook (11668 - 77867, n=57, últimos 2 anos) | |
| Lenovo ThinkPad X13-20UGS00800 | |
| Acer SF514-55T | |
| Média Intel Core i7-10510U (12196 - 21298, n=31) | |
| Dynabook Portege X30L-G1331 | |
| Lenovo ThinkBook Plus 13 i7 | |
| Fujitsu Lifebook U939 i5 | |
| Asus ZenBook 13 UX325JA | |
| Geekbench 5.5 / Single-Core | |
| Média da turma Subnotebook (726 - 2224, n=49, últimos 2 anos) | |
| Acer SF514-55T | |
| Asus ZenBook 13 UX325JA | |
| Média Intel Core i7-10510U (977 - 1287, n=31) | |
| Lenovo ThinkPad X13-20UGS00800 | |
| Lenovo ThinkBook Plus 13 i7 | |
| Dynabook Portege X30L-G1331 | |
| Fujitsu Lifebook U939 i5 | |
| Geekbench 5.5 / Multi-Core | |
| Média da turma Subnotebook (2557 - 17218, n=49, últimos 2 anos) | |
| Acer SF514-55T | |
| Lenovo ThinkPad X13-20UGS00800 | |
| Asus ZenBook 13 UX325JA | |
| Média Intel Core i7-10510U (2474 - 4484, n=31) | |
| Dynabook Portege X30L-G1331 | |
| Fujitsu Lifebook U939 i5 | |
| Lenovo ThinkBook Plus 13 i7 | |
| HWBOT x265 Benchmark v2.2 / 4k Preset | |
| Média da turma Subnotebook (0.97 - 25.1, n=57, últimos 2 anos) | |
| Lenovo ThinkPad X13-20UGS00800 | |
| Acer SF514-55T | |
| Média Intel Core i7-10510U (3.41 - 6.04, n=31) | |
| Asus ZenBook 13 UX325JA | |
| Dynabook Portege X30L-G1331 | |
| Fujitsu Lifebook U939 i5 | |
| Lenovo ThinkBook Plus 13 i7 | |
| LibreOffice / 20 Documents To PDF | |
| Lenovo ThinkBook Plus 13 i7 | |
| Fujitsu Lifebook U939 i5 | |
| Dynabook Portege X30L-G1331 | |
| Média Intel Core i7-10510U (50.7 - 77.8, n=27) | |
| Lenovo ThinkPad X13-20UGS00800 | |
| Média da turma Subnotebook (39.9 - 220, n=56, últimos 2 anos) | |
| Asus ZenBook 13 UX325JA | |
| Acer SF514-55T | |
| R Benchmark 2.5 / Overall mean | |
| Fujitsu Lifebook U939 i5 | |
| Dynabook Portege X30L-G1331 | |
| Lenovo ThinkBook Plus 13 i7 | |
| Asus ZenBook 13 UX325JA | |
| Média Intel Core i7-10510U (0.637 - 0.81, n=28) | |
| Lenovo ThinkPad X13-20UGS00800 | |
| Acer SF514-55T | |
| Média da turma Subnotebook (0.4024 - 1.456, n=58, últimos 2 anos) | |
* ... menor é melhor
| PCMark 8 | |
| Home Score Accelerated v2 | |
| Lenovo ThinkPad X13-20UGS00800 | |
| Dynabook Portege X30L-G1331 | |
| Média Intel Core i7-10510U, Intel UHD Graphics 620 (3157 - 4251, n=13) | |
| Lenovo ThinkBook Plus 13 i7 | |
| Média da turma Subnotebook (1739 - 1828, n=2, últimos 2 anos) | |
| Work Score Accelerated v2 | |
| Lenovo ThinkPad X13-20UGS00800 | |
| Dynabook Portege X30L-G1331 | |
| Média Intel Core i7-10510U, Intel UHD Graphics 620 (3734 - 5366, n=13) | |
| Lenovo ThinkBook Plus 13 i7 | |
| Média da turma Subnotebook (1609 - 1656, n=2, últimos 2 anos) | |
| PCMark 8 Home Score Accelerated v2 | 3454 pontos | |
| PCMark 8 Work Score Accelerated v2 | 3734 pontos | |
| PCMark 10 Score | 4052 pontos | |
Ajuda | ||
| DPC Latencies / LatencyMon - interrupt to process latency (max), Web, Youtube, Prime95 | |
| Lenovo ThinkBook Plus 13 i7 | |
* ... menor é melhor
| Lenovo ThinkBook Plus 13 i7 WDC PC SN730 SDBPNTY-512G | Dynabook Portege X30L-G1331 Samsung SSD PM981a MZVLB512HBJQ | Fujitsu Lifebook U939 i5 Samsung SSD PM981 MZVLB512HAJQ | Lenovo ThinkPad X13-20UGS00800 Samsung SSD PM981a MZVLB512HBJQ | Média WDC PC SN730 SDBPNTY-512G | |
|---|---|---|---|---|---|
| CrystalDiskMark 5.2 / 6 | 7% | -4% | 2% | 10% | |
| Write 4K (MB/s) | 135.4 | 164.1 21% | 159 17% | 95.7 -29% | 164.3 ? 21% |
| Read 4K (MB/s) | 48.83 | 49.34 1% | 48.12 -1% | 37.47 -23% | 48.2 ? -1% |
| Write Seq (MB/s) | 2036 | 1777 -13% | 1657 -19% | 2032 0% | 2096 ? 3% |
| Read Seq (MB/s) | 2127 | 1752 -18% | 1522 -28% | 2207 4% | 2123 ? 0% |
| Write 4K Q32T1 (MB/s) | 394.1 | 401.1 2% | 349.2 -11% | 517 31% | 451 ? 14% |
| Read 4K Q32T1 (MB/s) | 345.2 | 498.7 44% | 452.2 31% | 387 12% | 509 ? 47% |
| Write Seq Q32T1 (MB/s) | 2700 | 2988 11% | 1941 -28% | 2977 10% | 2551 ? -6% |
| Read Seq Q32T1 (MB/s) | 3331 | 3544 6% | 3510 5% | 3556 7% | 3330 ? 0% |

Sustained Read Performance: DiskSpd Read Loop, Queue Depth 8
| 3DMark 11 - 1280x720 Performance GPU | |
| Média da turma Subnotebook (995 - 18489, n=55, últimos 2 anos) | |
| Lenovo ThinkPad X13-20UGS00800 | |
| Dynabook Portege X30L-G1331 | |
| Média Intel UHD Graphics 620 (1144 - 3432, n=244) | |
| Fujitsu Lifebook U939 i5 | |
| Lenovo ThinkBook Plus 13 i7 | |
| 3DMark | |
| 1280x720 Cloud Gate Standard Graphics | |
| Média da turma Subnotebook (5577 - 61591, n=29, últimos 2 anos) | |
| Lenovo ThinkPad X13-20UGS00800 | |
| Média Intel UHD Graphics 620 (6205 - 16400, n=225) | |
| Lenovo ThinkBook Plus 13 i7 | |
| 1920x1080 Fire Strike Graphics | |
| Média da turma Subnotebook (832 - 32931, n=57, últimos 2 anos) | |
| Lenovo ThinkPad X13-20UGS00800 | |
| Dynabook Portege X30L-G1331 | |
| Média Intel UHD Graphics 620 (557 - 2608, n=213) | |
| Lenovo ThinkBook Plus 13 i7 | |
| 2560x1440 Time Spy Graphics | |
| Média da turma Subnotebook (804 - 14477, n=56, últimos 2 anos) | |
| Lenovo ThinkPad X13-20UGS00800 | |
| Dynabook Portege X30L-G1331 | |
| Média Intel UHD Graphics 620 (299 - 797, n=88) | |
| Lenovo ThinkBook Plus 13 i7 | |
| 3DMark 11 Performance | 1909 pontos | |
| 3DMark Cloud Gate Standard Score | 7366 pontos | |
| 3DMark Fire Strike Score | 988 pontos | |
| 3DMark Time Spy Score | 395 pontos | |
Ajuda | ||
| baixo | média | alto | ultra | |
|---|---|---|---|---|
| The Witcher 3 (2015) | 15.9 | |||
| Dota 2 Reborn (2015) | 65.6 | 39.4 | 18.5 | 16.5 |
| X-Plane 11.11 (2018) | 11.5 | 10.3 | 9.58 | |
| Shadow of the Tomb Raider (2018) | 16.3 | |||
| Total War: Three Kingdoms (2019) | 18.2 |
Barulho
| Ocioso |
| 29.3 / 29.3 / 30.1 dB |
| Carga |
| 30.9 / 32.5 dB |
 | ||
30 dB silencioso 40 dB(A) audível 50 dB(A) ruidosamente alto |
||
min: | ||
(+) A temperatura máxima no lado superior é 33 °C / 91 F, em comparação com a média de 35.9 °C / 97 F , variando de 21.4 a 59 °C para a classe Subnotebook.
(+) A parte inferior aquece até um máximo de 38.8 °C / 102 F, em comparação com a média de 39.2 °C / 103 F
(+) Em uso inativo, a temperatura média para o lado superior é 25.1 °C / 77 F, em comparação com a média do dispositivo de 30.8 °C / ### class_avg_f### F.
(+) Os apoios para as mãos e o touchpad são mais frios que a temperatura da pele, com um máximo de 24.6 °C / 76.3 F e, portanto, são frios ao toque.
(+) A temperatura média da área do apoio para as mãos de dispositivos semelhantes foi 28.2 °C / 82.8 F (+3.6 °C / 6.5 F).
Lenovo ThinkBook Plus 13 i7 análise de áudio
(-) | alto-falantes não muito altos (###valor### dB)
Graves 100 - 315Hz
(-) | quase nenhum baixo - em média 15% menor que a mediana
(-) | graves não são lineares (16.1% delta para frequência anterior)
Médios 400 - 2.000 Hz
(±) | médios mais altos - em média 5.9% maior que a mediana
(+) | médios são lineares (5.6% delta para frequência anterior)
Altos 2 - 16 kHz
(+) | agudos equilibrados - apenas 3.6% longe da mediana
(±) | a linearidade dos máximos é média (9% delta para frequência anterior)
Geral 100 - 16.000 Hz
(±) | a linearidade do som geral é média (23.9% diferença em relação à mediana)
Comparado com a mesma classe
» 81% de todos os dispositivos testados nesta classe foram melhores, 4% semelhantes, 15% piores
» O melhor teve um delta de 5%, a média foi 18%, o pior foi 53%
Comparado com todos os dispositivos testados
» 72% de todos os dispositivos testados foram melhores, 6% semelhantes, 22% piores
» O melhor teve um delta de 4%, a média foi 23%, o pior foi 134%
Apple MacBook 12 (Early 2016) 1.1 GHz análise de áudio
(+) | os alto-falantes podem tocar relativamente alto (###valor### dB)
Graves 100 - 315Hz
(±) | graves reduzidos - em média 11.3% menor que a mediana
(±) | a linearidade dos graves é média (14.2% delta para a frequência anterior)
Médios 400 - 2.000 Hz
(+) | médios equilibrados - apenas 2.4% longe da mediana
(+) | médios são lineares (5.5% delta para frequência anterior)
Altos 2 - 16 kHz
(+) | agudos equilibrados - apenas 2% longe da mediana
(+) | os máximos são lineares (4.5% delta da frequência anterior)
Geral 100 - 16.000 Hz
(+) | o som geral é linear (10.2% diferença em relação à mediana)
Comparado com a mesma classe
» 7% de todos os dispositivos testados nesta classe foram melhores, 2% semelhantes, 90% piores
» O melhor teve um delta de 5%, a média foi 18%, o pior foi 53%
Comparado com todos os dispositivos testados
» 5% de todos os dispositivos testados foram melhores, 1% semelhantes, 94% piores
» O melhor teve um delta de 4%, a média foi 23%, o pior foi 134%
| desligado | |
| Ocioso | |
| Carga |
|
Key:
min: | |
| Lenovo ThinkBook Plus 13 i7 i7-10510U, UHD Graphics 620, WDC PC SN730 SDBPNTY-512G, IPS LED, 1920x1080, 13.3" | Dynabook Portege X30L-G1331 i5-10210U, UHD Graphics 620, Samsung SSD PM981a MZVLB512HBJQ, IPS, 1920x1080, 13.3" | Fujitsu Lifebook U939 i5 i5-8265U, UHD Graphics 620, Samsung SSD PM981 MZVLB512HAJQ, IPS, 1920x1080, 13.3" | Lenovo ThinkPad X13-20UGS00800 R7 PRO 4750U, Vega 7, Samsung SSD PM981a MZVLB512HBJQ, IPS LED, 1920x1080, 13.3" | Média Intel UHD Graphics 620 | Média da turma Subnotebook | |
|---|---|---|---|---|---|---|
| Power Consumption | -1% | -10% | -27% | -12% | -23% | |
| Idle Minimum * (Watt) | 4.5 | 2.8 38% | 3.1 31% | 6 -33% | 3.81 ? 15% | 3.71 ? 18% |
| Idle Average * (Watt) | 6.9 | 4.9 29% | 5.9 14% | 8.9 -29% | 6.94 ? -1% | 6.54 ? 5% |
| Idle Maximum * (Watt) | 7.92 | 9 -14% | 9.2 -16% | 11.3 -43% | 8.75 ? -10% | 7.89 ? -0% |
| Load Average * (Watt) | 30 | 31.2 -4% | 35.8 -19% | 34.2 -14% | 35 ? -17% | 42.1 ? -40% |
| Load Maximum * (Watt) | 32.6 | 49.4 -52% | 51.9 -59% | 37.2 -14% | 47.5 ? -46% | 65.1 ? -100% |
* ... menor é melhor
| Lenovo ThinkBook Plus 13 i7 i7-10510U, UHD Graphics 620, 45 Wh | Dynabook Portege X30L-G1331 i5-10210U, UHD Graphics 620, 42 Wh | Fujitsu Lifebook U939 i5 i5-8265U, UHD Graphics 620, 50 Wh | Lenovo ThinkPad X13-20UGS00800 R7 PRO 4750U, Vega 7, 48 Wh | Média da turma Subnotebook | |
|---|---|---|---|---|---|
| Duração da bateria | 0% | -1% | -7% | 50% | |
| H.264 (h) | 9.1 | 8.3 -9% | 15.3 ? 68% | ||
| WiFi v1.3 (h) | 8.3 | 8.3 0% | 8.2 -1% | 8.7 5% | 14.1 ? 70% |
| Load (h) | 1.8 | 1.5 -17% | 1.998 ? 11% |
Pro
Contra

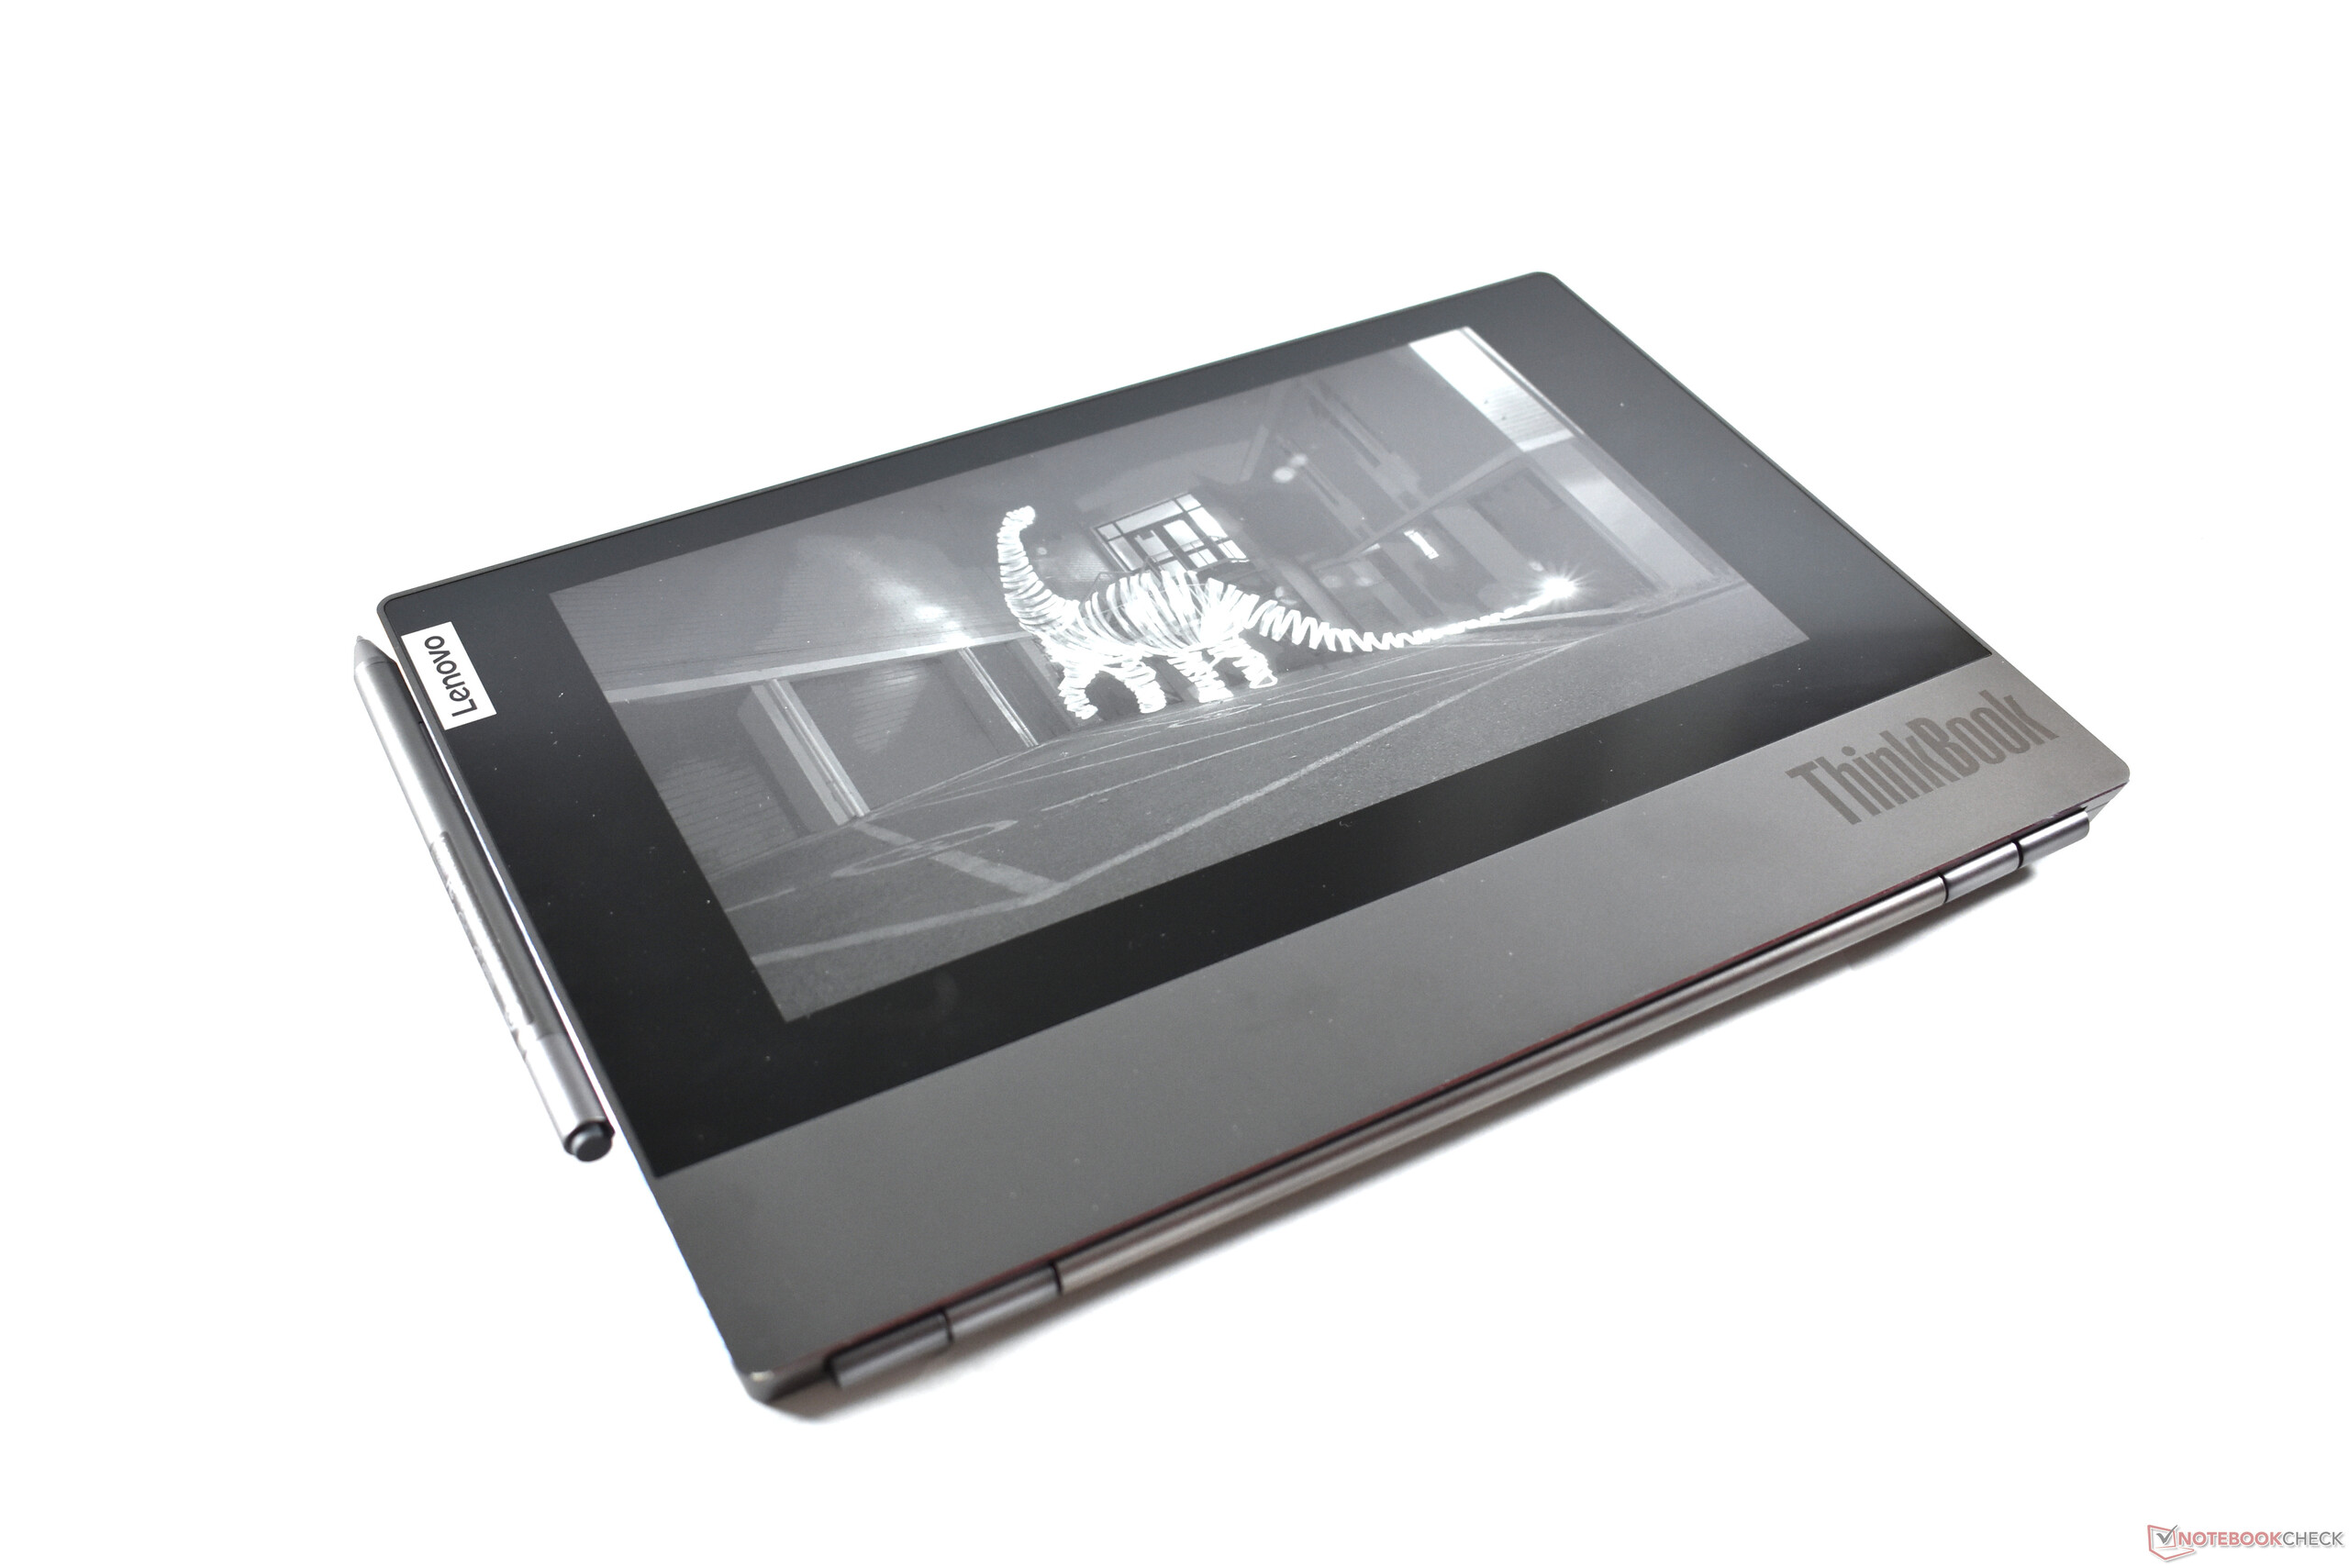
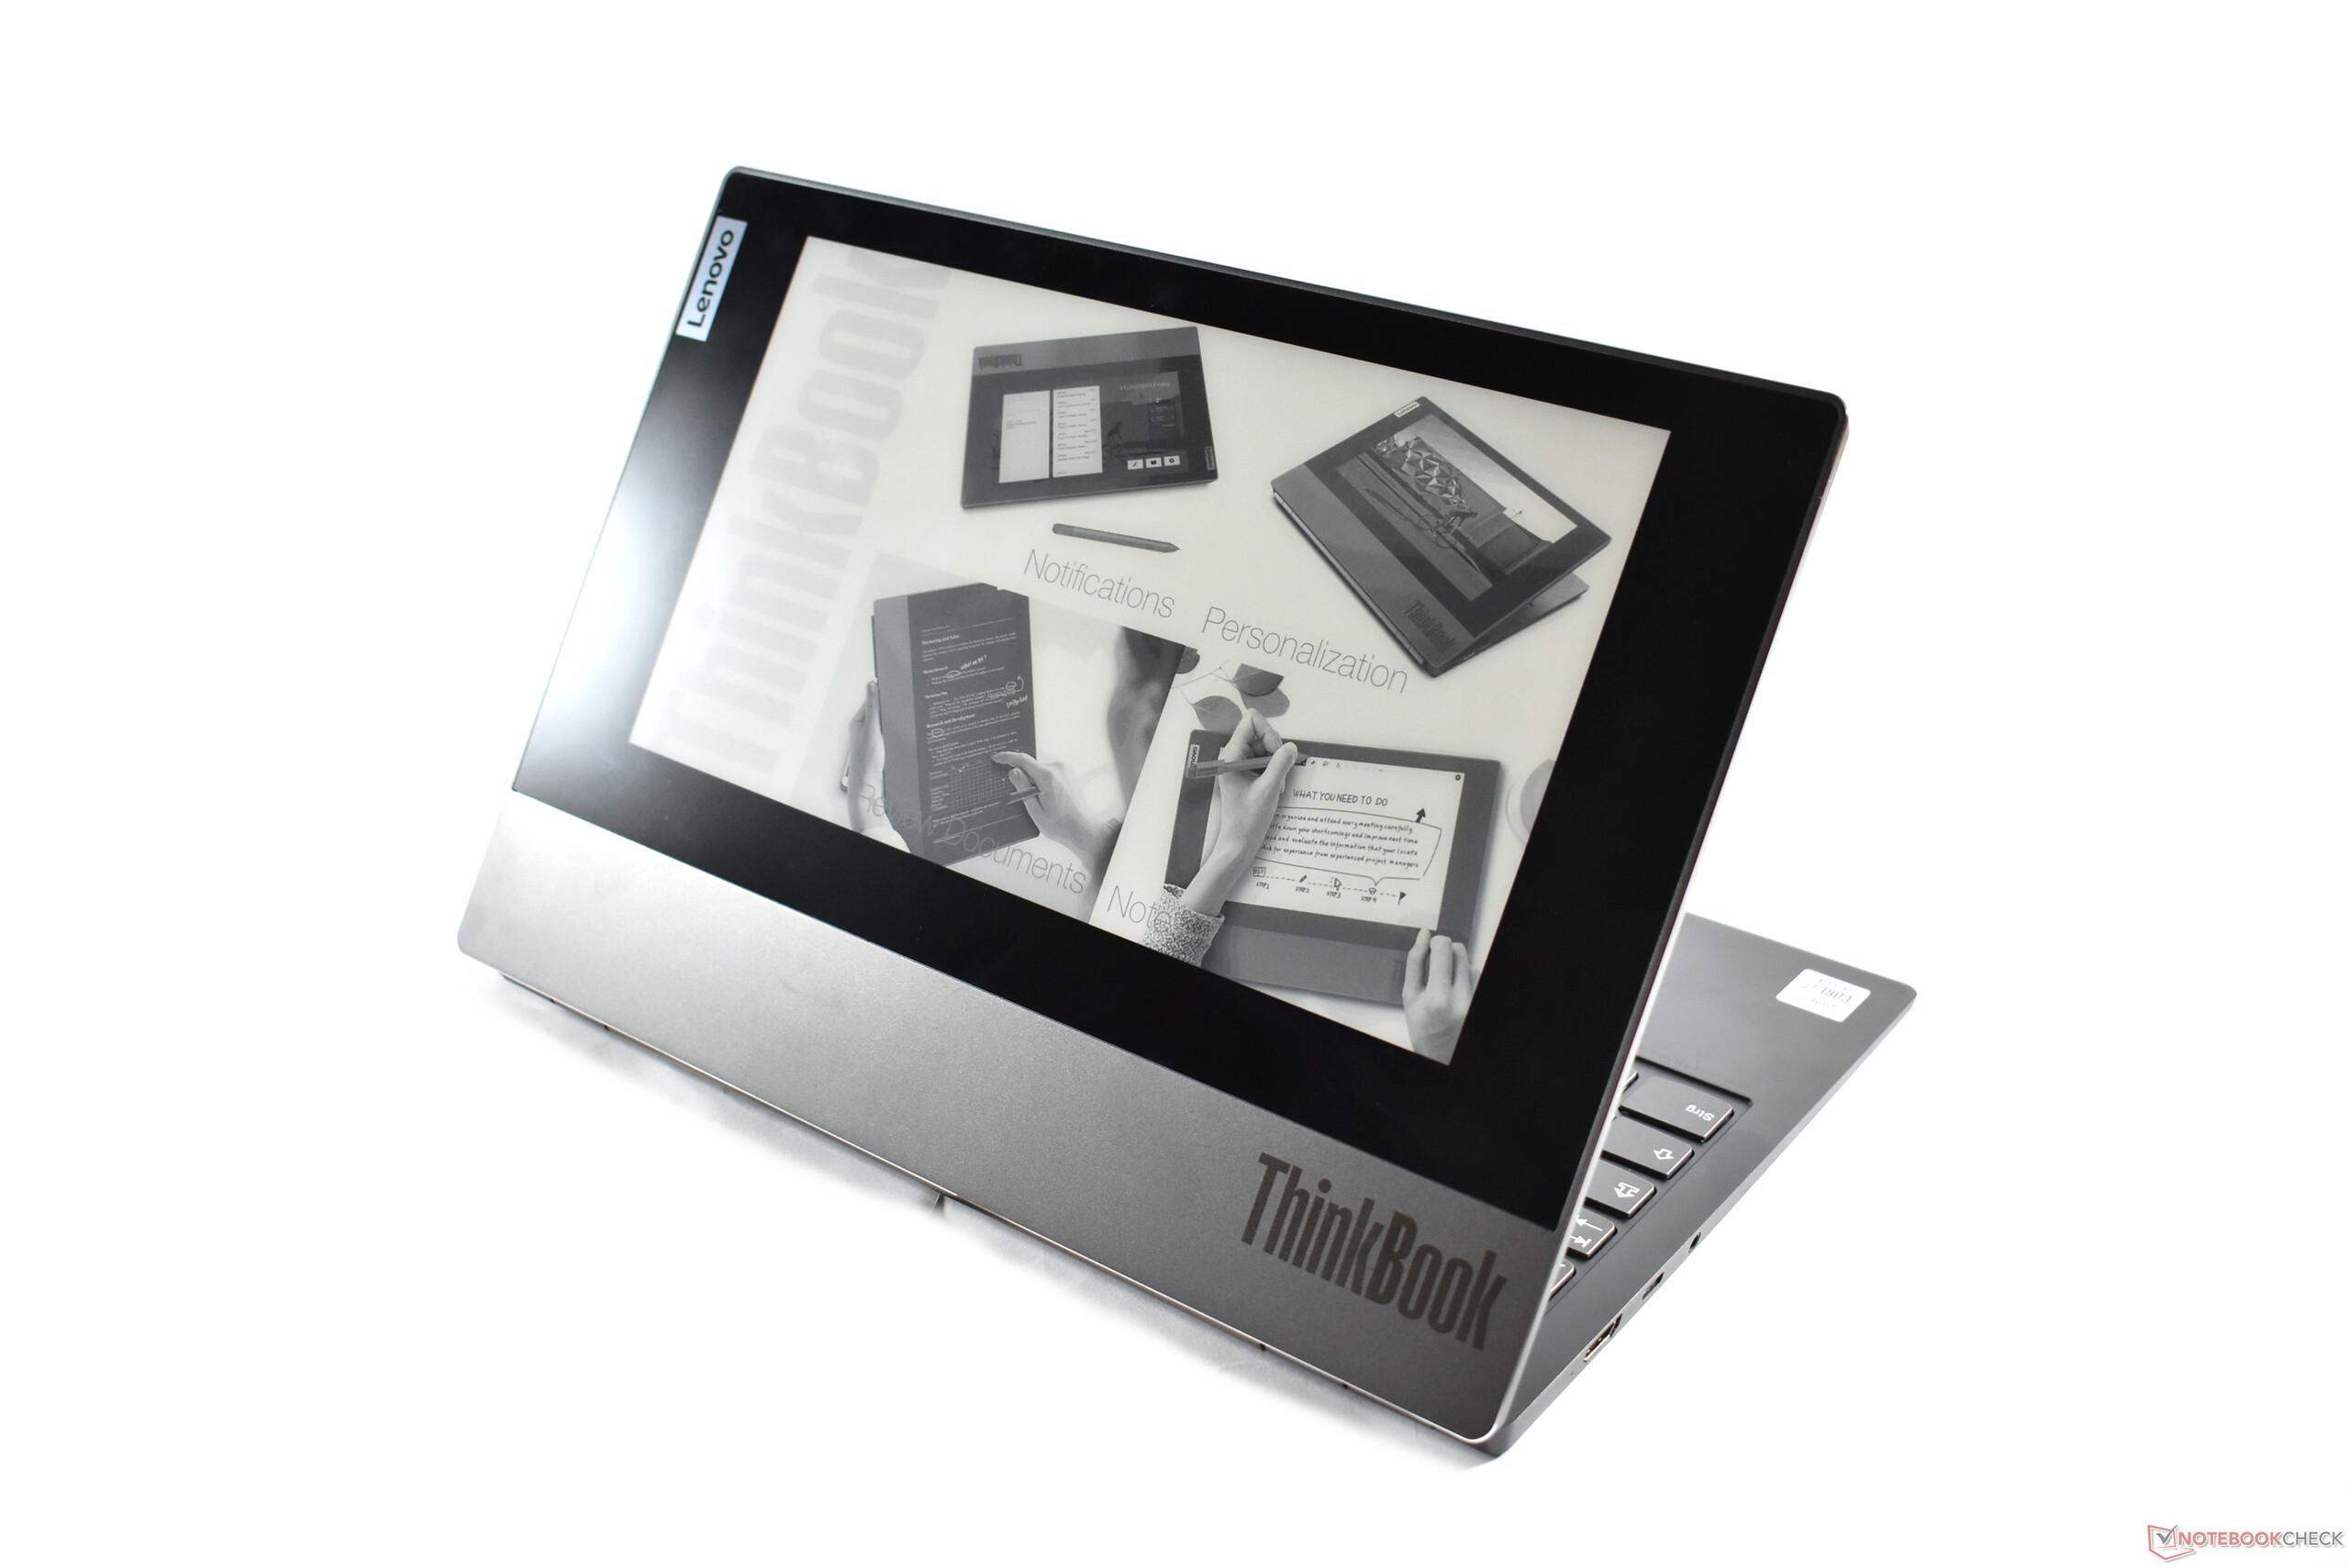
E-ink ou não e-ink? Essa será inevitavelmente a questão principal a ser considerada, caso você esteja interessado no ThinkBook Plus. Se você realmente pretende usar a tela e-ink na tampa da tela, então essa pergunta já foi respondida e a decisão de compra provavelmente já foi tomada.
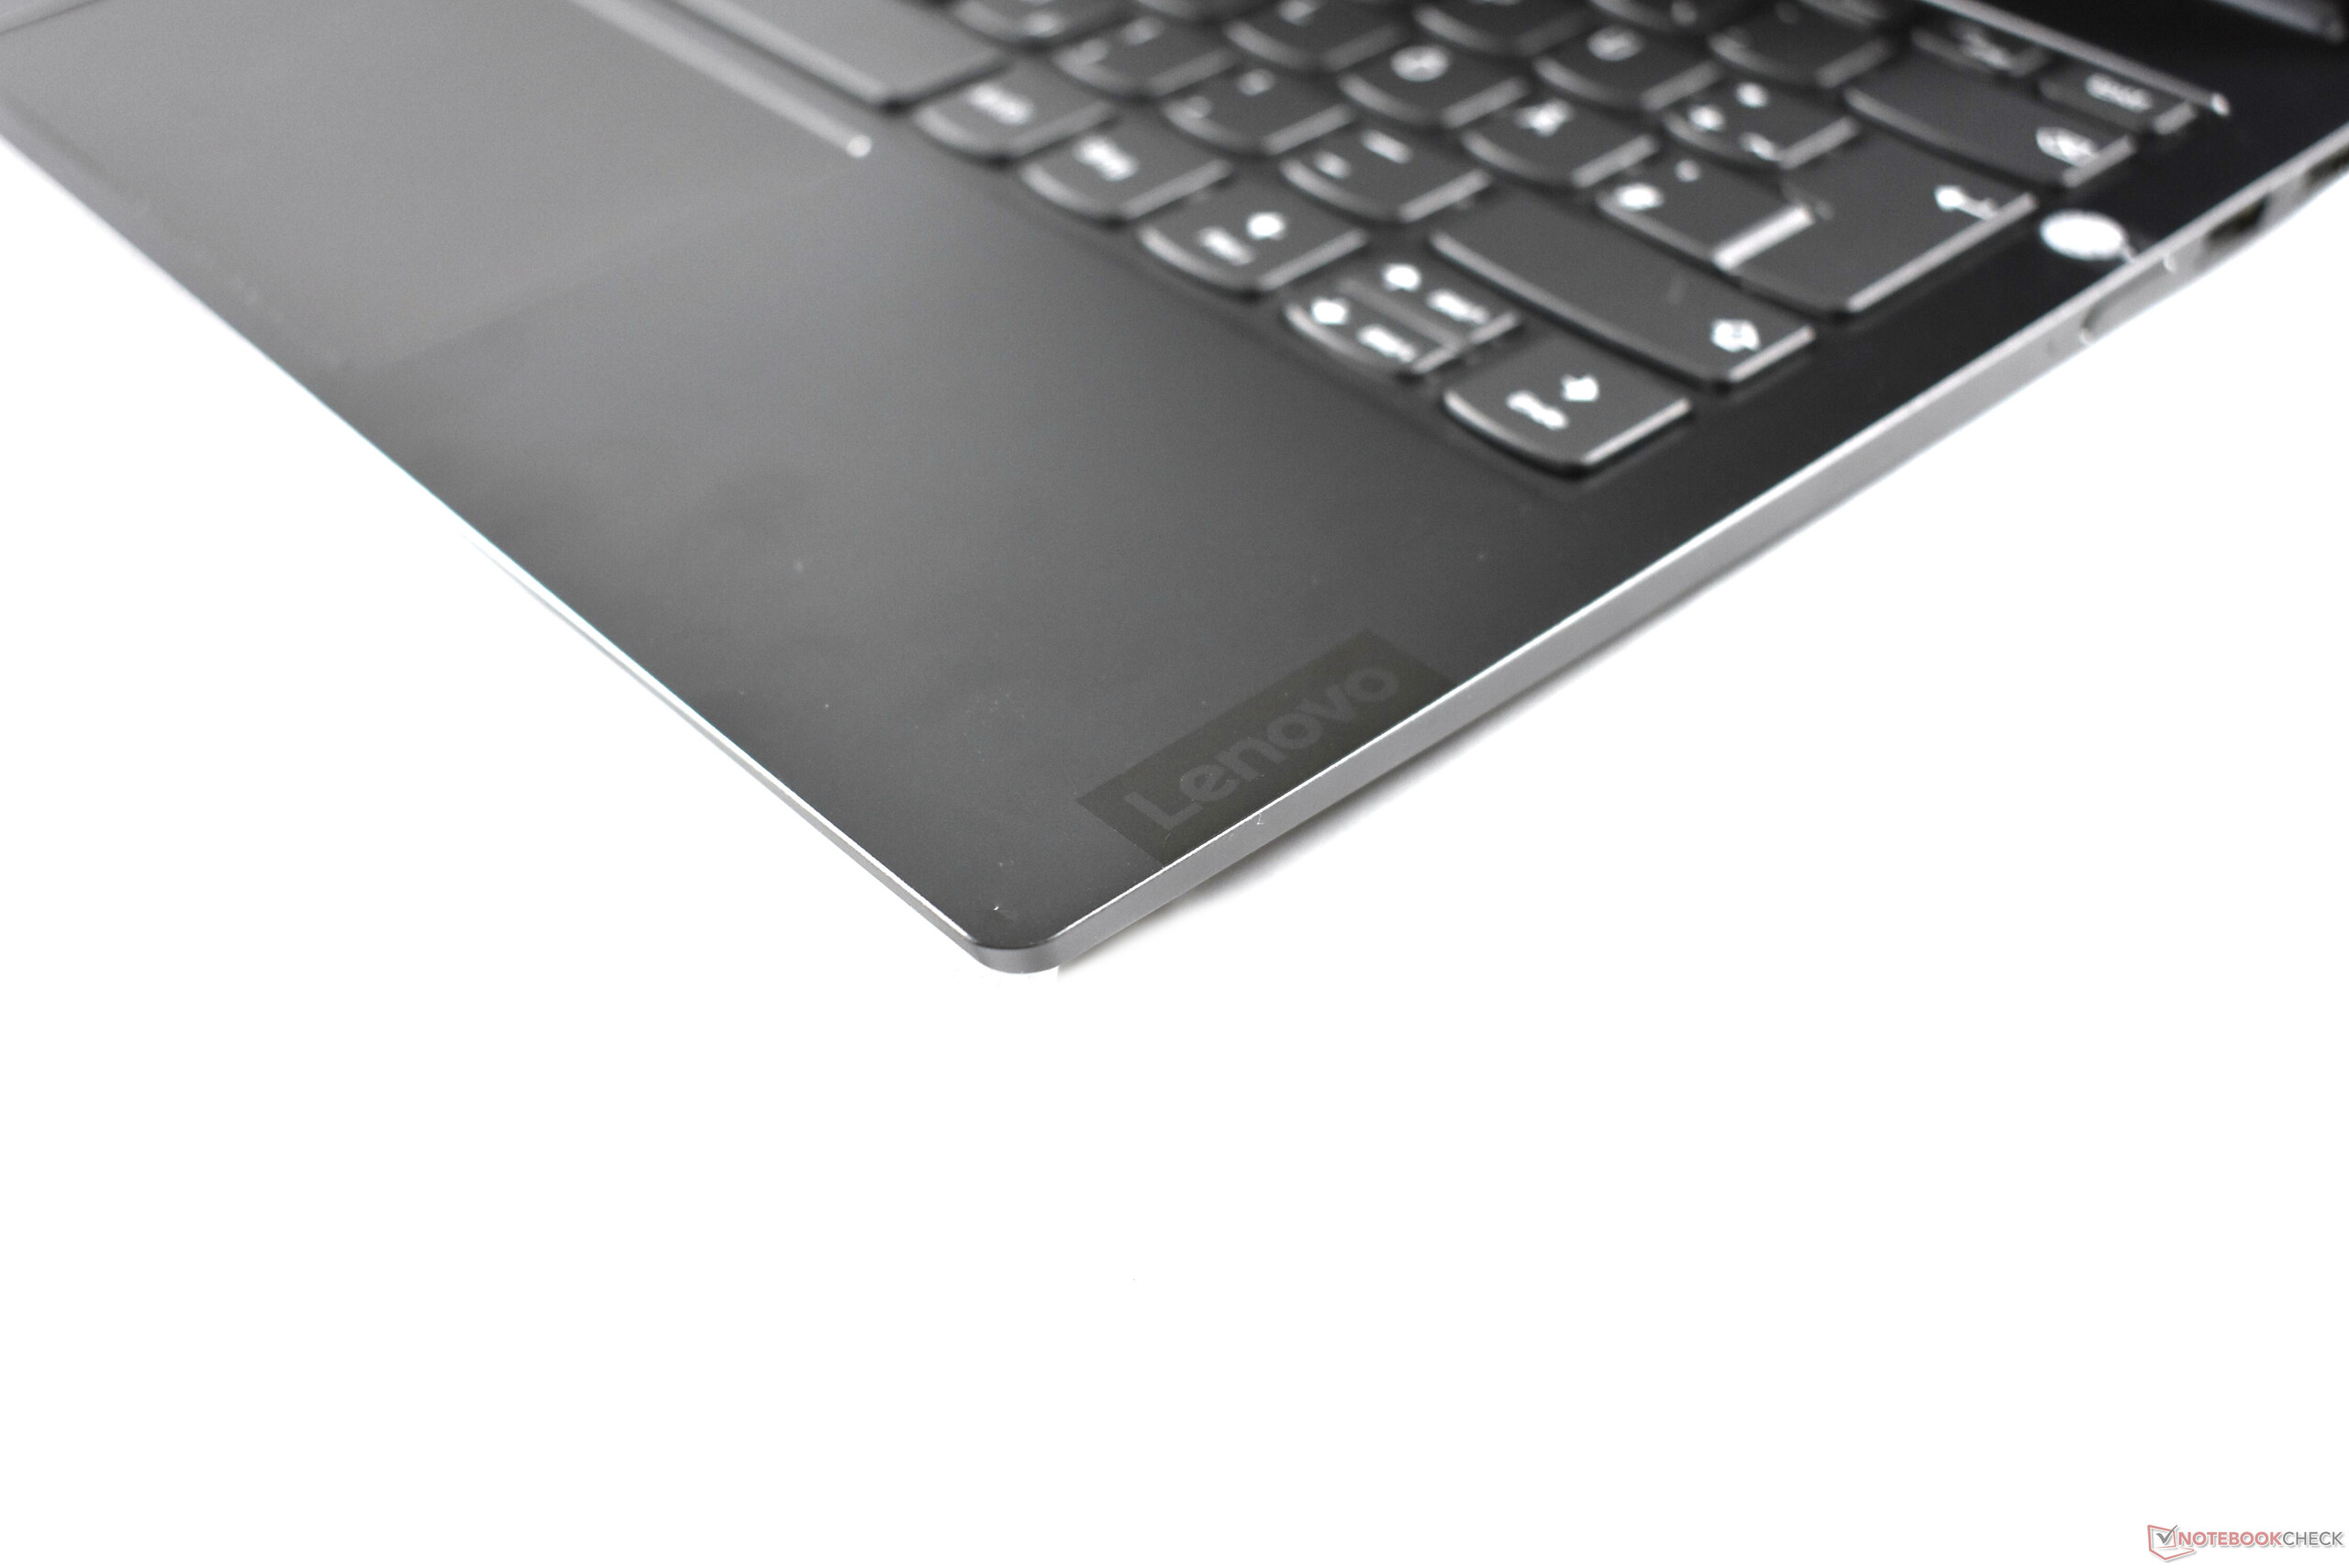
Além dessa característica reconhecidamente única, encontramos poucos ou nenhum feito interessante. Teclado, carcaça e tela LCD são decentes, mas não melhores do que a média em sua classe, assim como a duração da bateria. O ThinkBook Plus tem o benefício de baixas temperaturas, bem como a caneta digitalizadora incluída para a tela de e-ink. Que, por sua vez, é seu maior e mais proeminente benefício e sem dúvida seu único ponto de venda.
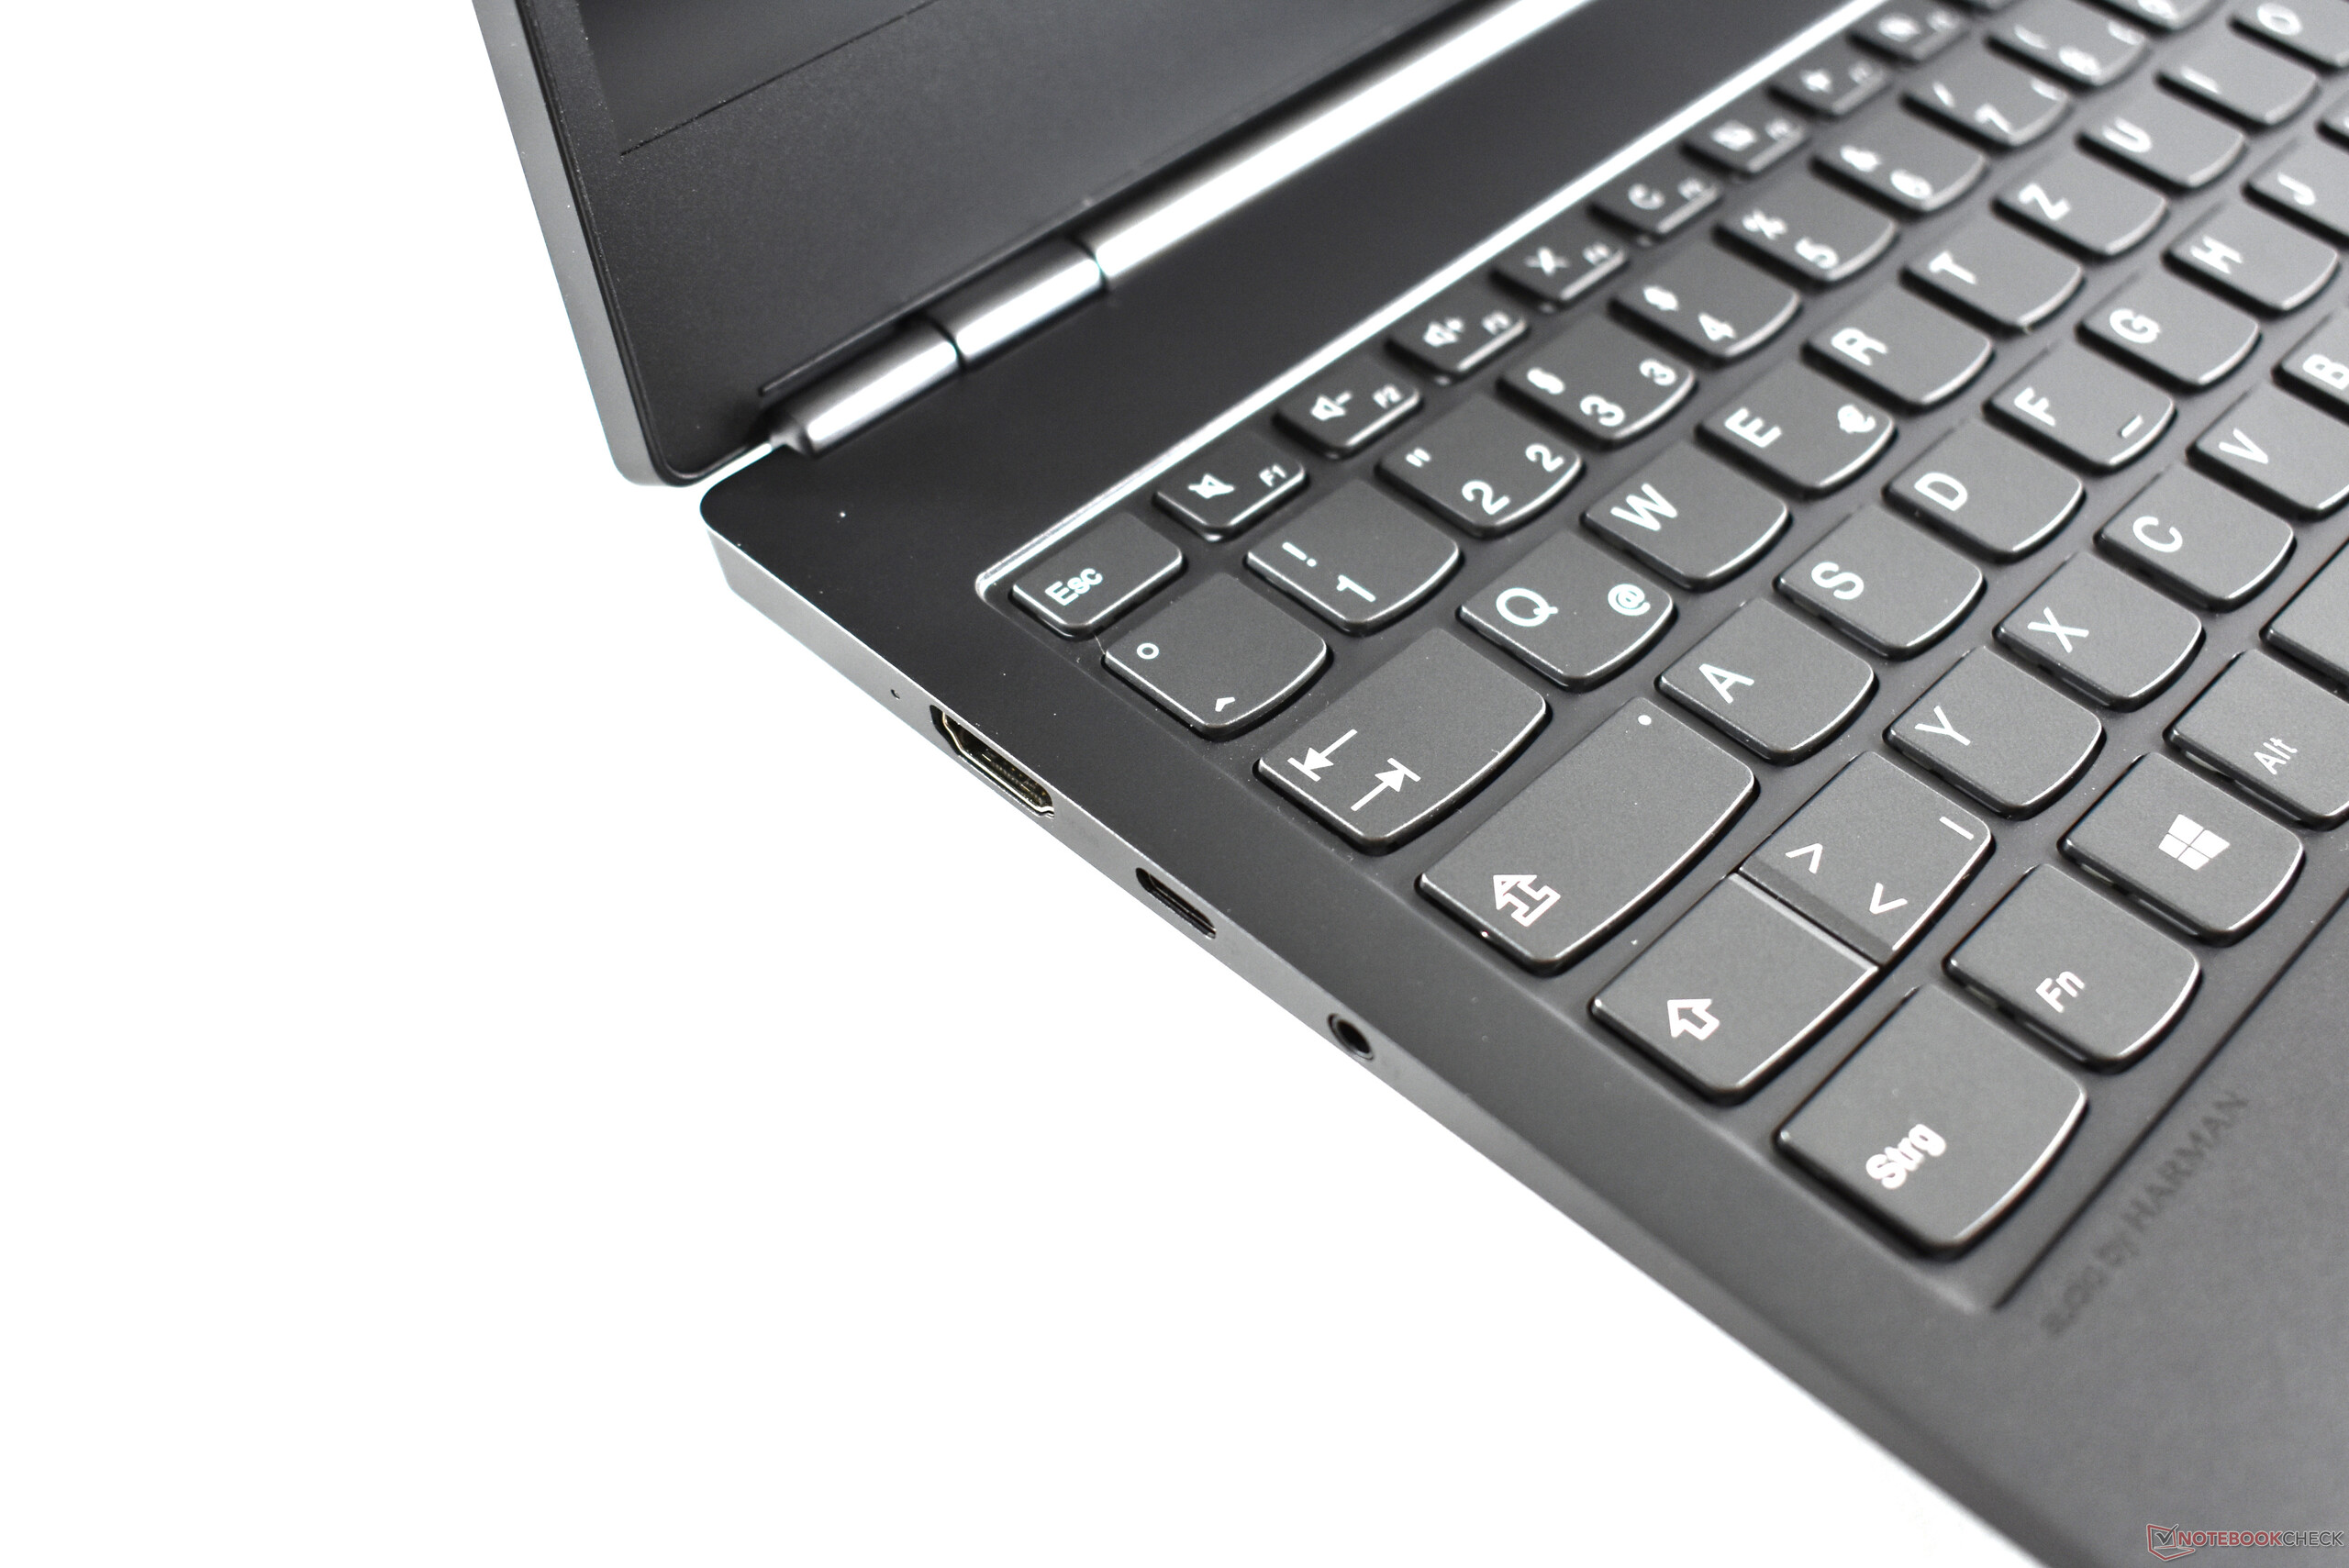
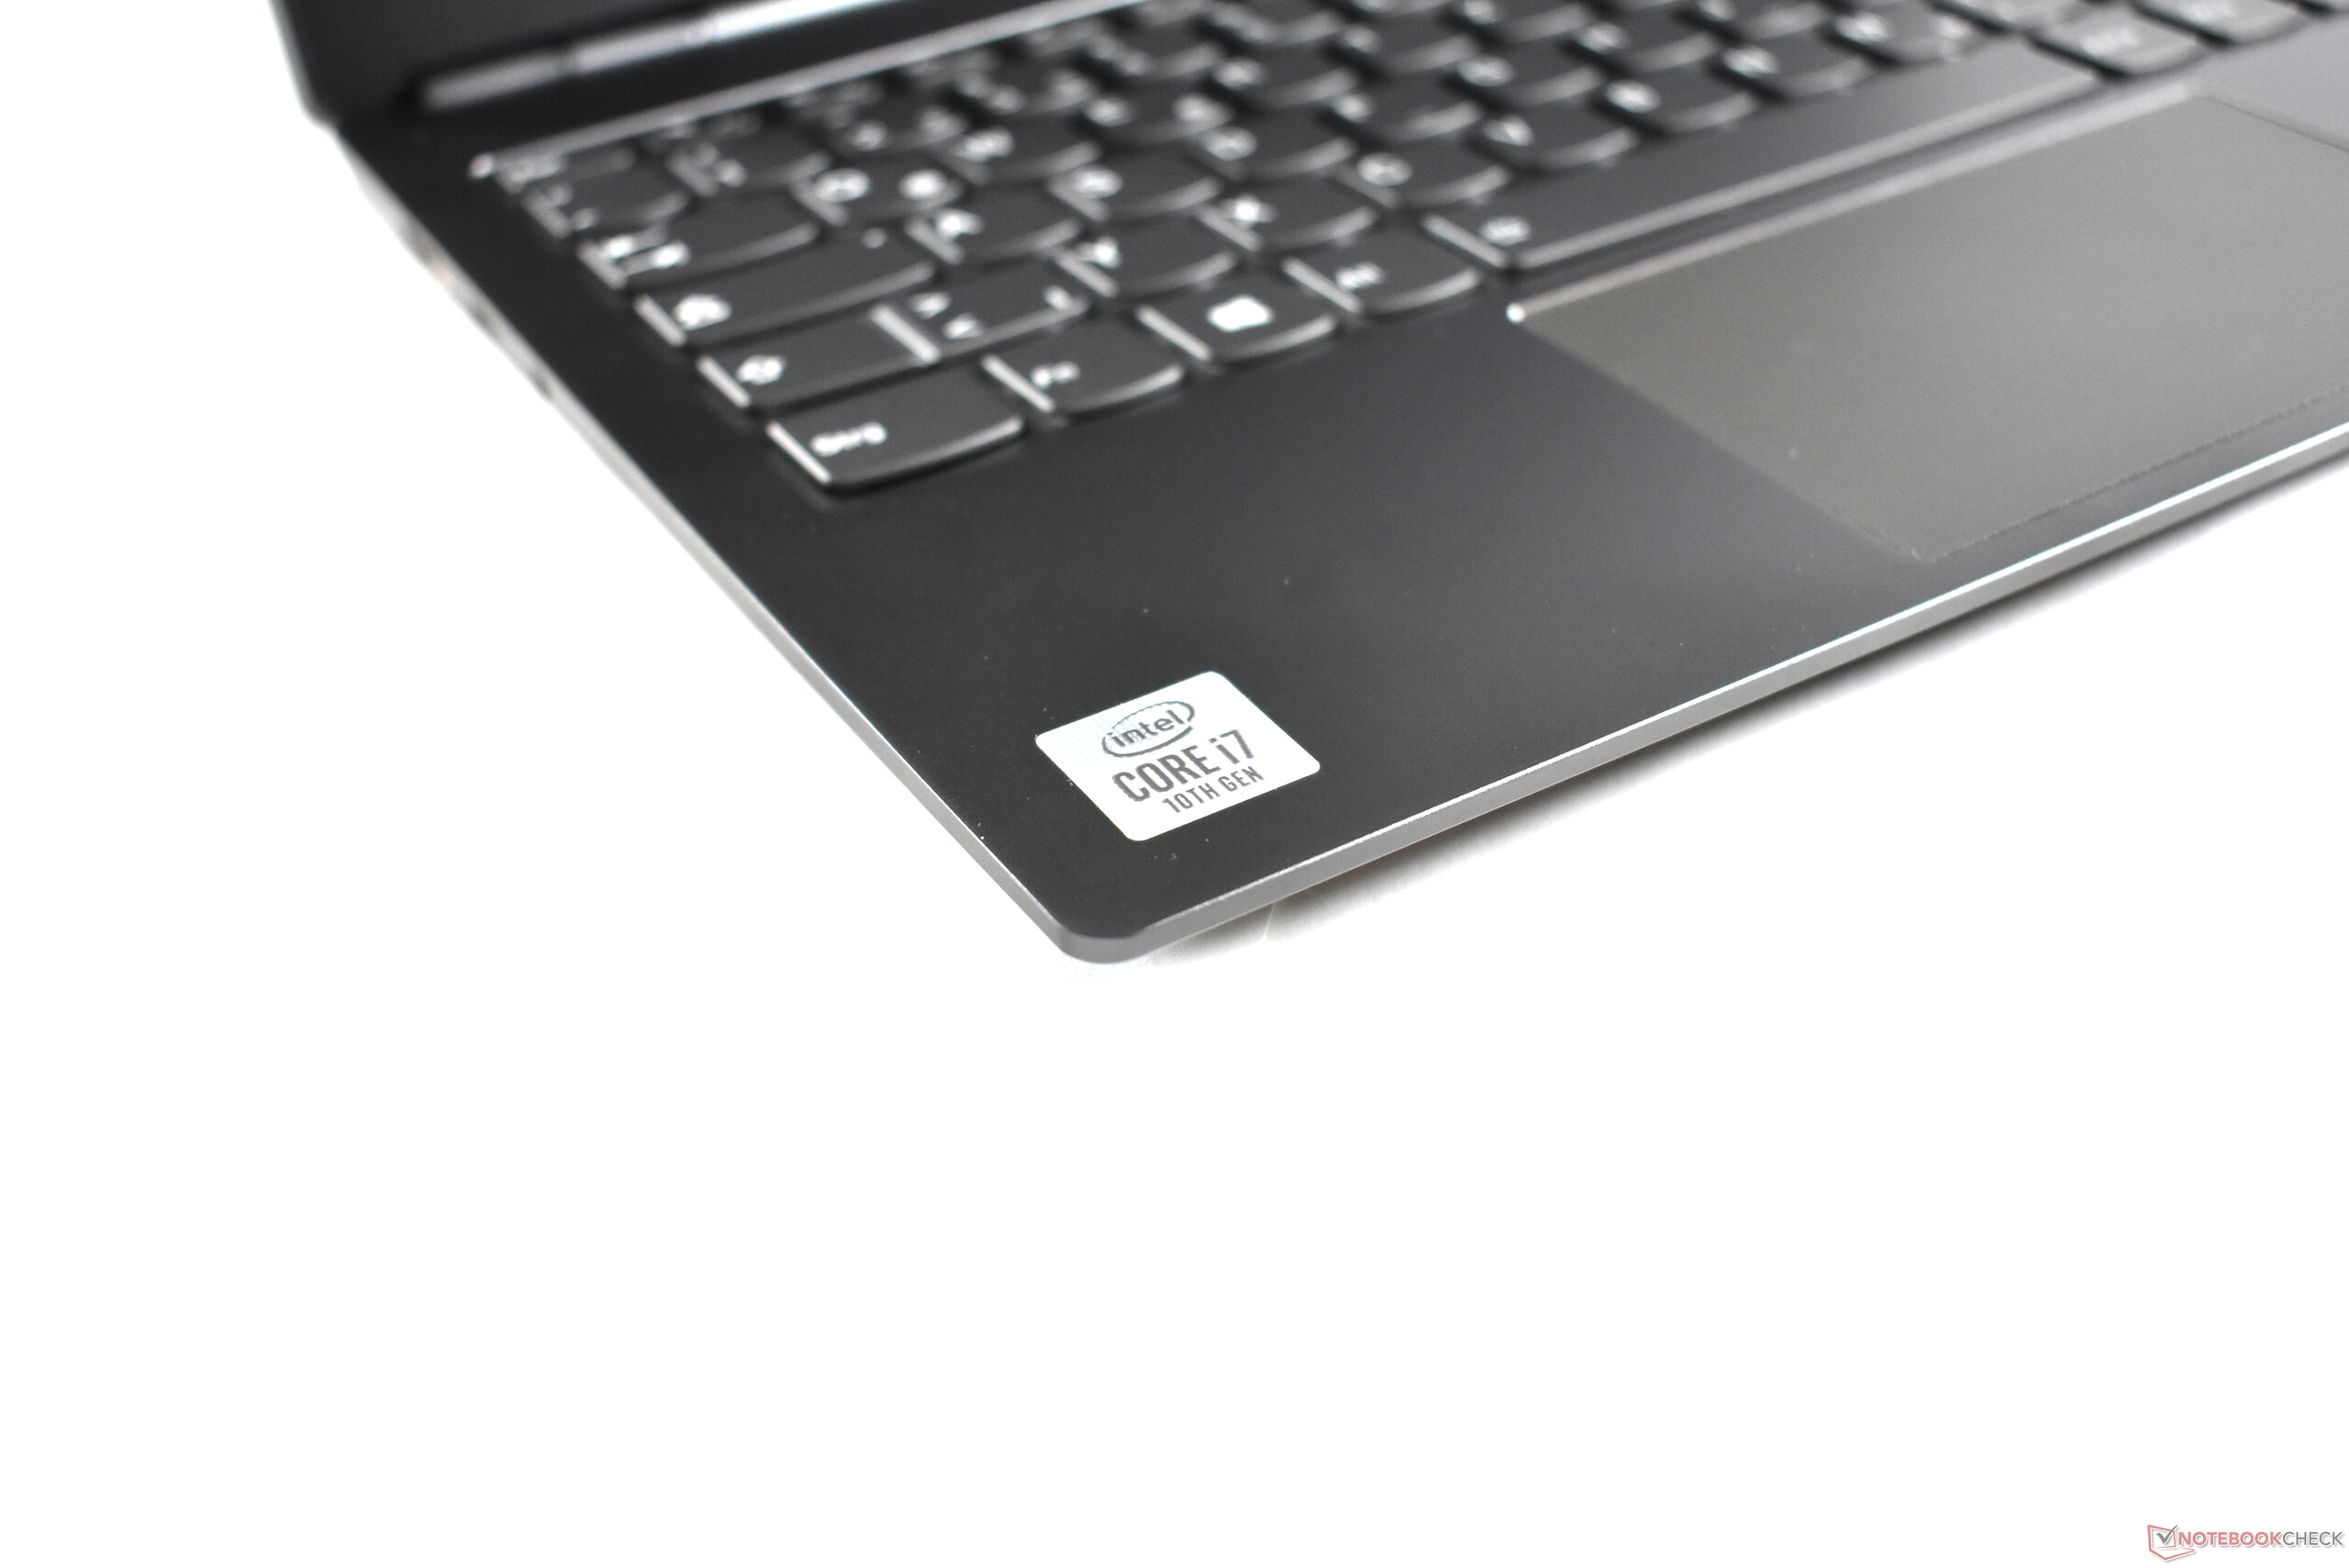
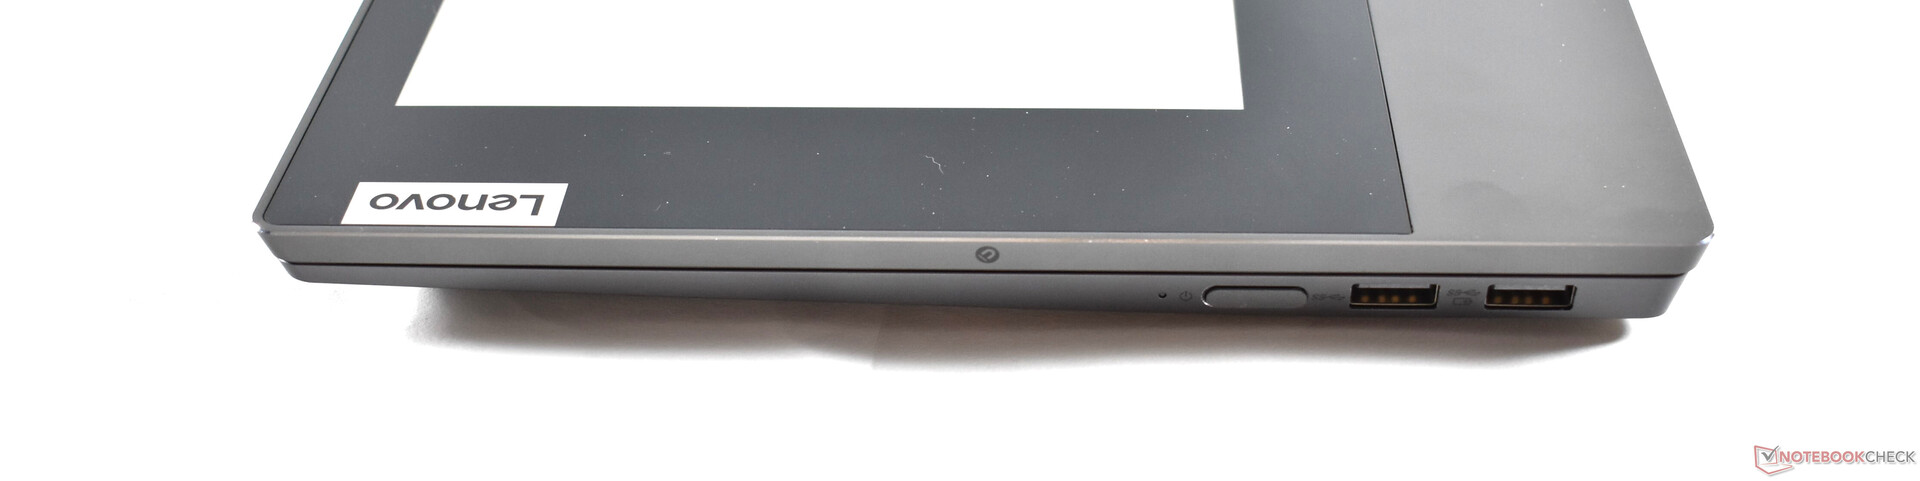
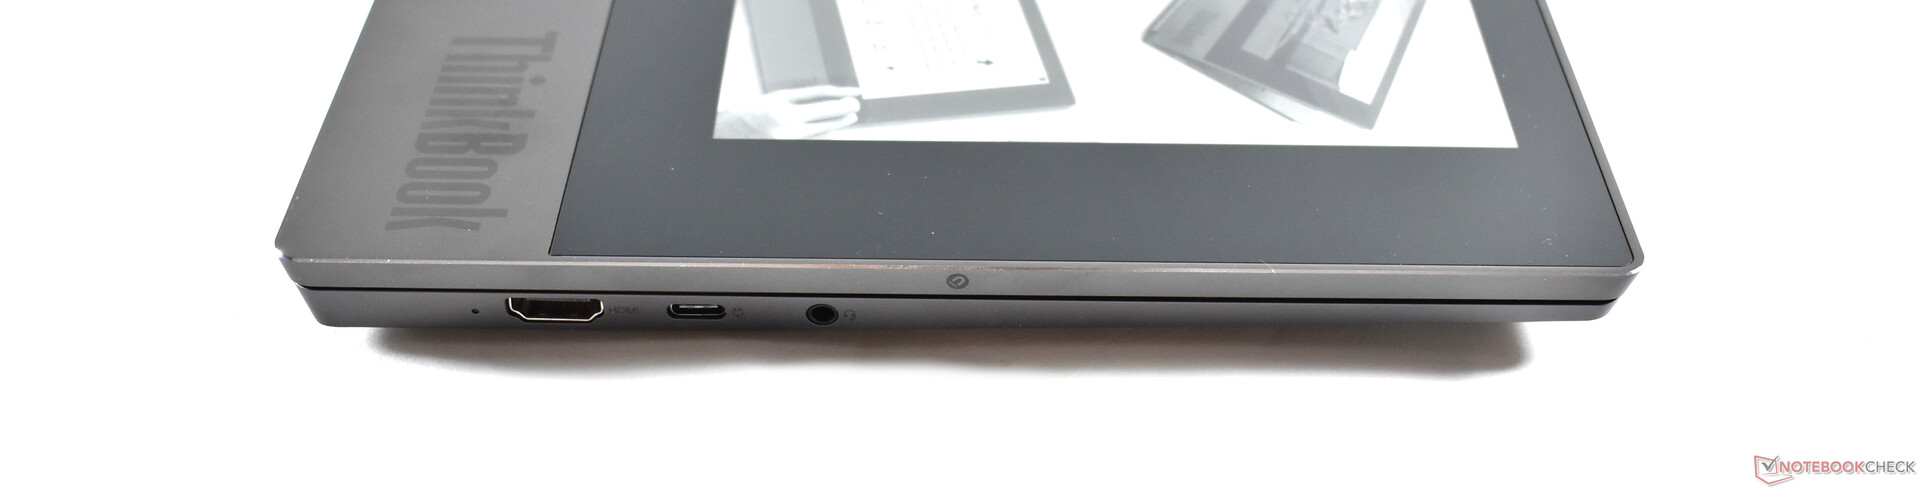
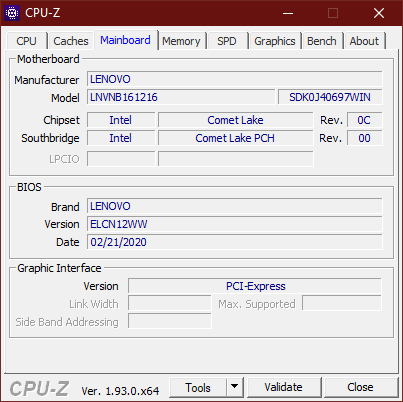
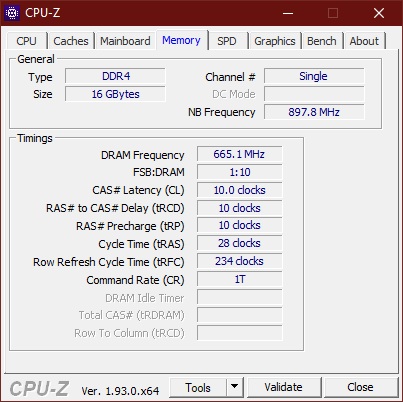
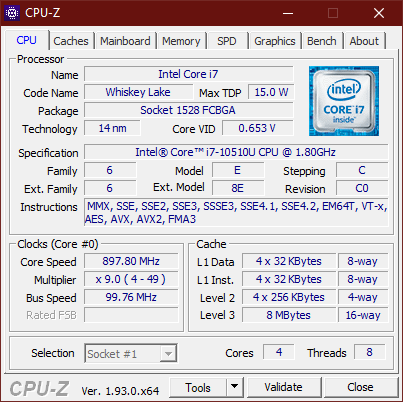
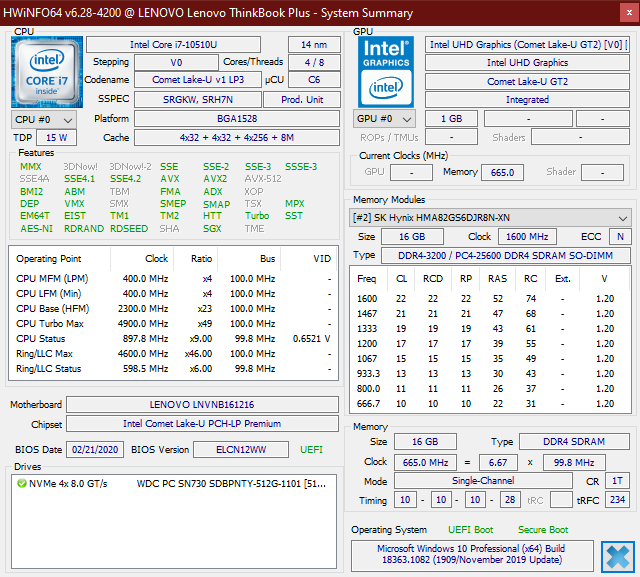
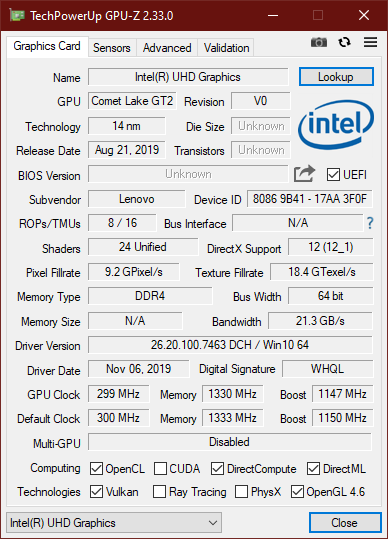
Por outro lado, está equipado com CPUs Comet Lake desatualizadas da Intel para o qual não encontramos absolutamente nenhuma explicação, pois, ao contrário dos portáteis empresariais reais da Lenovo, o vPro nem mesmo é suportado. Consequentemente, a falta desempenho, que é ainda mais fortalecida pelo fato de que o ThinkBook Plus não tenha suporte para RAM de canal duplo devido ao seu único slot de RAM. Sua conectividade (sem Thunderbolt, sem microSD) e segurança são comparativamente pobres, e sua garantia padrão de apenas 12 meses é quase um insulto para um portátil nesta faixa de preço.
A tela e-ink é o único recurso exclusivo e especial do ThinkBook Plus. Se você não está interessado nele, estará melhor com outro dispositivo.
Existem vários portáteis de 13,3 polegadas melhores do que o Lenovo ThinkBook Plus. Só se você realmente precisar ou quiser aquele monitor e-ink, vale a pena comprar.
Observação: dado que, de outra forma, não seríamos capazes de considerar a tela e-ink em nossa classificação, aumentamos a pontuação total do ThinkBook Plus em um ponto.
Lenovo ThinkBook Plus 13 i7
- 09/28/2020 v7 (old)
Benjamin Herzig
Price comparison
