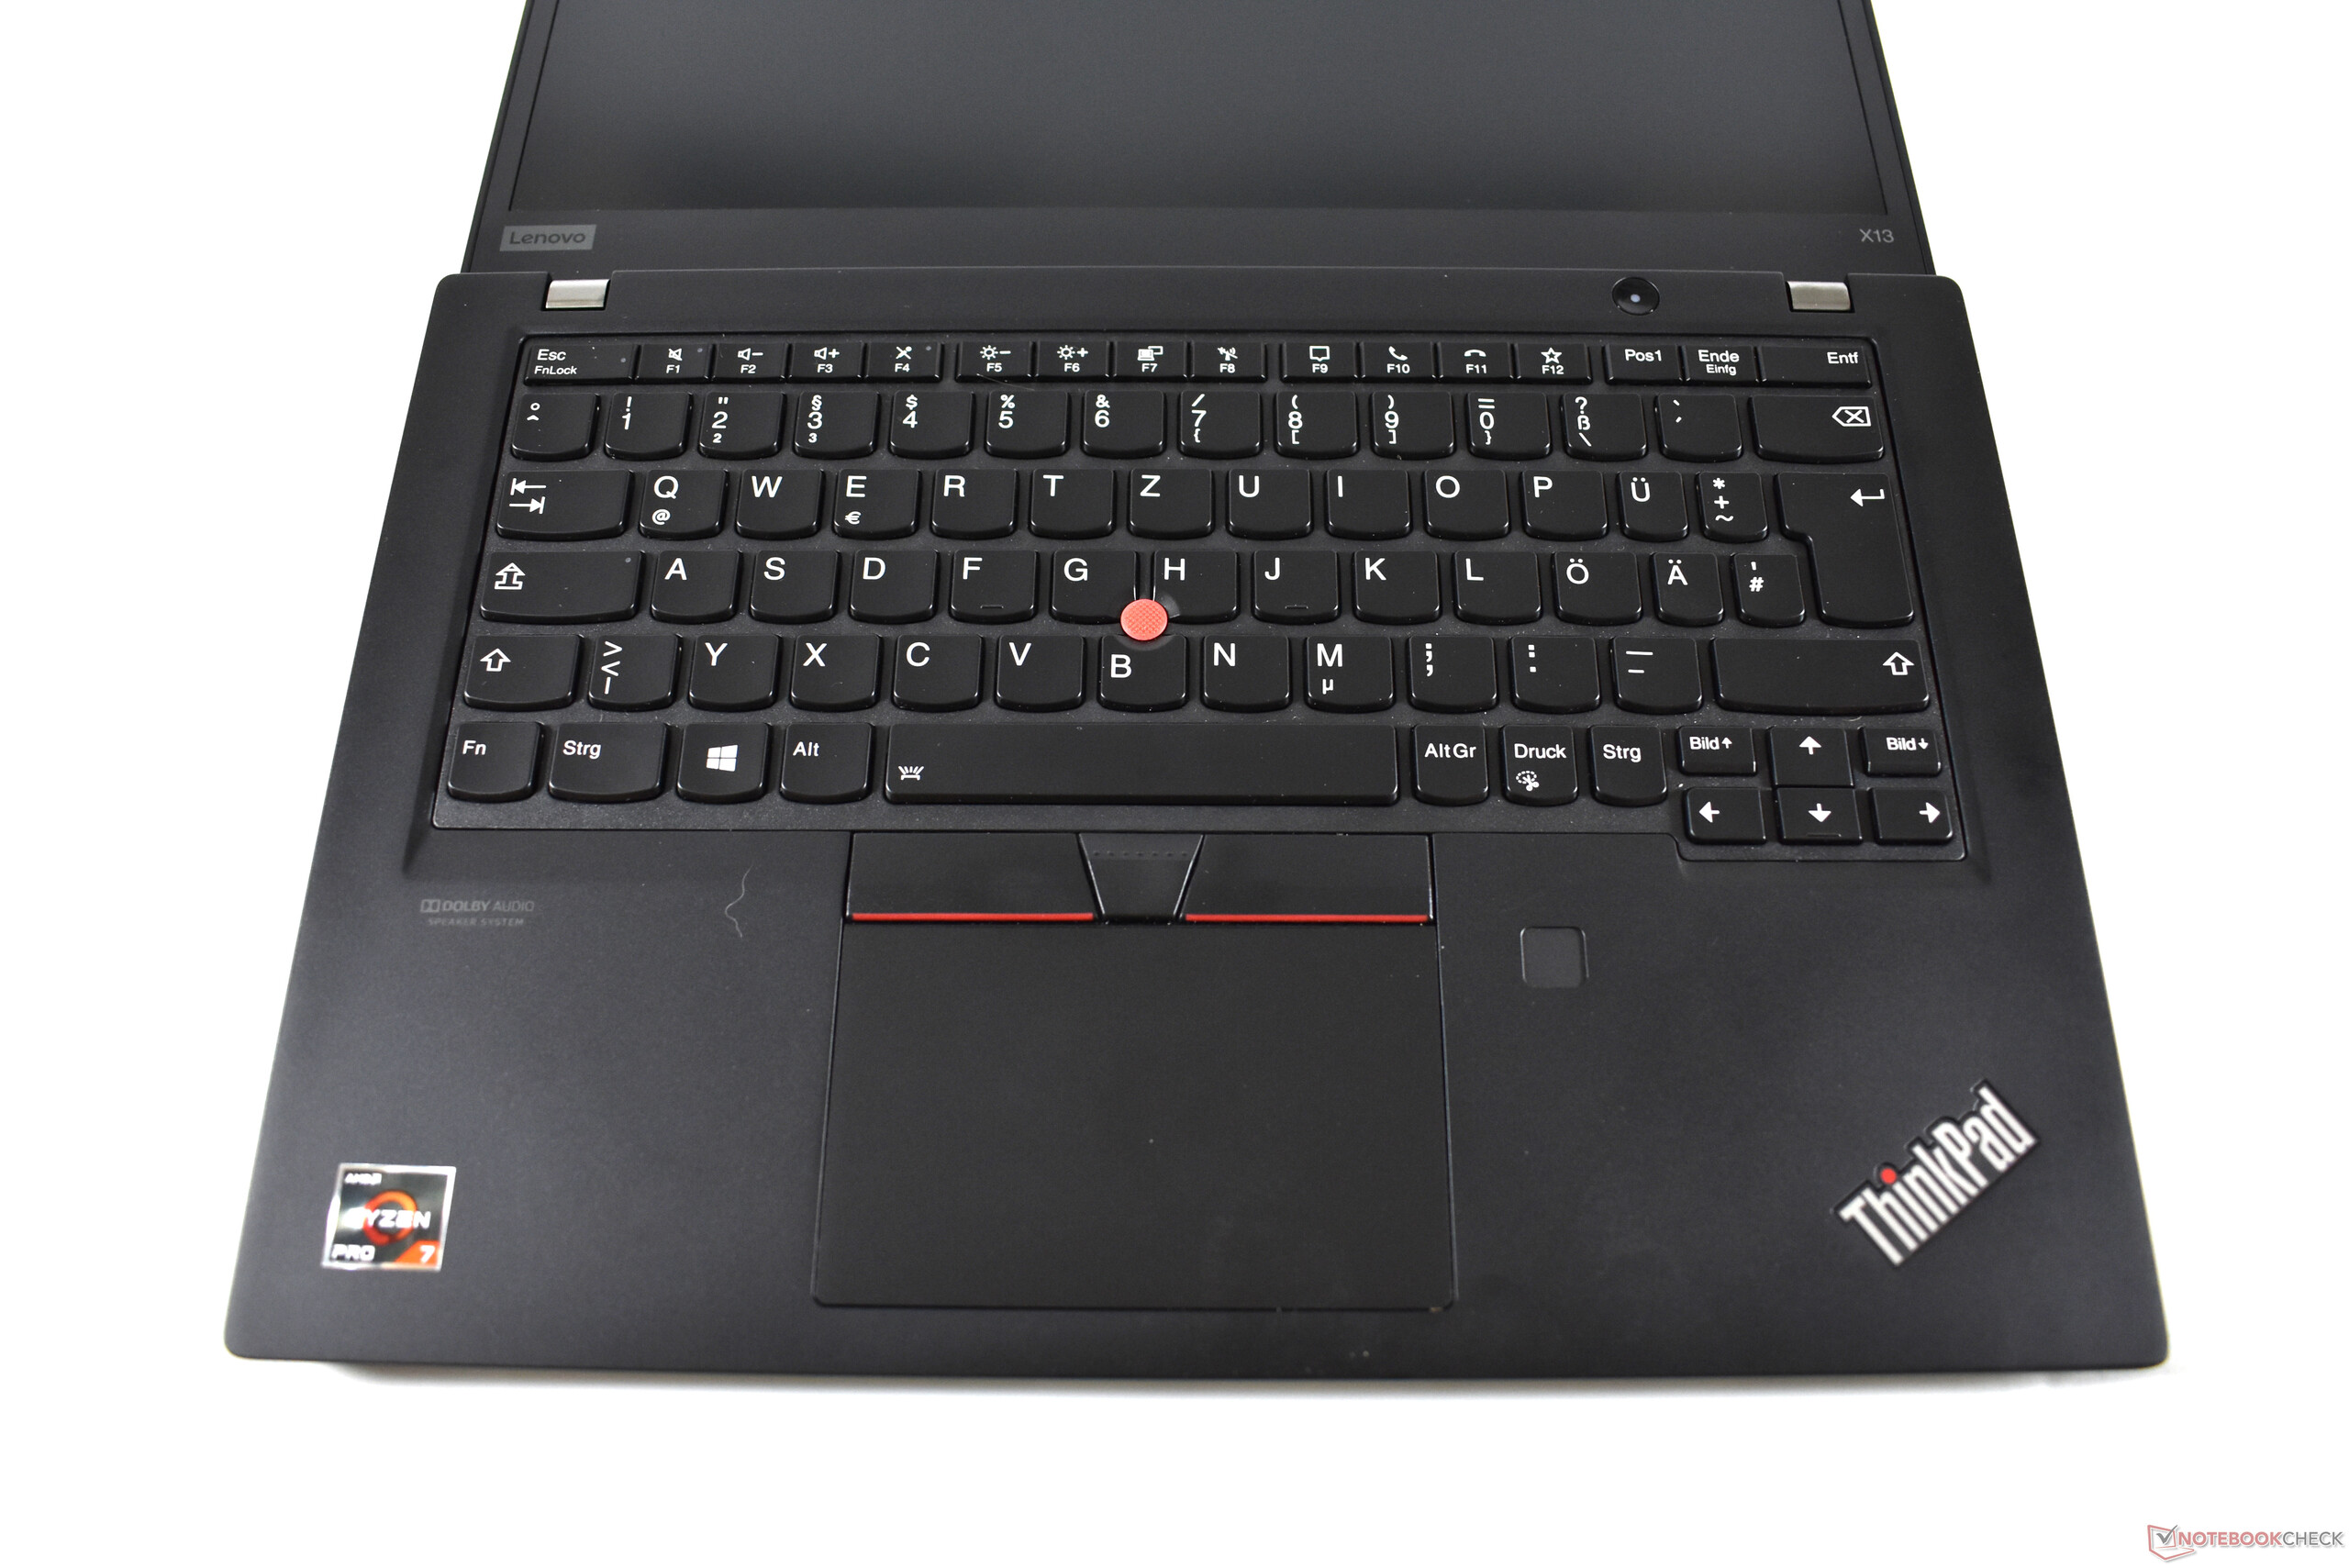
Breve Análise do Portátil Lenovo ThinkPad X13 Gen 1: Com AMD Renoir, o portátil ThinkPad de 13 polegadas mais veloz
Avaliação | Data | Modelo | Peso | Altura | Size | Resolução | Preço |
|---|---|---|---|---|---|---|---|
| 89.5 % v7 (old) | 08/2020 | Lenovo ThinkPad X13-20UGS00800 R7 PRO 4750U, Vega 7 | 1.3 kg | 16.9 mm | 13.30" | 1920x1080 | |
| 88.8 % v7 (old) | 10/2019 | Lenovo ThinkPad X395 R3 PRO 3300U, Vega 6 | 1.3 kg | 16.9 mm | 13.30" | 1920x1080 | |
| 89.4 % v7 (old) | 07/2020 | Dell Latitude 7310 i7-10610U, UHD Graphics 620 | 1.2 kg | 18.3 mm | 13.30" | 1920x1080 | |
| 90.5 % v7 (old) | 08/2020 | Lenovo ThinkPad T14s-20UJS00K00 R7 PRO 4750U, Vega 7 | 1.3 kg | 16.1 mm | 14.00" | 1920x1080 | |
| 88 % v7 (old) | 08/2020 | Lenovo ThinkPad X13-20T20033GE i5-10210U, UHD Graphics 620 | 1.3 kg | 16.9 mm | 13.30" | 1920x1080 |
| SD Card Reader | |
| average JPG Copy Test (av. of 3 runs) | |
| Dell Latitude 7310 (Toshiba Exceria Pro M501 64 GB UHS-II) | |
| Lenovo ThinkPad T14s-20UJS00K00 (Toshiba Exceria Pro M501 64 GB UHS-II) | |
| Média da turma Subnotebook (23.7 - 188, n=9, últimos 2 anos) | |
| Lenovo ThinkPad X13-20UGS00800 (Toshiba Exceria Pro M501 64 GB UHS-II) | |
| Lenovo ThinkPad X395 | |
| Lenovo ThinkPad X13-20T20033GE (Toshiba Exceria Pro M501 64 GB UHS-II) | |
| maximum AS SSD Seq Read Test (1GB) | |
| Dell Latitude 7310 (Toshiba Exceria Pro M501 64 GB UHS-II) | |
| Média da turma Subnotebook (24.9 - 195, n=8, últimos 2 anos) | |
| Lenovo ThinkPad X395 | |
| Lenovo ThinkPad T14s-20UJS00K00 (Toshiba Exceria Pro M501 64 GB UHS-II) | |
| Lenovo ThinkPad X13-20UGS00800 (Toshiba Exceria Pro M501 64 GB UHS-II) | |
| Lenovo ThinkPad X13-20T20033GE (Toshiba Exceria Pro M501 64 GB UHS-II) | |


| |||||||||||||||||||||||||
iluminação: 90 %
iluminação com acumulador: 331 cd/m²
Contraste: 1576:1 (Preto: 0.21 cd/m²)
ΔE ColorChecker Calman: 6.1 | ∀{0.5-29.43 Ø4.71}
calibrated: 1.2
ΔE Greyscale Calman: 6.3 | ∀{0.09-98 Ø4.96}
95.4% sRGB (Argyll 1.6.3 3D)
60.7% AdobeRGB 1998 (Argyll 1.6.3 3D)
65.7% AdobeRGB 1998 (Argyll 3D)
95.6% sRGB (Argyll 3D)
64.8% Display P3 (Argyll 3D)
Gamma: 2.77
CCT: 6938 K
| Lenovo ThinkPad X13-20UGS00800 B133HAK01.1, IPS LED, 1920x1080, 13.3" | Lenovo ThinkPad X395 LP133WF7-SPB1, IPS, 1920x1080, 13.3" | Dell Latitude 7310 AU Optronics B133HAN, IPS, 1920x1080, 13.3" | Lenovo ThinkPad T14s-20UJS00K00 N140HCG-GQ2, IPS , 1920x1080, 14" | Lenovo ThinkPad X13-20T20033GE Lenovo B133HAK01.1, IPS, 1920x1080, 13.3" | |
|---|---|---|---|---|---|
| Display | -0% | 8% | 3% | 2% | |
| Display P3 Coverage (%) | 64.8 | 64.1 -1% | 71.8 11% | 66.8 3% | 66 2% |
| sRGB Coverage (%) | 95.6 | 95.2 0% | 99.3 4% | 97.9 2% | 96.2 1% |
| AdobeRGB 1998 Coverage (%) | 65.7 | 65.8 0% | 72.4 10% | 69 5% | 67.2 2% |
| Response Times | -2% | 16% | 46% | 5% | |
| Response Time Grey 50% / Grey 80% * (ms) | 56.8 ? | 55 ? 3% | 40.8 ? 28% | 32.4 ? 43% | 52.8 ? 7% |
| Response Time Black / White * (ms) | 30 ? | 32 ? -7% | 28.8 ? 4% | 15.2 ? 49% | 29.2 ? 3% |
| PWM Frequency (Hz) | 26040 ? | ||||
| Screen | 18% | 16% | 19% | -1% | |
| Brightness middle (cd/m²) | 331 | 356 8% | 332.7 1% | 404 22% | 359 8% |
| Brightness (cd/m²) | 315 | 336 7% | 329 4% | 371 18% | 342 9% |
| Brightness Distribution (%) | 90 | 88 -2% | 89 -1% | 88 -2% | 90 0% |
| Black Level * (cd/m²) | 0.21 | 0.16 24% | 0.25 -19% | 0.34 -62% | 0.21 -0% |
| Contrast (:1) | 1576 | 2225 41% | 1331 -16% | 1188 -25% | 1710 9% |
| Colorchecker dE 2000 * | 6.1 | 3.6 41% | 2.15 65% | 1.4 77% | 6.7 -10% |
| Colorchecker dE 2000 max. * | 10 | 5.5 45% | 3.89 61% | 3.2 68% | 10.9 -9% |
| Colorchecker dE 2000 calibrated * | 1.2 | 1.11 7% | 1.09 9% | 0.8 33% | 1.3 -8% |
| Greyscale dE 2000 * | 6.3 | 4.7 25% | 2.5 60% | 1.6 75% | 7.4 -17% |
| Gamma | 2.77 79% | 2.92 75% | 2.3 96% | 2.13 103% | 2.85 77% |
| CCT | 6938 94% | 6222 104% | 6347 102% | 6480 100% | 6309 103% |
| Color Space (Percent of AdobeRGB 1998) (%) | 60.7 | 61 0% | 64.1 6% | 63 4% | 61.7 2% |
| Color Space (Percent of sRGB) (%) | 95.4 | 96 1% | 99.4 4% | 97.9 3% | 95.9 1% |
| Média Total (Programa/Configurações) | 5% /
12% | 13% /
14% | 23% /
20% | 2% /
0% |
* ... menor é melhor
Exibir tempos de resposta
| ↔ Tempo de resposta preto para branco | ||
|---|---|---|
| 30 ms ... ascensão ↗ e queda ↘ combinadas | ↗ 16.8 ms ascensão | 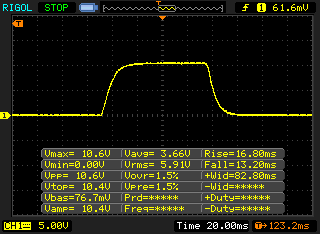 |
| ↘ 13.2 ms queda | ||
| A tela mostra taxas de resposta lentas em nossos testes e será insatisfatória para os jogadores. Em comparação, todos os dispositivos testados variam de 0.1 (mínimo) a 240 (máximo) ms. » 80 % de todos os dispositivos são melhores. Isso significa que o tempo de resposta medido é pior que a média de todos os dispositivos testados (19.8 ms). | ||
| ↔ Tempo de resposta 50% cinza a 80% cinza | ||
| 56.8 ms ... ascensão ↗ e queda ↘ combinadas | ↗ 29.2 ms ascensão | 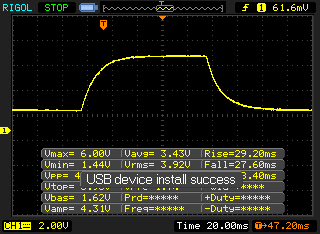 |
| ↘ 27.6 ms queda | ||
| A tela mostra taxas de resposta lentas em nossos testes e será insatisfatória para os jogadores. Em comparação, todos os dispositivos testados variam de 0.165 (mínimo) a 636 (máximo) ms. » 94 % de todos os dispositivos são melhores. Isso significa que o tempo de resposta medido é pior que a média de todos os dispositivos testados (30.9 ms). | ||
Cintilação da tela / PWM (modulação por largura de pulso)
| Tela tremeluzindo / PWM não detectado |  | ||
[pwm_comparison] Em comparação: 52 % de todos os dispositivos testados não usam PWM para escurecer a tela. Se PWM foi detectado, uma média de 7744 (mínimo: 5 - máximo: 343500) Hz foi medida. | |||
Cinebench R15: CPU Multi 64Bit | CPU Single 64Bit
Blender: v2.79 BMW27 CPU
7-Zip 18.03: 7z b 4 -mmt1 | 7z b 4
Geekbench 5.5: Single-Core | Multi-Core
HWBOT x265 Benchmark v2.2: 4k Preset
LibreOffice : 20 Documents To PDF
R Benchmark 2.5: Overall mean
| Cinebench R20 / CPU (Multi Core) | |
| Média da turma Subnotebook (579 - 8541, n=57, últimos 2 anos) | |
| Média AMD Ryzen 7 PRO 4750U (2935 - 3302, n=5) | |
| Lenovo ThinkPad T14s-20UJS00K00 | |
| Lenovo ThinkPad X13-20UGS00800 | |
| Lenovo ThinkPad X13-20T20033GE | |
| Lenovo ThinkPad T14-20S1S06B00 | |
| Lenovo ThinkPad X1 Carbon 2020-20UAS04T00 | |
| Dell Latitude 7310 | |
| Cinebench R20 / CPU (Single Core) | |
| Média da turma Subnotebook (128 - 832, n=57, últimos 2 anos) | |
| Lenovo ThinkPad X13-20UGS00800 | |
| Média AMD Ryzen 7 PRO 4750U (461 - 479, n=5) | |
| Lenovo ThinkPad T14s-20UJS00K00 | |
| Lenovo ThinkPad X1 Carbon 2020-20UAS04T00 | |
| Dell Latitude 7310 | |
| Lenovo ThinkPad T14-20S1S06B00 | |
| Lenovo ThinkPad X13-20T20033GE | |
| Cinebench R15 / CPU Multi 64Bit | |
| Média da turma Subnotebook (327 - 3345, n=57, últimos 2 anos) | |
| Média AMD Ryzen 7 PRO 4750U (1287 - 1417, n=5) | |
| Lenovo ThinkPad T14s-20UJS00K00 | |
| Lenovo ThinkPad X13-20UGS00800 | |
| Lenovo ThinkPad X1 Carbon 2020-20UAS04T00 | |
| Lenovo ThinkPad X13-20T20033GE | |
| Lenovo ThinkPad T14-20S1S06B00 | |
| Dell Latitude 7310 | |
| Lenovo ThinkPad X395 | |
| Cinebench R15 / CPU Single 64Bit | |
| Média da turma Subnotebook (72.4 - 322, n=57, últimos 2 anos) | |
| Lenovo ThinkPad X13-20UGS00800 | |
| Lenovo ThinkPad X1 Carbon 2020-20UAS04T00 | |
| Média AMD Ryzen 7 PRO 4750U (180 - 184, n=5) | |
| Lenovo ThinkPad T14s-20UJS00K00 | |
| Dell Latitude 7310 | |
| Lenovo ThinkPad X13-20T20033GE | |
| Lenovo ThinkPad T14-20S1S06B00 | |
| Lenovo ThinkPad X395 | |
| Blender / v2.79 BMW27 CPU | |
| Lenovo ThinkPad T14-20S1S06B00 | |
| Dell Latitude 7310 | |
| Lenovo ThinkPad X1 Carbon 2020-20UAS04T00 | |
| Lenovo ThinkPad X13-20T20033GE | |
| Lenovo ThinkPad X13-20UGS00800 | |
| Média da turma Subnotebook (159 - 2271, n=58, últimos 2 anos) | |
| Lenovo ThinkPad T14s-20UJS00K00 | |
| Média AMD Ryzen 7 PRO 4750U (340 - 403, n=5) | |
| 7-Zip 18.03 / 7z b 4 -mmt1 | |
| Média da turma Subnotebook (2643 - 6699, n=59, últimos 2 anos) | |
| Dell Latitude 7310 | |
| Lenovo ThinkPad X1 Carbon 2020-20UAS04T00 | |
| Lenovo ThinkPad T14s-20UJS00K00 | |
| Lenovo ThinkPad X13-20UGS00800 | |
| Média AMD Ryzen 7 PRO 4750U (4413 - 4467, n=5) | |
| Lenovo ThinkPad X13-20T20033GE | |
| Lenovo ThinkPad T14-20S1S06B00 | |
| 7-Zip 18.03 / 7z b 4 | |
| Média da turma Subnotebook (11668 - 77867, n=57, últimos 2 anos) | |
| Média AMD Ryzen 7 PRO 4750U (37081 - 42173, n=5) | |
| Lenovo ThinkPad T14s-20UJS00K00 | |
| Lenovo ThinkPad X13-20UGS00800 | |
| Lenovo ThinkPad X1 Carbon 2020-20UAS04T00 | |
| Lenovo ThinkPad X13-20T20033GE | |
| Lenovo ThinkPad T14-20S1S06B00 | |
| Dell Latitude 7310 | |
| Geekbench 5.5 / Single-Core | |
| Média da turma Subnotebook (726 - 2224, n=49, últimos 2 anos) | |
| Dell Latitude 7310 | |
| Lenovo ThinkPad X1 Carbon 2020-20UAS04T00 | |
| Lenovo ThinkPad X13-20UGS00800 | |
| Lenovo ThinkPad T14s-20UJS00K00 | |
| Média AMD Ryzen 7 PRO 4750U (1117 - 1157, n=5) | |
| Lenovo ThinkPad X13-20T20033GE | |
| Lenovo ThinkPad T14-20S1S06B00 | |
| Geekbench 5.5 / Multi-Core | |
| Média da turma Subnotebook (2557 - 17218, n=49, últimos 2 anos) | |
| Lenovo ThinkPad T14s-20UJS00K00 | |
| Média AMD Ryzen 7 PRO 4750U (5456 - 6609, n=5) | |
| Lenovo ThinkPad X13-20UGS00800 | |
| Lenovo ThinkPad X13-20T20033GE | |
| Lenovo ThinkPad X1 Carbon 2020-20UAS04T00 | |
| Dell Latitude 7310 | |
| Lenovo ThinkPad T14-20S1S06B00 | |
| HWBOT x265 Benchmark v2.2 / 4k Preset | |
| Média da turma Subnotebook (0.97 - 25.1, n=57, últimos 2 anos) | |
| Lenovo ThinkPad T14s-20UJS00K00 | |
| Média AMD Ryzen 7 PRO 4750U (8.33 - 10.3, n=5) | |
| Lenovo ThinkPad X13-20UGS00800 | |
| Lenovo ThinkPad X1 Carbon 2020-20UAS04T00 | |
| Lenovo ThinkPad X13-20T20033GE | |
| Dell Latitude 7310 | |
| Lenovo ThinkPad T14-20S1S06B00 | |
| LibreOffice / 20 Documents To PDF | |
| Média AMD Ryzen 7 PRO 4750U (58.4 - 73.4, n=5) | |
| Lenovo ThinkPad T14s-20UJS00K00 | |
| Lenovo ThinkPad T14-20S1S06B00 | |
| Lenovo ThinkPad X13-20UGS00800 | |
| Média da turma Subnotebook (39.9 - 220, n=56, últimos 2 anos) | |
| Dell Latitude 7310 | |
| Lenovo ThinkPad X13-20T20033GE | |
| Lenovo ThinkPad X1 Carbon 2020-20UAS04T00 | |
| R Benchmark 2.5 / Overall mean | |
| Lenovo ThinkPad T14-20S1S06B00 | |
| Lenovo ThinkPad X13-20T20033GE | |
| Lenovo ThinkPad X1 Carbon 2020-20UAS04T00 | |
| Dell Latitude 7310 | |
| Lenovo ThinkPad T14s-20UJS00K00 | |
| Média AMD Ryzen 7 PRO 4750U (0.61 - 0.621, n=5) | |
| Lenovo ThinkPad X13-20UGS00800 | |
| Média da turma Subnotebook (0.4024 - 1.456, n=58, últimos 2 anos) | |
* ... menor é melhor
| PCMark 8 Home Score Accelerated v2 | 4349 pontos | |
| PCMark 8 Work Score Accelerated v2 | 5573 pontos | |
| PCMark 10 Score | 4956 pontos | |
Ajuda | ||
| DPC Latencies / LatencyMon - interrupt to process latency (max), Web, Youtube, Prime95 | |
| Lenovo ThinkPad X13-20UGS00800 | |
* ... menor é melhor
| Lenovo ThinkPad X13-20UGS00800 Samsung SSD PM981a MZVLB512HBJQ | Lenovo ThinkPad X395 Samsung SSD PM981a MZVLB256HBHQ | Dell Latitude 7310 Samsung SSD PM981a MZVLB512HBJQ | Lenovo ThinkPad X13-20T20033GE Samsung SSD PM981a MZVLB512HBJQ | Média Samsung SSD PM981a MZVLB512HBJQ | |
|---|---|---|---|---|---|
| CrystalDiskMark 5.2 / 6 | -4% | 9% | 5% | 11% | |
| Write 4K (MB/s) | 95.7 | 129.4 35% | 135.2 41% | 131.1 37% | 140.8 ? 47% |
| Read 4K (MB/s) | 37.47 | 41.6 11% | 50.7 35% | 45.48 21% | 48.6 ? 30% |
| Write Seq (MB/s) | 2032 | 2334 15% | 2155 6% | 2042 0% | 2106 ? 4% |
| Read Seq (MB/s) | 2207 | 2151 -3% | 2504 13% | 2259 2% | 2099 ? -5% |
| Write 4K Q32T1 (MB/s) | 517 | 234 -55% | 395.6 -23% | 429.1 -17% | 451 ? -13% |
| Read 4K Q32T1 (MB/s) | 387 | 325.7 -16% | 394.5 2% | 370.7 -4% | 482 ? 25% |
| Write Seq Q32T1 (MB/s) | 2977 | 2348 -21% | 2987 0% | 2963 0% | 2903 ? -2% |
| Read Seq Q32T1 (MB/s) | 3556 | 3563 0% | 3564 0% | 3564 0% | 3511 ? -1% |

Continuous load reading: DiskSpd Read Loop, Queue Depth 8
| 3DMark 11 Performance | 4897 pontos | |
| 3DMark Cloud Gate Standard Score | 18790 pontos | |
| 3DMark Fire Strike Score | 2720 pontos | |
| 3DMark Time Spy Score | 1082 pontos | |
Ajuda | ||
| baixo | média | alto | ultra | |
|---|---|---|---|---|
| The Witcher 3 (2015) | 56.1 | 17.6 | ||
| Dota 2 Reborn (2015) | 90.5 | 69.9 | 42.2 | 39.5 |
| X-Plane 11.11 (2018) | 37.2 | 28.5 | 25.6 | |
| Shadow of the Tomb Raider (2018) | 44.4 | 17 | ||
| Total War: Three Kingdoms (2019) | 49.3 | 15 |
Barulho
| Ocioso |
| 29.1 / 29.1 / 29.1 dB |
| Carga |
| 31.1 / 31.8 dB |
 | ||
30 dB silencioso 40 dB(A) audível 50 dB(A) ruidosamente alto |
||
min: | ||
(±) A temperatura máxima no lado superior é 44.8 °C / 113 F, em comparação com a média de 35.9 °C / 97 F , variando de 21.4 a 59 °C para a classe Subnotebook.
(±) A parte inferior aquece até um máximo de 42.1 °C / 108 F, em comparação com a média de 39.2 °C / 103 F
(+) Em uso inativo, a temperatura média para o lado superior é 23.8 °C / 75 F, em comparação com a média do dispositivo de 30.8 °C / ### class_avg_f### F.
(+) Os apoios para as mãos e o touchpad estão atingindo a temperatura máxima da pele (34.2 °C / 93.6 F) e, portanto, não estão quentes.
(-) A temperatura média da área do apoio para as mãos de dispositivos semelhantes foi 28.2 °C / 82.8 F (-6 °C / -10.8 F).
Lenovo ThinkPad X13-20UGS00800 análise de áudio
(±) | o volume do alto-falante é médio, mas bom (###valor### dB)
Graves 100 - 315Hz
(-) | quase nenhum baixo - em média 16.7% menor que a mediana
(-) | graves não são lineares (17.5% delta para frequência anterior)
Médios 400 - 2.000 Hz
(+) | médios equilibrados - apenas 3.8% longe da mediana
(+) | médios são lineares (3.1% delta para frequência anterior)
Altos 2 - 16 kHz
(+) | agudos equilibrados - apenas 3% longe da mediana
(±) | a linearidade dos máximos é média (8.9% delta para frequência anterior)
Geral 100 - 16.000 Hz
(±) | a linearidade do som geral é média (22.1% diferença em relação à mediana)
Comparado com a mesma classe
» 75% de todos os dispositivos testados nesta classe foram melhores, 6% semelhantes, 19% piores
» O melhor teve um delta de 5%, a média foi 18%, o pior foi 53%
Comparado com todos os dispositivos testados
» 64% de todos os dispositivos testados foram melhores, 6% semelhantes, 30% piores
» O melhor teve um delta de 4%, a média foi 23%, o pior foi 134%
Apple MacBook 12 (Early 2016) 1.1 GHz análise de áudio
(+) | os alto-falantes podem tocar relativamente alto (###valor### dB)
Graves 100 - 315Hz
(±) | graves reduzidos - em média 11.3% menor que a mediana
(±) | a linearidade dos graves é média (14.2% delta para a frequência anterior)
Médios 400 - 2.000 Hz
(+) | médios equilibrados - apenas 2.4% longe da mediana
(+) | médios são lineares (5.5% delta para frequência anterior)
Altos 2 - 16 kHz
(+) | agudos equilibrados - apenas 2% longe da mediana
(+) | os máximos são lineares (4.5% delta da frequência anterior)
Geral 100 - 16.000 Hz
(+) | o som geral é linear (10.2% diferença em relação à mediana)
Comparado com a mesma classe
» 7% de todos os dispositivos testados nesta classe foram melhores, 2% semelhantes, 90% piores
» O melhor teve um delta de 5%, a média foi 18%, o pior foi 53%
Comparado com todos os dispositivos testados
» 5% de todos os dispositivos testados foram melhores, 1% semelhantes, 94% piores
» O melhor teve um delta de 4%, a média foi 23%, o pior foi 134%
| desligado | |
| Ocioso | |
| Carga |
|
Key:
min: | |
| Lenovo ThinkPad X13-20UGS00800 R7 PRO 4750U, Vega 7, Samsung SSD PM981a MZVLB512HBJQ, IPS LED, 1920x1080, 13.3" | Lenovo ThinkPad X395 R3 PRO 3300U, Vega 6, Samsung SSD PM981a MZVLB256HBHQ, IPS, 1920x1080, 13.3" | Dell Latitude 7310 i7-10610U, UHD Graphics 620, Samsung SSD PM981a MZVLB512HBJQ, IPS, 1920x1080, 13.3" | Lenovo ThinkPad X13-20T20033GE i5-10210U, UHD Graphics 620, Samsung SSD PM981a MZVLB512HBJQ, IPS, 1920x1080, 13.3" | Média AMD Radeon RX Vega 7 | Média da turma Subnotebook | |
|---|---|---|---|---|---|---|
| Power Consumption | 14% | 16% | 11% | 0% | -1% | |
| Idle Minimum * (Watt) | 6 | 4 33% | 2.7 55% | 2.9 52% | 4.79 ? 20% | 3.71 ? 38% |
| Idle Average * (Watt) | 8.9 | 6.3 29% | 4.4 51% | 5.6 37% | 7.72 ? 13% | 6.54 ? 27% |
| Idle Maximum * (Watt) | 11.3 | 9.3 18% | 4.8 58% | 8.9 21% | 9.12 ? 19% | 7.89 ? 30% |
| Load Average * (Watt) | 34.2 | 34 1% | 33.4 2% | 30.1 12% | 38.4 ? -12% | 42.1 ? -23% |
| Load Maximum * (Watt) | 37.2 | 42 -13% | 69.7 -87% | 61.3 -65% | 51.7 ? -39% | 65.1 ? -75% |
* ... menor é melhor
| Lenovo ThinkPad X13-20UGS00800 R7 PRO 4750U, Vega 7, 48 Wh | Lenovo ThinkPad X395 R3 PRO 3300U, Vega 6, 48 Wh | Dell Latitude 7310 i7-10610U, UHD Graphics 620, 52 Wh | Lenovo ThinkPad T14s-20UJS00K00 R7 PRO 4750U, Vega 7, 57 Wh | Lenovo ThinkPad X13-20T20033GE i5-10210U, UHD Graphics 620, 48 Wh | Média da turma Subnotebook | |
|---|---|---|---|---|---|---|
| Duração da bateria | 67% | 33% | 39% | 43% | 60% | |
| H.264 (h) | 8.3 | 10.3 24% | 13.2 59% | 11.7 41% | 15.3 ? 84% | |
| WiFi v1.3 (h) | 8.7 | 10.9 25% | 12.6 45% | 10.2 17% | 9.3 7% | 14.1 ? 62% |
| Load (h) | 1.5 | 3.8 153% | 1.8 20% | 2.1 40% | 2.7 80% | 1.998 ? 33% |
| Reader / Idle (h) | 18.4 | 37.4 | 28.6 ? |
Pro
Contra

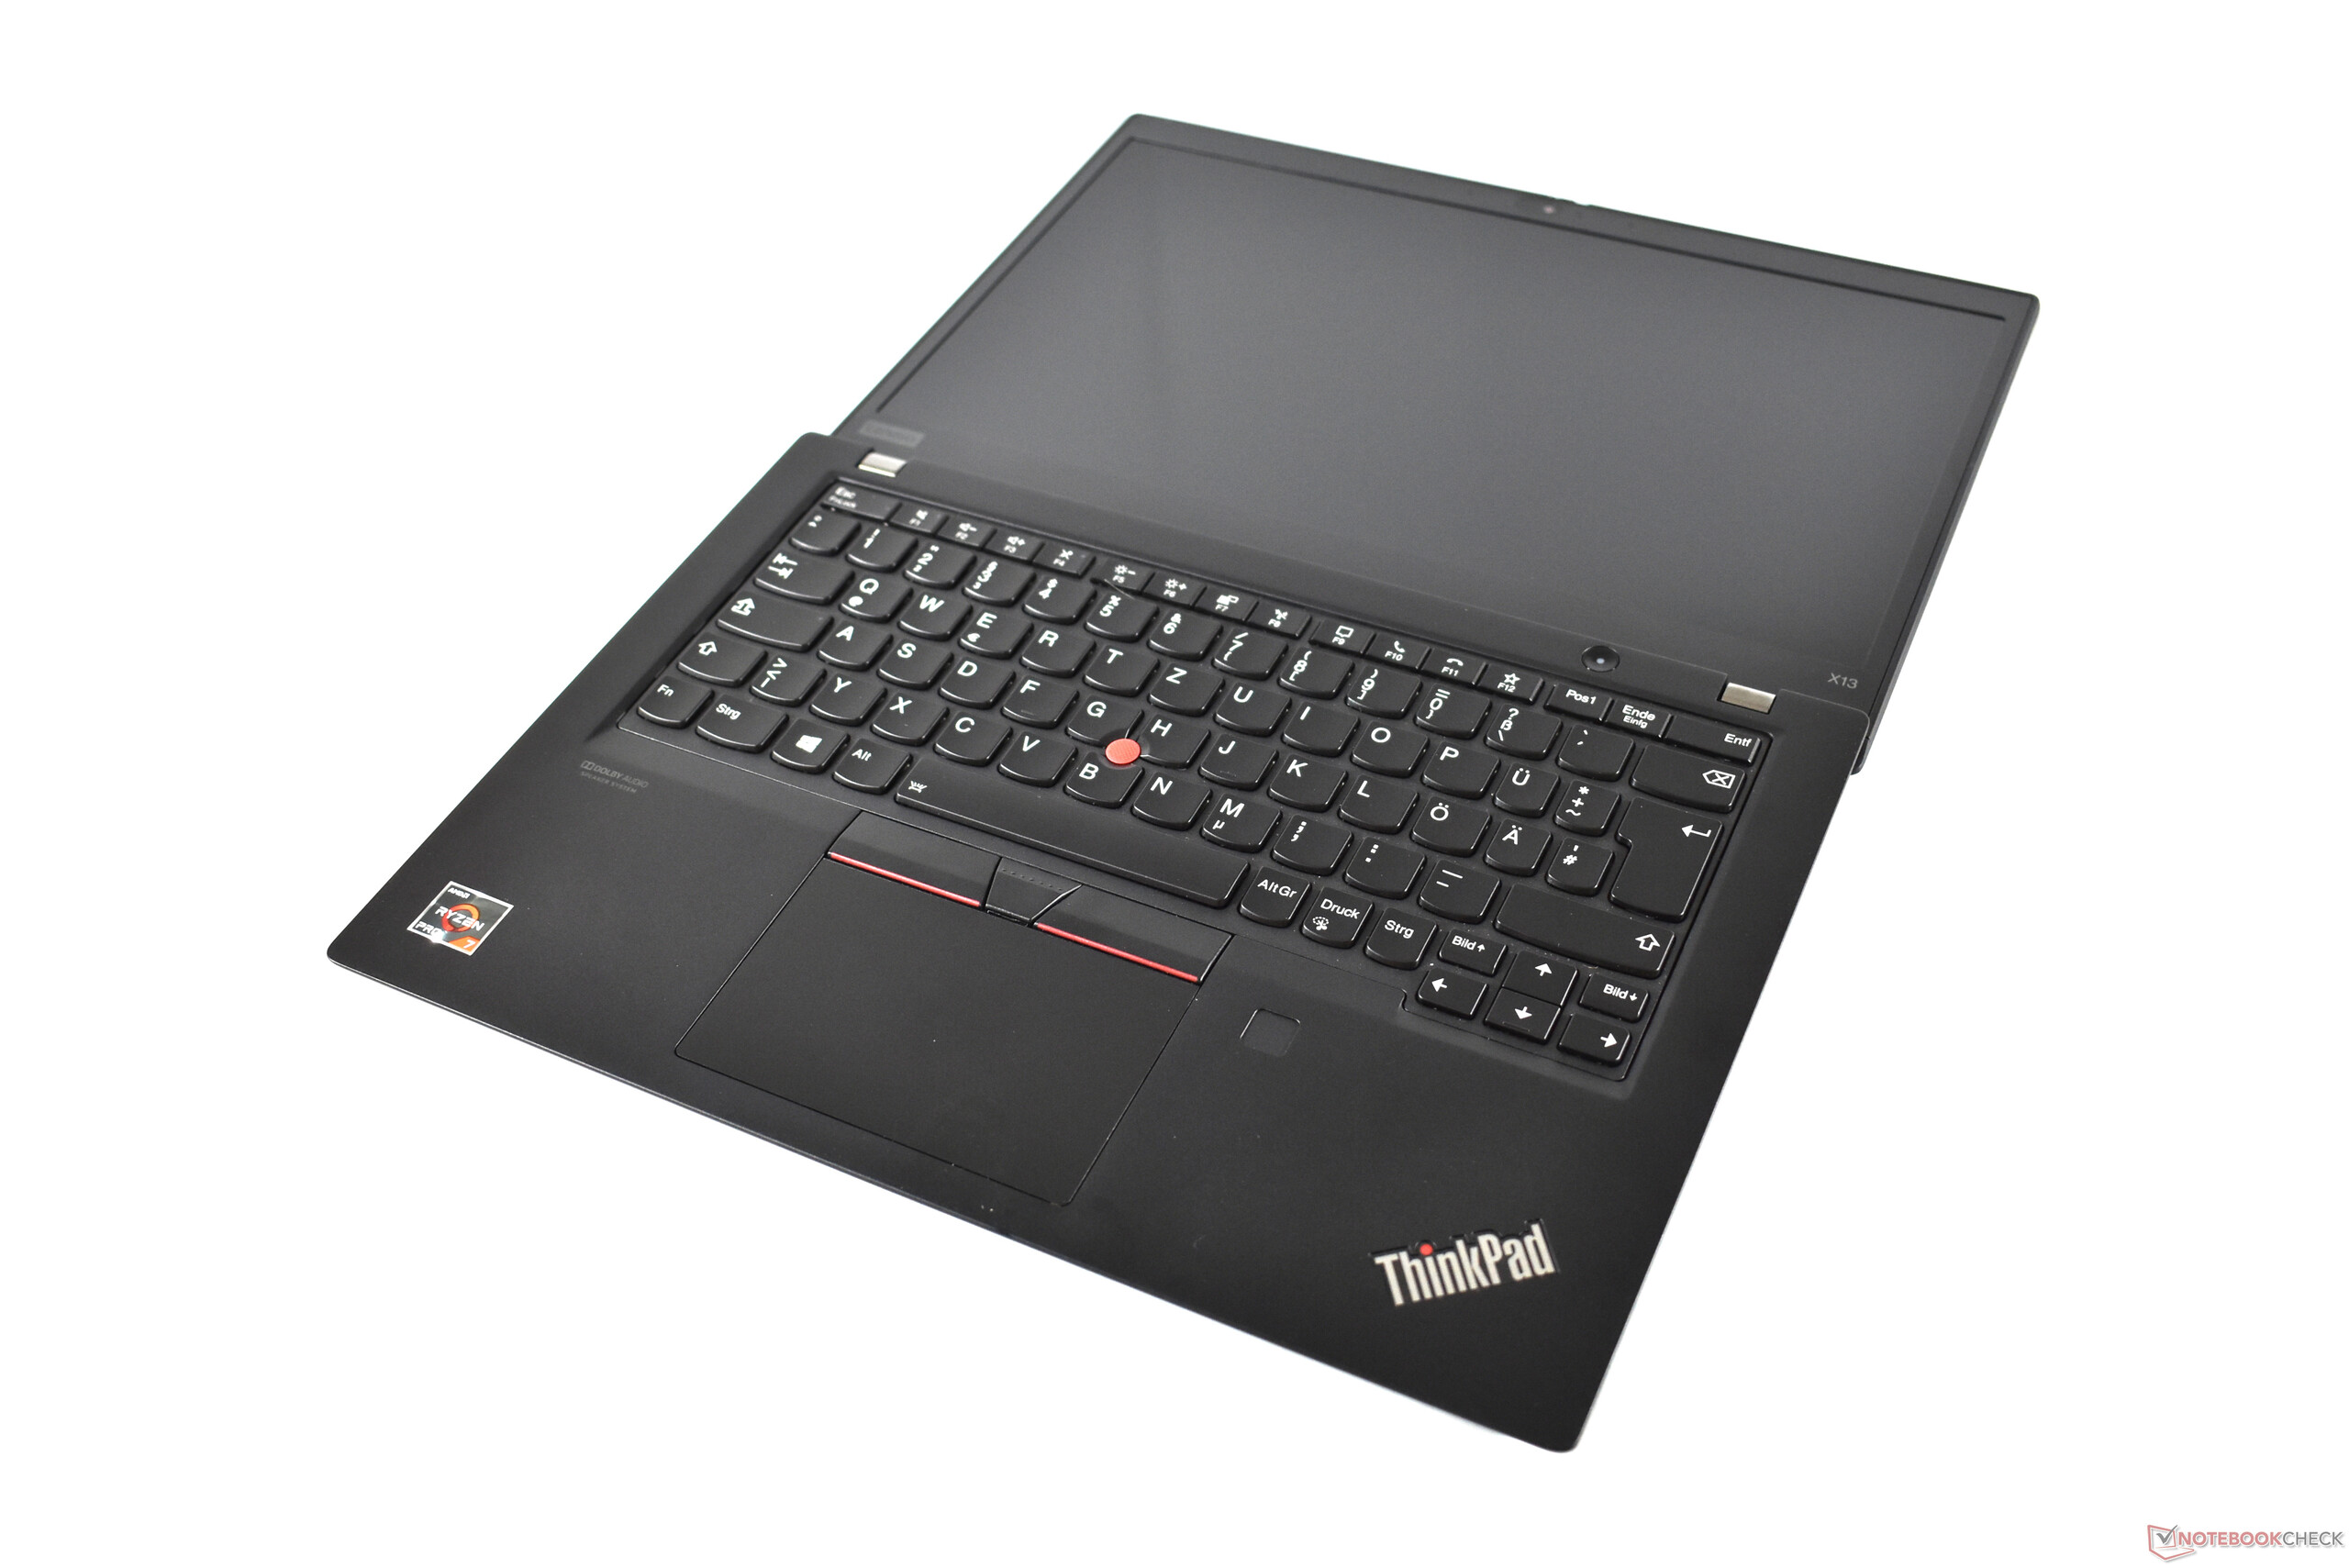
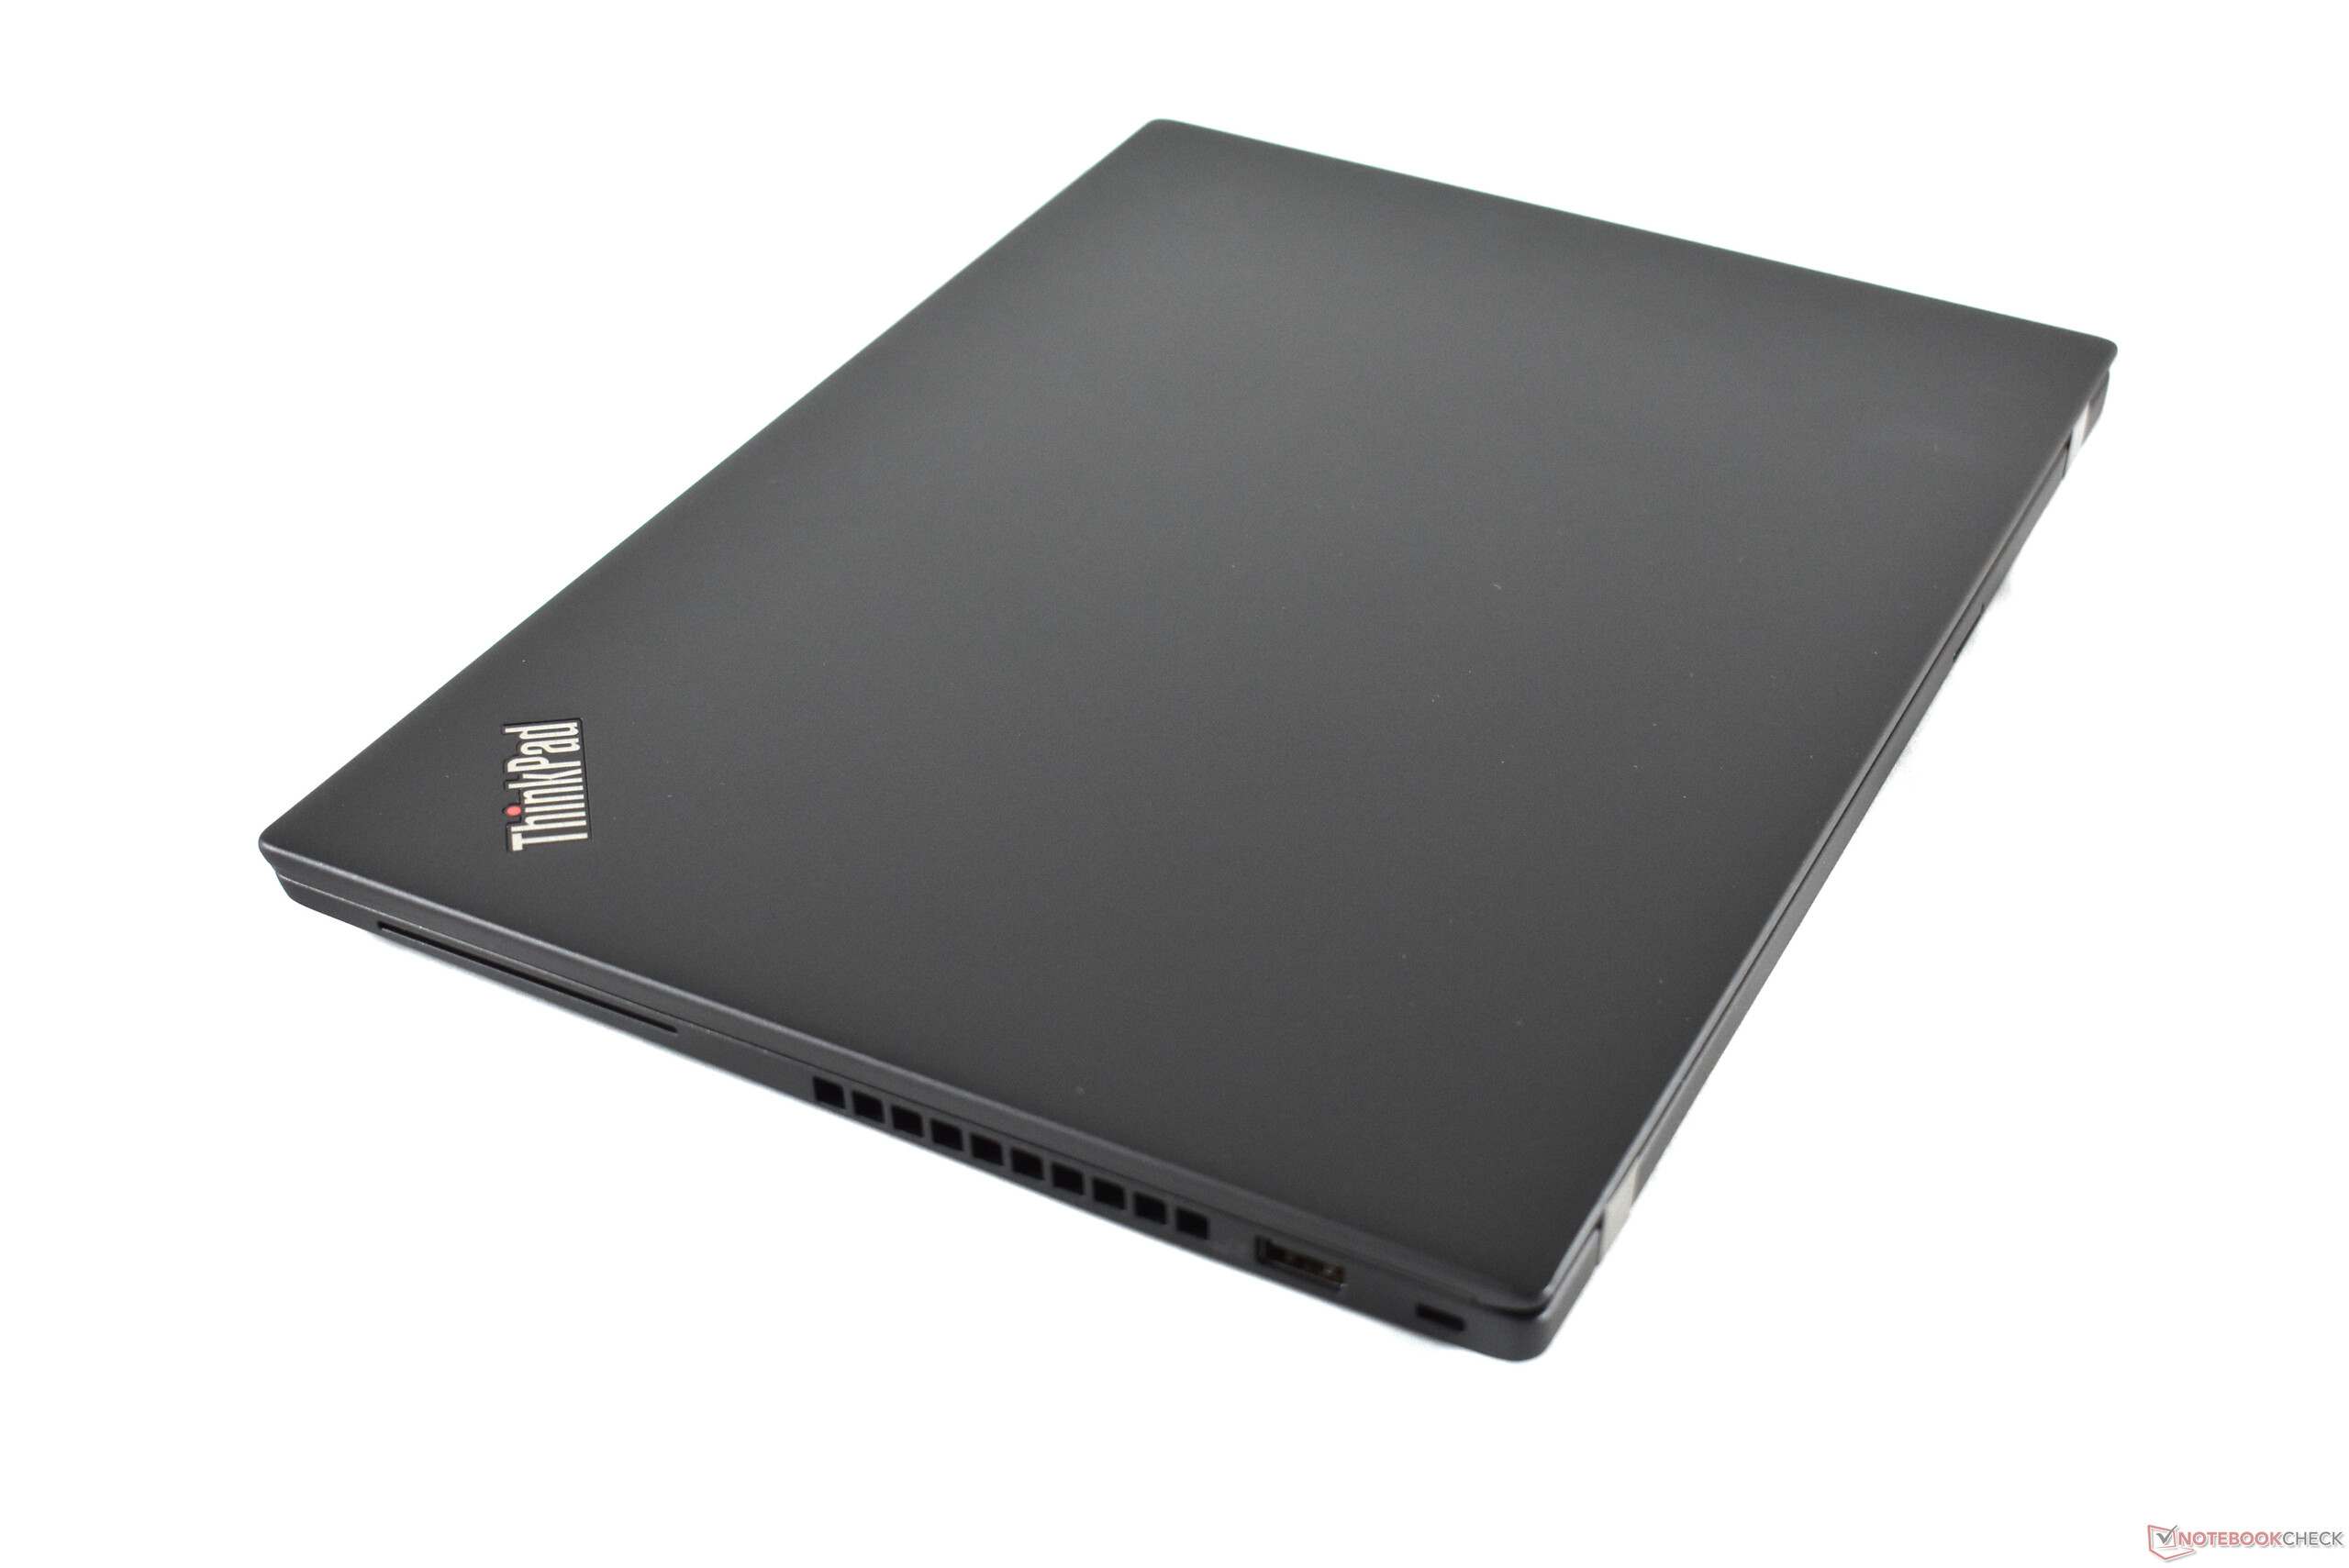
O Ryzen 4000 está atualmente ganhando participação de mercado para a AMD no espaço de portáteis. Nesse empreendimento, o segmento empresarial provavelmente desempenha um papel importante. Um subportátil compacto tradicional como o Lenovo ThinkPad X13 Gen 1 pode ser um grande trunfo na luta pelo mercado corporativo.
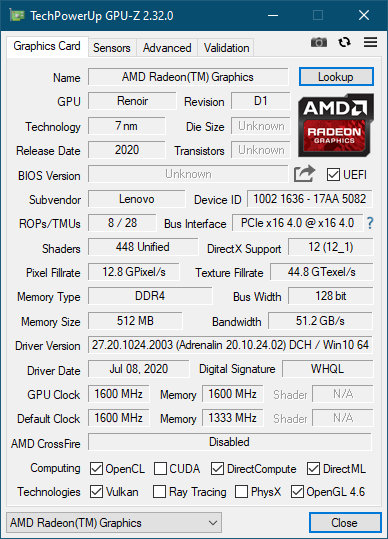
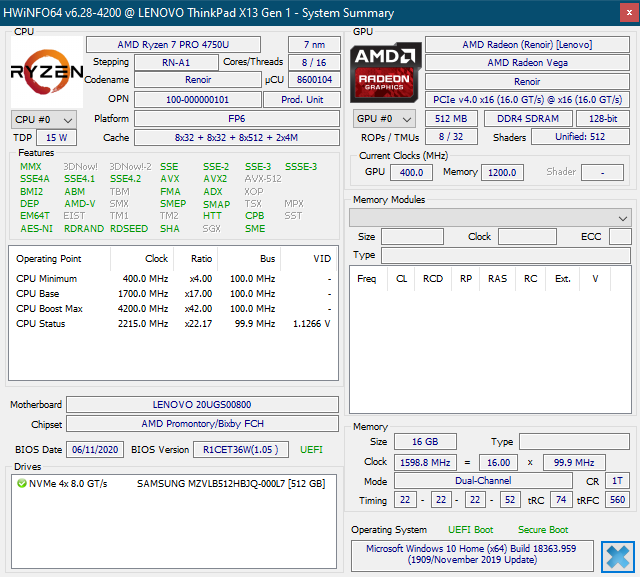
Como a Lenovo mantém o design testado e comprovado do Lenovo ThinkPad X390 / X395, a CPU AMD Renoir com oito núcleos é claramente a estrela deste show. Nenhum outro portátil ThinkPad com tela de 13,3 polegadas oferece um processador tão rápido. O versão Intel do X13 e do Dell Latitude 7310 estão longe de serem competitivos com o ThinkPad X13 AMD. O mesmo é verdade para o desempenho da GPU, que é quase bom o suficiente para competir com dGPUs de baixo custo.
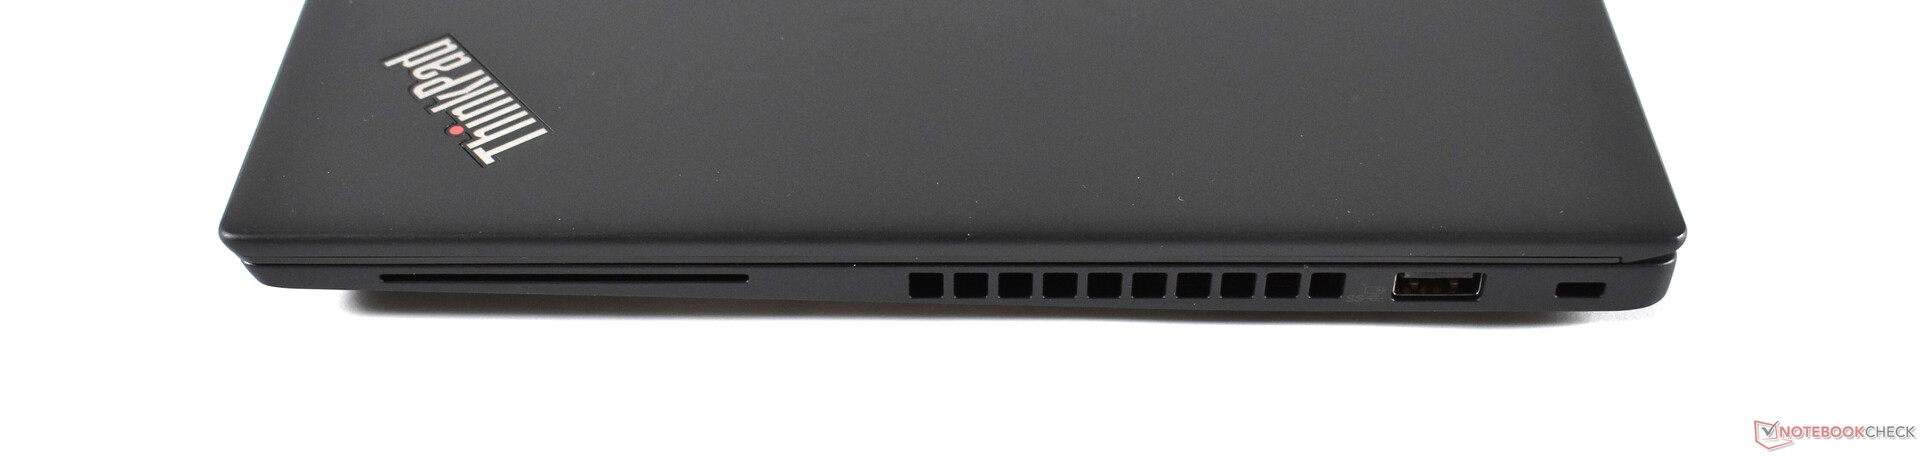
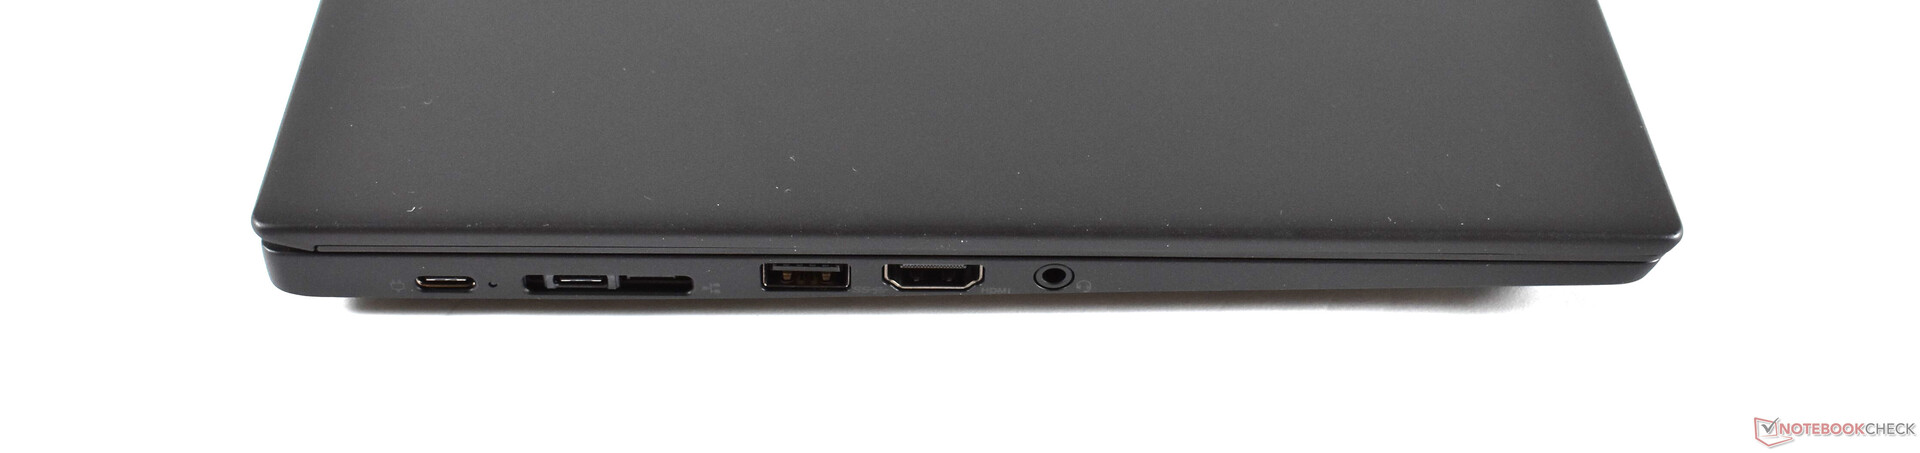
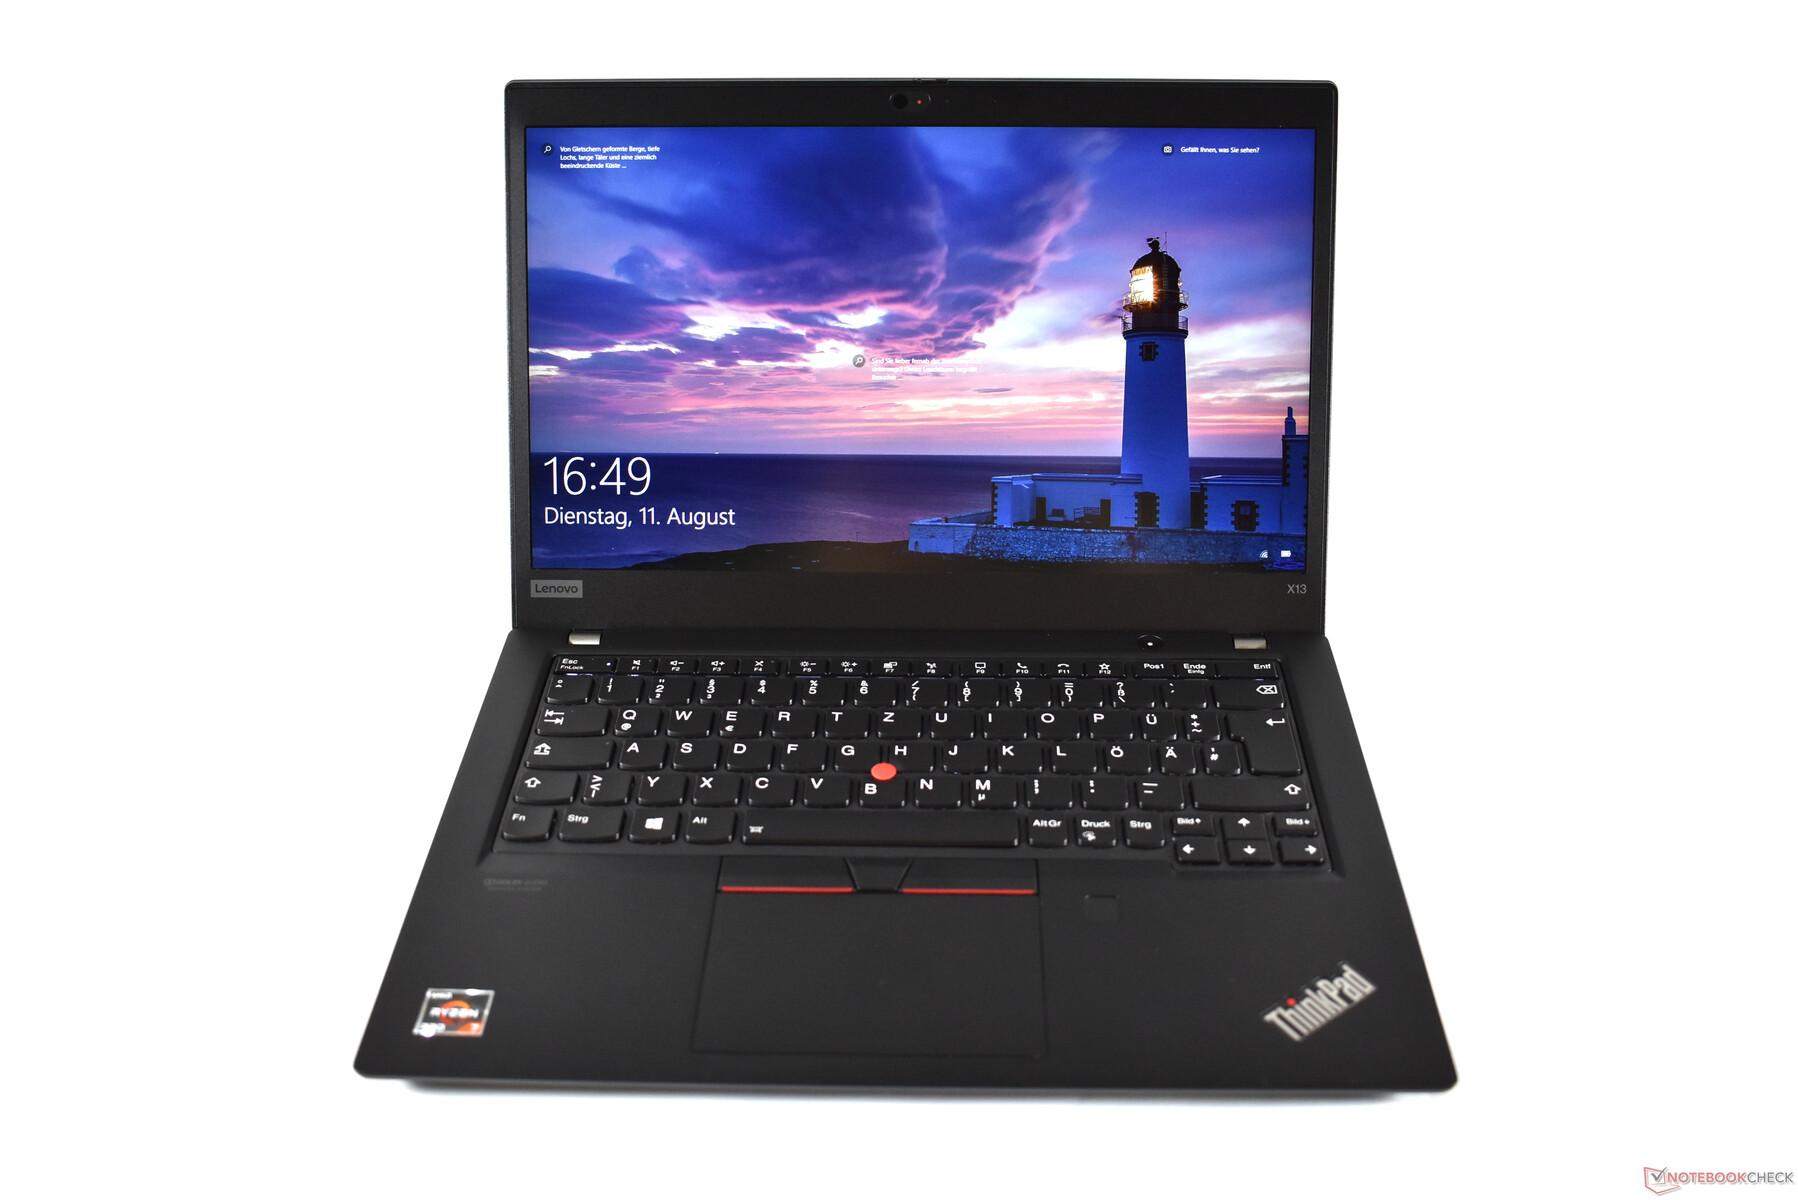
Apesar do ótimo nível de desempenho, o ThinkPad X13 Gen 1 funciona de maneira fria e silenciosa. Outros pontos fortes deste Lenovo X13 incluem os dispositivos de entrada ThinkPad, a quantidade de portas no pequeno chassi, a boa tela mate e a robusta carcaça de magnésio. Em comparação com o ThinkPad X395, o Wi-Fi 6 é notório como um ganho.
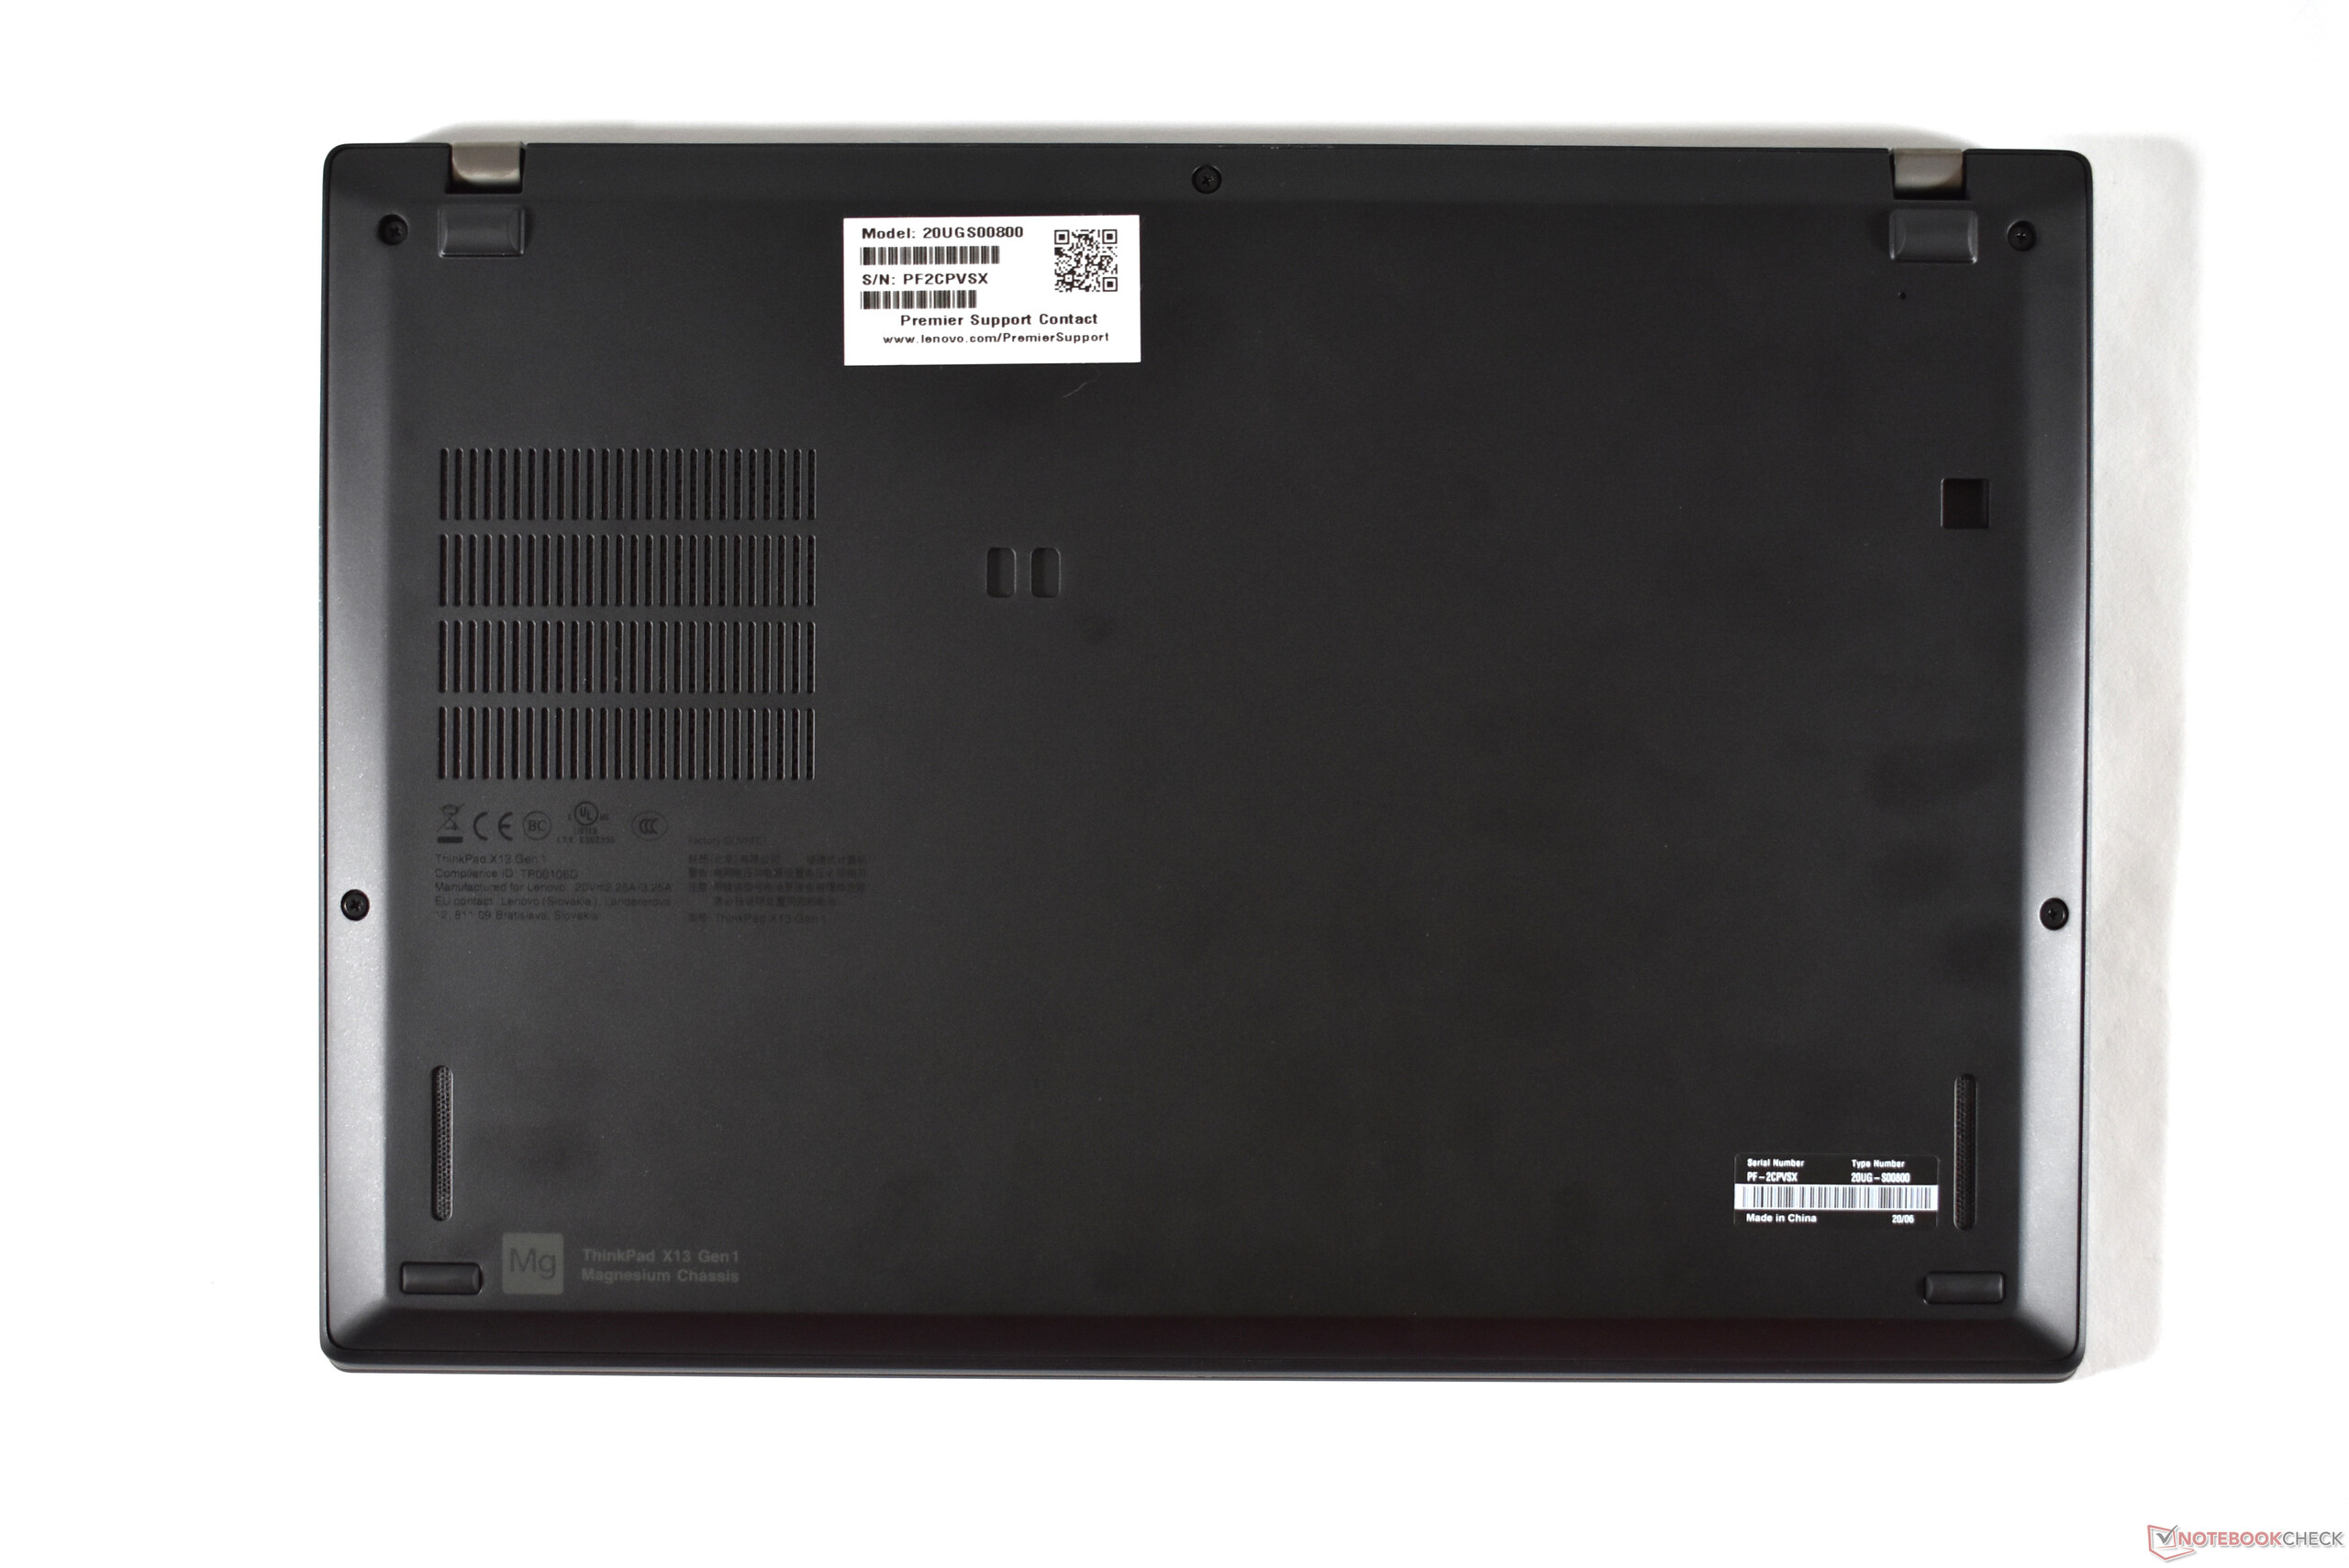
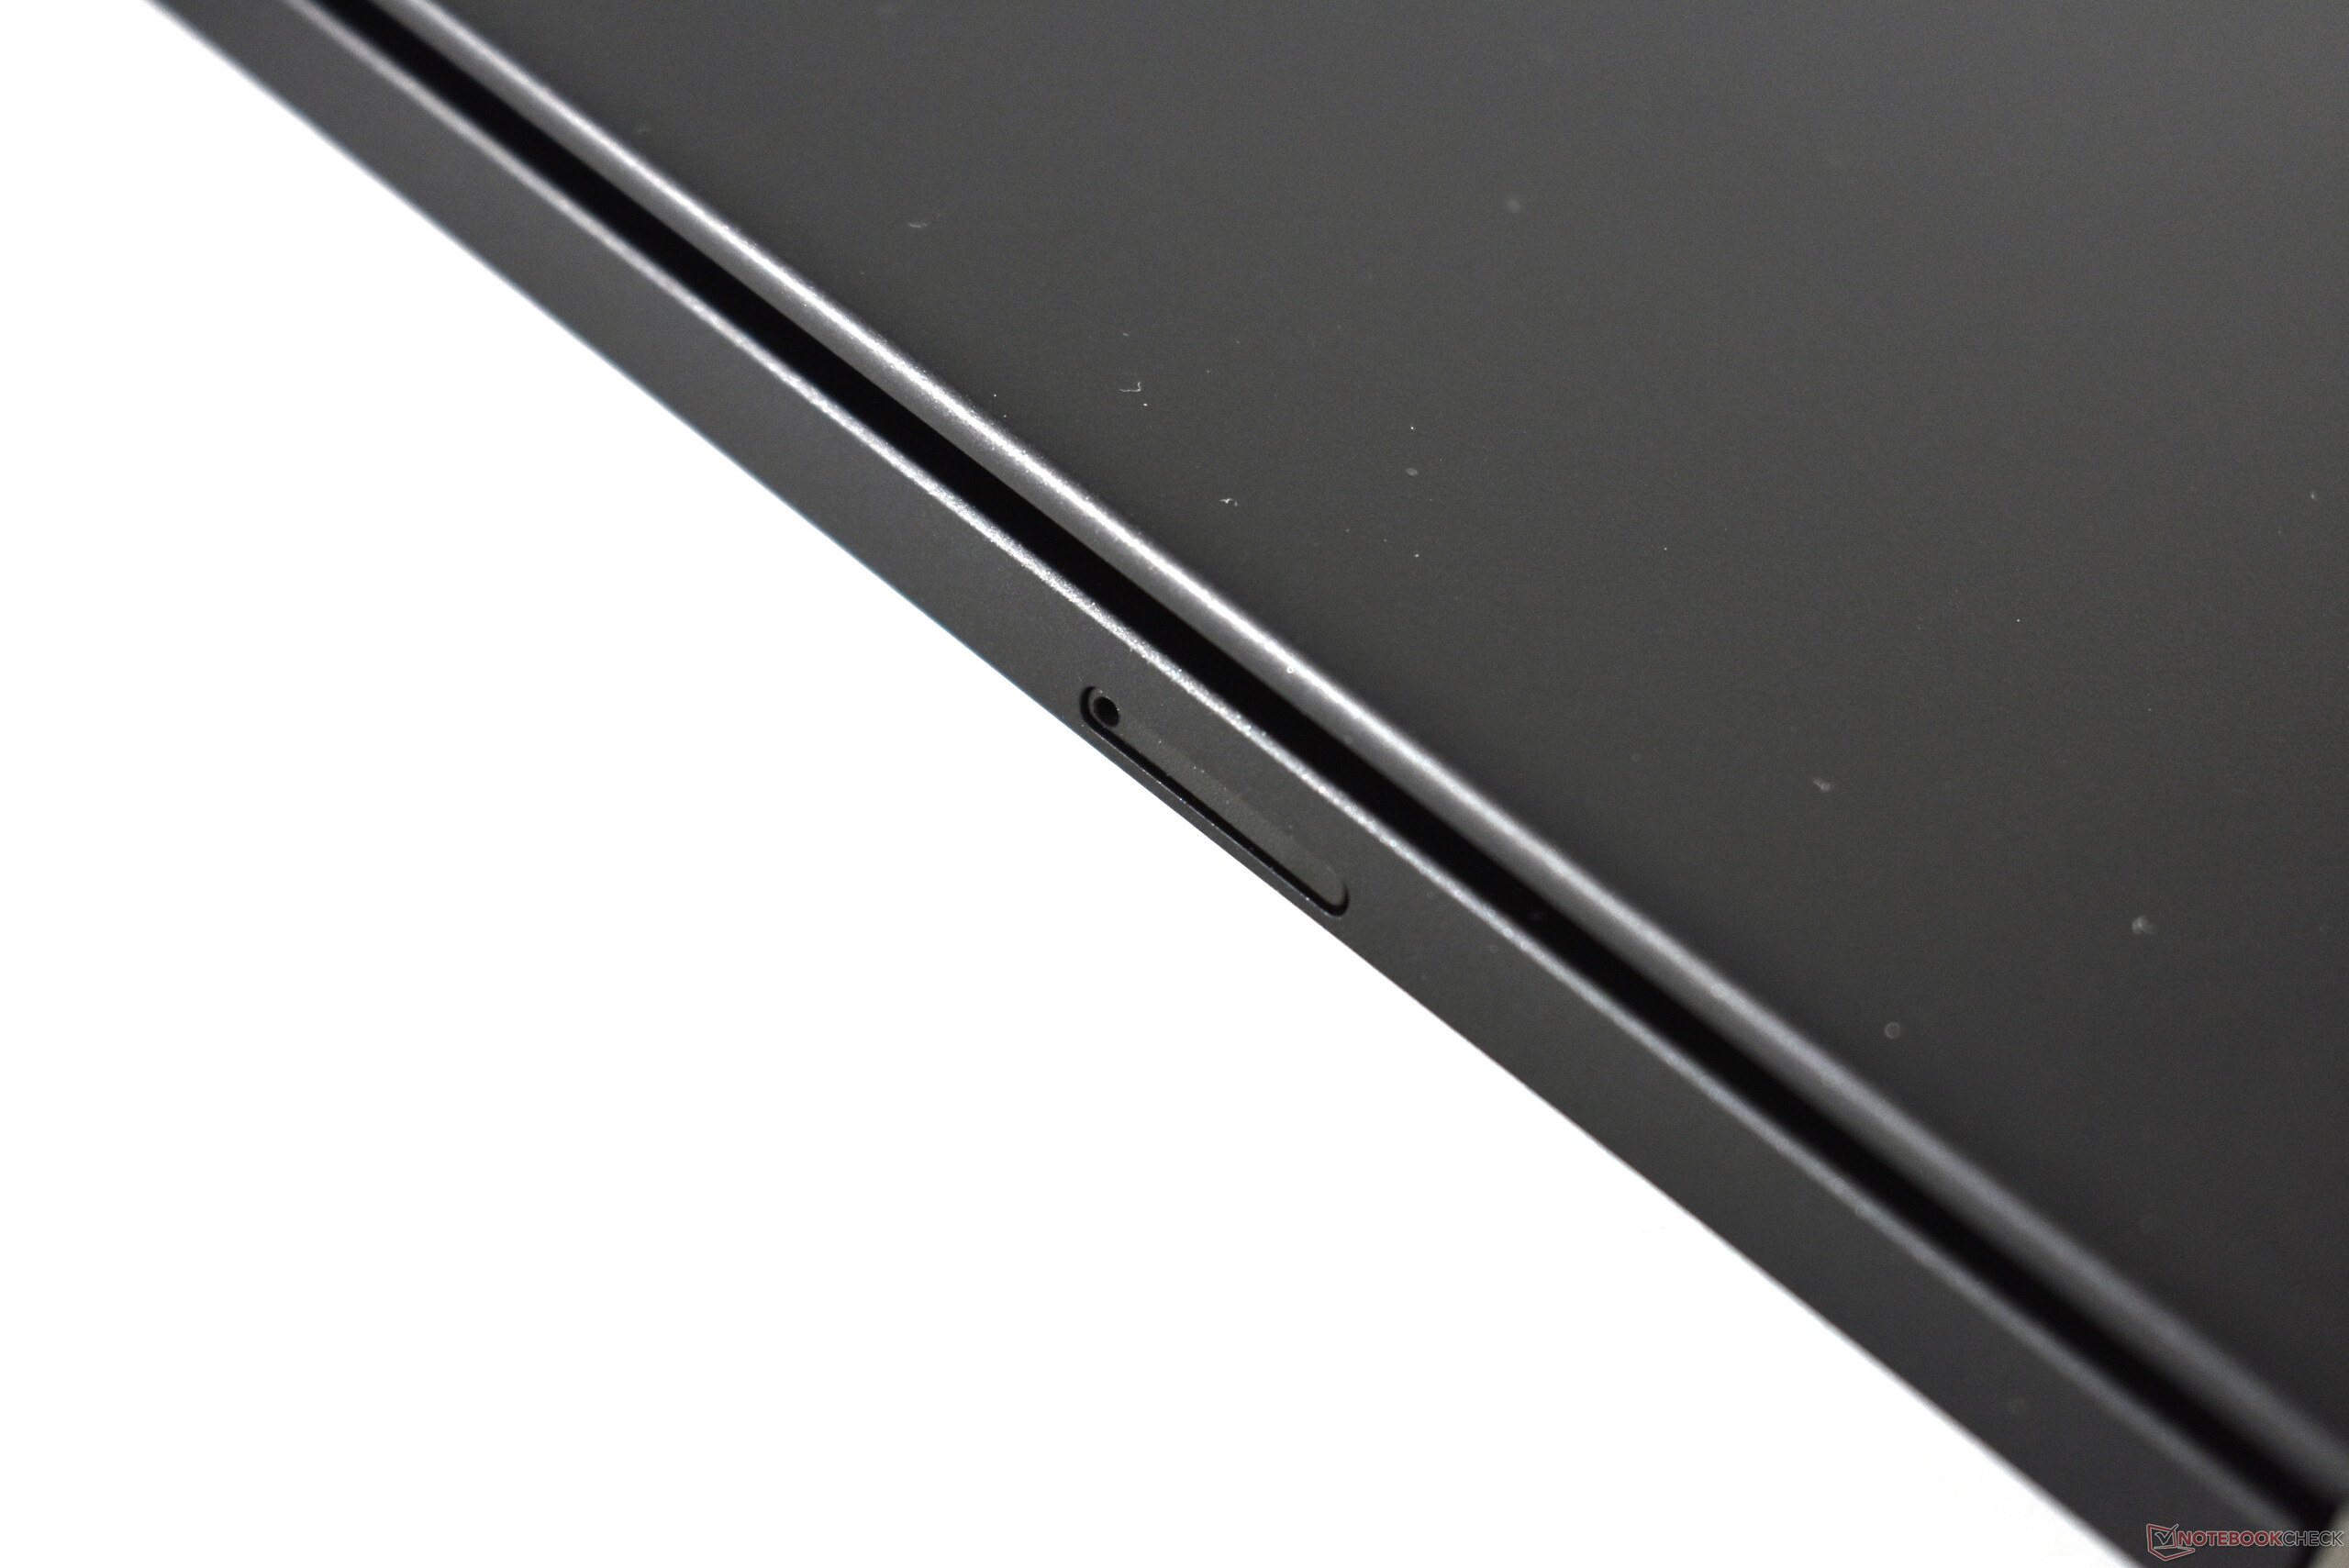
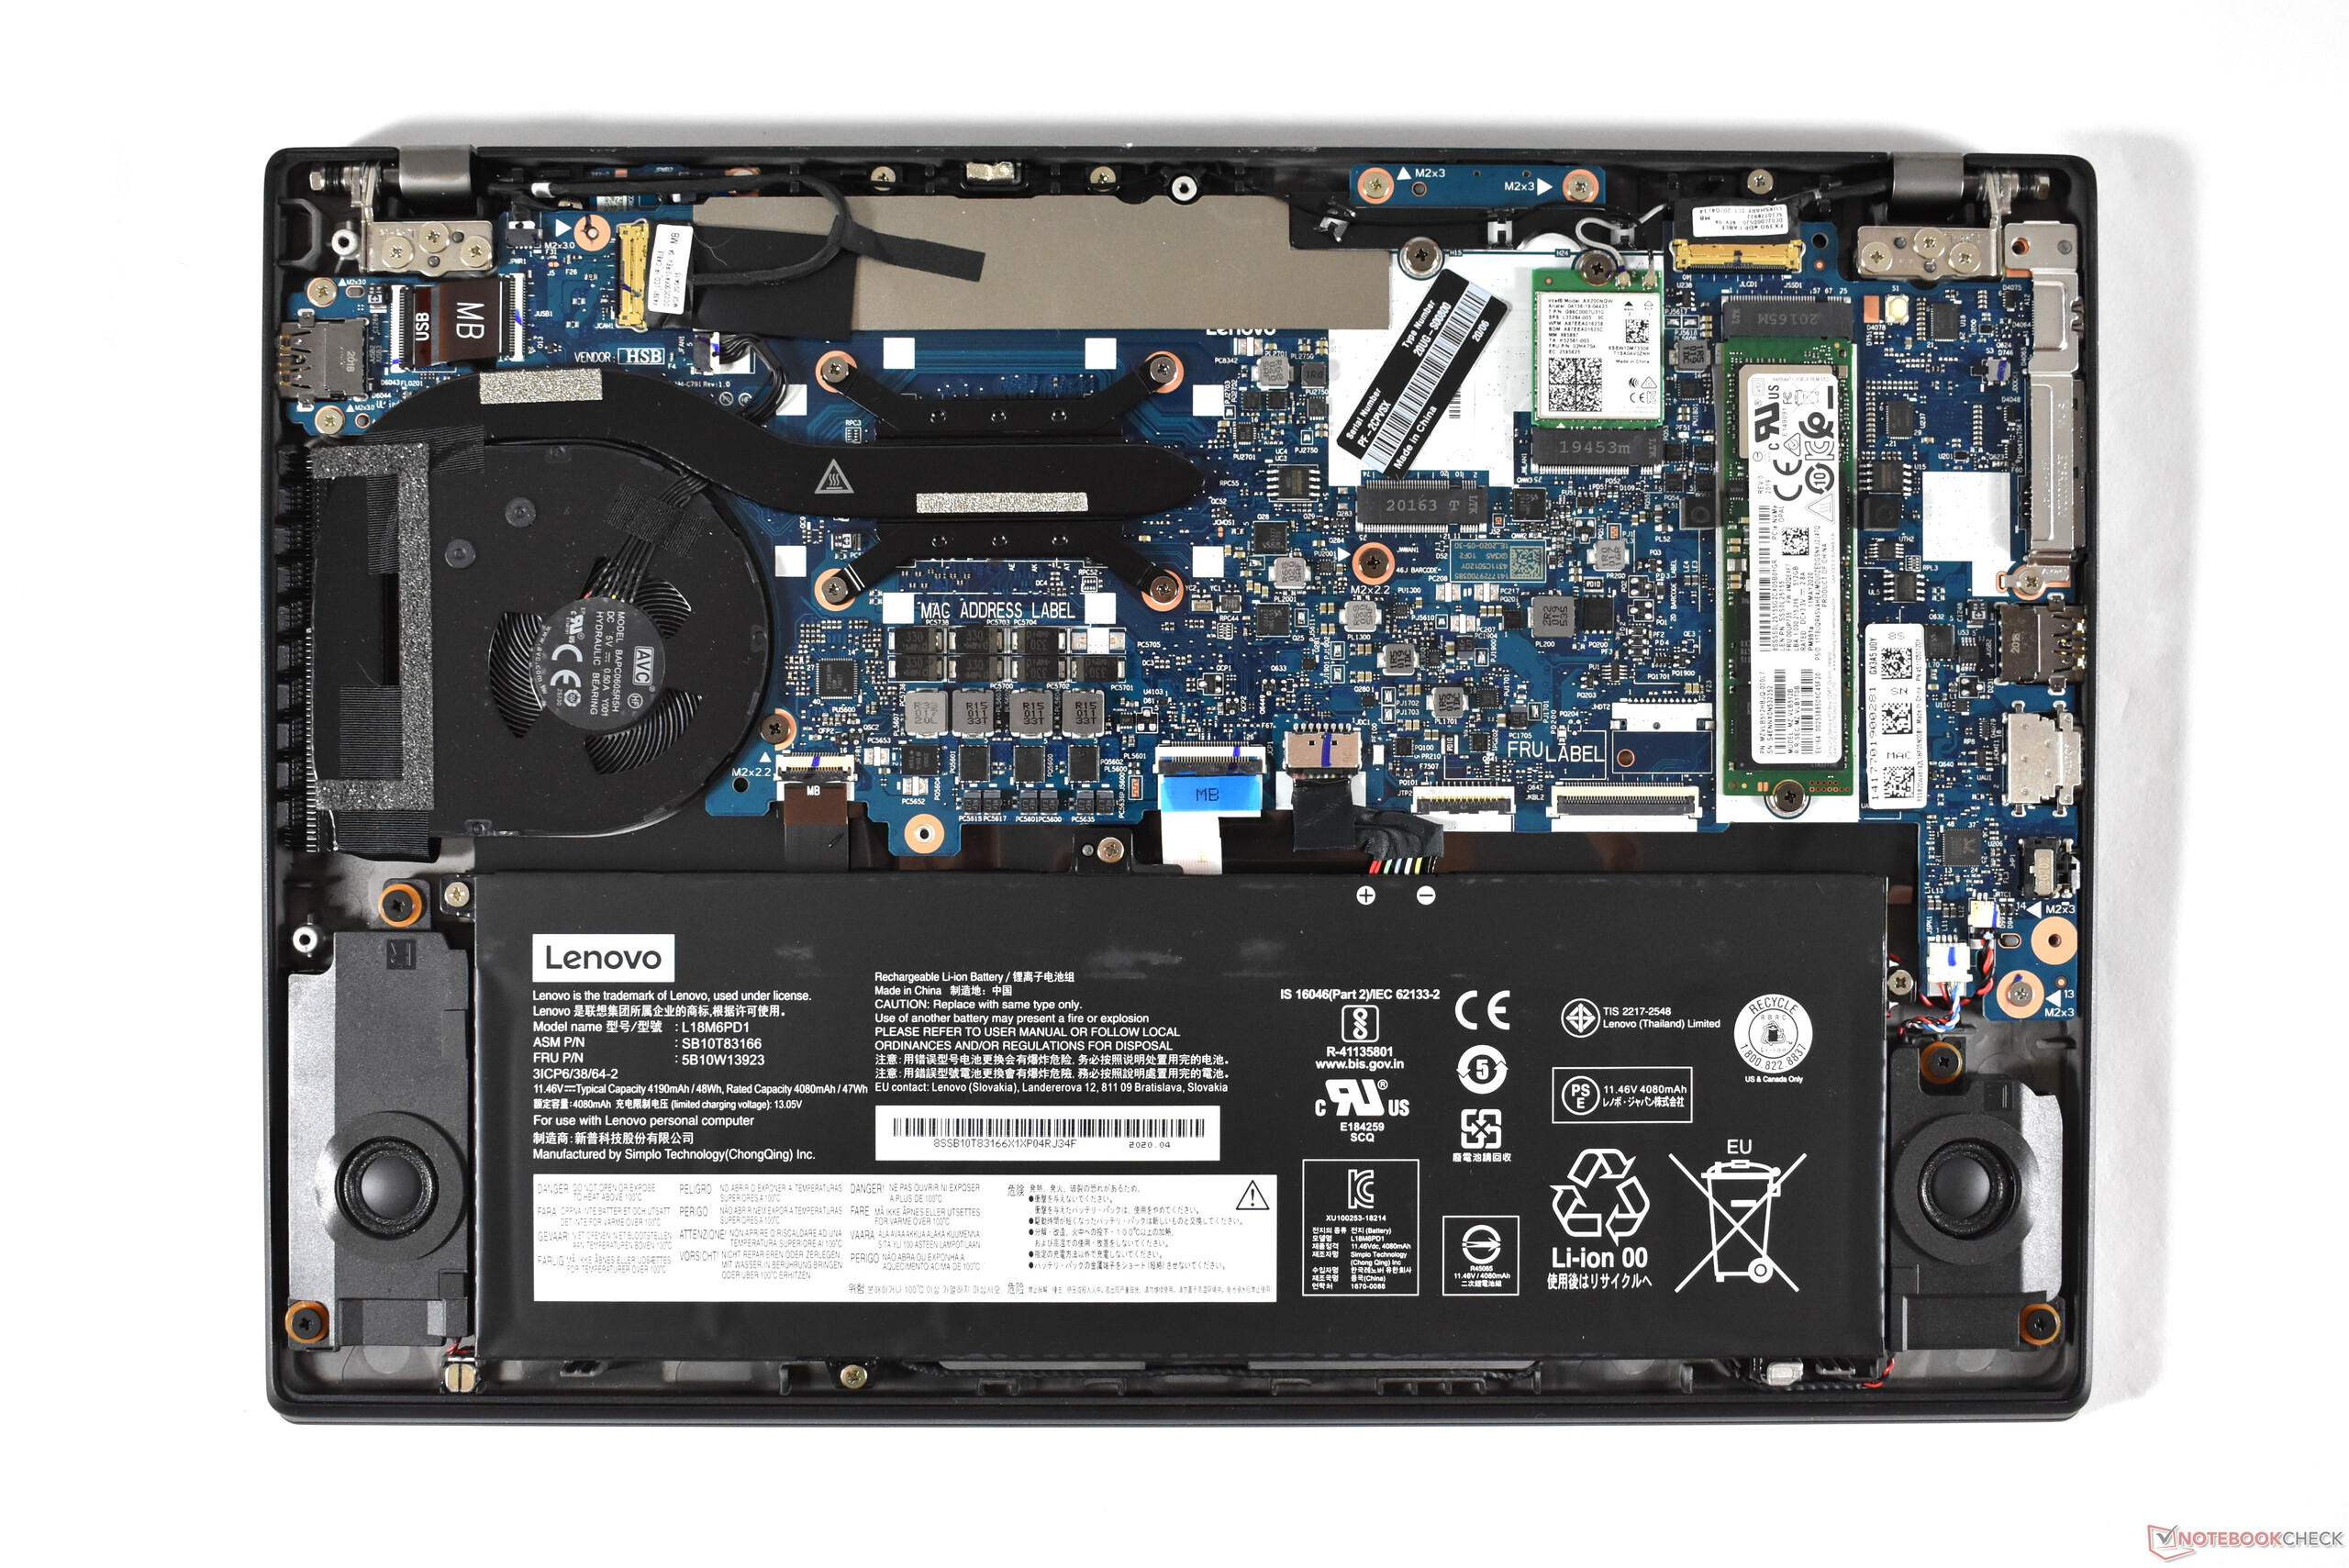
Enquanto isso, a maioria dos problemas são assumidos diretamente do modelo anterior, como o slot microSD de difícil acesso e a RAM soldada. Comparado com o ThinkPad T14s Gen 1, o X13 tem um teclado facilmente substituível, mas pior duração da bateria e o teclado é menor. Por falar em duração da bateria: Além da porta Thunderbolt 3 ausente, esta é uma das únicas pequenas desvantagens em comparação com o Intel ThinkPad X13.
Subportátil com um soco: Não existem muitos portáteis compactos que podem oferecer um desempenho semelhante ao ThinkPad X13 Gen 1. Os maiores concorrentes são os primos maiores do ThinkPad e do HP EliteBook 835 G7.
Podemos recomendar o Lenovo ThinkPad X13 Gen 1 com AMD Ryzen 4000 de todo o coração. Se alguém estiver procurando por um portátil de 13,3 polegadas, não há muitas opções que ofereçam o mesmo nível de desempenho. Um problema pode ser a competição com os ligeiramente maiores Lenovo ThinkPad T14s Gen 1 com CPUs AMD. Para a maioria dos usuários, o T14s pode ser a melhor escolha.
Lenovo ThinkPad X13-20UGS00800
- 08/13/2020 v7 (old)
Benjamin Herzig
Price comparison
