Breve Análise do Portátil Lenovo ThinkPad X270 (Core i5, Full HD)
| SD Card Reader | |
| average JPG Copy Test (av. of 3 runs) | |
| HP EliteBook 820 G4 Z2V72ET | |
| Dell Latitude 7280 | |
| Lenovo ThinkPad X270-20HMS00T00 | |
| maximum AS SSD Seq Read Test (1GB) | |
| Dell Latitude 7280 | |
| Lenovo ThinkPad X270-20HMS00T00 | |
| HP EliteBook 820 G4 Z2V72ET | |
| Networking | |
| iperf3 transmit AX12 | |
| Dell Latitude 7280 | |
| Lenovo ThinkPad X270-20HMS00T00 | |
| HP EliteBook 820 G4 Z2V72ET (jseb) | |
| iperf3 receive AX12 | |
| Lenovo ThinkPad X270-20HMS00T00 | |
| Dell Latitude 7280 | |
| HP EliteBook 820 G4 Z2V72ET (jseb) | |
| |||||||||||||||||||||||||
iluminação: 94 %
iluminação com acumulador: 282 cd/m²
Contraste: 1132:1 (Preto: 0.25 cd/m²)
ΔE ColorChecker Calman: 6.1 | ∀{0.5-29.43 Ø4.72}
ΔE Greyscale Calman: 6 | ∀{0.09-98 Ø4.97}
65.43% sRGB (Argyll 1.6.3 3D)
42.26% AdobeRGB 1998 (Argyll 1.6.3 3D)
46.11% AdobeRGB 1998 (Argyll 3D)
65.9% sRGB (Argyll 3D)
44.6% Display P3 (Argyll 3D)
Gamma: 2.05
CCT: 6832 K
| Lenovo ThinkPad X270-20HMS00T00 Innolux N125HCE-GN1, , 1920x1080, 12.5" | Dell Latitude 7280 AUO236D , , 1920x1080, 12.5" | HP EliteBook 820 G4 Z2V72ET Chi Mei, , 1920x1080, 12.5" | Lenovo ThinkPad X1 Carbon 2017-20HQS03P00 B140HAN03_1, , 1920x1080, 14" | Dell XPS 13 9360 FHD i5 Sharp SHP1449 LQ133M1, , 1920x1080, 13.3" | Lenovo ThinkPad X260-20F6007RGE Lenovo N125HCE-GN1, , 1920x1080, 12.5" | |
|---|---|---|---|---|---|---|
| Display | -0% | -0% | 34% | 10% | 0% | |
| Display P3 Coverage (%) | 44.6 44.6 | 44.41 0% | 44.45 0% | 61.4 38% | 48.94 10% | 44.71 0% |
| sRGB Coverage (%) | 65.9 65.9 | 65.4 -1% | 65.5 -1% | 85.9 30% | 73.3 11% | 66.1 0% |
| AdobeRGB 1998 Coverage (%) | 46.11 46.11 | 45.9 0% | 46.04 0% | 62.4 35% | 50.5 10% | 46.23 0% |
| Response Times | 9% | 14% | -3% | 6% | 16% | |
| Response Time Grey 50% / Grey 80% * (ms) | 40.8 ? | 32.4 ? 21% | 35 ? 14% | 41.6 ? -2% | 32.8 ? 20% | 32.8 ? 20% |
| Response Time Black / White * (ms) | 30.4 ? | 31.2 ? -3% | 26 ? 14% | 31.6 ? -4% | 33.2 ? -9% | 27.2 ? 11% |
| PWM Frequency (Hz) | 26040 ? | |||||
| Screen | -5% | -2% | 13% | 16% | 2% | |
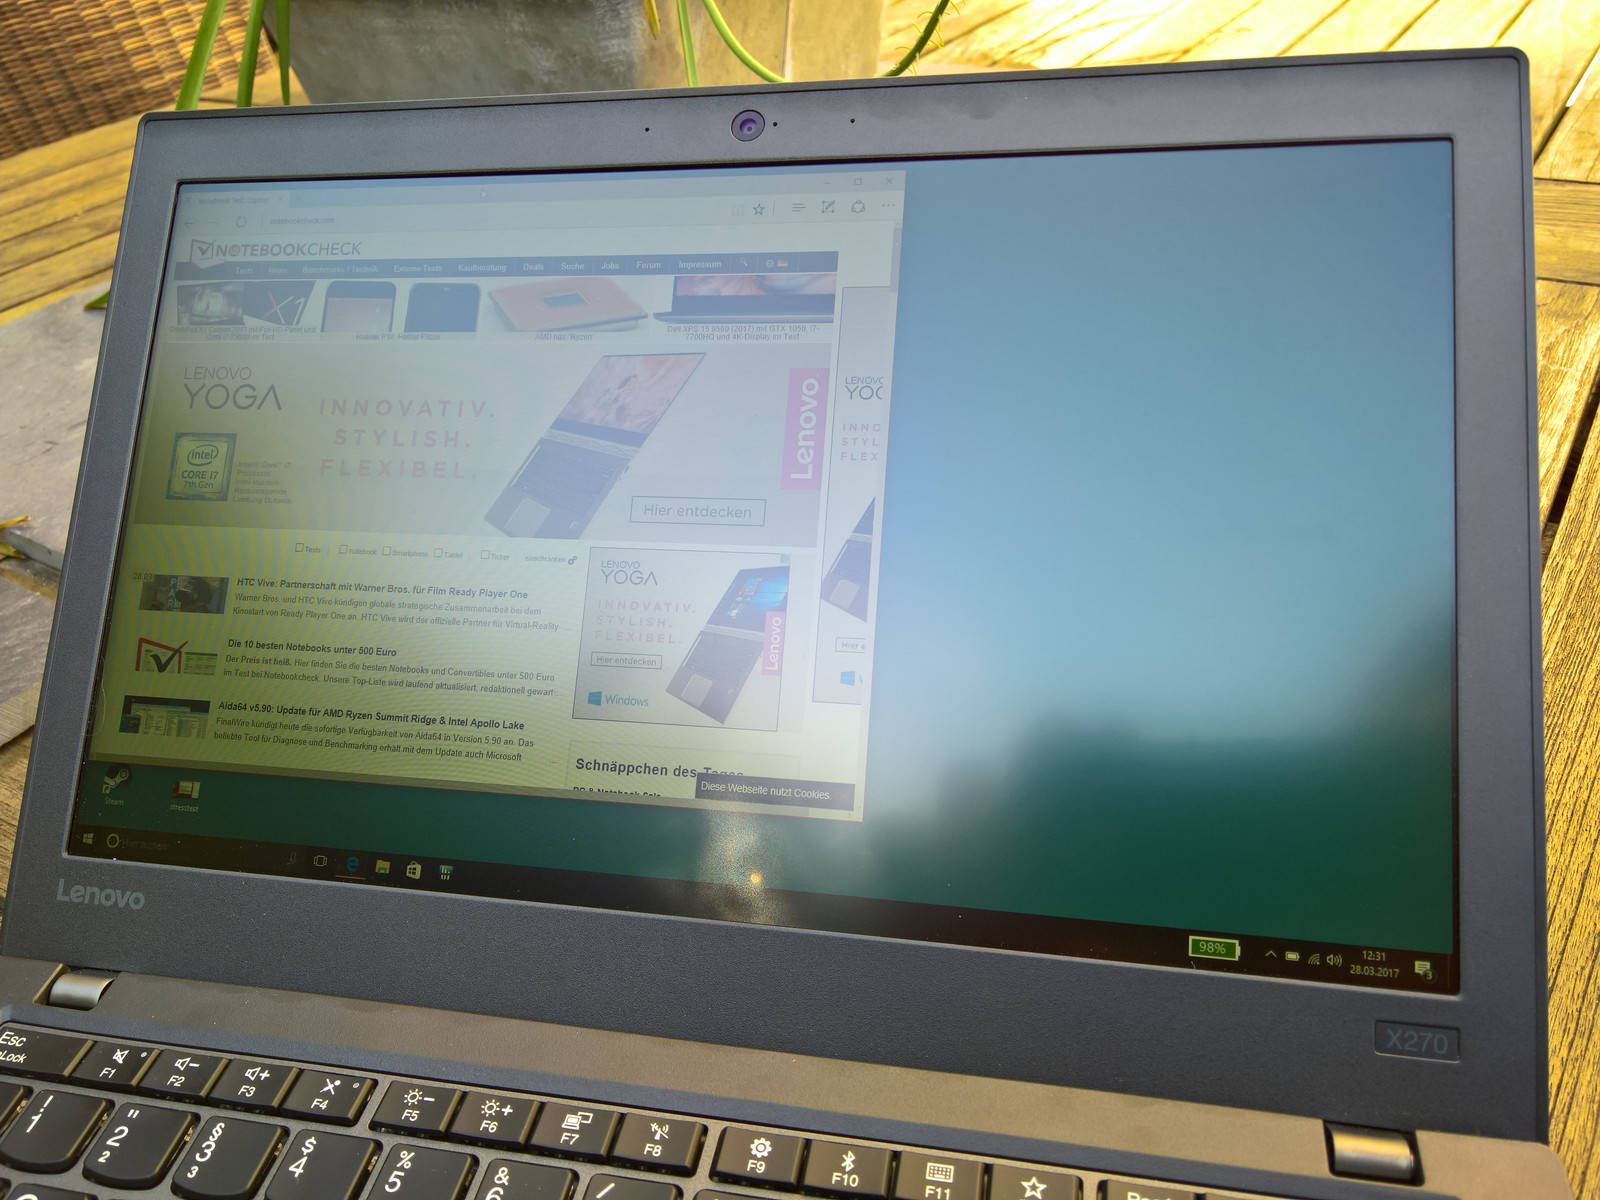
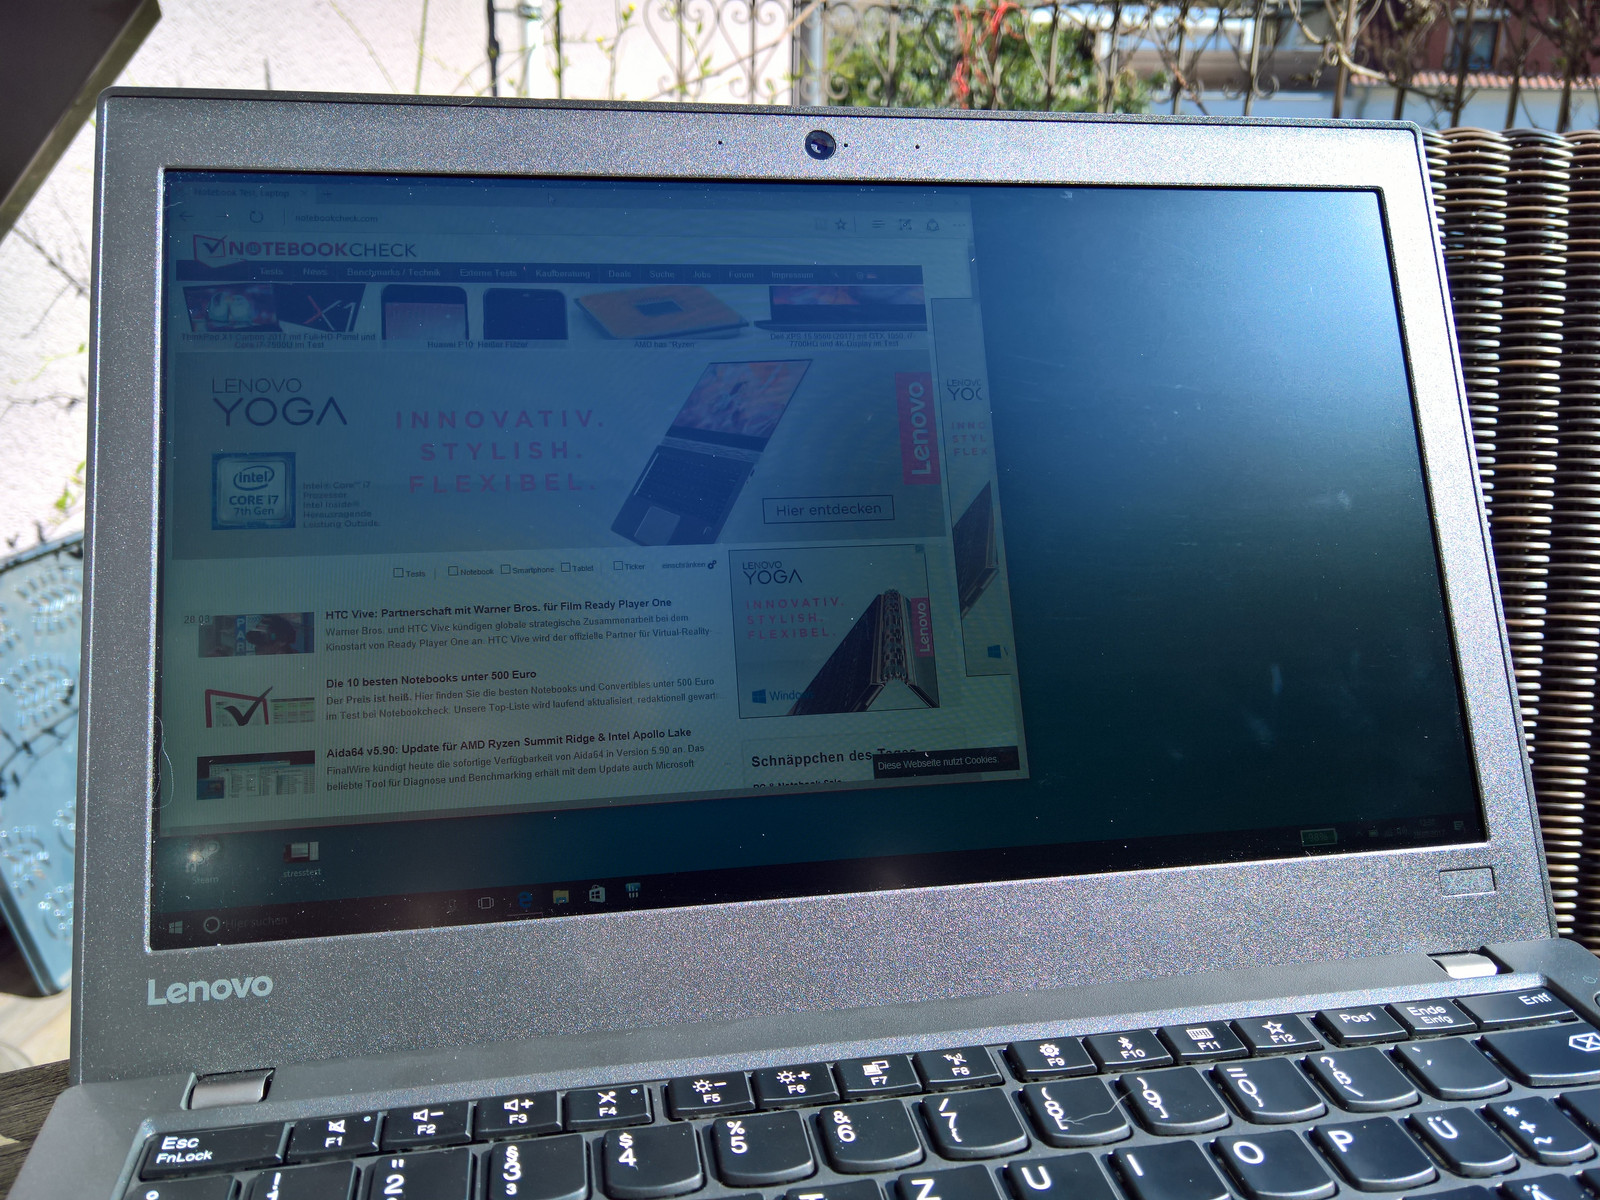
| Brightness middle (cd/m²) | 283 | 310.4 10% | 326 15% | 311 10% | 351.2 24% | 337 19% |
| Brightness (cd/m²) | 281 | 301 7% | 304 8% | 288 2% | 325 16% | 322 15% |
| Brightness Distribution (%) | 94 | 88 -6% | 81 -14% | 85 -10% | 89 -5% | 91 -3% |
| Black Level * (cd/m²) | 0.25 | 0.32 -28% | 0.29 -16% | 0.24 4% | 0.195 22% | 0.32 -28% |
| Contrast (:1) | 1132 | 970 -14% | 1124 -1% | 1296 14% | 1801 59% | 1053 -7% |
| Colorchecker dE 2000 * | 6.1 | 5.9 3% | 6.49 -6% | 5.5 10% | 7.4 -21% | 5.71 6% |
| Colorchecker dE 2000 max. * | 15.4 | 21 -36% | 15.95 -4% | 9 42% | 9.08 41% | 15.39 -0% |
| Greyscale dE 2000 * | 6 | 5.1 15% | 6.16 -3% | 6.2 -3% | 6.71 -12% | 5.15 14% |
| Gamma | 2.05 107% | 2.33 94% | 2.32 95% | 2.02 109% | 2.74 80% | 2.38 92% |
| CCT | 6832 95% | 6816 95% | 7575 86% | 5950 109% | 7222 90% | 6881 94% |
| Color Space (Percent of AdobeRGB 1998) (%) | 42.26 | 42 -1% | 42 -1% | 55.96 32% | 50.48 19% | 42.38 0% |
| Color Space (Percent of sRGB) (%) | 65.43 | 65 -1% | 65 -1% | 85.77 31% | 73.31 12% | 65.62 0% |
| Média Total (Programa/Configurações) | 1% /
-2% | 4% /
0% | 15% /
15% | 11% /
13% | 6% /
3% |
* ... menor é melhor
Exibir tempos de resposta
| ↔ Tempo de resposta preto para branco | ||
|---|---|---|
| 30.4 ms ... ascensão ↗ e queda ↘ combinadas | ↗ 16.4 ms ascensão | 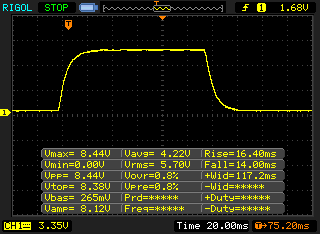 |
| ↘ 14 ms queda | ||
| A tela mostra taxas de resposta lentas em nossos testes e será insatisfatória para os jogadores. Em comparação, todos os dispositivos testados variam de 0.1 (mínimo) a 240 (máximo) ms. » 82 % de todos os dispositivos são melhores. Isso significa que o tempo de resposta medido é pior que a média de todos os dispositivos testados (19.8 ms). | ||
| ↔ Tempo de resposta 50% cinza a 80% cinza | ||
| 40.8 ms ... ascensão ↗ e queda ↘ combinadas | ↗ 21.2 ms ascensão | 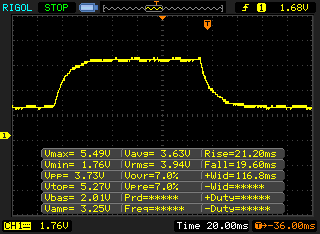 |
| ↘ 19.6 ms queda | ||
| A tela mostra taxas de resposta lentas em nossos testes e será insatisfatória para os jogadores. Em comparação, todos os dispositivos testados variam de 0.165 (mínimo) a 636 (máximo) ms. » 64 % de todos os dispositivos são melhores. Isso significa que o tempo de resposta medido é pior que a média de todos os dispositivos testados (31 ms). | ||
Cintilação da tela / PWM (modulação por largura de pulso)
| Tela tremeluzindo/PWM detectado | 26040 Hz | ≤ 50 % configuração de brilho | 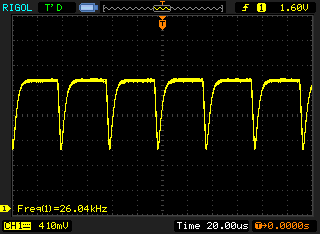 |
A luz de fundo da tela pisca em 26040 Hz (pior caso, por exemplo, utilizando PWM) Cintilação detectada em uma configuração de brilho de 50 % e abaixo. Não deve haver cintilação ou PWM acima desta configuração de brilho. A frequência de 26040 Hz é bastante alta, então a maioria dos usuários sensíveis ao PWM não deve notar nenhuma oscilação. [pwm_comparison] Em comparação: 52 % de todos os dispositivos testados não usam PWM para escurecer a tela. Se PWM foi detectado, uma média de 7769 (mínimo: 5 - máximo: 343500) Hz foi medida. | |||
| PCMark 8 Home Score Accelerated v2 | 3575 pontos | |
| PCMark 8 Work Score Accelerated v2 | 4660 pontos | |
Ajuda | ||
| Lenovo ThinkPad X270-20HMS00T00 Toshiba NVMe THNSF5512GPUK | Dell Latitude 7280 SanDisk X400 M.2 2280 256GB | HP EliteBook 820 G4 Z2V72ET Samsung PM951 NVMe MZVLV512 | Lenovo ThinkPad X1 Carbon 2017-20HQS03P00 Samsung PM961 NVMe MZVLW512HMJP | Dell XPS 13 9360 FHD i5 Toshiba NVMe THNSN5256GPUK | Lenovo ThinkPad X260-20F6007RGE Liteonit LCH-512V2S | |
|---|---|---|---|---|---|---|
| CrystalDiskMark 3.0 | -45% | 5% | 43% | -12% | -42% | |
| Read Seq (MB/s) | 1190 | 470.8 -60% | 1315 11% | 1827 54% | 1233 4% | 499.6 -58% |
| Write Seq (MB/s) | 985 | 477.4 -52% | 594 -40% | 1383 40% | 733 -26% | 403 -59% |
| Read 512 (MB/s) | 858 | 370.1 -57% | 661 -23% | 814 -5% | 1036 21% | 322.9 -62% |
| Write 512 (MB/s) | 528 | 323.2 -39% | 594 13% | 1098 108% | 439.9 -17% | 372.4 -29% |
| Read 4k (MB/s) | 35.27 | 30.23 -14% | 42.87 22% | 61 73% | 29.31 -17% | 27.22 -23% |
| Write 4k (MB/s) | 124.5 | 59.5 -52% | 151.6 22% | 172.2 38% | 116.9 -6% | 83.6 -33% |
| Read 4k QD32 (MB/s) | 495.3 | 344.4 -30% | 568 15% | 601 21% | 479.2 -3% | 316.5 -36% |
| Write 4k QD32 (MB/s) | 418.3 | 183 -56% | 491.7 18% | 495.6 18% | 218.3 -48% | 273.1 -35% |

| 3DMark 11 Performance | 1543 pontos | |
| 3DMark Cloud Gate Standard Score | 5519 pontos | |
| 3DMark Fire Strike Score | 739 pontos | |
Ajuda | ||
| baixo | média | alto | ultra | |
|---|---|---|---|---|
| BioShock Infinite (2013) | 42.8 | 25.3 | 20.8 | 6.5 |
| Rise of the Tomb Raider (2016) | 19.1 | |||
| Civilization 6 (2016) | 30.7 | 10.3 |
Barulho
| Ocioso |
| 29 / 29 / 30.4 dB |
| Carga |
| 34.1 / 37.6 dB |
 | ||
30 dB silencioso 40 dB(A) audível 50 dB(A) ruidosamente alto |
||
min: | ||
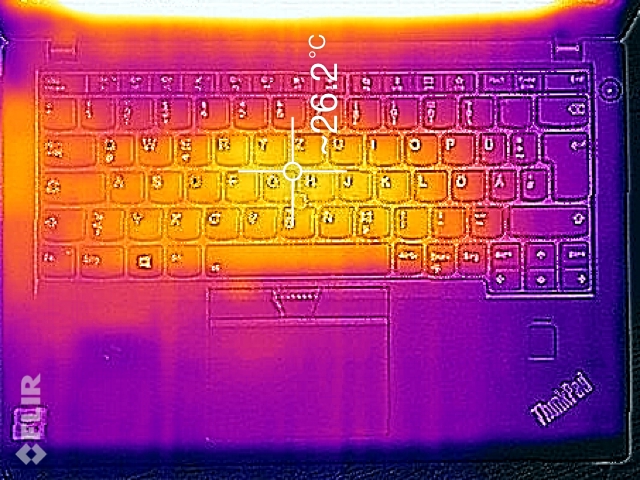

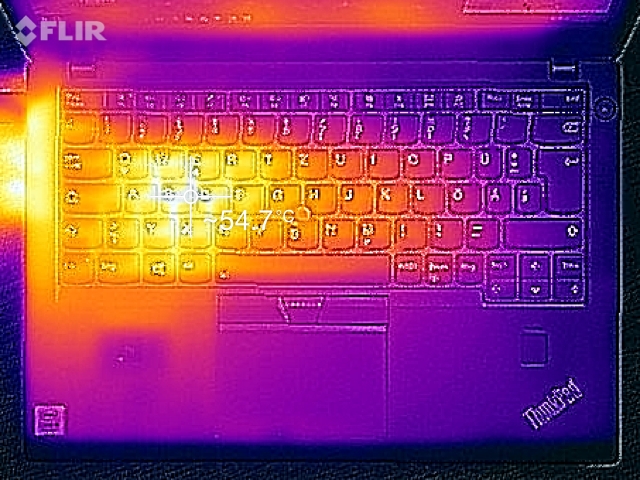
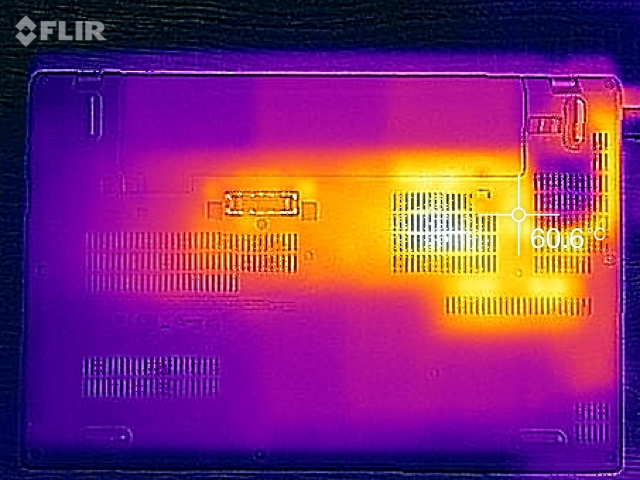
(-) A temperatura máxima no lado superior é 52.9 °C / 127 F, em comparação com a média de 34.3 °C / 94 F , variando de 21.2 a 62.5 °C para a classe Office.
(-) A parte inferior aquece até um máximo de 57.8 °C / 136 F, em comparação com a média de 36.8 °C / 98 F
(+) Em uso inativo, a temperatura média para o lado superior é 24.1 °C / 75 F, em comparação com a média do dispositivo de 29.5 °C / ### class_avg_f### F.
(±) Os apoios para as mãos e o touchpad podem ficar muito quentes ao toque, com um máximo de 38.5 °C / 101.3 F.
(-) A temperatura média da área do apoio para as mãos de dispositivos semelhantes foi 27.5 °C / 81.5 F (-11 °C / -19.8 F).
Lenovo ThinkPad X270-20HMS00T00 análise de áudio
(-) | alto-falantes não muito altos (###valor### dB)
Graves 100 - 315Hz
(-) | quase nenhum baixo - em média 18.8% menor que a mediana
(±) | a linearidade dos graves é média (11.1% delta para a frequência anterior)
Médios 400 - 2.000 Hz
(+) | médios equilibrados - apenas 1.5% longe da mediana
(+) | médios são lineares (5.4% delta para frequência anterior)
Altos 2 - 16 kHz
(+) | agudos equilibrados - apenas 3.1% longe da mediana
(+) | os máximos são lineares (6.4% delta da frequência anterior)
Geral 100 - 16.000 Hz
(±) | a linearidade do som geral é média (22.3% diferença em relação à mediana)
Comparado com a mesma classe
» 59% de todos os dispositivos testados nesta classe foram melhores, 9% semelhantes, 32% piores
» O melhor teve um delta de 7%, a média foi 21%, o pior foi 53%
Comparado com todos os dispositivos testados
» 65% de todos os dispositivos testados foram melhores, 6% semelhantes, 29% piores
» O melhor teve um delta de 4%, a média foi 24%, o pior foi 134%
Apple MacBook 12 (Early 2016) 1.1 GHz análise de áudio
(+) | os alto-falantes podem tocar relativamente alto (###valor### dB)
Graves 100 - 315Hz
(±) | graves reduzidos - em média 11.3% menor que a mediana
(±) | a linearidade dos graves é média (14.2% delta para a frequência anterior)
Médios 400 - 2.000 Hz
(+) | médios equilibrados - apenas 2.4% longe da mediana
(+) | médios são lineares (5.5% delta para frequência anterior)
Altos 2 - 16 kHz
(+) | agudos equilibrados - apenas 2% longe da mediana
(+) | os máximos são lineares (4.5% delta da frequência anterior)
Geral 100 - 16.000 Hz
(+) | o som geral é linear (10.2% diferença em relação à mediana)
Comparado com a mesma classe
» 7% de todos os dispositivos testados nesta classe foram melhores, 2% semelhantes, 91% piores
» O melhor teve um delta de 5%, a média foi 18%, o pior foi 53%
Comparado com todos os dispositivos testados
» 5% de todos os dispositivos testados foram melhores, 1% semelhantes, 94% piores
» O melhor teve um delta de 4%, a média foi 24%, o pior foi 134%
| desligado | |
| Ocioso | |
| Carga |
|
Key:
min: | |
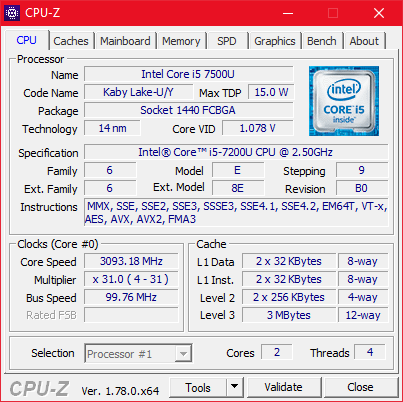
| Lenovo ThinkPad X270-20HMS00T00 i5-7200U, HD Graphics 620, Toshiba NVMe THNSF5512GPUK, IPS LED, 1920x1080, 12.5" | Dell Latitude 7280 i7-7600U, HD Graphics 620, SanDisk X400 M.2 2280 256GB, IPS, 1920x1080, 12.5" | HP EliteBook 820 G4 Z2V72ET i7-7500U, HD Graphics 620, Samsung PM951 NVMe MZVLV512, IPS, 1920x1080, 12.5" | Lenovo ThinkPad X1 Carbon 2017-20HQS03P00 i7-7500U, HD Graphics 620, Samsung PM961 NVMe MZVLW512HMJP, IPS, 1920x1080, 14" | Dell XPS 13 9360 FHD i5 i5-7200U, HD Graphics 620, Toshiba NVMe THNSN5256GPUK, IPS, 1920x1080, 13.3" | Lenovo ThinkPad X260-20F6007RGE 6500U, HD Graphics 520, Liteonit LCH-512V2S, IPS, 1920x1080, 12.5" | |
|---|---|---|---|---|---|---|
| Power Consumption | 11% | 19% | -16% | 21% | 5% | |
| Idle Minimum * (Watt) | 3.5 | 4.28 -22% | 2.7 23% | 3.84 -10% | 4.1 -17% | 3.5 -0% |
| Idle Average * (Watt) | 5.8 | 5.11 12% | 4.8 17% | 6.3 -9% | 4.2 28% | 5.5 5% |
| Idle Maximum * (Watt) | 7.6 | 5.49 28% | 6.6 13% | 8.6 -13% | 5.1 33% | 6.7 12% |
| Load Average * (Watt) | 33.2 | 29.83 10% | 28.5 14% | 41.9 -26% | 22.1 33% | 28.9 13% |
| Load Maximum * (Watt) | 40.4 | 30.05 26% | 29 28% | 48.7 -21% | 29.4 27% | 42.1 -4% |
* ... menor é melhor
| Lenovo ThinkPad X270-20HMS00T00 i5-7200U, HD Graphics 620, 46 Wh | Dell Latitude 7280 i7-7600U, HD Graphics 620, 60 Wh | HP EliteBook 820 G4 Z2V72ET i7-7500U, HD Graphics 620, 49 Wh | Lenovo ThinkPad X1 Carbon 2017-20HQS03P00 i7-7500U, HD Graphics 620, 57 Wh | Dell XPS 13 9360 FHD i5 i5-7200U, HD Graphics 620, 60 Wh | Lenovo ThinkPad X260-20F6007RGE 6500U, HD Graphics 520, 46 Wh | |
|---|---|---|---|---|---|---|
| Duração da bateria | 74% | 59% | 39% | 63% | 13% | |
| Reader / Idle (h) | 17.1 | 25.9 51% | 22.4 31% | 20.9 22% | 21.6 26% | 15.9 -7% |
| H.264 (h) | 6.8 | 8.9 31% | 11.9 75% | 7.8 15% | ||
| WiFi v1.3 (h) | 5.4 | 11.4 111% | 9.4 74% | 8.3 54% | 11.3 109% | 8.4 56% |
| Load (h) | 1.7 | 2.7 59% | 3.4 100% | 1.8 6% | 2.6 53% | 1.5 -12% |
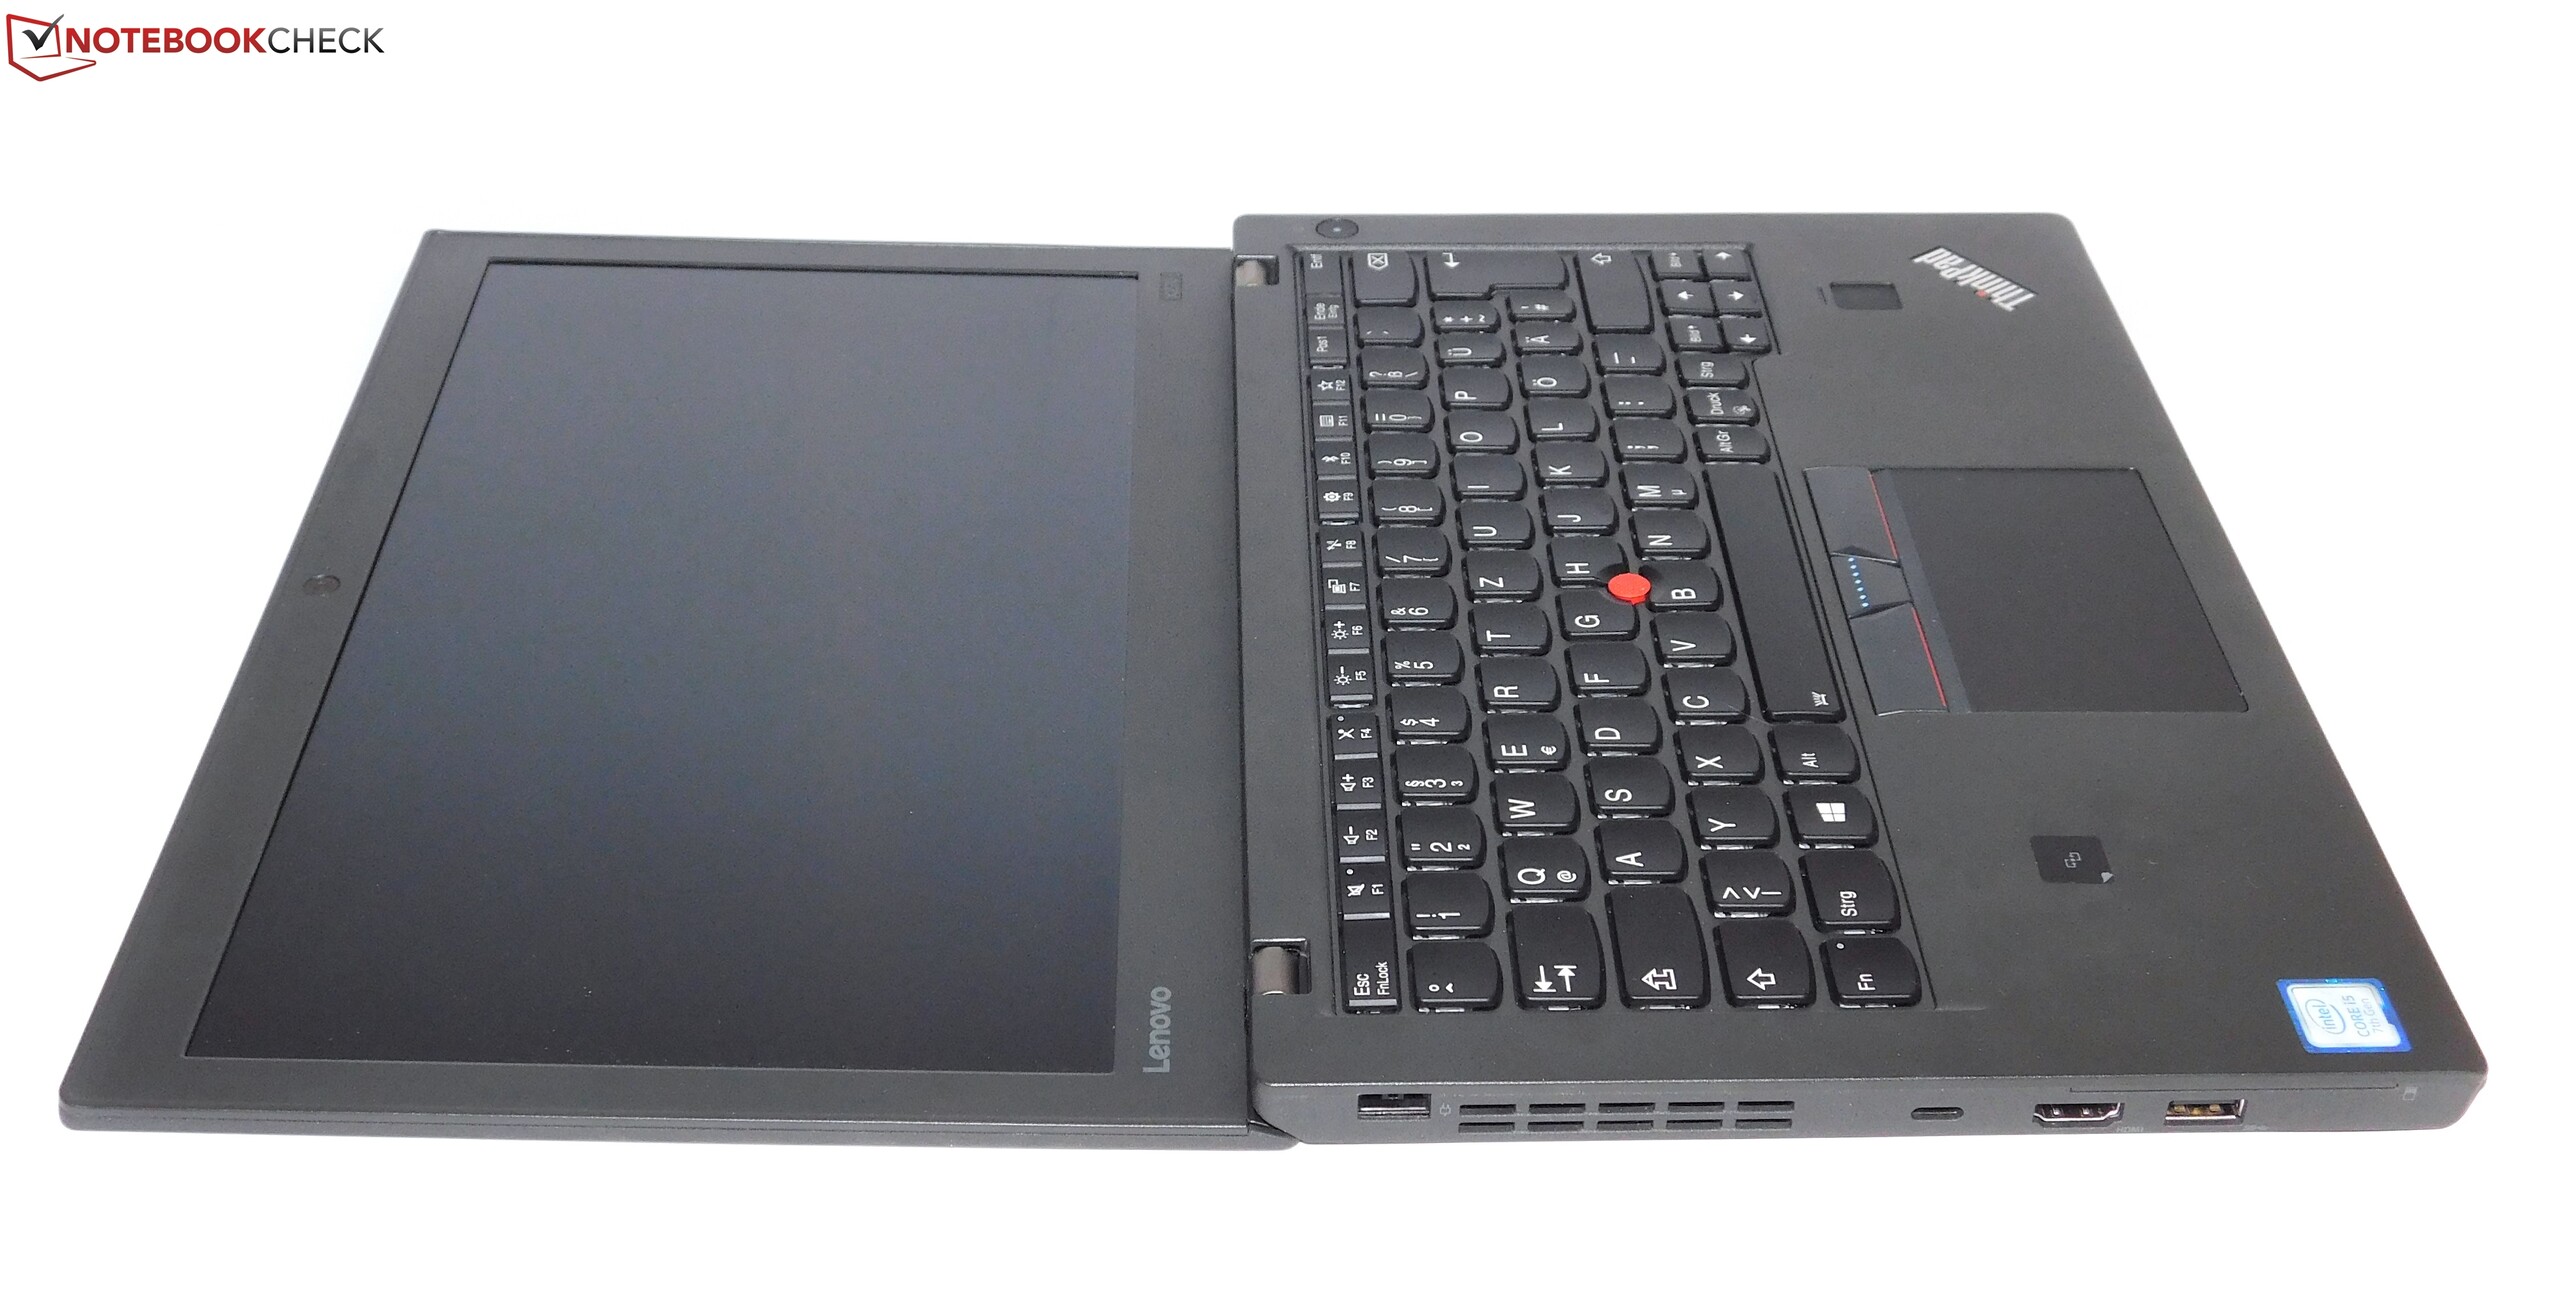
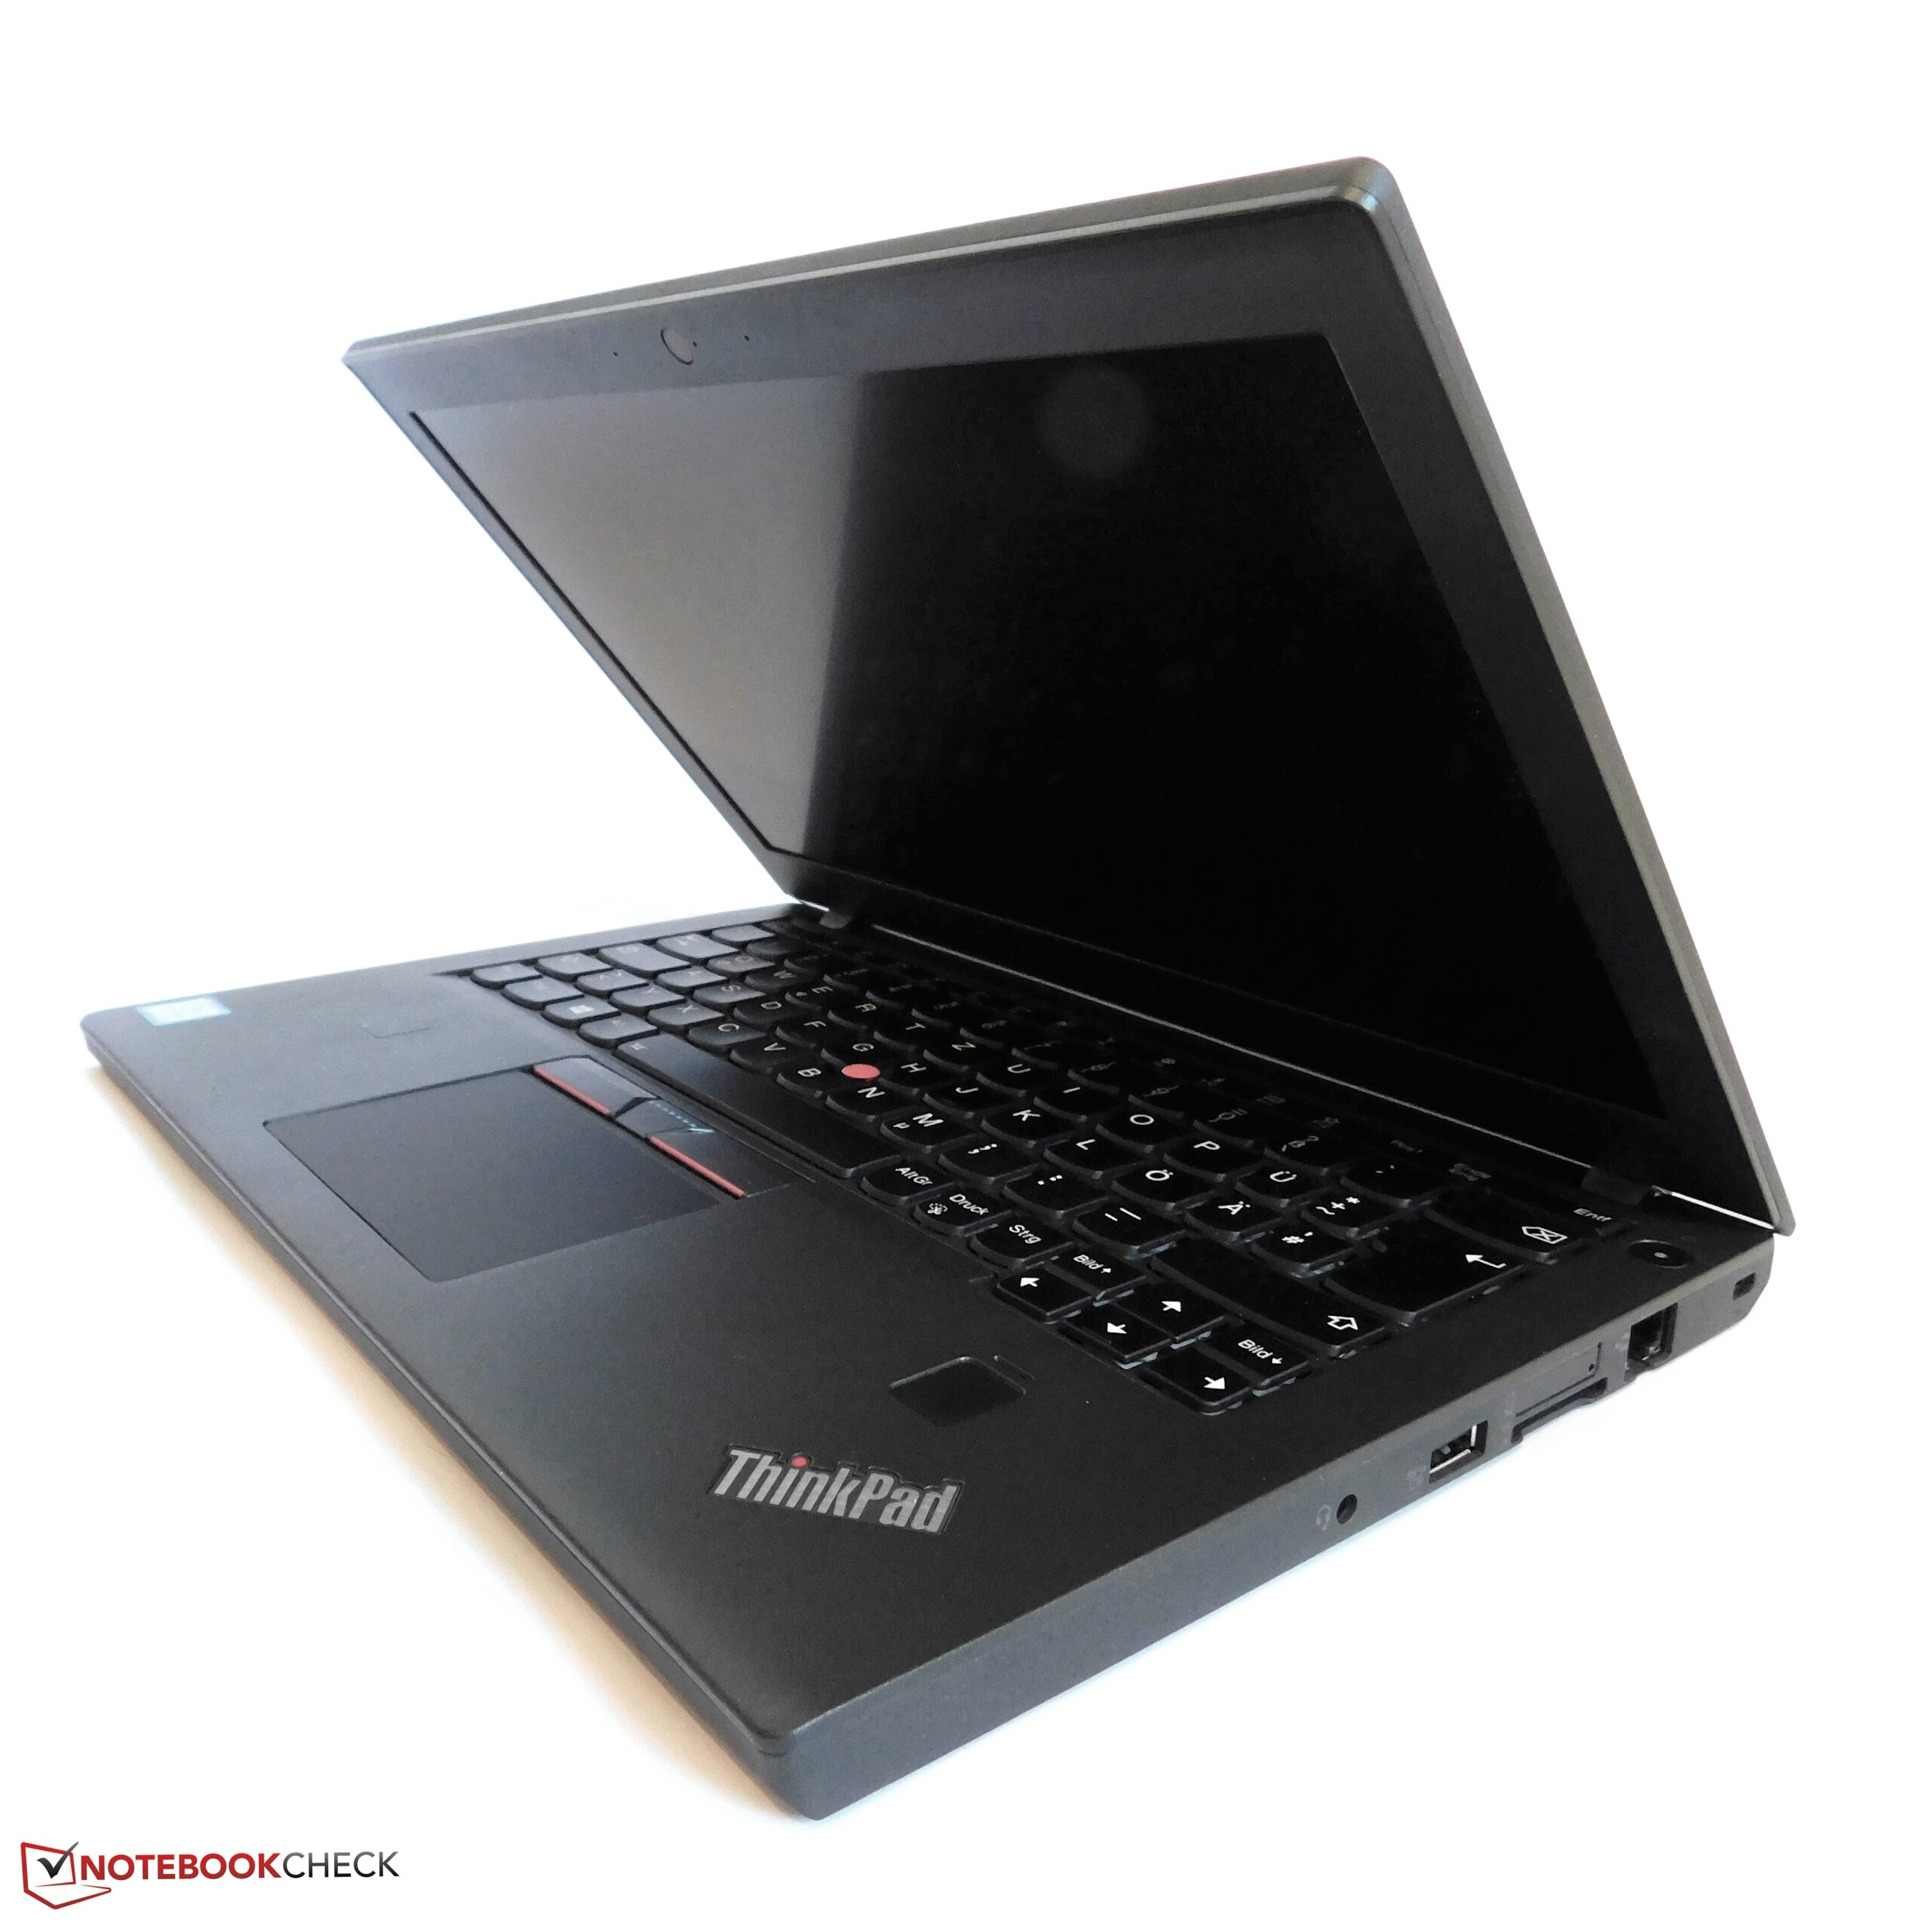
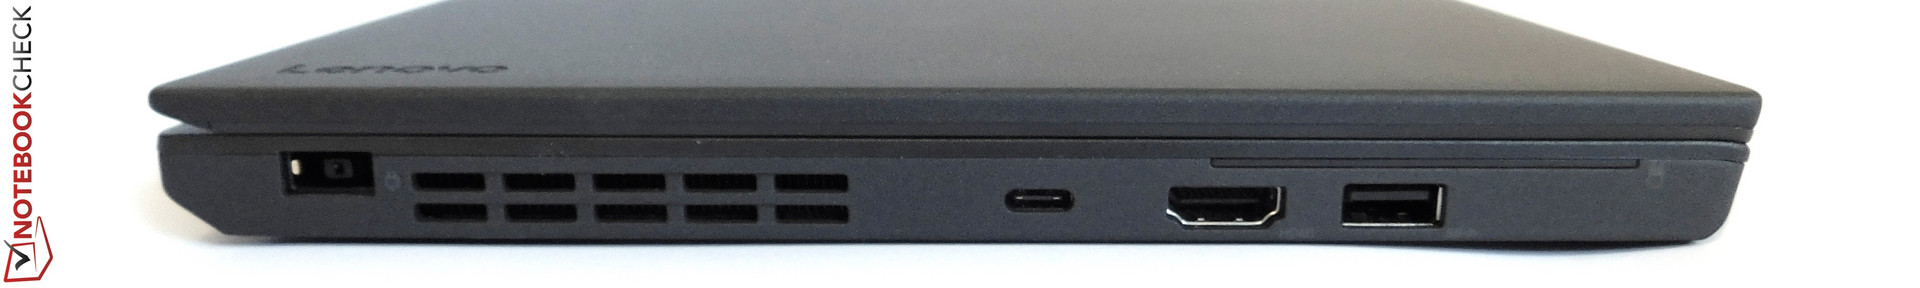
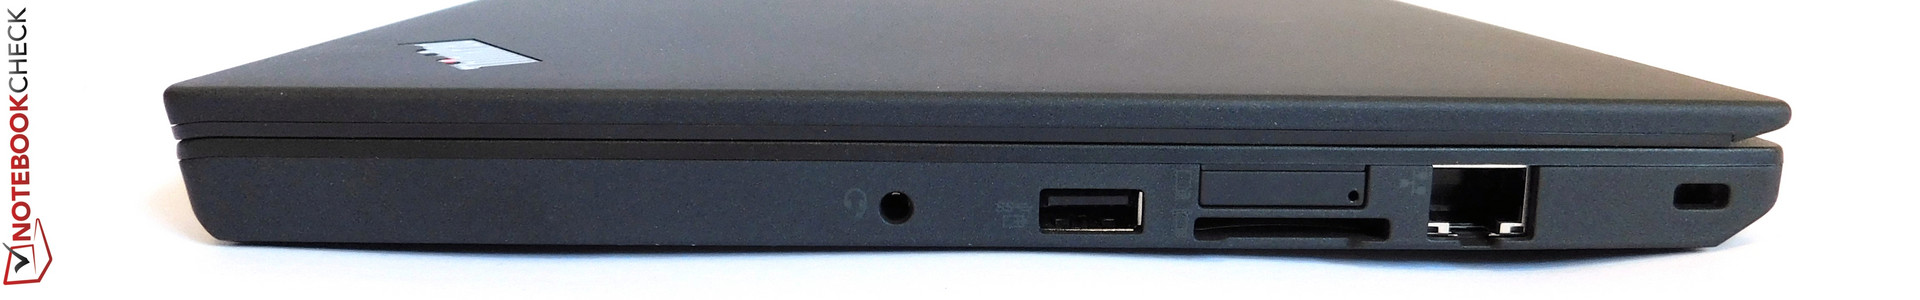
Esta é a quarta vez que a Lenovo reutilizou mesma carcaça. Como é sempre com os ThinkPads, os ótimos dispositivos de entrada, bem como o recurso PowerBridge – que basicamente não têm oponentes reais - são pros definitivos. Considerando o seu tamanho, o X270 possui muitas portas, o que significa que é muito flexível para usar. O pequeno tamanho também significa que é fácil e confortável de manusear. Neste respeito, não há diferenças com seus predecessores – depois de tudo é basicamente o mesmo aparelho.
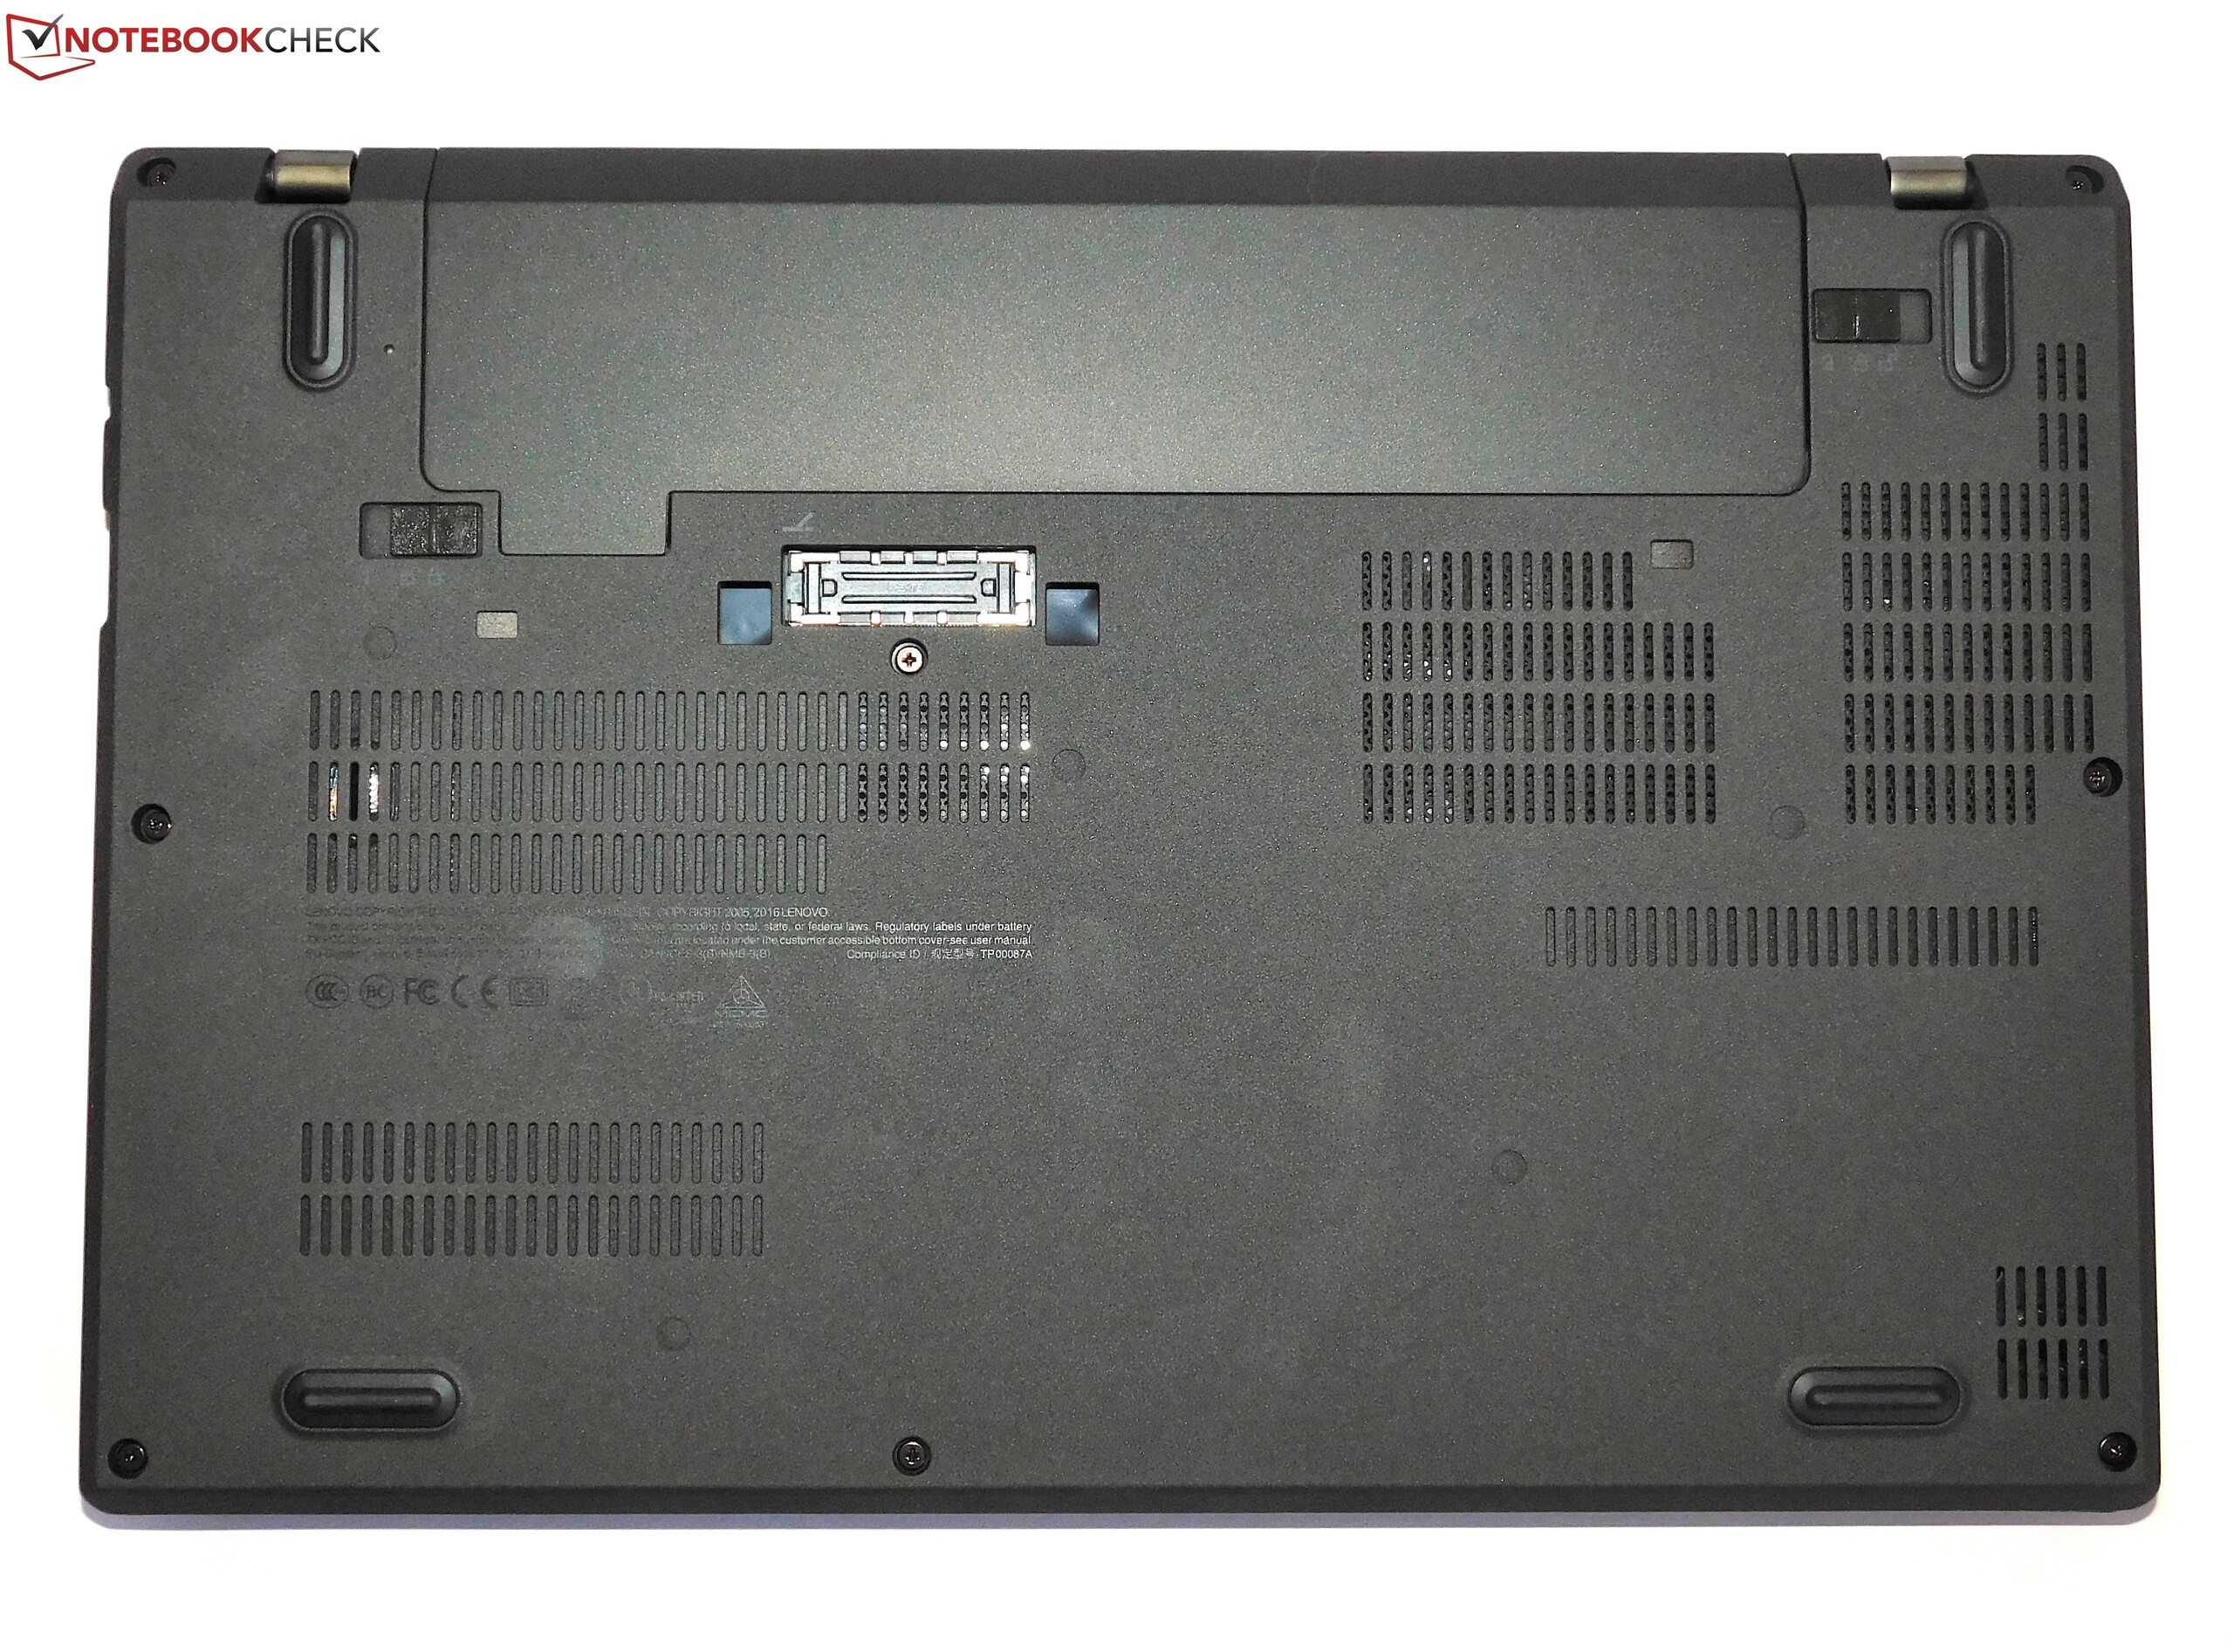
Infelizmente, a Lenovo estragou algumas áreas do X270. Primeiro que nada, o sistema de resfriamento: É um pouco alarmante que um aparelho equipado com um processador ULV atinja 60°C (140°F) de temperatura na superfície - apesar de que a ventoinha irritante esteja funcionando muito frequentemente. Outro ponto negativo é a tela full HD, que é significantemente mais escura que seu predecessor, com uma similar baixa cobertura do espaço de cores. As fraquezas na construção também são similares para a aqueles das versões prévias. O design da manutenção já era um problema para o X260: não é nada agradável abrir a pare inferior. Surpreendentemente, as bateria externas de 3 células do computador também oferecem durações de bateria mais curtas que as do seu predecessor.
A série Lenovo ThinkPad X2xx precisa de uma reforma urgentemente. Devido aos muitos pequenos problemas, não podemos recomendar o X270.
Se você não precisar de um portátil compacto que tem uma configuração flexível da bateria (PowerBridge), não podemos realmente recomendar o ThinkPad X270. Isto não se deve apenas aos vários problemas descritos acima – embora apenas esses seriam suficiente para que recomendemos dar uma olhada nos concorrentes diretos como o HP EliteBook 820 G4 e Dell Latitude 7280. Em geral, é difícil encontrar motivos para comprar o X270, a menos que precise do PowerBridge e de alguns recursos que são particularmente importantes para grandes empresas (smart card, porta docking, Ethernet). O Dell XPS 13 e o maior concorrente interno da Lenovo, o ThinkPad X1 Carbon, por exemplo, são modelos que oferecem maior qualidade e uma tela maior, enquanto é mais portável. Isto faz questionar toda a existência dos subportáteis. Um argumento pode ser o preço – embora os subportáteis clássicos de 12 polegadas também não são realmente de baixo custo.
Pro
Contra
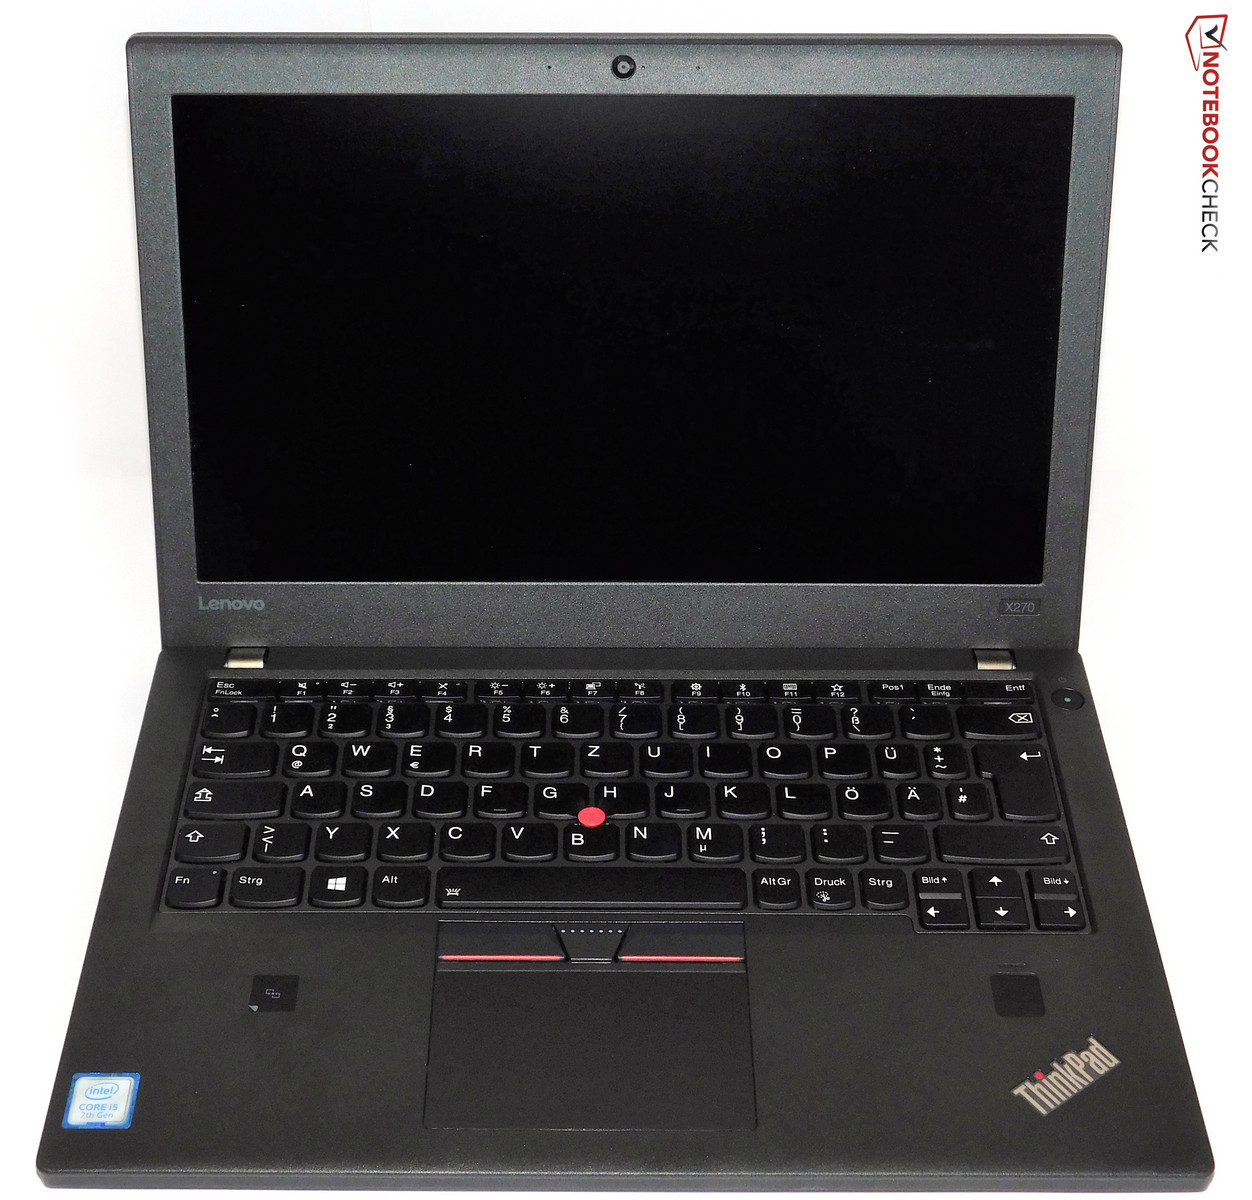
This is the fourth time Lenovo has reused the same case. As always with ThinkPads, the great input devices, as well as the PowerBridge feature – which basically has not real competitors - are definite pros. Considering its size, the X270 has a lot of ports, which means that it is very flexible to use. The small size also means that it is easy and comfortable to handle. In this respect, there are no differences to its predecessors – after all it is basically the same device.
Unfortunately, Lenovo did mess up in some areas of the X270. First of all, the cooling system: It is a little alarming that a device equipped with a ULV processor reaches 60°C (140°F) surface temperature - despite the cooling fan running annoyingly often. Another downside is the full HD display, which is significantly darker than its predecessor's, with a similar low color space coverage. The weaknesses in manufacturing are also similar to those of the previous versions. The maintenance design was already an issue for the X260: it is no fun to open the BaseCover. Surprisingly, the computer's smaller external 3-cell batteries also offer shorter battery life than that of its predecessor.
Lenovo's ThinkPad X2xx series urgently needs a makeover. Due to the many little problems, we cannot recommend the X270.
If you do not absolutely need a compact notebook which has a flexible battery configuration (PowerBridge), we cannot really recommend the ThinkPad X270. This is not just because of the various problems described above – although those alone would suffice for us to recommend taking a look at the direct competitors HP EliteBook 820 G4 and Dell Latitude 7280. General, it is difficult to find reasons for buying the X270, unless you need the PowerBridge and some features that are particularly important for big companies (smart card, docking port, Ethernet). The Dell XPS 13 and Lenovo’s largest in-house competitor, the ThinkPad X1 Carbon, for example, are models that offer higher quality and a bigger display, while still being very portable. That calls into question the whole existence of subnotebooks. One argument might be the price – although the classic 12-inch subnotebooks are not really low-cost either.
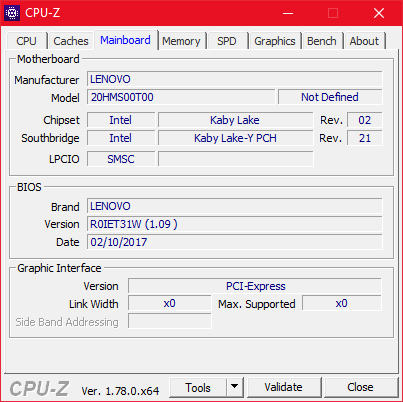
Lenovo ThinkPad X270-20HMS00T00
- 03/29/2017 v6 (old)
Benjamin Herzig