Breve Análise do Portátil Lenovo V320-17IKB (7200U, FHD)
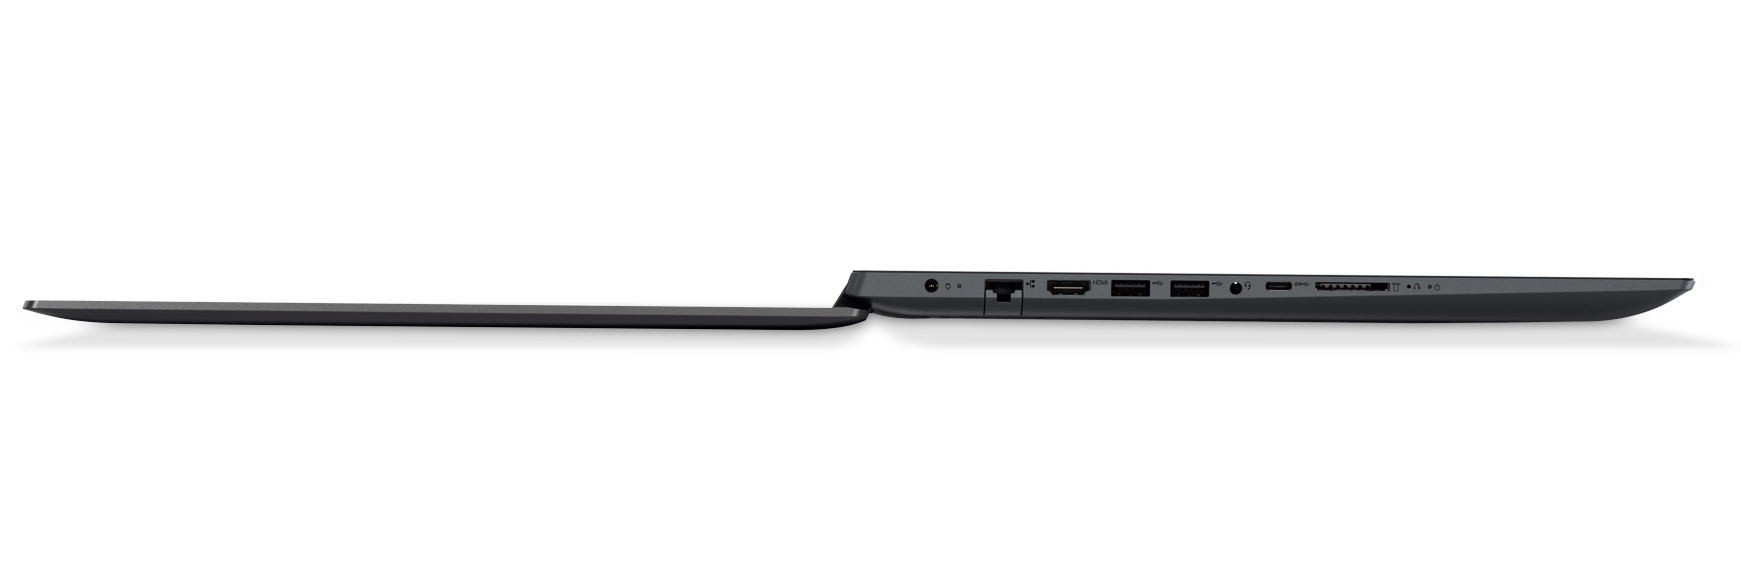


| SD Card Reader | |
| average JPG Copy Test (av. of 3 runs) | |
| Acer Aspire E5-774-54HJ (Toshiba Exceria Pro SDXC 64 GB UHS-II) | |
| Lenovo V320-17IKB 81AH0002GE (Toshiba Exceria Pro SDXC 64 GB UHS-II) | |
| HP 17-x066ng (Toshiba Exceria Pro SDXC 64 GB UHS-II) | |
| HP Pavilion 17-x110ng (Toshiba Exceria Pro SDXC 64 GB UHS-II) | |
| maximum AS SSD Seq Read Test (1GB) | |
| Acer Aspire E5-774-54HJ (Toshiba Exceria Pro SDXC 64 GB UHS-II) | |
| Lenovo V320-17IKB 81AH0002GE (Toshiba Exceria Pro SDXC 64 GB UHS-II) | |
| HP 17-x066ng (Toshiba Exceria Pro SDXC 64 GB UHS-II) | |
| HP Pavilion 17-x110ng (Toshiba Exceria Pro SDXC 64 GB UHS-II) | |
| Networking | |
| iperf3 transmit AX12 | |
| Lenovo V320-17IKB 81AH0002GE | |
| HP 17-x066ng | |
| HP Pavilion 17-x110ng | |
| iperf3 receive AX12 | |
| Lenovo V320-17IKB 81AH0002GE | |
| HP 17-x066ng | |
| HP Pavilion 17-x110ng | |
| |||||||||||||||||||||||||
iluminação: 83 %
iluminação com acumulador: 412 cd/m²
Contraste: 1056:1 (Preto: 0.39 cd/m²)
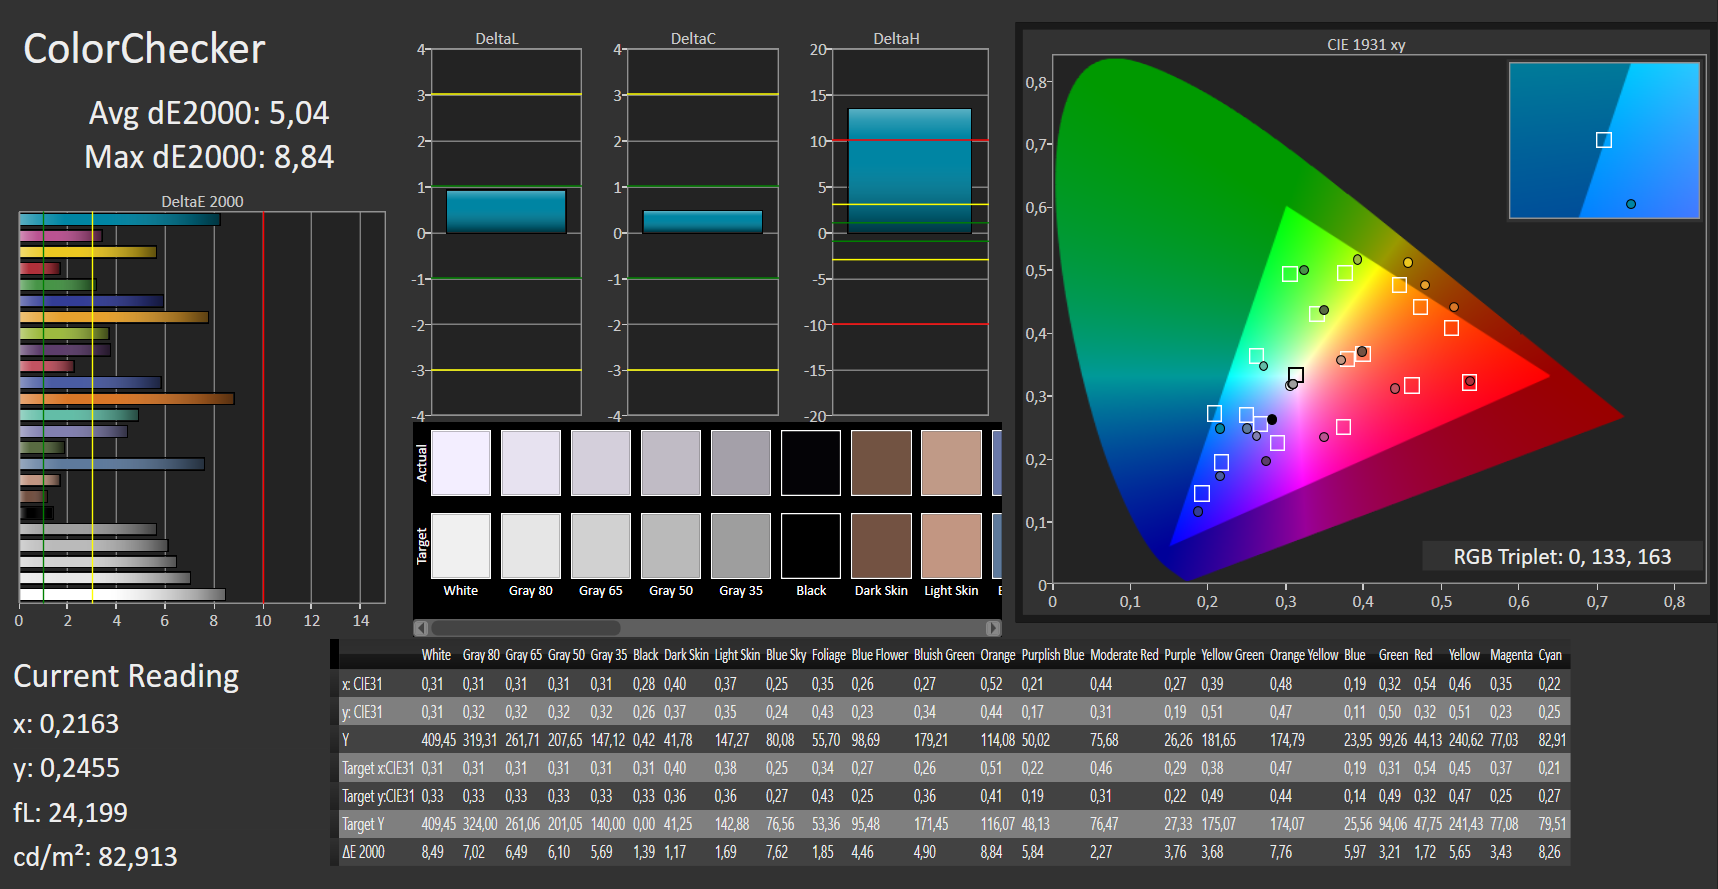
ΔE ColorChecker Calman: 5.04 | ∀{0.5-29.43 Ø4.71}
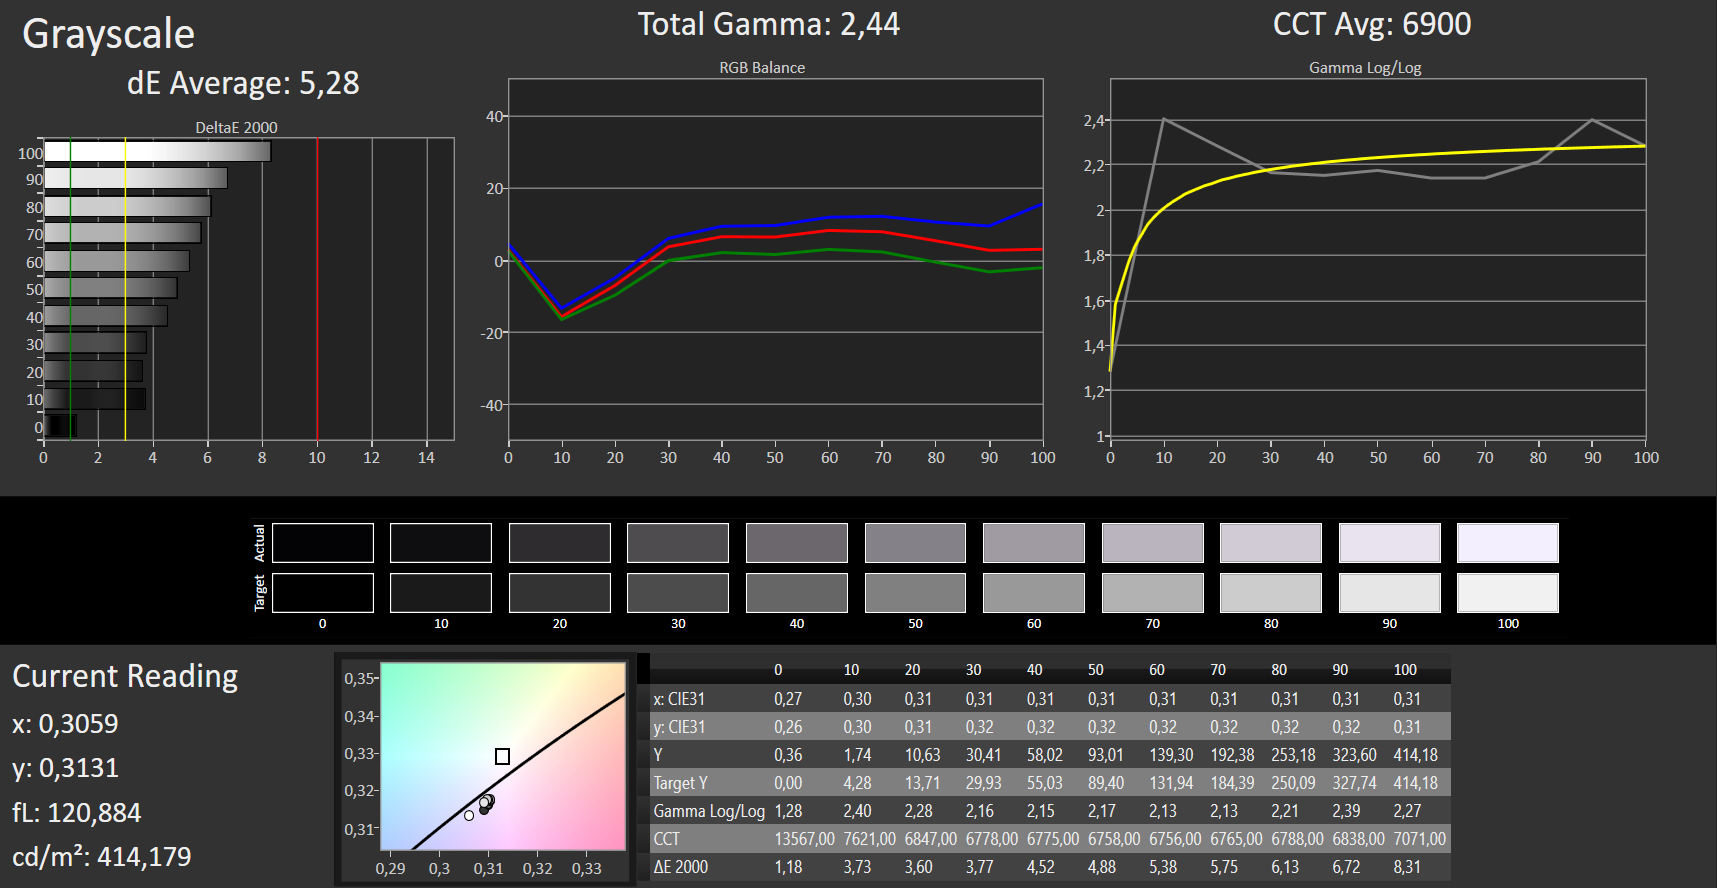
ΔE Greyscale Calman: 5.28 | ∀{0.09-98 Ø4.96}
84% sRGB (Argyll 1.6.3 3D)
55% AdobeRGB 1998 (Argyll 1.6.3 3D)
61.8% AdobeRGB 1998 (Argyll 3D)
84.5% sRGB (Argyll 3D)
66.5% Display P3 (Argyll 3D)
Gamma: 2.44
CCT: 6900 K
| Lenovo V320-17IKB 81AH0002GE IPS, 1920x1080, 17.3" | Acer Aspire E5-774-54HJ TN LED, 1920x1080, 17.3" | HP 17-x066ng IPS, 1920x1080, 17.3" | HP Pavilion 17-x110ng IPS, WLED, 1920x1080, 17.3" | |
|---|---|---|---|---|
| Display | 8% | 0% | 0% | |
| Display P3 Coverage (%) | 66.5 | 71.3 7% | 63.6 -4% | 63.6 -4% |
| sRGB Coverage (%) | 84.5 | 91.7 9% | 86.5 2% | 86.5 2% |
| AdobeRGB 1998 Coverage (%) | 61.8 | 67.1 9% | 63.3 2% | 63.3 2% |
| Response Times | -8% | -9% | -21% | |
| Response Time Grey 50% / Grey 80% * (ms) | 35 ? | 42 ? -20% | 38 ? -9% | 41 ? -17% |
| Response Time Black / White * (ms) | 24 ? | 23 ? 4% | 26 ? -8% | 30 ? -25% |
| PWM Frequency (Hz) | 119000 ? | 1000 ? | 200 ? | |
| Screen | -19% | -2% | -13% | |
| Brightness middle (cd/m²) | 412 | 353 -14% | 331 -20% | 288 -30% |
| Brightness (cd/m²) | 377 | 320 -15% | 310 -18% | 285 -24% |
| Brightness Distribution (%) | 83 | 82 -1% | 87 5% | 88 6% |
| Black Level * (cd/m²) | 0.39 | 0.38 3% | 0.33 15% | 0.61 -56% |
| Contrast (:1) | 1056 | 929 -12% | 1003 -5% | 472 -55% |
| Colorchecker dE 2000 * | 5.04 | 5.07 -1% | 4.58 9% | 4.56 10% |
| Colorchecker dE 2000 max. * | 8.84 | 10.12 -14% | 7.83 11% | 7.76 12% |
| Greyscale dE 2000 * | 5.28 | 13.38 -153% | 6.18 -17% | 4.95 6% |
| Gamma | 2.44 90% | 2.69 82% | 2.34 94% | 2.48 89% |
| CCT | 6900 94% | 15991 41% | 6076 107% | 7669 85% |
| Color Space (Percent of AdobeRGB 1998) (%) | 55 | 60.1 9% | 56 2% | |
| Color Space (Percent of sRGB) (%) | 84 | 91.6 9% | 86 2% | 93 11% |
| Média Total (Programa/Configurações) | -6% /
-12% | -4% /
-2% | -11% /
-12% |
* ... menor é melhor
Cintilação da tela / PWM (modulação por largura de pulso)
| Tela tremeluzindo/PWM detectado | 119000 Hz | ≤ 80 % configuração de brilho | 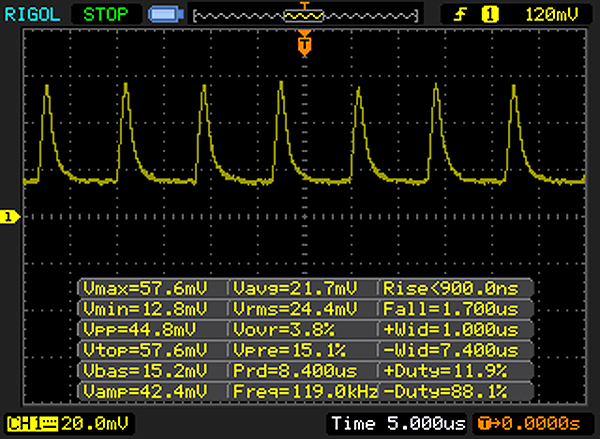 |
A luz de fundo da tela pisca em 119000 Hz (pior caso, por exemplo, utilizando PWM) Cintilação detectada em uma configuração de brilho de 80 % e abaixo. Não deve haver cintilação ou PWM acima desta configuração de brilho. A frequência de 119000 Hz é bastante alta, então a maioria dos usuários sensíveis ao PWM não deve notar nenhuma oscilação. [pwm_comparison] Em comparação: 52 % de todos os dispositivos testados não usam PWM para escurecer a tela. Se PWM foi detectado, uma média de 7744 (mínimo: 5 - máximo: 343500) Hz foi medida. | |||
Exibir tempos de resposta
| ↔ Tempo de resposta preto para branco | ||
|---|---|---|
| 24 ms ... ascensão ↗ e queda ↘ combinadas | ↗ 14 ms ascensão | 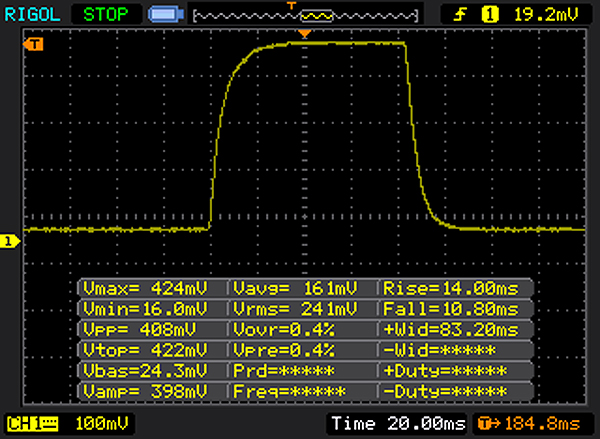 |
| ↘ 10 ms queda | ||
| A tela mostra boas taxas de resposta em nossos testes, mas pode ser muito lenta para jogadores competitivos. Em comparação, todos os dispositivos testados variam de 0.1 (mínimo) a 240 (máximo) ms. » 54 % de todos os dispositivos são melhores. Isso significa que o tempo de resposta medido é pior que a média de todos os dispositivos testados (19.8 ms). | ||
| ↔ Tempo de resposta 50% cinza a 80% cinza | ||
| 35 ms ... ascensão ↗ e queda ↘ combinadas | ↗ 18 ms ascensão | 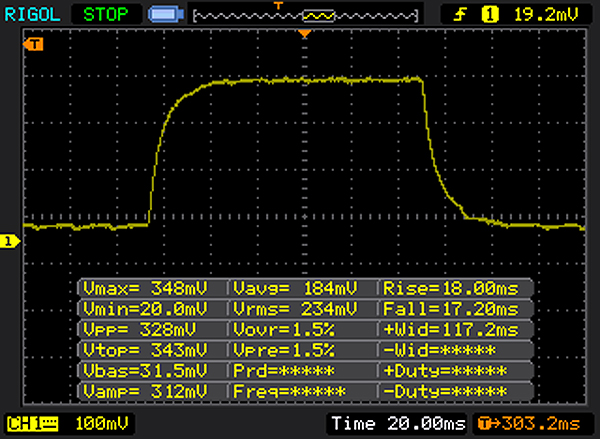 |
| ↘ 17 ms queda | ||
| A tela mostra taxas de resposta lentas em nossos testes e será insatisfatória para os jogadores. Em comparação, todos os dispositivos testados variam de 0.165 (mínimo) a 636 (máximo) ms. » 49 % de todos os dispositivos são melhores. Isso significa que o tempo de resposta medido é pior que a média de todos os dispositivos testados (30.9 ms). | ||


| Cinebench R15 | |
| CPU Single 64Bit | |
| HP Pavilion 17-x110ng | |
| Acer Aspire E5-774-54HJ | |
| Lenovo V320-17IKB 81AH0002GE | |
| HP 17-x066ng | |
| CPU Multi 64Bit | |
| HP Pavilion 17-x110ng | |
| Lenovo V320-17IKB 81AH0002GE | |
| Acer Aspire E5-774-54HJ | |
| HP 17-x066ng | |
| Cinebench R11.5 | |
| CPU Multi 64Bit | |
| HP Pavilion 17-x110ng | |
| Lenovo V320-17IKB 81AH0002GE | |
| CPU Single 64Bit | |
| HP Pavilion 17-x110ng | |
| Lenovo V320-17IKB 81AH0002GE | |
| Cinebench R10 | |
| Rendering Multiple CPUs 32Bit | |
| Acer Aspire E5-774-54HJ | |
| HP Pavilion 17-x110ng | |
| Lenovo V320-17IKB 81AH0002GE | |
| Rendering Single 32Bit | |
| HP Pavilion 17-x110ng | |
| Acer Aspire E5-774-54HJ | |
| Lenovo V320-17IKB 81AH0002GE | |
| Geekbench 3 | |
| 32 Bit Multi-Core Score | |
| Lenovo V320-17IKB 81AH0002GE | |
| Acer Aspire E5-774-54HJ | |
| 32 Bit Single-Core Score | |
| Lenovo V320-17IKB 81AH0002GE | |
| Acer Aspire E5-774-54HJ | |
| Geekbench 4.0 | |
| 64 Bit Multi-Core Score | |
| Lenovo V320-17IKB 81AH0002GE | |
| Acer Aspire E5-774-54HJ | |
| 64 Bit Single-Core Score | |
| Lenovo V320-17IKB 81AH0002GE | |
| Acer Aspire E5-774-54HJ | |
| Geekbench 4.4 | |
| 64 Bit Multi-Core Score | |
| Lenovo V320-17IKB 81AH0002GE | |
| 64 Bit Single-Core Score | |
| Lenovo V320-17IKB 81AH0002GE | |
| JetStream 1.1 - 1.1 Total | |
| Lenovo V320-17IKB 81AH0002GE | |
| HP Pavilion 17-x110ng | |
| Acer Aspire E5-774-54HJ | |
| Mozilla Kraken 1.1 - Total | |
| Lenovo V320-17IKB 81AH0002GE | |
| HP Pavilion 17-x110ng | |
| Octane V2 - Total Score | |
| HP Pavilion 17-x110ng | |
| Lenovo V320-17IKB 81AH0002GE | |
* ... menor é melhor
| PCMark 7 Score | 5479 pontos | |
| PCMark 8 Home Score Accelerated v2 | 3820 pontos | |
| PCMark 8 Creative Score Accelerated v2 | 4587 pontos | |
| PCMark 8 Work Score Accelerated v2 | 4706 pontos | |
| PCMark 10 Score | 3285 pontos | |
Ajuda | ||
| PCMark 8 - Home Score Accelerated v2 | |
| Lenovo V320-17IKB 81AH0002GE | |
| HP Pavilion 17-x110ng | |
| Acer Aspire E5-774-54HJ | |
| HP 17-x066ng | |

| Lenovo V320-17IKB 81AH0002GE SK Hynix HFS256G3BTND | Acer Aspire E5-774-54HJ Western Digital Scorpio Blue WD5000LPCX-24C6HT0 | HP 17-x066ng WDC WD10JPVX-08JC3T5 | HP Pavilion 17-x110ng SanDisk Z400s SD8SNAT-256G | |
|---|---|---|---|---|
| CrystalDiskMark 3.0 | -90% | -89% | -7% | |
| Read Seq (MB/s) | 473.7 | 88.9 -81% | 98.6 -79% | 500 6% |
| Write Seq (MB/s) | 260.8 | 70.9 -73% | 98.2 -62% | 325.1 25% |
| Read 512 (MB/s) | 337 | 33.01 -90% | 33.8 -90% | 290.2 -14% |
| Write 512 (MB/s) | 263.3 | 51.6 -80% | 45.98 -83% | 300.3 14% |
| Read 4k (MB/s) | 29.41 | 0.381 -99% | 0.395 -99% | 11.24 -62% |
| Write 4k (MB/s) | 73.3 | 1.117 -98% | 0.96 -99% | 86 17% |
| Read 4k QD32 (MB/s) | 298.3 | 0.891 -100% | 1.039 -100% | 145.4 -51% |
| Write 4k QD32 (MB/s) | 242.5 | 1.13 -100% | 0.959 -100% | 272.7 12% |
| 3DMark 06 Standard Score | 10189 pontos | |
| 3DMark 11 Performance | 1703 pontos | |
| 3DMark Ice Storm Standard Score | 65525 pontos | |
| 3DMark Cloud Gate Standard Score | 6489 pontos | |
| 3DMark Fire Strike Score | 935 pontos | |
| 3DMark Time Spy Score | 378 pontos | |
Ajuda | ||
| 3DMark 11 - 1280x720 Performance GPU | |
| Acer Aspire E5-774G-78NA | |
| HP Pavilion 17-x110ng | |
| Lenovo Ideapad 110-17IKB 80VK0001GE | |
| Lenovo V320-17IKB 81AH0002GE | |
| HP 17-y044ng | |
| Acer Aspire E5-774-54HJ | |
| HP 17-x066ng | |
| 3DMark | |
| 1280x720 Cloud Gate Standard Graphics | |
| Acer Aspire E5-774G-78NA | |
| Lenovo V320-17IKB 81AH0002GE | |
| HP Pavilion 17-x110ng | |
| 1920x1080 Fire Strike Graphics | |
| Acer Aspire E5-774G-78NA | |
| HP Pavilion 17-x110ng | |
| Lenovo V320-17IKB 81AH0002GE | |
| baixo | média | alto | ultra | |
|---|---|---|---|---|
| Tomb Raider (2013) | 87.3 | 44 | 26.9 | 12.5 |
| BioShock Infinite (2013) | 56.5 | 32.5 | 26.5 | 9 |
| Rise of the Tomb Raider (2016) | 19 | 11.8 | 6.4 | 4.3 |
| Mass Effect Andromeda (2017) | 15.6 | 6.4 | ||
| Prey (2017) | 27.8 | 11.6 | 9.2 | |
| Dirt 4 (2017) | 44.8 | 12.4 | 9.9 | |
| Team Fortress 2 (2017) | 76.7 | 71 | 40 | 18 |
| F1 2017 (2017) | 31 | 13 | 13 |
Barulho
| Ocioso |
| 30.5 / 30.5 / 30.5 dB |
| Carga |
| 35 / 35.8 dB |
 | ||
30 dB silencioso 40 dB(A) audível 50 dB(A) ruidosamente alto |
||
min: | ||
| Lenovo V320-17IKB 81AH0002GE i5-7200U, HD Graphics 620 | Acer Aspire E5-774-54HJ i5-7200U, HD Graphics 620 | HP 17-x066ng 6006U, HD Graphics 520 | HP Pavilion 17-x110ng i5-7200U, Radeon R7 M440 | |
|---|---|---|---|---|
| Noise | 2% | -1% | -4% | |
| desligado / ambiente * (dB) | 30 | 30.5 -2% | 30.6 -2% | 29 3% |
| Idle Minimum * (dB) | 30.5 | 30.8 -1% | 32.7 -7% | 31 -2% |
| Idle Average * (dB) | 30.5 | 30.8 -1% | 32.7 -7% | 31 -2% |
| Idle Maximum * (dB) | 30.5 | 30.8 -1% | 32.7 -7% | 31 -2% |
| Load Average * (dB) | 35 | 32.1 8% | 33 6% | 33.8 3% |
| Load Maximum * (dB) | 35.8 | 33.8 6% | 32.7 9% | 44.8 -25% |
* ... menor é melhor
(+) A temperatura máxima no lado superior é 37.3 °C / 99 F, em comparação com a média de 34.3 °C / 94 F , variando de 21.2 a 62.5 °C para a classe Office.
(+) A parte inferior aquece até um máximo de 37 °C / 99 F, em comparação com a média de 36.8 °C / 98 F
(+) Em uso inativo, a temperatura média para o lado superior é 27.2 °C / 81 F, em comparação com a média do dispositivo de 29.5 °C / ### class_avg_f### F.
(+) Os apoios para as mãos e o touchpad são mais frios que a temperatura da pele, com um máximo de 31.6 °C / 88.9 F e, portanto, são frios ao toque.
(-) A temperatura média da área do apoio para as mãos de dispositivos semelhantes foi 27.6 °C / 81.7 F (-4 °C / -7.2 F).
| Lenovo V320-17IKB 81AH0002GE i5-7200U, HD Graphics 620 | Acer Aspire E5-774-54HJ i5-7200U, HD Graphics 620 | HP 17-x066ng 6006U, HD Graphics 520 | HP Pavilion 17-x110ng i5-7200U, Radeon R7 M440 | |
|---|---|---|---|---|
| Heat | 14% | 5% | 2% | |
| Maximum Upper Side * (°C) | 37.3 | 30.4 18% | 36.5 2% | 40.3 -8% |
| Maximum Bottom * (°C) | 37 | 30.6 17% | 37.2 -1% | 46.1 -25% |
| Idle Upper Side * (°C) | 28.7 | 26.7 7% | 26 9% | 23.8 17% |
| Idle Bottom * (°C) | 30.1 | 26 14% | 27.1 10% | 23.4 22% |
* ... menor é melhor
Lenovo V320-17IKB 81AH0002GE análise de áudio
(-) | alto-falantes não muito altos (###valor### dB)
Graves 100 - 315Hz
(±) | graves reduzidos - em média 8.4% menor que a mediana
(±) | a linearidade dos graves é média (13.3% delta para a frequência anterior)
Médios 400 - 2.000 Hz
(+) | médios equilibrados - apenas 1.9% longe da mediana
(+) | médios são lineares (6.3% delta para frequência anterior)
Altos 2 - 16 kHz
(+) | agudos equilibrados - apenas 3.5% longe da mediana
(+) | os máximos são lineares (5.8% delta da frequência anterior)
Geral 100 - 16.000 Hz
(+) | o som geral é linear (13.7% diferença em relação à mediana)
Comparado com a mesma classe
» 9% de todos os dispositivos testados nesta classe foram melhores, 4% semelhantes, 88% piores
» O melhor teve um delta de 7%, a média foi 21%, o pior foi 53%
Comparado com todos os dispositivos testados
» 15% de todos os dispositivos testados foram melhores, 4% semelhantes, 81% piores
» O melhor teve um delta de 4%, a média foi 23%, o pior foi 134%
Apple MacBook 12 (Early 2016) 1.1 GHz análise de áudio
(+) | os alto-falantes podem tocar relativamente alto (###valor### dB)
Graves 100 - 315Hz
(±) | graves reduzidos - em média 11.3% menor que a mediana
(±) | a linearidade dos graves é média (14.2% delta para a frequência anterior)
Médios 400 - 2.000 Hz
(+) | médios equilibrados - apenas 2.4% longe da mediana
(+) | médios são lineares (5.5% delta para frequência anterior)
Altos 2 - 16 kHz
(+) | agudos equilibrados - apenas 2% longe da mediana
(+) | os máximos são lineares (4.5% delta da frequência anterior)
Geral 100 - 16.000 Hz
(+) | o som geral é linear (10.2% diferença em relação à mediana)
Comparado com a mesma classe
» 7% de todos os dispositivos testados nesta classe foram melhores, 2% semelhantes, 90% piores
» O melhor teve um delta de 5%, a média foi 18%, o pior foi 53%
Comparado com todos os dispositivos testados
» 5% de todos os dispositivos testados foram melhores, 1% semelhantes, 94% piores
» O melhor teve um delta de 4%, a média foi 23%, o pior foi 134%
| desligado | |
| Ocioso | |
| Carga |
|
Key:
min: | |
| Lenovo V320-17IKB 81AH0002GE i5-7200U, HD Graphics 620 | Acer Aspire E5-774-54HJ i5-7200U, HD Graphics 620 | HP 17-x066ng 6006U, HD Graphics 520 | HP Pavilion 17-x110ng i5-7200U, Radeon R7 M440 | |
|---|---|---|---|---|
| Power Consumption | -10% | -8% | -50% | |
| Idle Minimum * (Watt) | 3.8 | 5.3 -39% | 5.5 -45% | 7.7 -103% |
| Idle Average * (Watt) | 9.6 | 10.1 -5% | 9.9 -3% | 14 -46% |
| Idle Maximum * (Watt) | 10.4 | 10.5 -1% | 14.6 -40% | 15.1 -45% |
| Load Average * (Watt) | 35.4 | 34.3 3% | 28 21% | 33 7% |
| Load Maximum * (Watt) | 34 | 37 -9% | 24.6 28% | 54.6 -61% |
* ... menor é melhor
| Lenovo V320-17IKB 81AH0002GE i5-7200U, HD Graphics 620, 35 Wh | Acer Aspire E5-774-54HJ i5-7200U, HD Graphics 620, 41 Wh | HP 17-x066ng 6006U, HD Graphics 520, 41.5 Wh | HP Pavilion 17-x110ng i5-7200U, Radeon R7 M440, 41 Wh | |
|---|---|---|---|---|
| Duração da bateria | 6% | 26% | 0% | |
| Reader / Idle (h) | 12.7 | 8.8 -31% | ||
| H.264 (h) | 4.8 | 4.8 0% | ||
| WiFi v1.3 (h) | 5 | 5.3 6% | 6.3 26% | 5.8 16% |
| Load (h) | 1.3 | 1.5 15% |
Pro
Contra
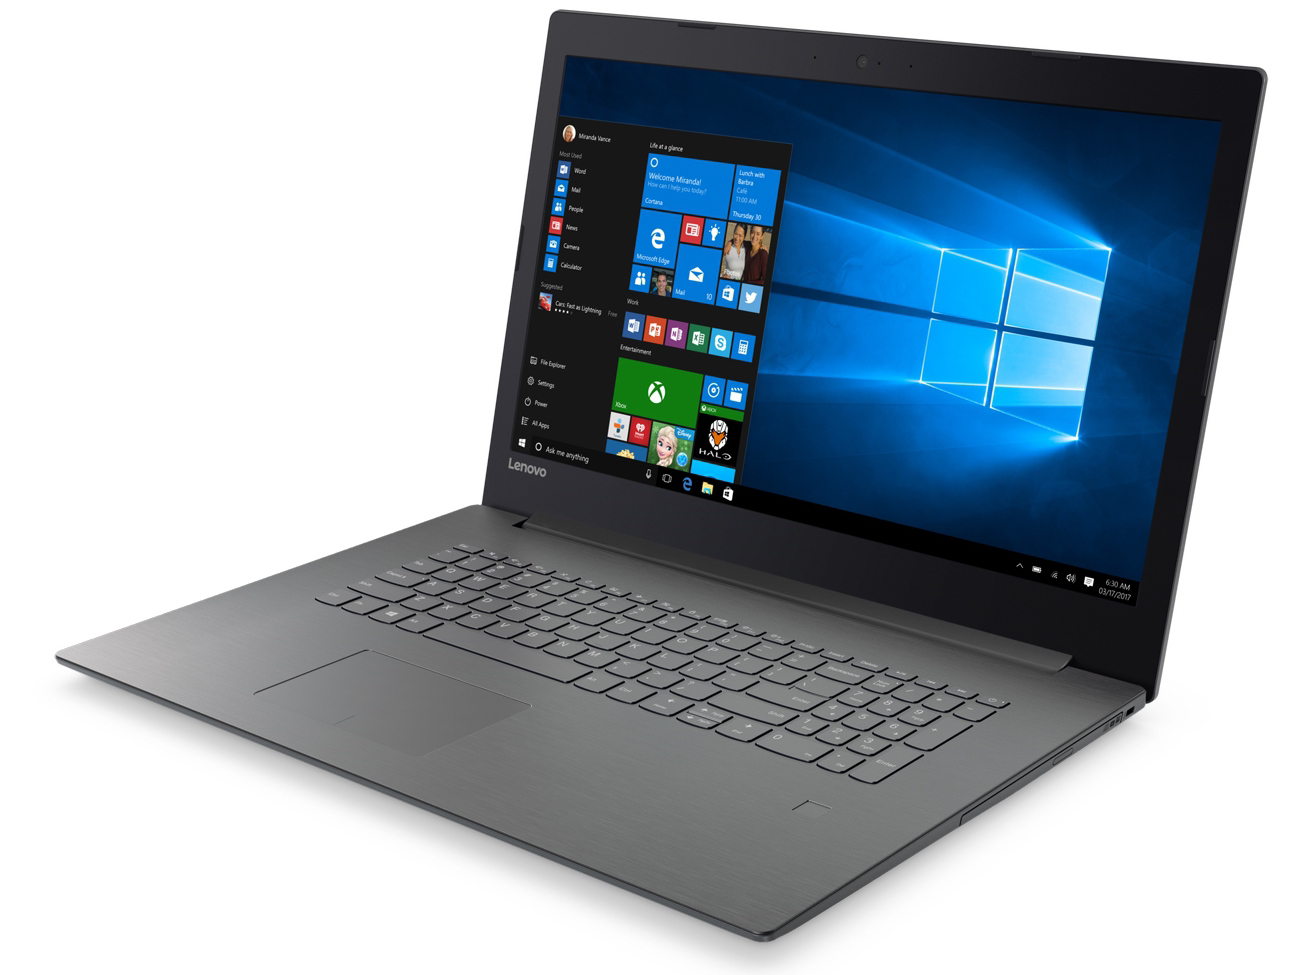
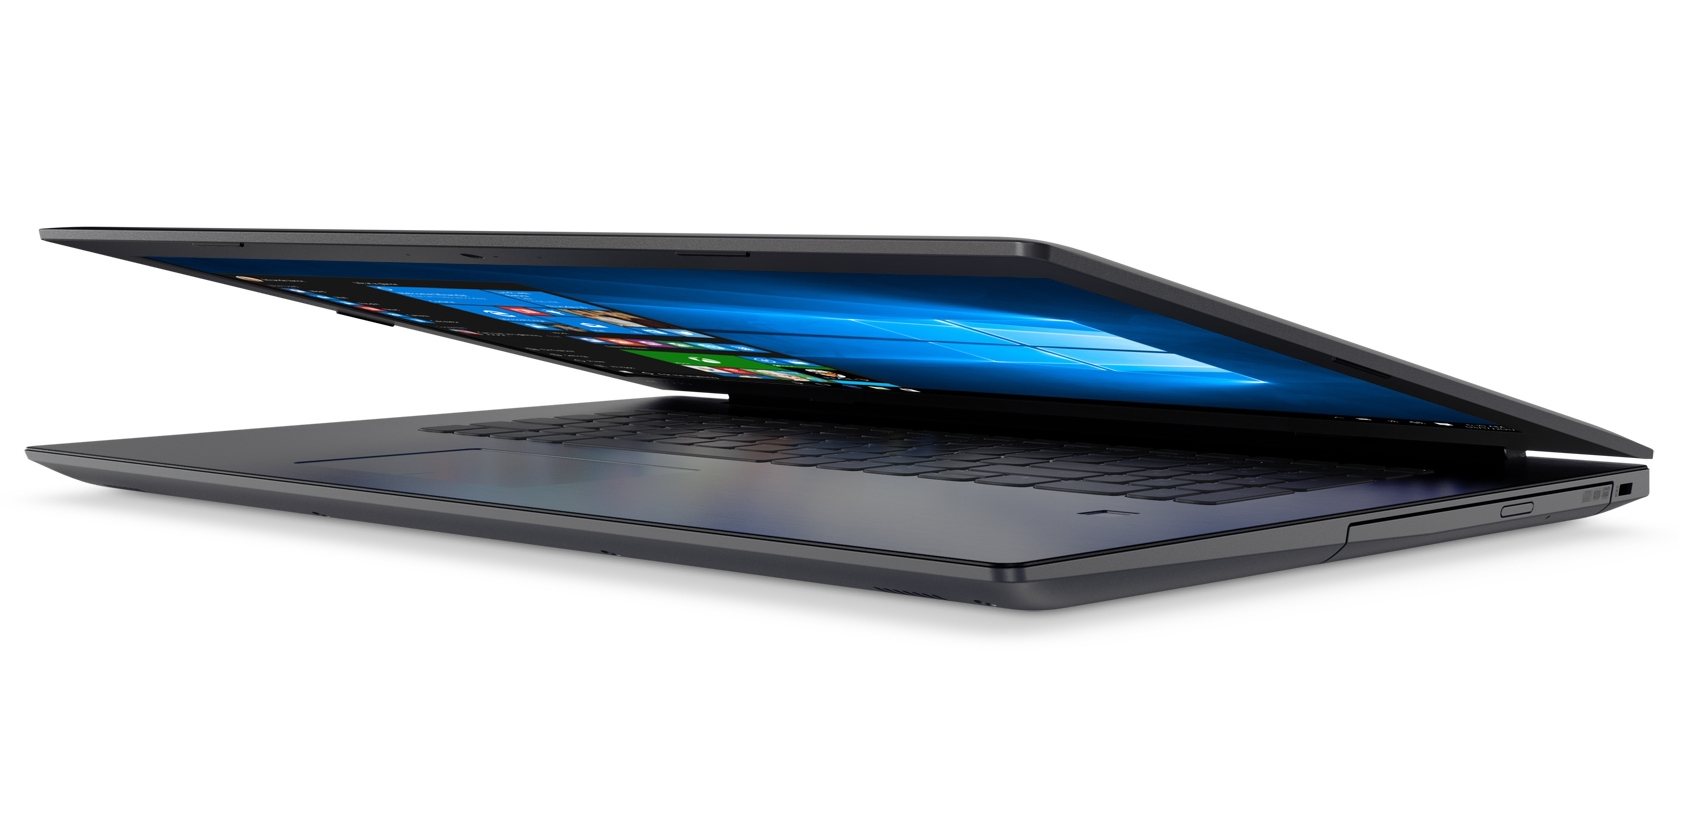
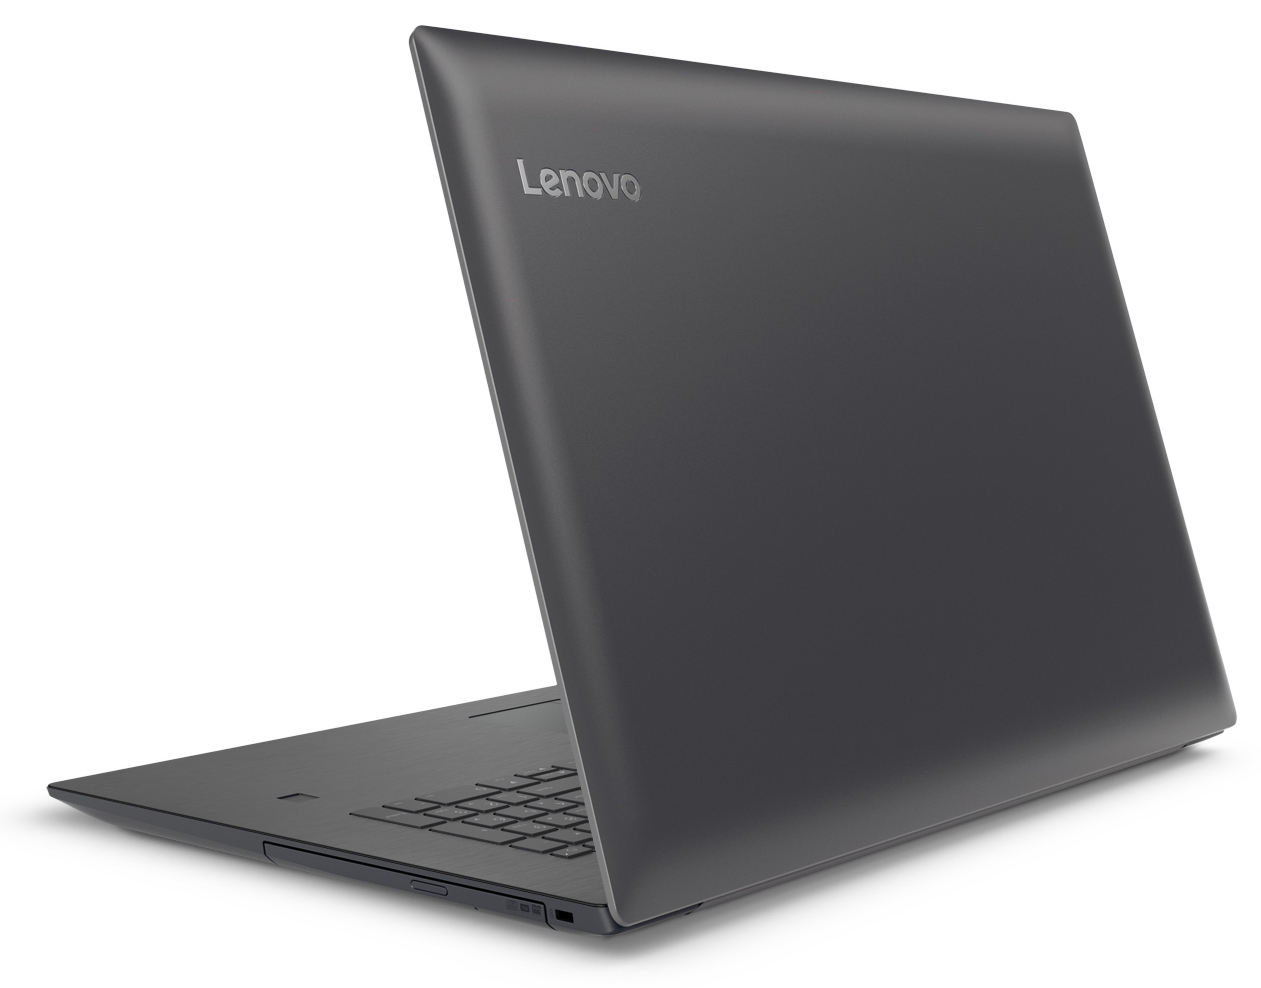
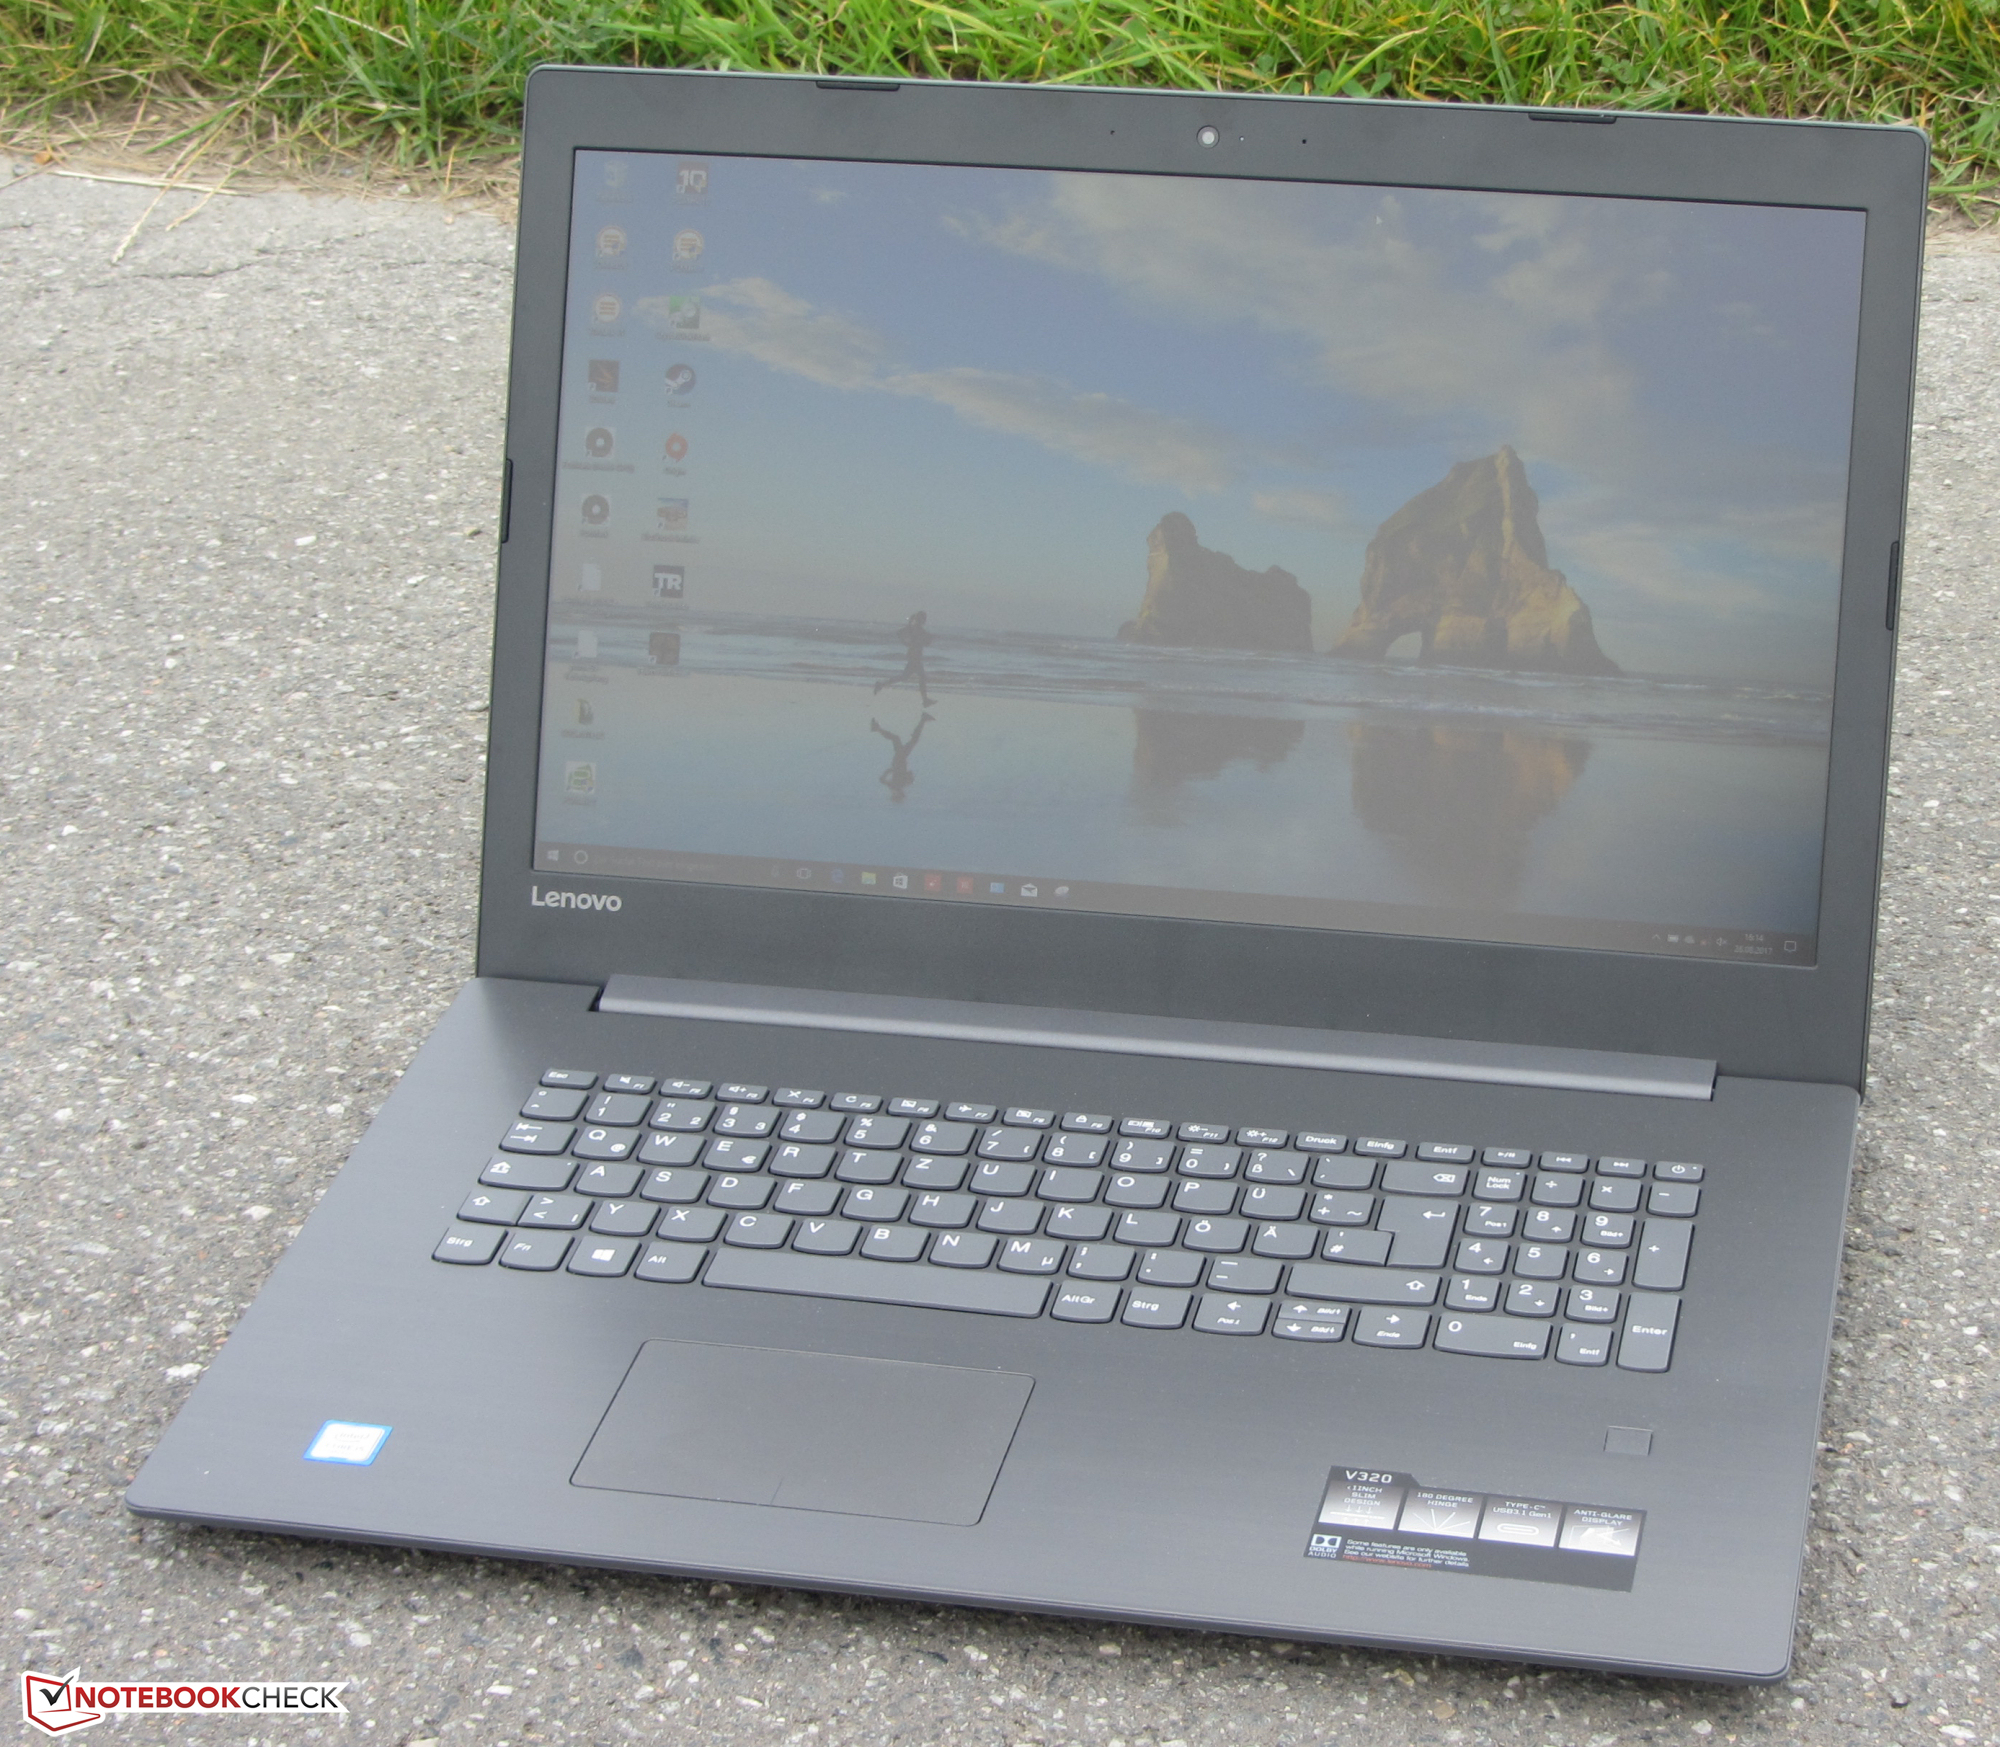
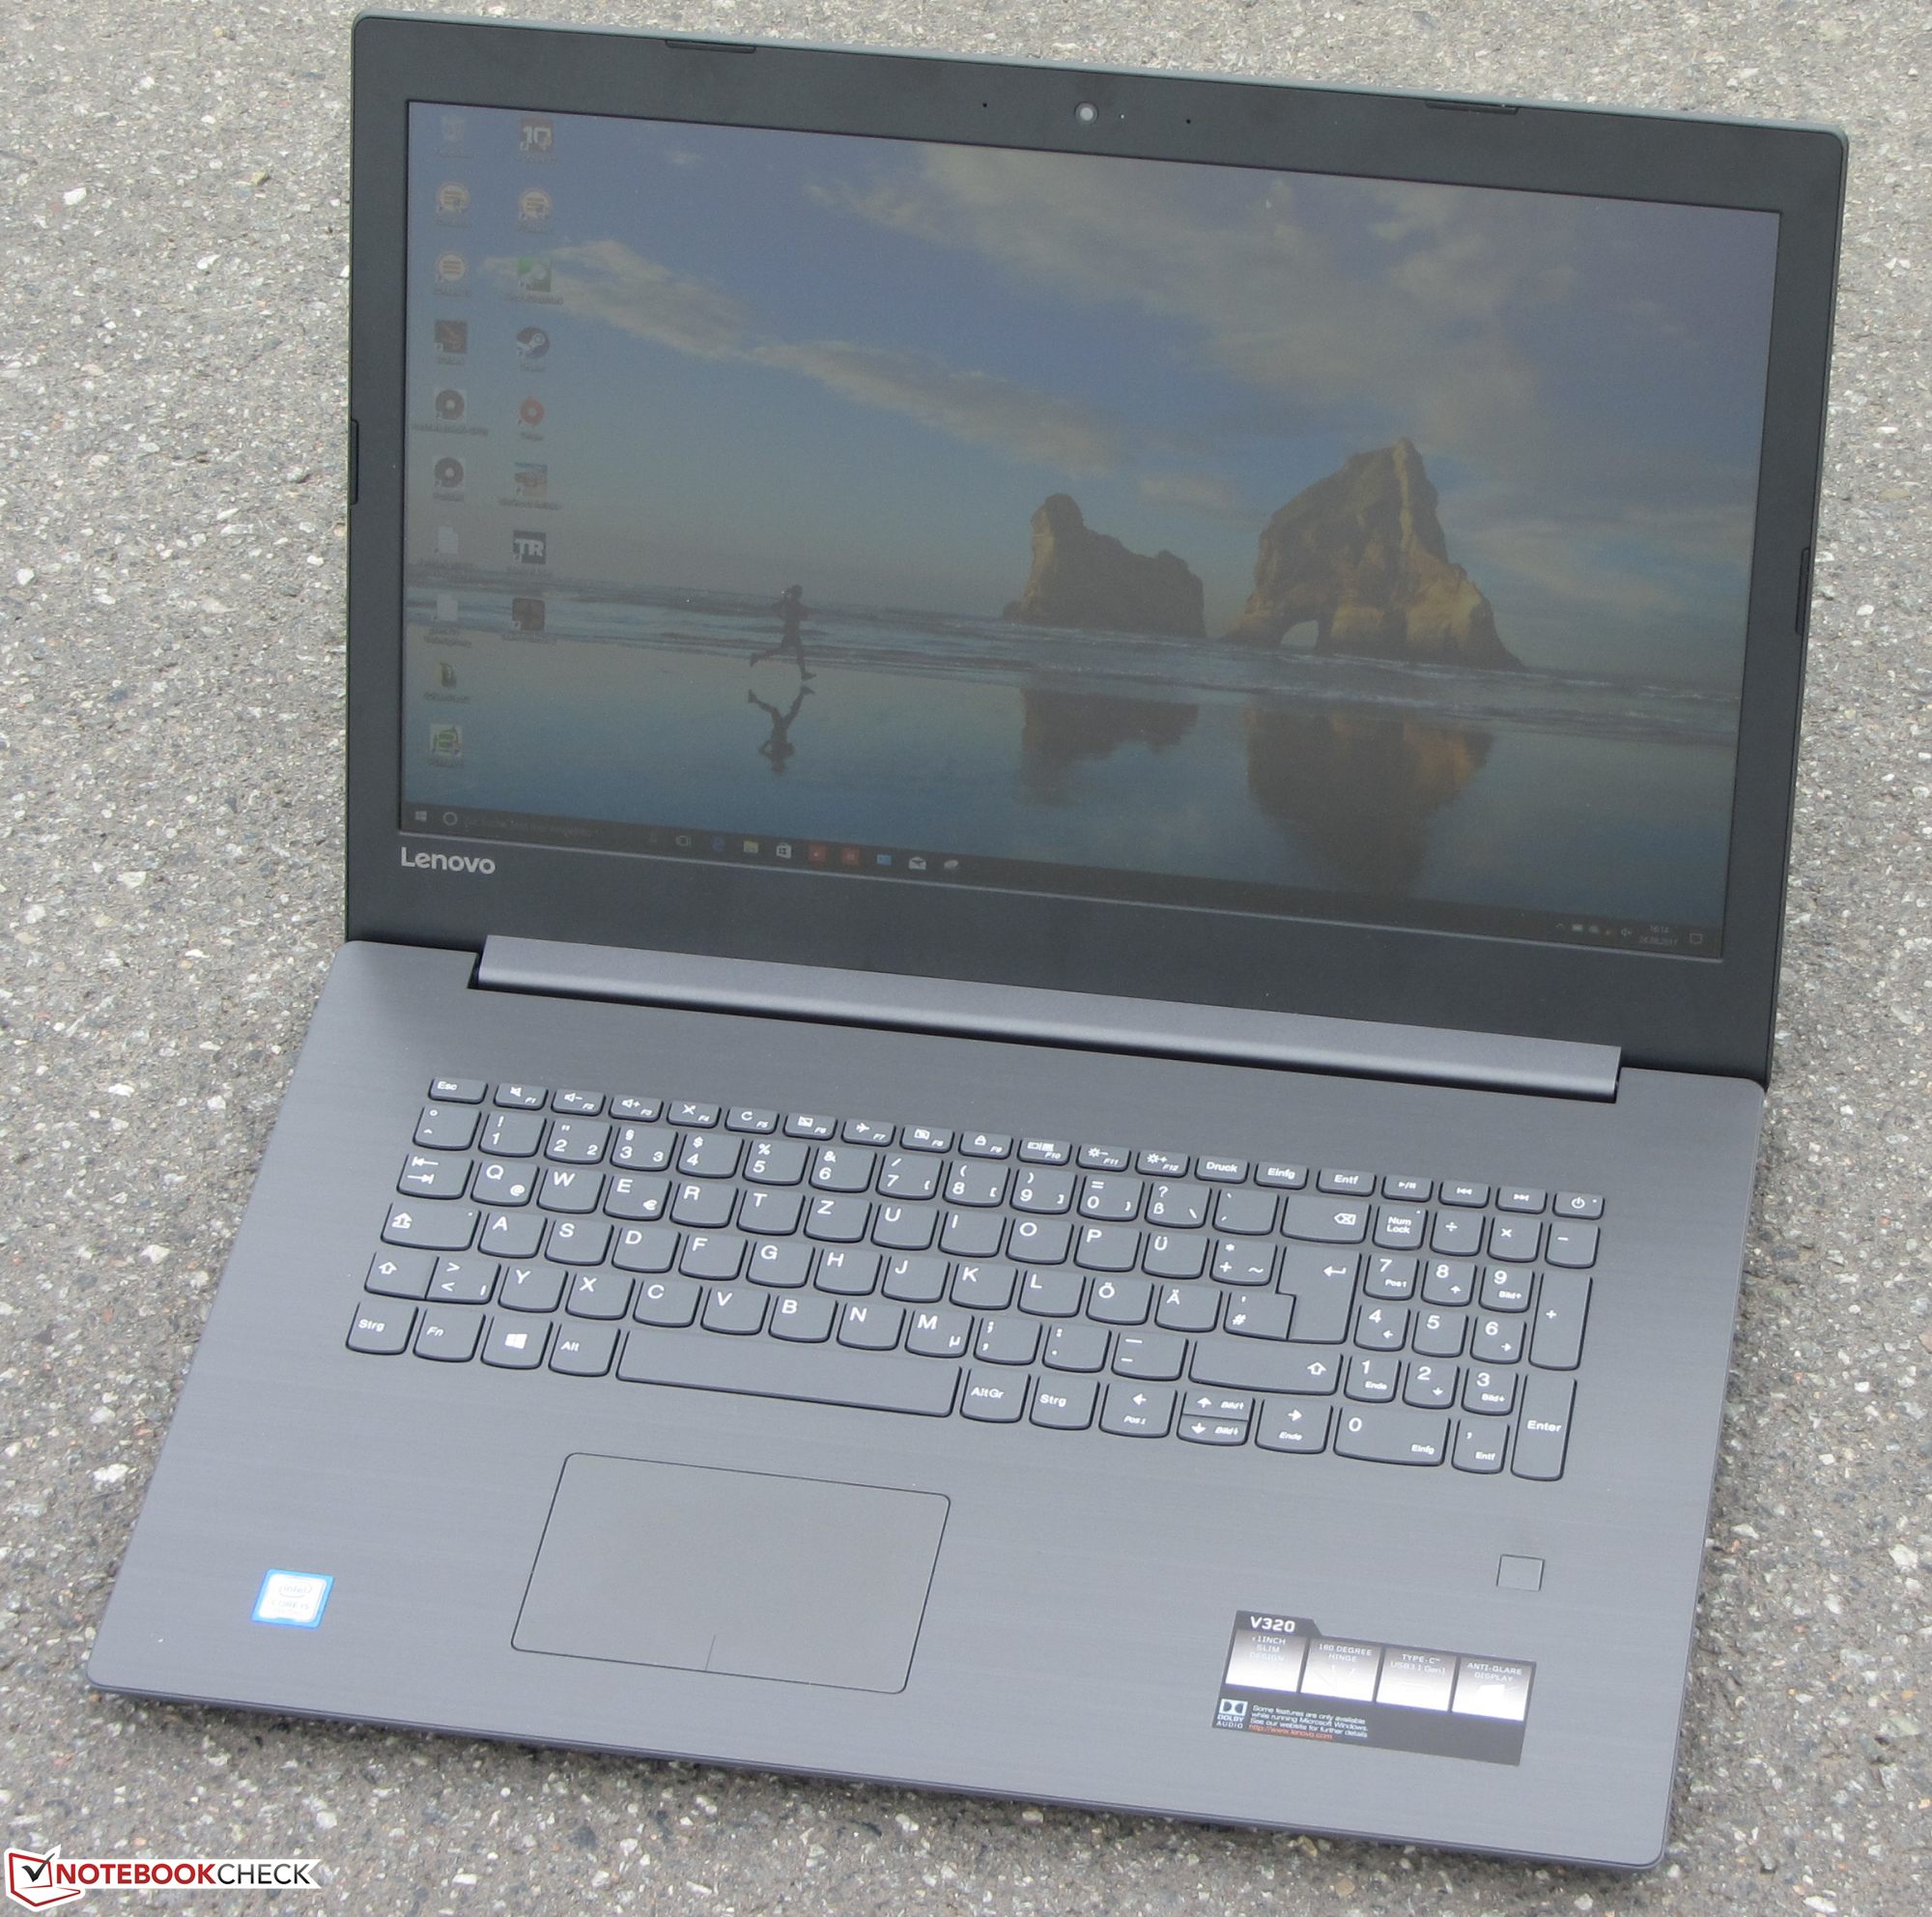
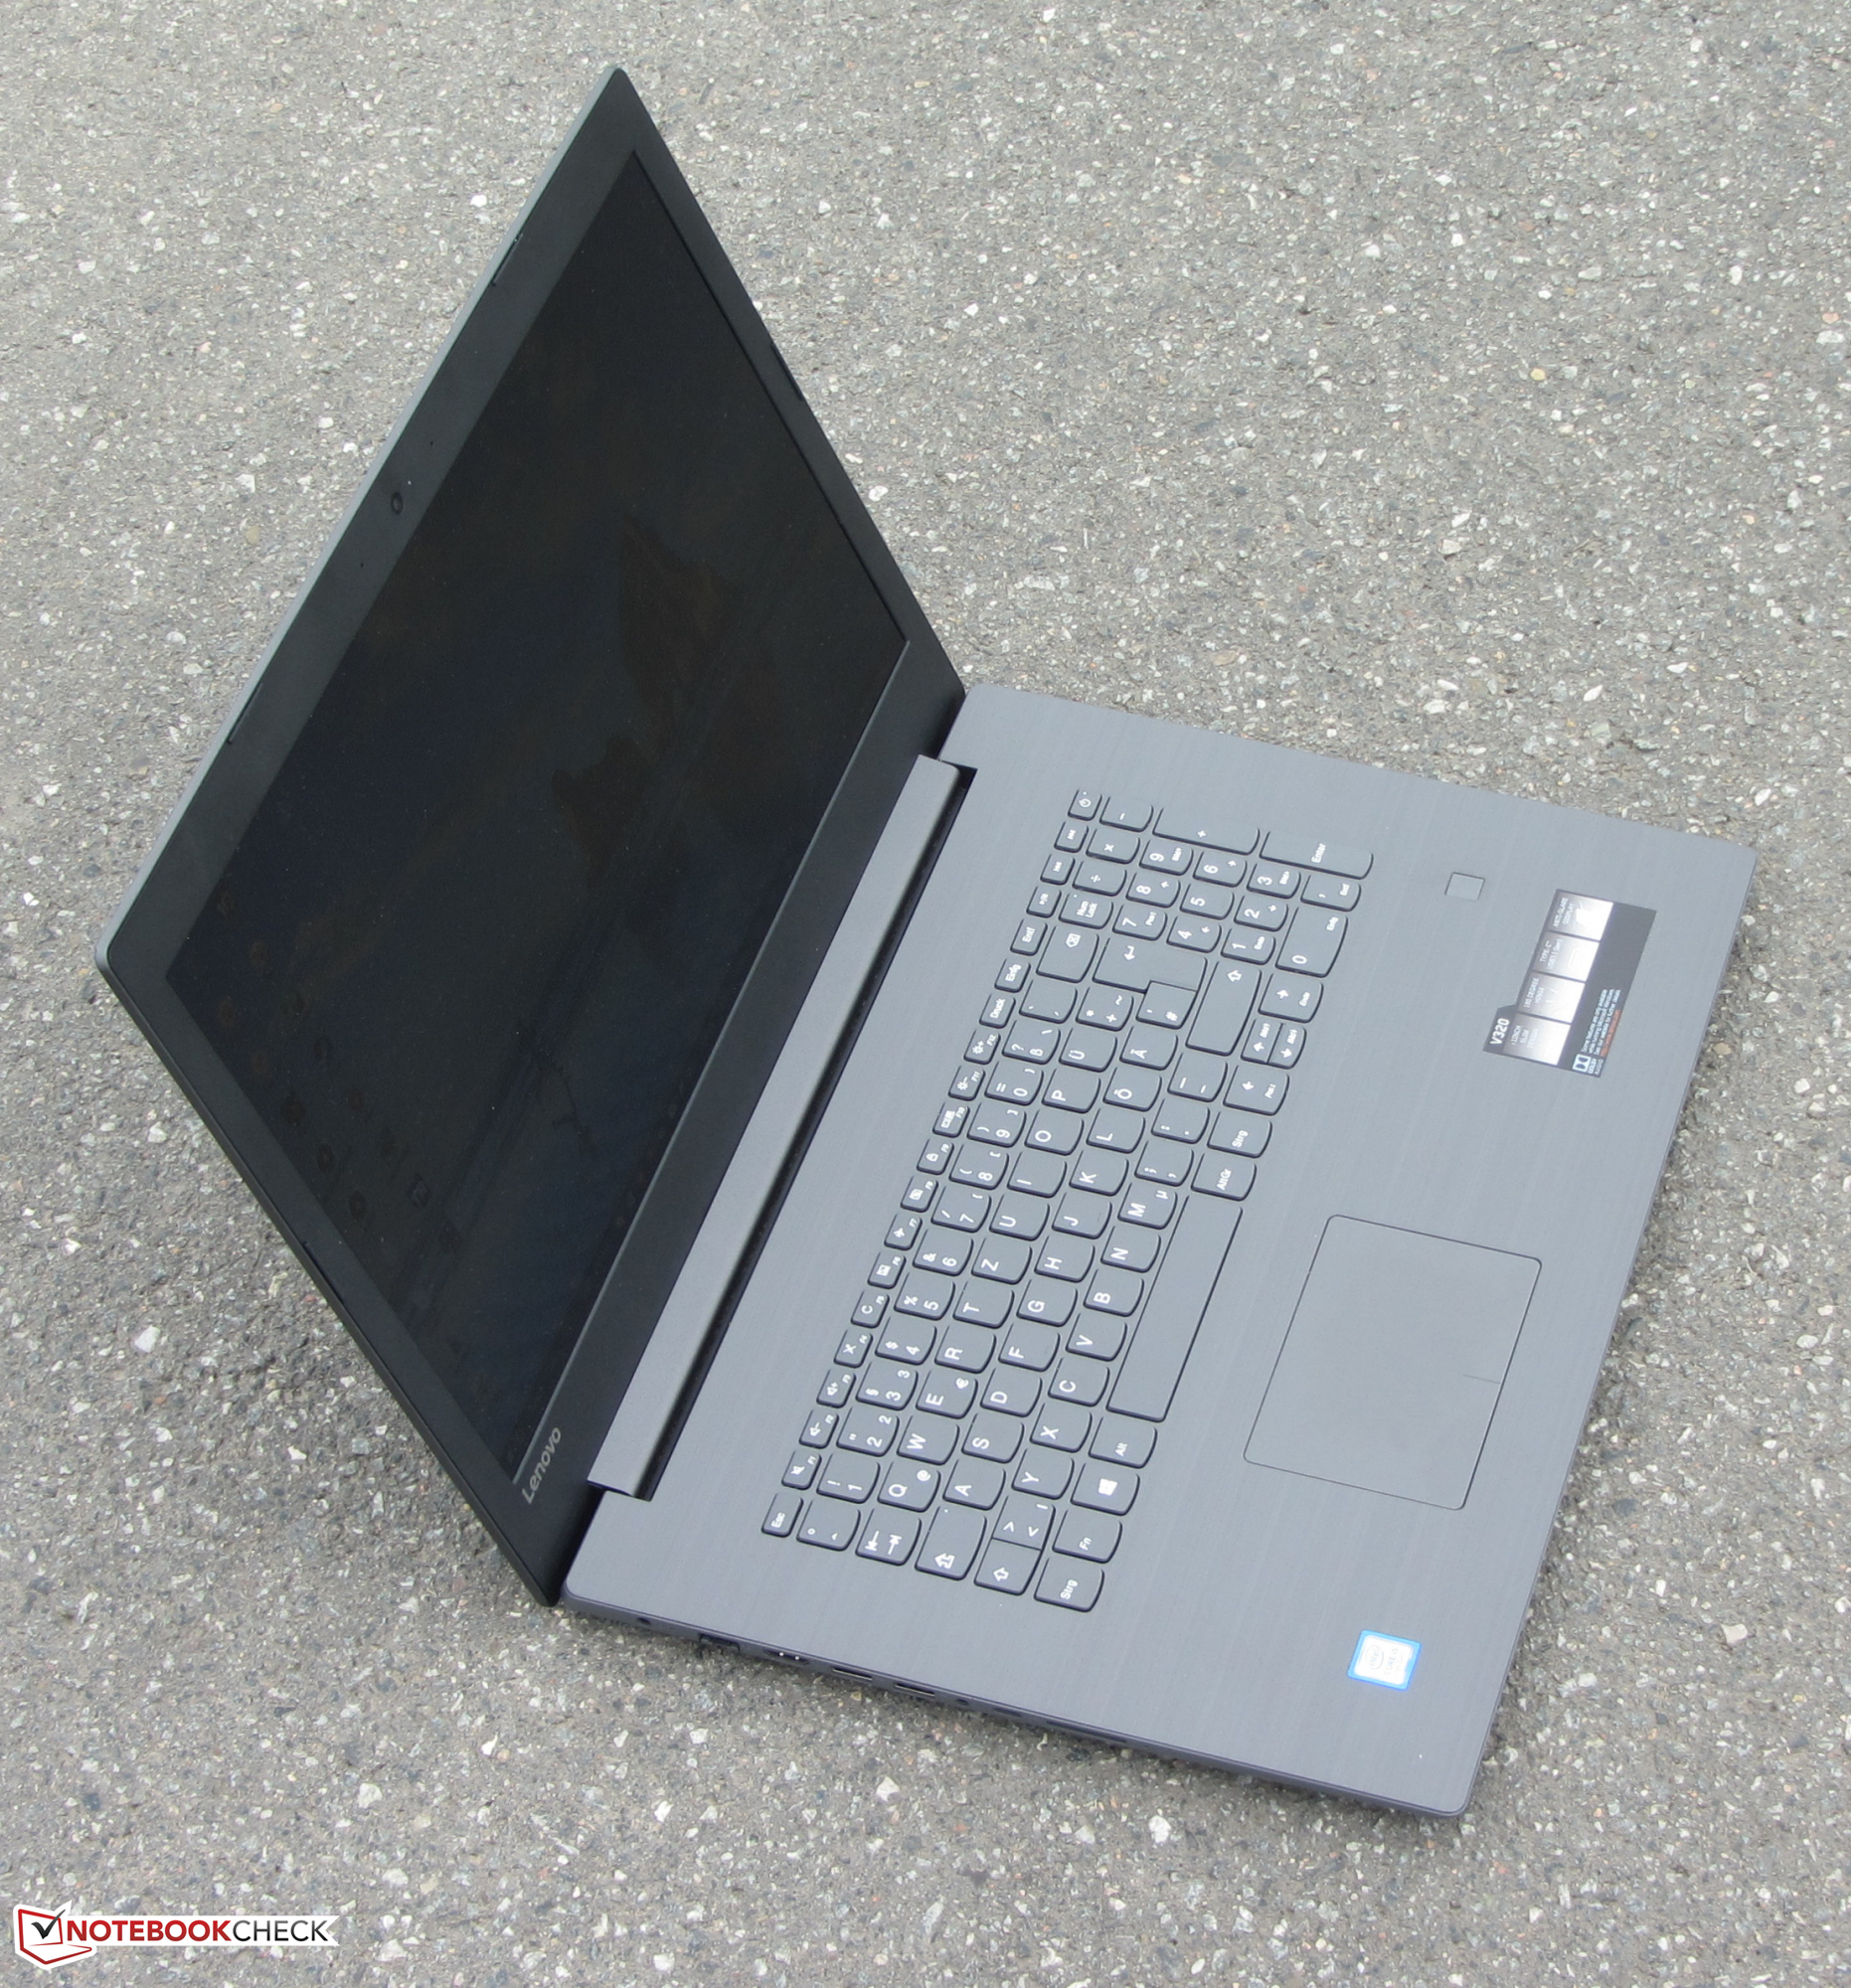
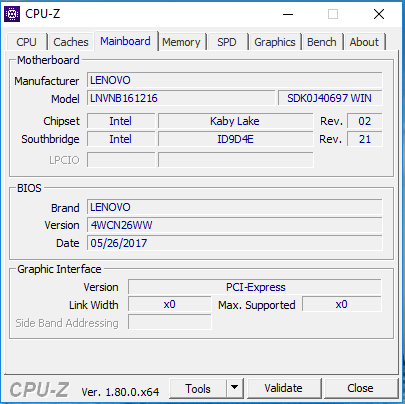
A Lenovo criou um portátil de escritório de 17,3 polegadas, destinado principalmente para freelancers e pequenas empresas. Mas também pode atrair usuários particulares com seu processador Kaby Lake que oferece poder de processamento suficiente para todas as áreas de aplicação. O aparelho não esquenta e geralmente funciona silenciosamente.
O Lenovo V320-17IKB é um portátil de escritório bem feito de 17,3 polegadas, adequado para trabalhar em casa.
O aparelho está equipado com um SSD rápido, que permite um desempenho rápido do sistema. É possível trocar o SSD, embora a carcaça precise ser aberta, pois o aparelho não possui uma escotilha de manutenção.
A tela é surpreendentemente boa: o modelo IPS mate oferece alto brilho, uma boa relação de contraste e ângulos de visão estáveis. Vimos telas piores em aparelhos similares.
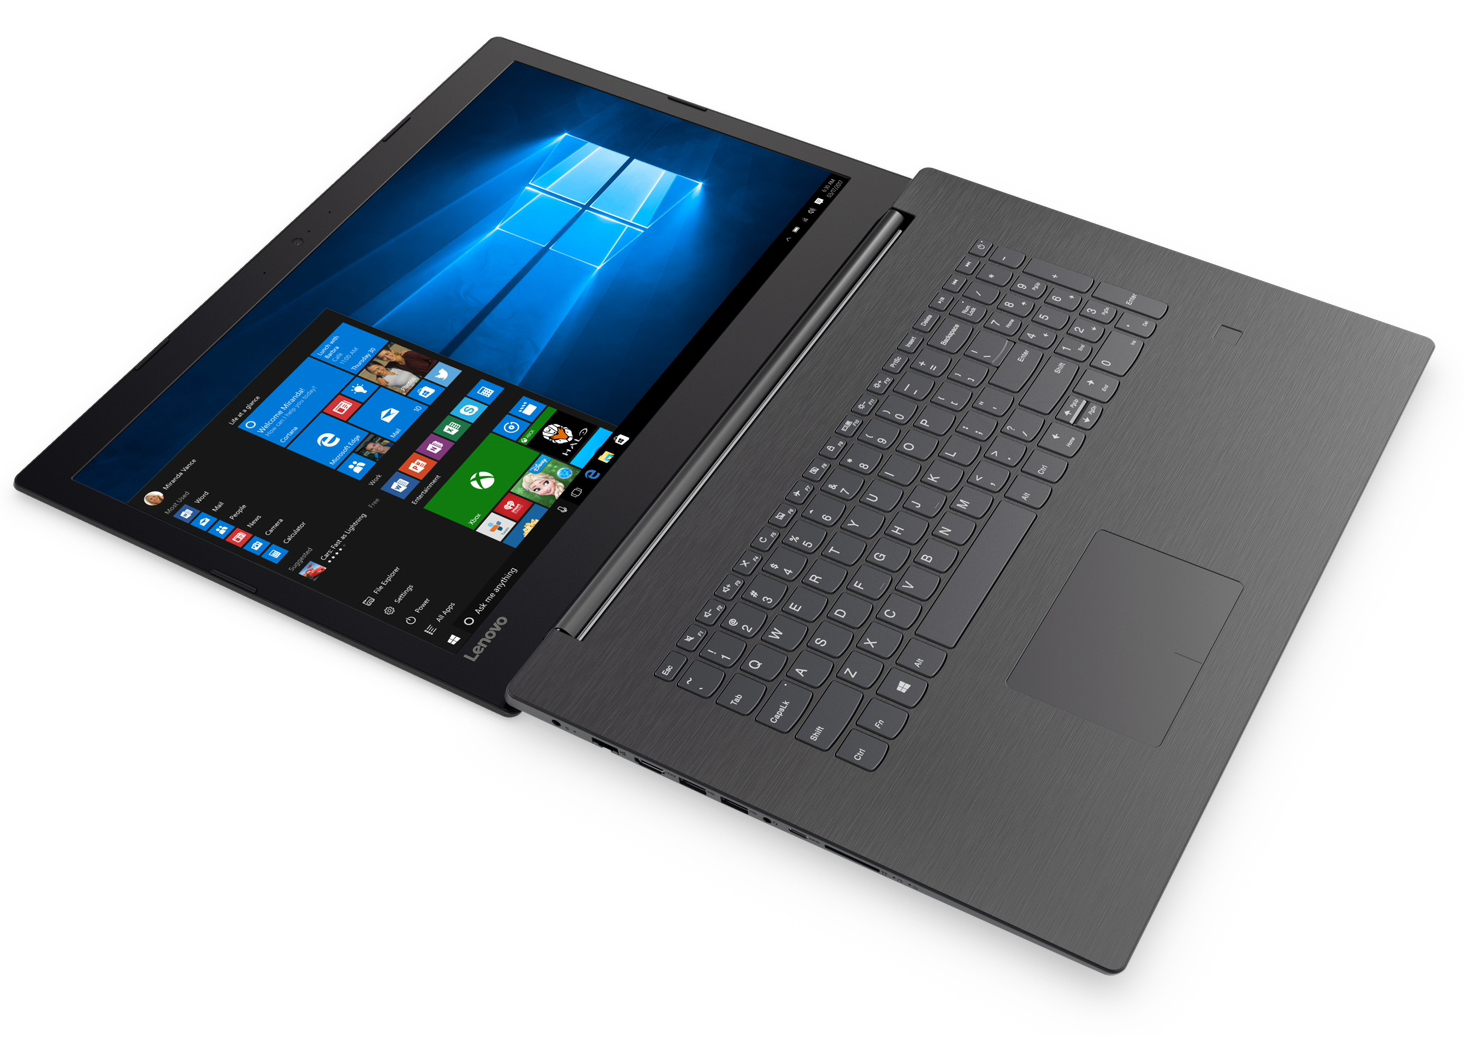
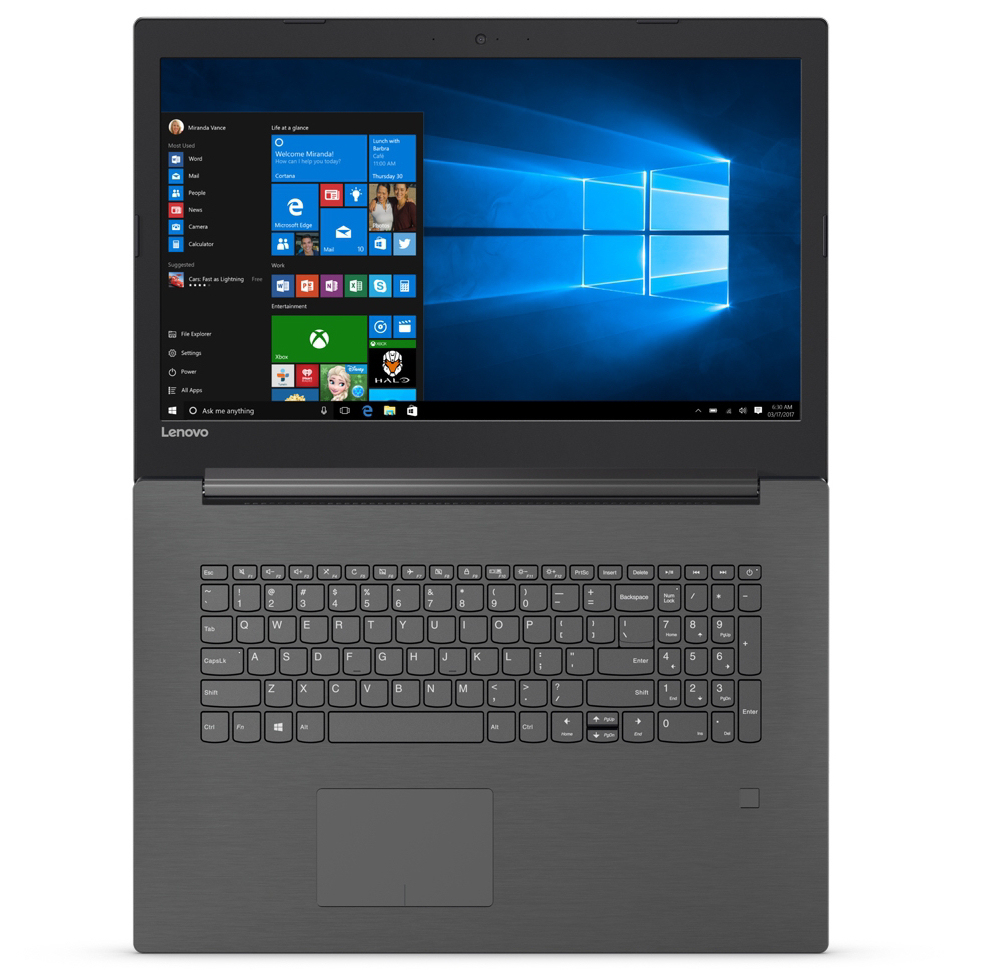
O teclado nos deu uma impressão muito boa e é adequado para digitação regular. NO entanto, sentimos falta da iluminação do teclado. Isso deveria ser obrigatório para um portátil de escritório desta faixa de preços. O preço comparativamente alto de cerca de 720 € (~$860) é devido ao sistema operacional Windows 10 Pro. Os usuários que poderiam ficar sem a versão Pro podem encontrar uma opção mais barata entre a série Ideapad V320 17IKB com a mesma compilação.
Só havia uma coisa a criticar: a garantia de um ano. O padrão hoje em dia seria de dois anos, mas, por sorte, não é muito caro expandir a garantia para este aparelho Lenovo.
Lenovo V320-17IKB 81AH0002GE
- 09/04/2017 v6 (old)
Sascha Mölck