Breve Análise do Portátil HP Pavilion 17-x110ng


| SD Card Reader | |
| average JPG Copy Test (av. of 3 runs) | |
| Lenovo ThinkPad E470-20H2S00400 | |
| Lenovo IdeaPad 510-15IKB 80SV0087GE | |
| Acer Aspire F15 F5-573G-53V1 | |
| HP Pavilion 15-aw004ng W8Y60EA | |
| Acer Aspire E5-575G-549D | |
| HP Pavilion 17-x110ng | |
| maximum AS SSD Seq Read Test (1GB) | |
| HP Pavilion 15-aw004ng W8Y60EA | |
| Lenovo ThinkPad E470-20H2S00400 | |
| Acer Aspire E5-575G-549D | |
| Lenovo IdeaPad 510-15IKB 80SV0087GE | |
| HP Pavilion 17-x110ng | |
| Networking | |
| iperf3 transmit AX12 | |
| Lenovo ThinkPad E470-20H2S00400 | |
| HP Pavilion 17-x110ng | |
| iperf3 receive AX12 | |
| Lenovo ThinkPad E470-20H2S00400 | |
| HP Pavilion 17-x110ng | |
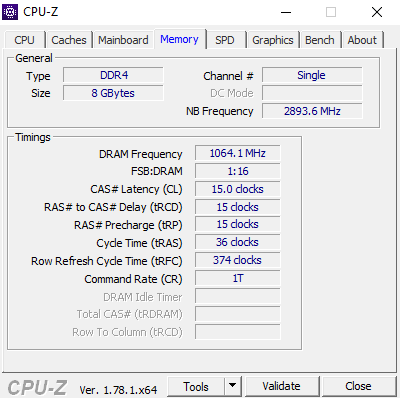
| |||||||||||||||||||||||||
iluminação: 88 %
iluminação com acumulador: 288 cd/m²
Contraste: 472:1 (Preto: 0.61 cd/m²)
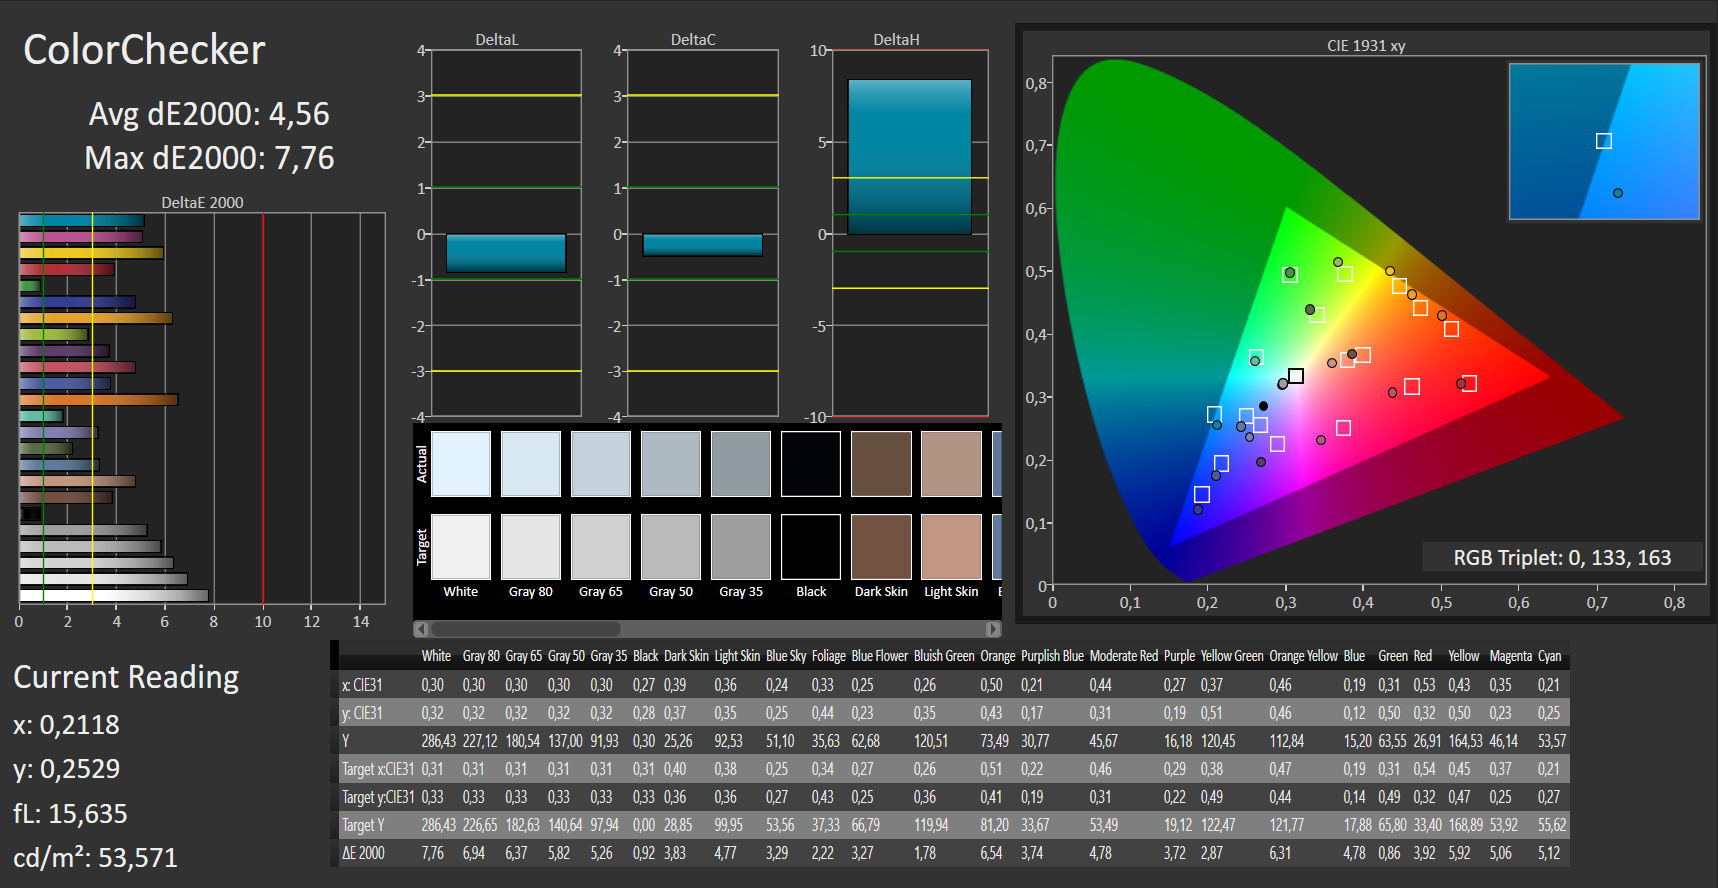
ΔE ColorChecker Calman: 4.56 | ∀{0.5-29.43 Ø4.71}
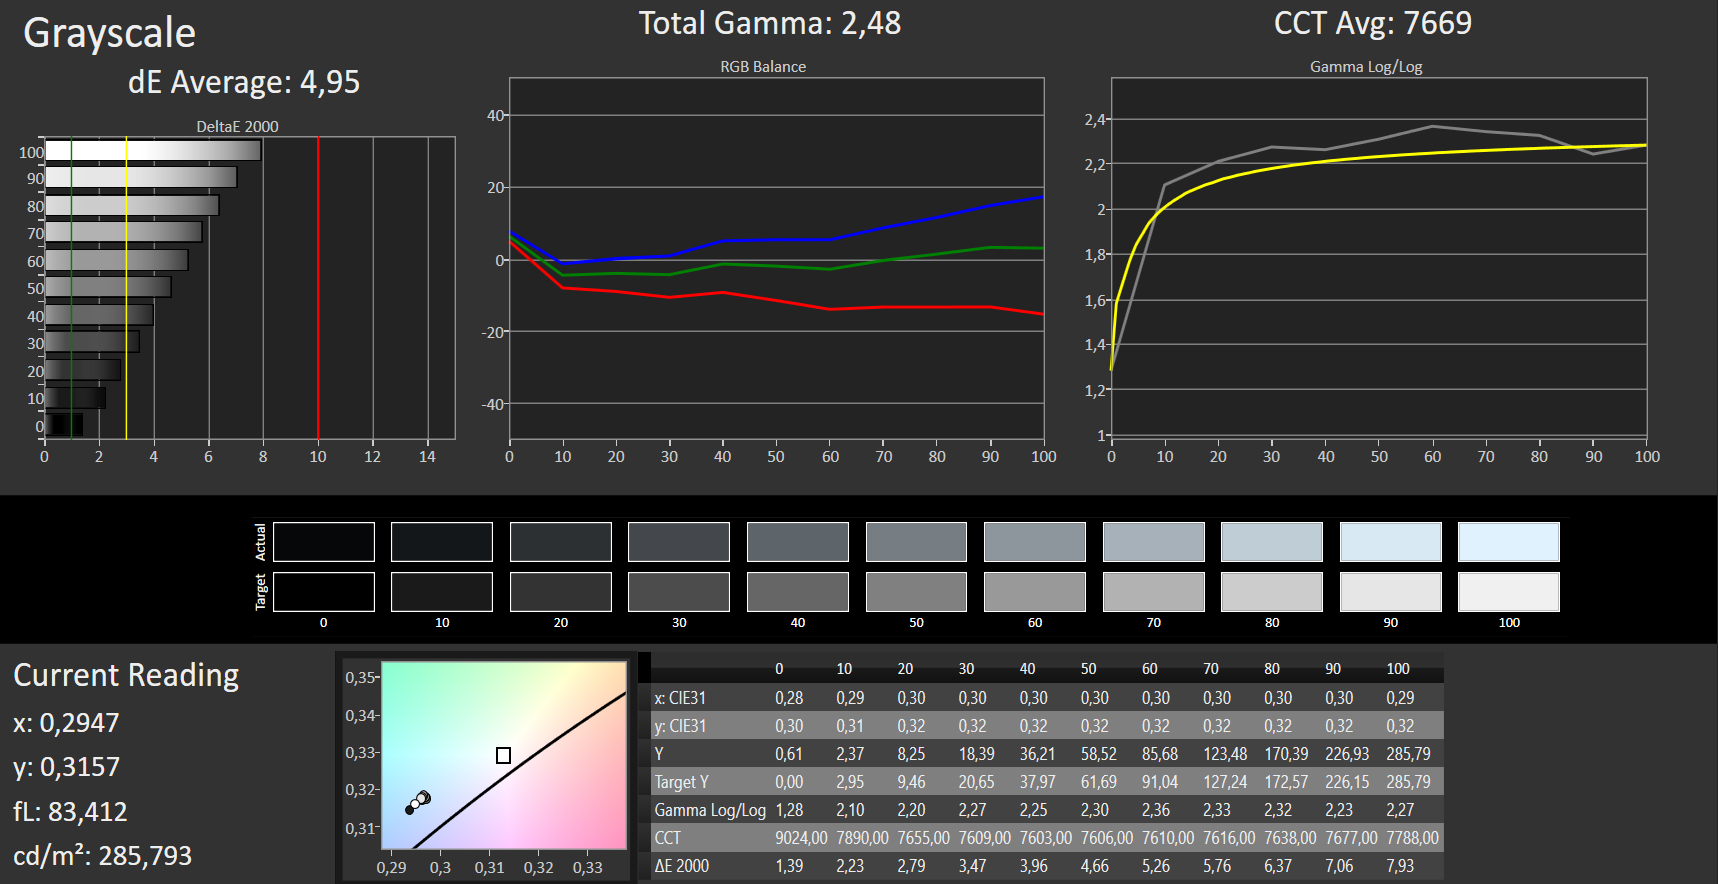
ΔE Greyscale Calman: 4.95 | ∀{0.09-98 Ø4.96}
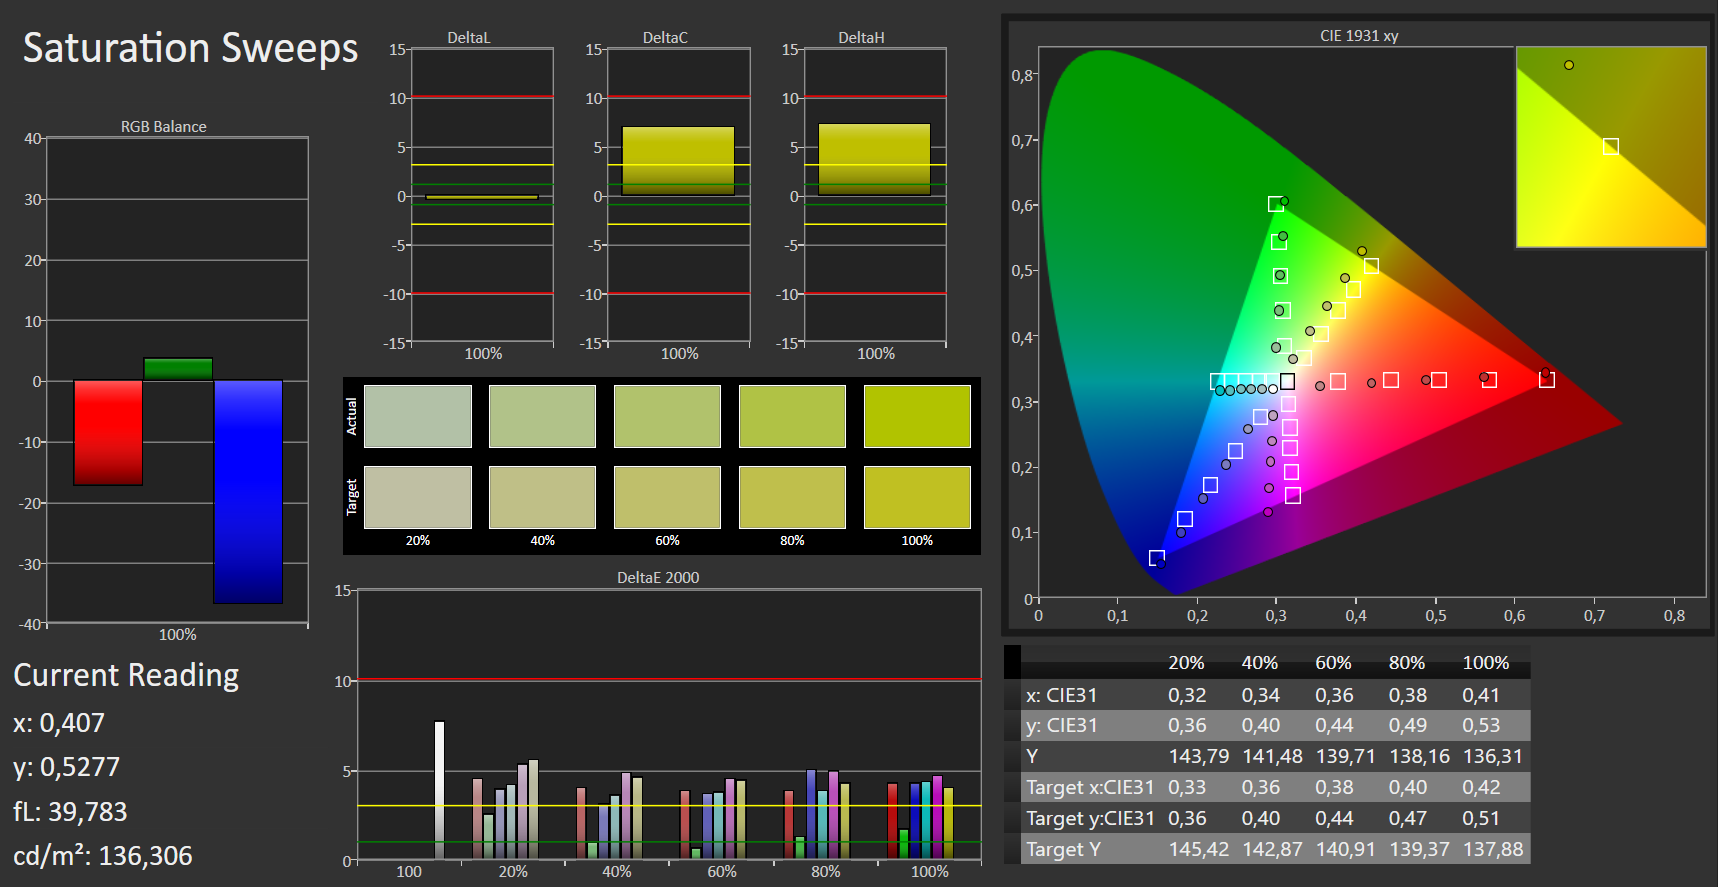
93% sRGB (Argyll 1.6.3 3D)
63.3% AdobeRGB 1998 (Argyll 3D)
86.5% sRGB (Argyll 3D)
63.6% Display P3 (Argyll 3D)
Gamma: 2.48
CCT: 7669 K
| HP Pavilion 17-x110ng Chi Mei CMN1738, , 1920x1080, 17.3" | Acer Aspire E5-575G-549D Chi Mei CMN15C4, , 1920x1080, 15.6" | Lenovo IdeaPad 510-15IKB 80SV0087GE BOE HF NV156FHM-N42, , 1920x1080, 15.6" | Acer Aspire F15 F5-573G-53V1 Innolux N156HGE-EAL, , 1920x1080, 15.6" | Lenovo ThinkPad E470-20H2S00400 N140HCA-EAB, , 1920x1080, 14" | HP Pavilion 15-aw004ng W8Y60EA Chi Mei, , 1920x1080, 15.6" | |
|---|---|---|---|---|---|---|
| Display | -37% | -30% | 26% | -32% | -34% | |
| Display P3 Coverage (%) | 63.6 | 38.57 -39% | 42.66 -33% | 84.2 32% | 41.23 -35% | 40.35 -37% |
| sRGB Coverage (%) | 86.5 | 57.4 -34% | 64.1 -26% | 99.7 15% | 61.4 -29% | 60.3 -30% |
| AdobeRGB 1998 Coverage (%) | 63.3 | 39.89 -37% | 44.08 -30% | 82.7 31% | 42.67 -33% | 41.71 -34% |
| Response Times | 13% | -26% | 8% | -1% | 12% | |
| Response Time Grey 50% / Grey 80% * (ms) | 41 ? | 39 ? 5% | 51 ? -24% | 44 ? -7% | 40.8 ? -0% | 41 ? -0% |
| Response Time Black / White * (ms) | 30 ? | 24 ? 20% | 38 ? -27% | 23 ? 23% | 30.4 ? -1% | 23 ? 23% |
| PWM Frequency (Hz) | 200 ? | 50 ? | 1000 ? | |||
| Screen | -41% | 21% | -57% | -14% | -50% | |
| Brightness middle (cd/m²) | 288 | 176 -39% | 291 1% | 234 -19% | 244 -15% | 240 -17% |
| Brightness (cd/m²) | 285 | 169 -41% | 265 -7% | 219 -23% | 231 -19% | 228 -20% |
| Brightness Distribution (%) | 88 | 91 3% | 86 -2% | 80 -9% | 89 1% | 89 1% |
| Black Level * (cd/m²) | 0.61 | 0.47 23% | 0.23 62% | 0.48 21% | 0.37 39% | 0.49 20% |
| Contrast (:1) | 472 | 374 -21% | 1265 168% | 488 3% | 659 40% | 490 4% |
| Colorchecker dE 2000 * | 4.56 | 8.83 -94% | 4.78 -5% | 11.8 -159% | 6.41 -41% | 10.96 -140% |
| Colorchecker dE 2000 max. * | 7.76 | 14.01 -81% | 9.51 -23% | 20.69 -167% | 13.4 -73% | 18.36 -137% |
| Greyscale dE 2000 * | 4.95 | 8.97 -81% | 3.49 29% | 13.3 -169% | 5.94 -20% | 11.34 -129% |
| Gamma | 2.48 89% | 2.43 91% | 2.58 85% | 2.47 89% | 2.28 96% | 2.27 97% |
| CCT | 7669 85% | 10234 64% | 6013 108% | 17098 38% | 6101 107% | 12292 53% |
| Color Space (Percent of sRGB) (%) | 93 | 57.3 -38% | 64 -31% | 100 8% | 61.1 -34% | 60 -35% |
| Color Space (Percent of AdobeRGB 1998) (%) | 36.8 | 40 | 74 | 39.3 | 39 | |
| Média Total (Programa/Configurações) | -22% /
-32% | -12% /
4% | -8% /
-30% | -16% /
-16% | -24% /
-38% |
* ... menor é melhor
Exibir tempos de resposta
| ↔ Tempo de resposta preto para branco | ||
|---|---|---|
| 30 ms ... ascensão ↗ e queda ↘ combinadas | ↗ 8 ms ascensão | 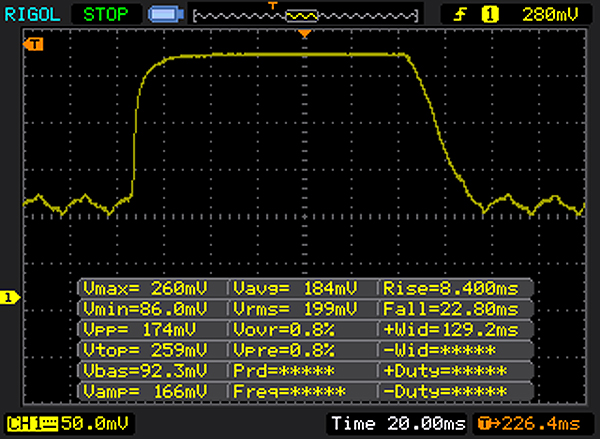 |
| ↘ 22 ms queda | ||
| A tela mostra taxas de resposta lentas em nossos testes e será insatisfatória para os jogadores. Em comparação, todos os dispositivos testados variam de 0.1 (mínimo) a 240 (máximo) ms. » 80 % de todos os dispositivos são melhores. Isso significa que o tempo de resposta medido é pior que a média de todos os dispositivos testados (19.8 ms). | ||
| ↔ Tempo de resposta 50% cinza a 80% cinza | ||
| 41 ms ... ascensão ↗ e queda ↘ combinadas | ↗ 16 ms ascensão | 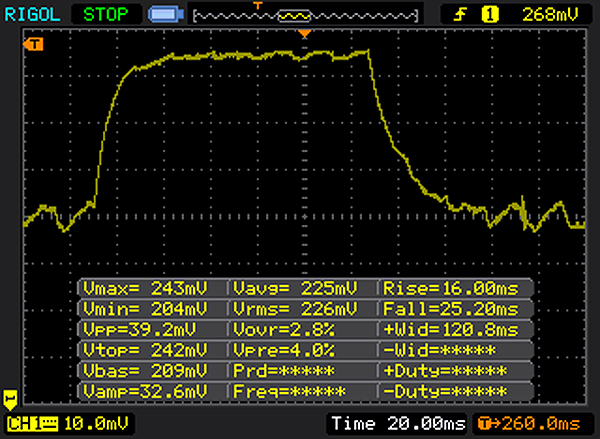 |
| ↘ 25 ms queda | ||
| A tela mostra taxas de resposta lentas em nossos testes e será insatisfatória para os jogadores. Em comparação, todos os dispositivos testados variam de 0.165 (mínimo) a 636 (máximo) ms. » 65 % de todos os dispositivos são melhores. Isso significa que o tempo de resposta medido é pior que a média de todos os dispositivos testados (30.9 ms). | ||
Cintilação da tela / PWM (modulação por largura de pulso)
| Tela tremeluzindo/PWM detectado | 200 Hz | ≤ 90 % configuração de brilho | 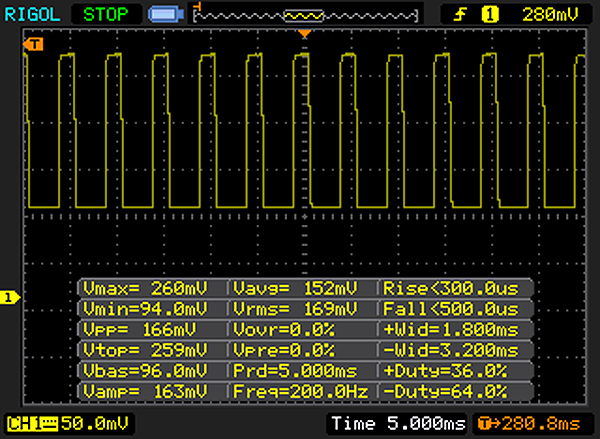 |
A luz de fundo da tela pisca em 200 Hz (pior caso, por exemplo, utilizando PWM) Cintilação detectada em uma configuração de brilho de 90 % e abaixo. Não deve haver cintilação ou PWM acima desta configuração de brilho. A frequência de 200 Hz é relativamente baixa, portanto, usuários sensíveis provavelmente notarão cintilação e sentirão fadiga ocular na configuração de brilho indicada e abaixo. [pwm_comparison] Em comparação: 52 % de todos os dispositivos testados não usam PWM para escurecer a tela. Se PWM foi detectado, uma média de 7748 (mínimo: 5 - máximo: 343500) Hz foi medida. | |||
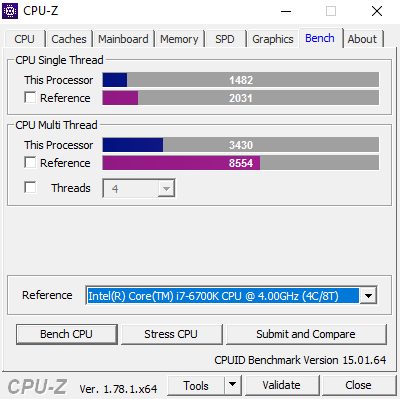
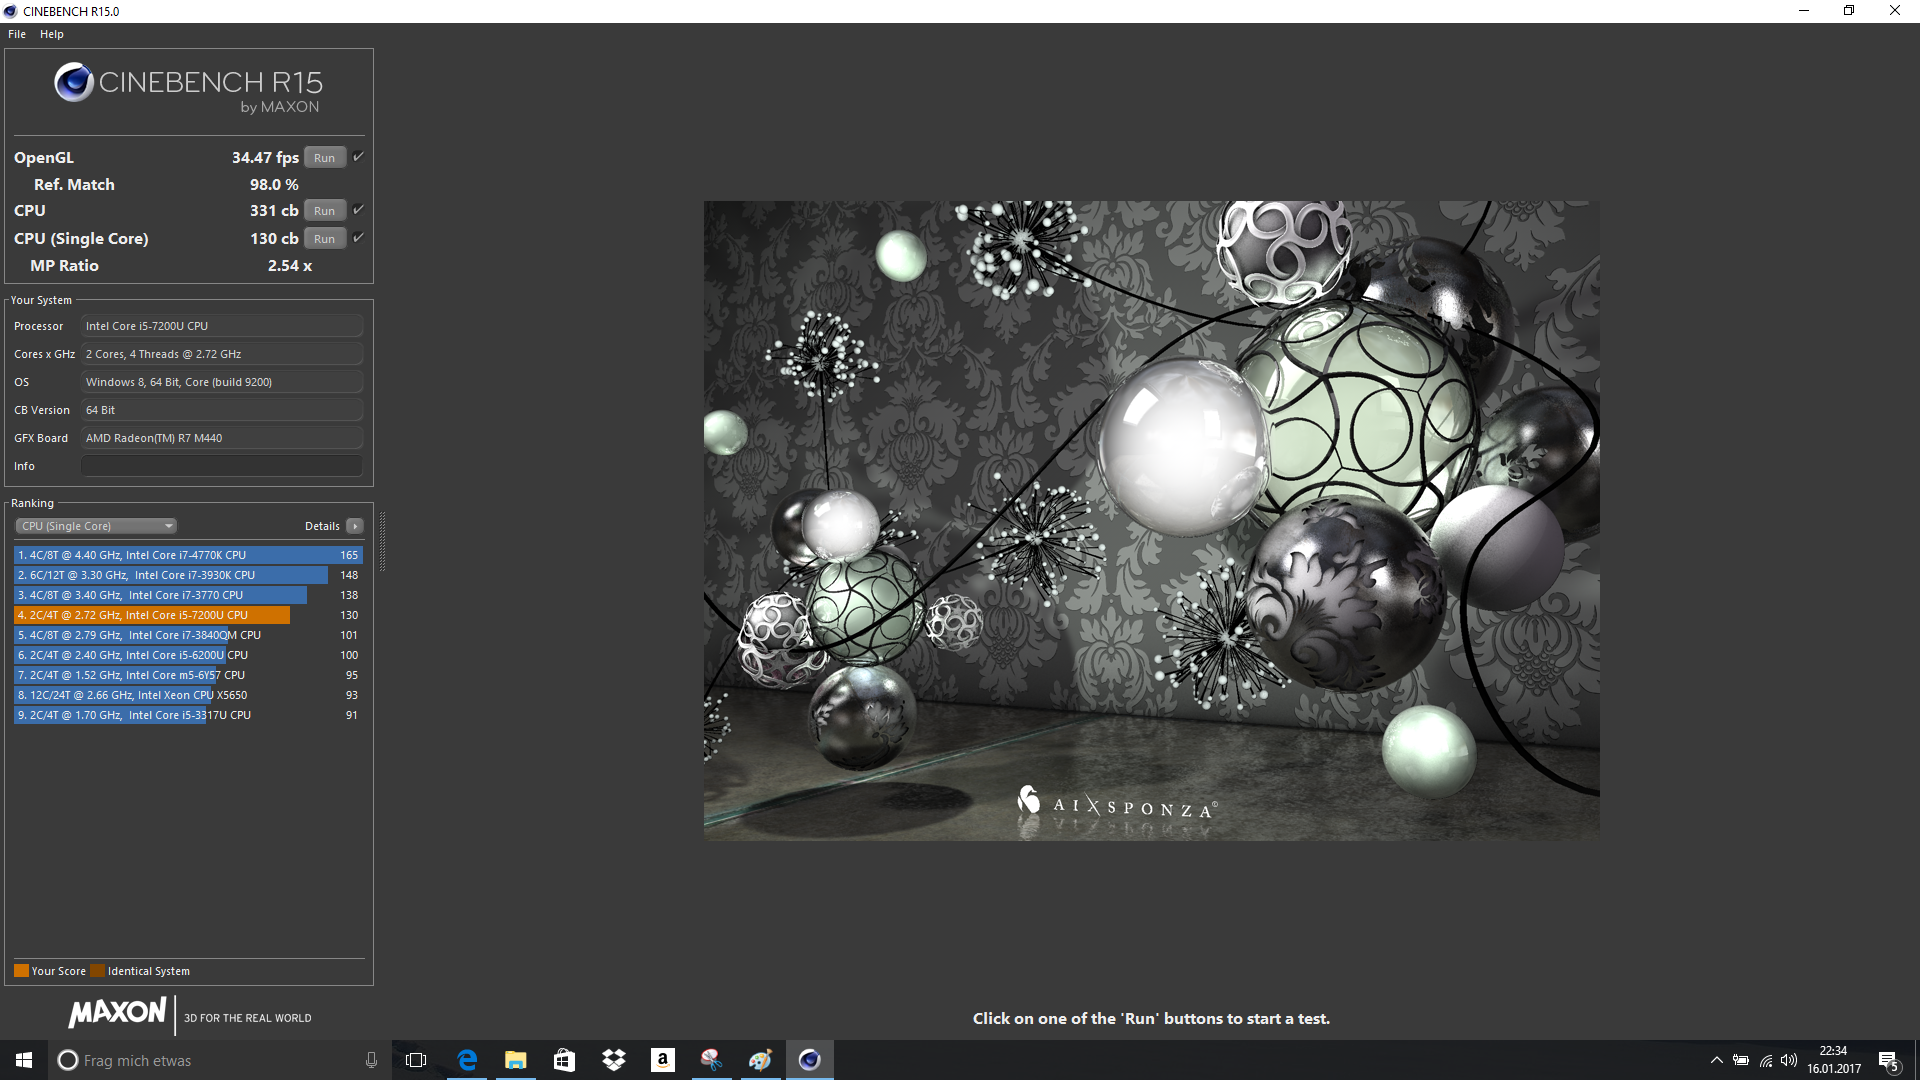
| Cinebench R15 | |
| CPU Single 64Bit | |
| Lenovo IdeaPad 510-15IKB 80SV0087GE | |
| HP Pavilion 17-x110ng | |
| Acer Aspire E5-575G-549D | |
| Lenovo ThinkPad E470-20H2S00400 | |
| Acer Aspire F15 F5-573G-53V1 | |
| HP Pavilion 15-aw004ng W8Y60EA | |
| CPU Multi 64Bit | |
| Lenovo IdeaPad 510-15IKB 80SV0087GE | |
| Acer Aspire E5-575G-549D | |
| Lenovo ThinkPad E470-20H2S00400 | |
| HP Pavilion 17-x110ng | |
| Acer Aspire F15 F5-573G-53V1 | |
| HP Pavilion 15-aw004ng W8Y60EA | |
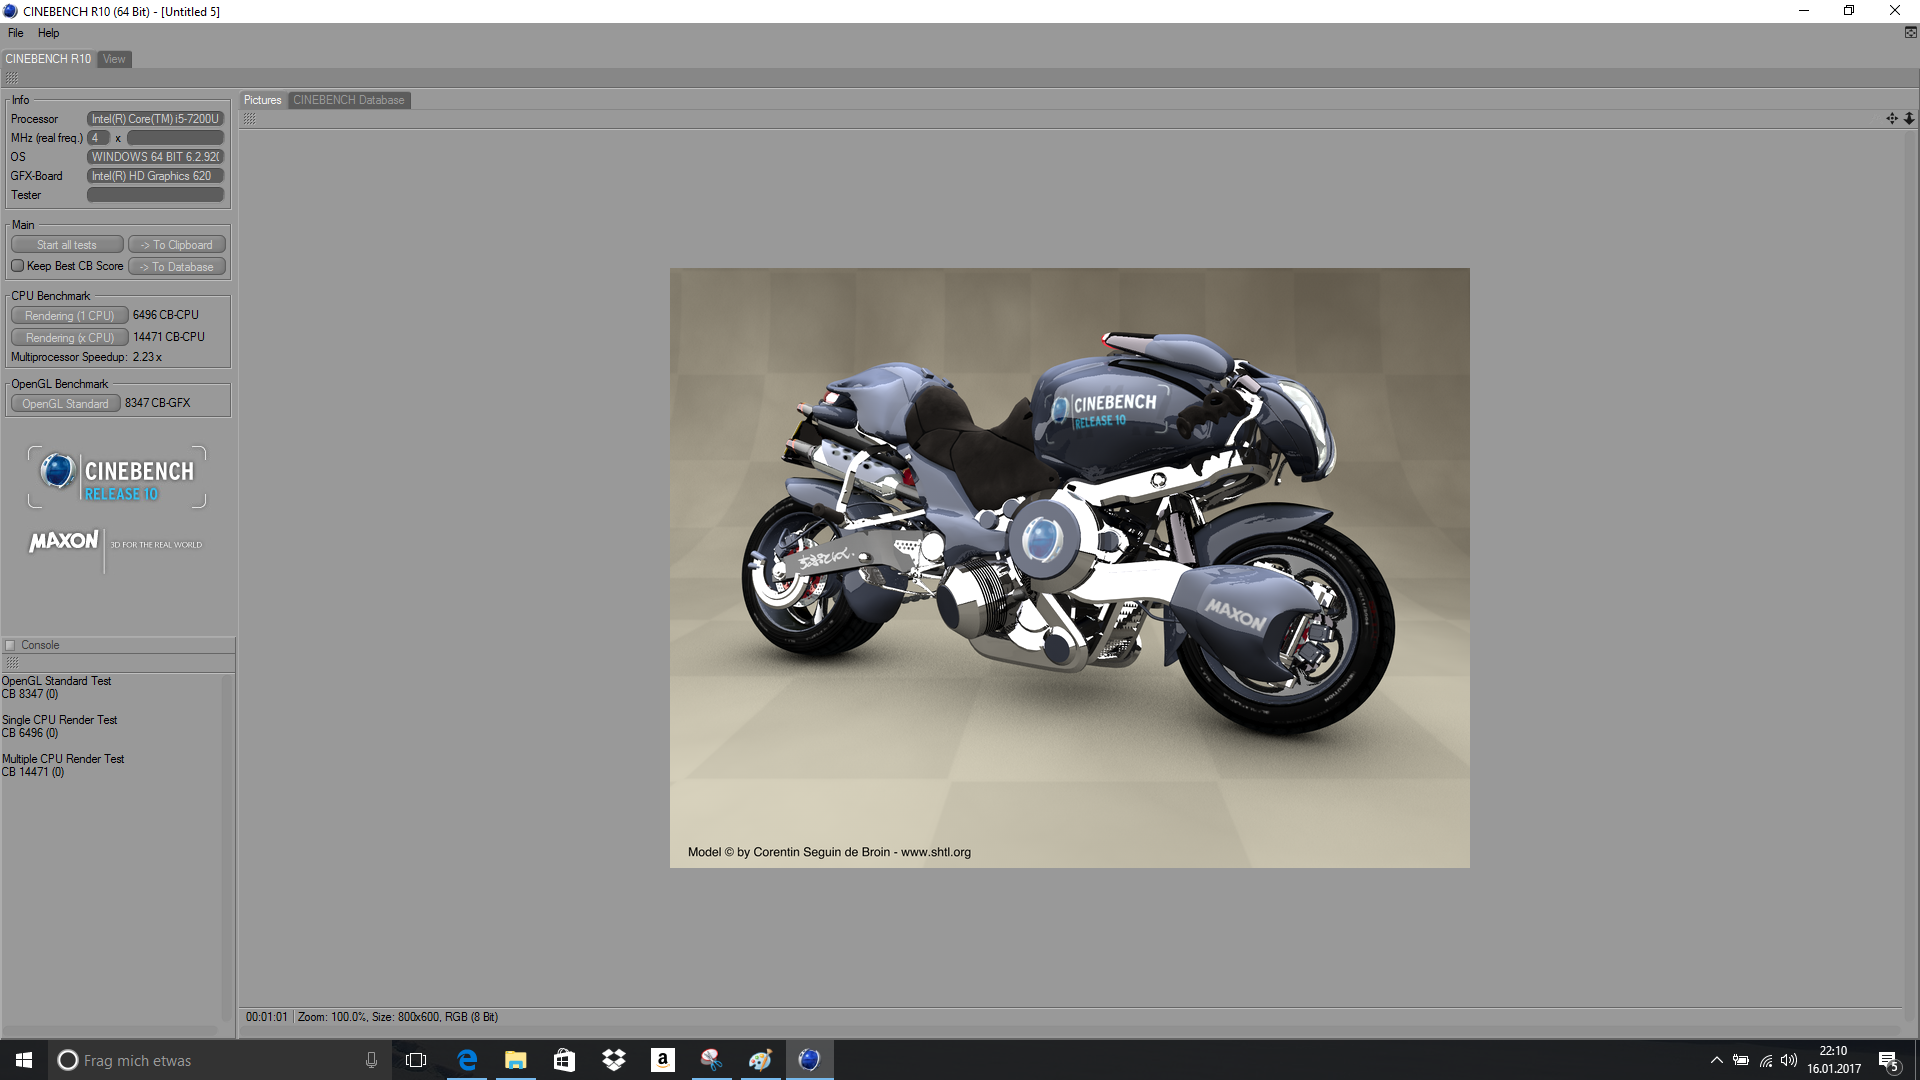
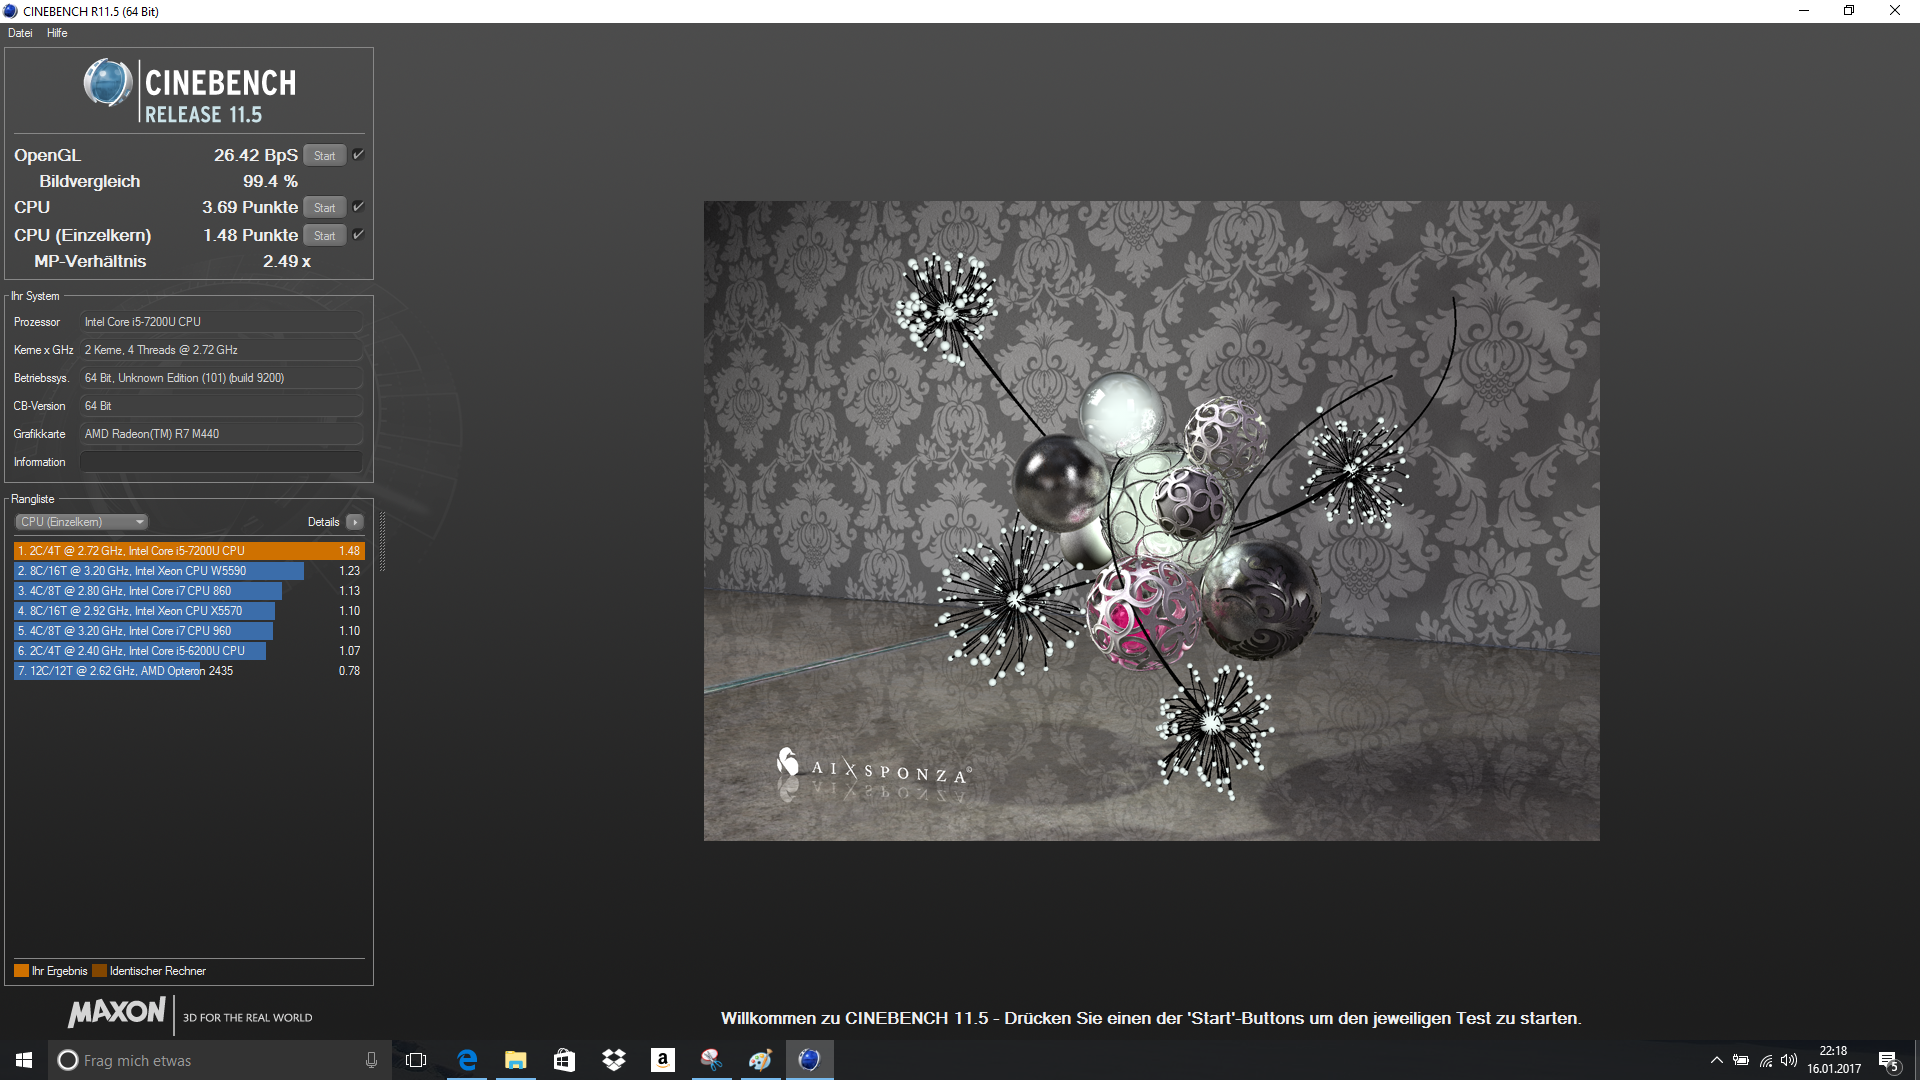
| Cinebench R10 | |
| Rendering Single CPUs 64Bit | |
| HP Pavilion 17-x110ng | |
| Acer Aspire F15 F5-573G-53V1 | |
| Rendering Multiple CPUs 64Bit | |
| HP Pavilion 17-x110ng | |
| Acer Aspire F15 F5-573G-53V1 | |
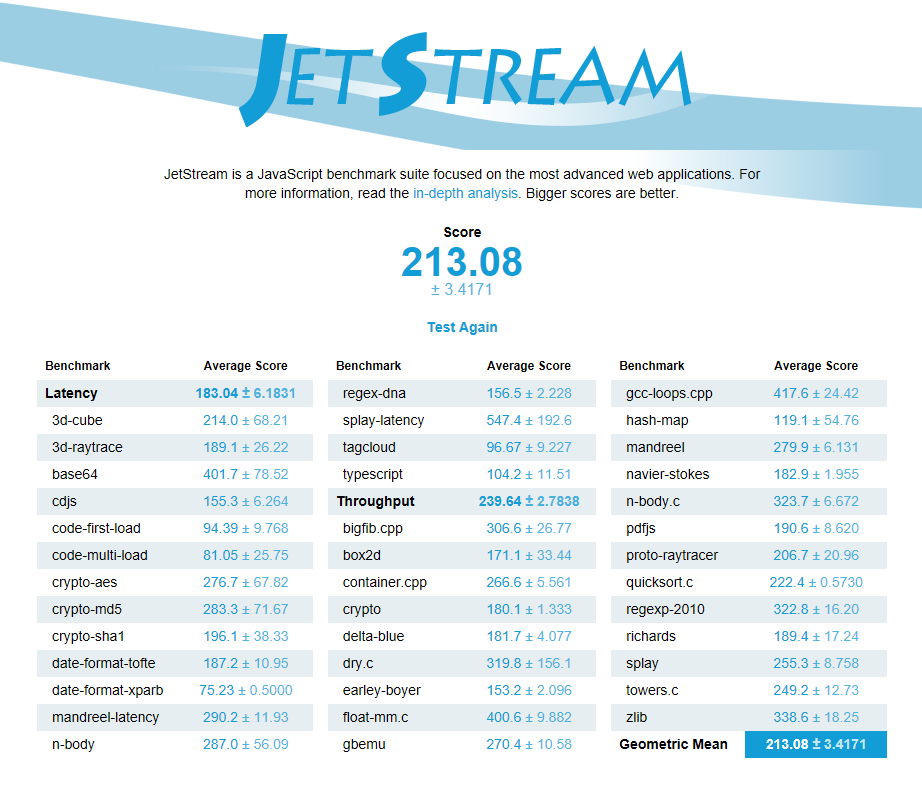
| JetStream 1.1 - 1.1 Total | |
| Lenovo IdeaPad 510-15IKB 80SV0087GE | |
| Acer Aspire E5-575G-549D | |
| HP Pavilion 17-x110ng | |
| Lenovo ThinkPad E470-20H2S00400 | |
| Acer Aspire F15 F5-573G-53V1 | |
| HP Pavilion 15-aw004ng W8Y60EA | |
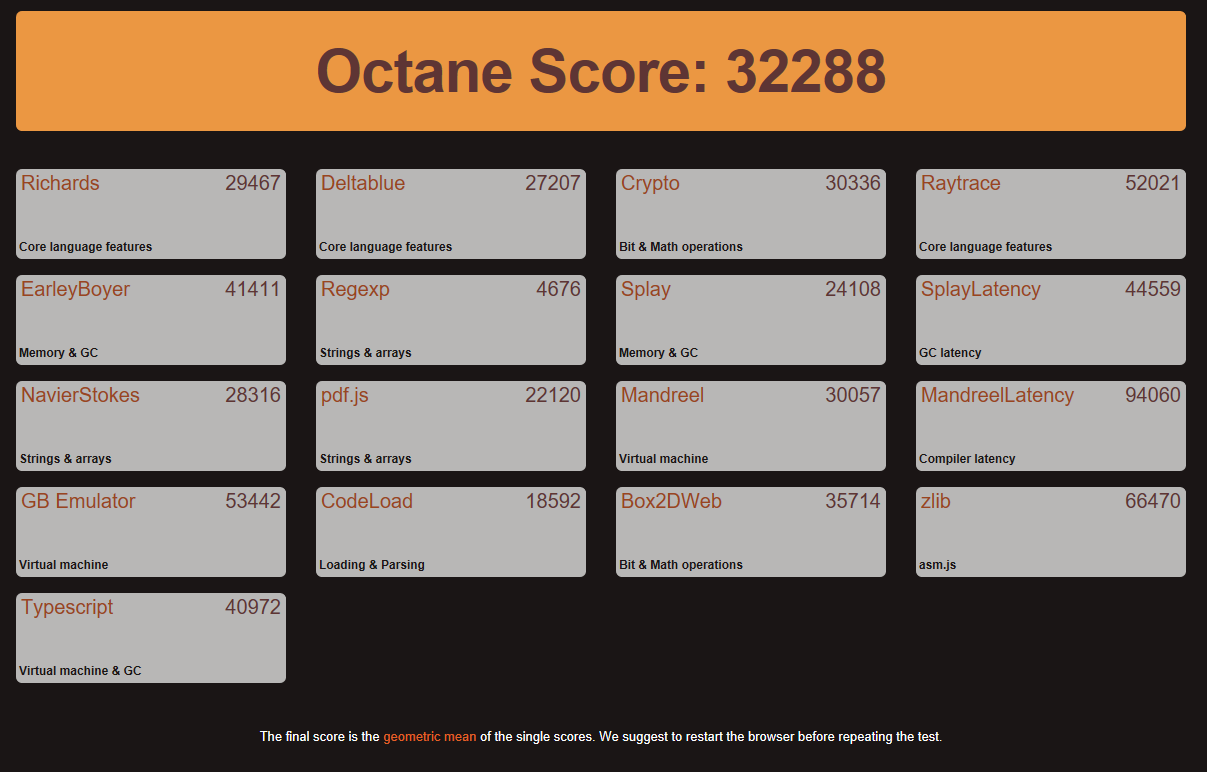
| Octane V2 - Total Score | |
| Lenovo ThinkPad E470-20H2S00400 | |
| HP Pavilion 17-x110ng | |
| Acer Aspire E5-575G-549D | |
| Acer Aspire F15 F5-573G-53V1 | |
| HP Pavilion 15-aw004ng W8Y60EA | |
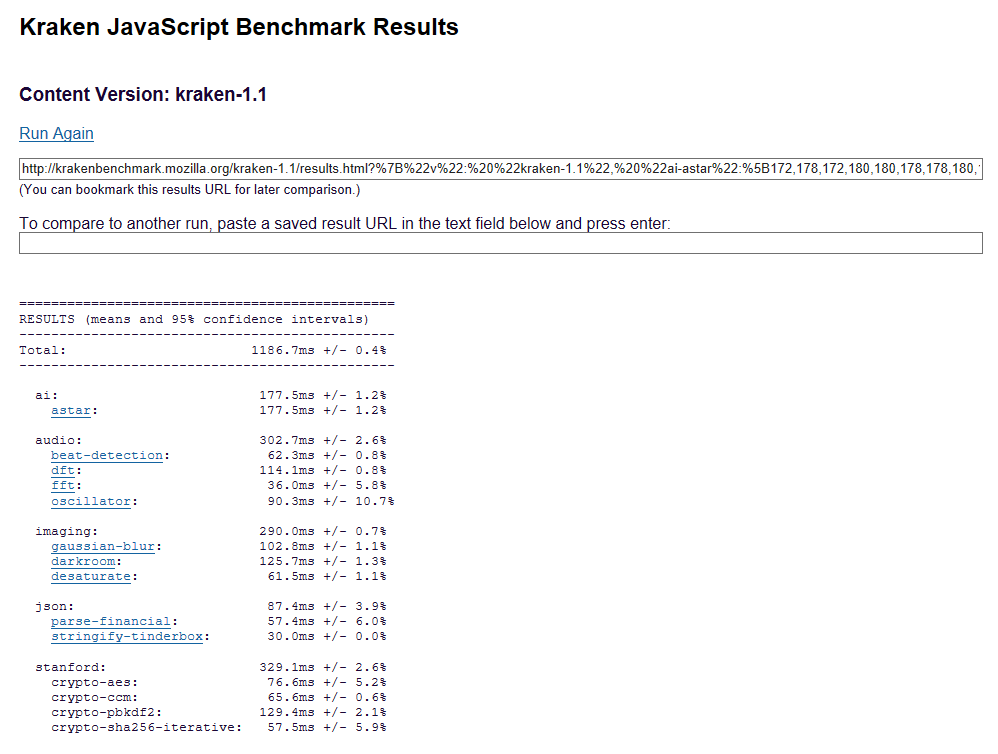
| Mozilla Kraken 1.1 - Total | |
| HP Pavilion 15-aw004ng W8Y60EA | |
| Acer Aspire F15 F5-573G-53V1 | |
| HP Pavilion 17-x110ng | |
| Lenovo ThinkPad E470-20H2S00400 | |
| Acer Aspire E5-575G-549D | |
* ... menor é melhor
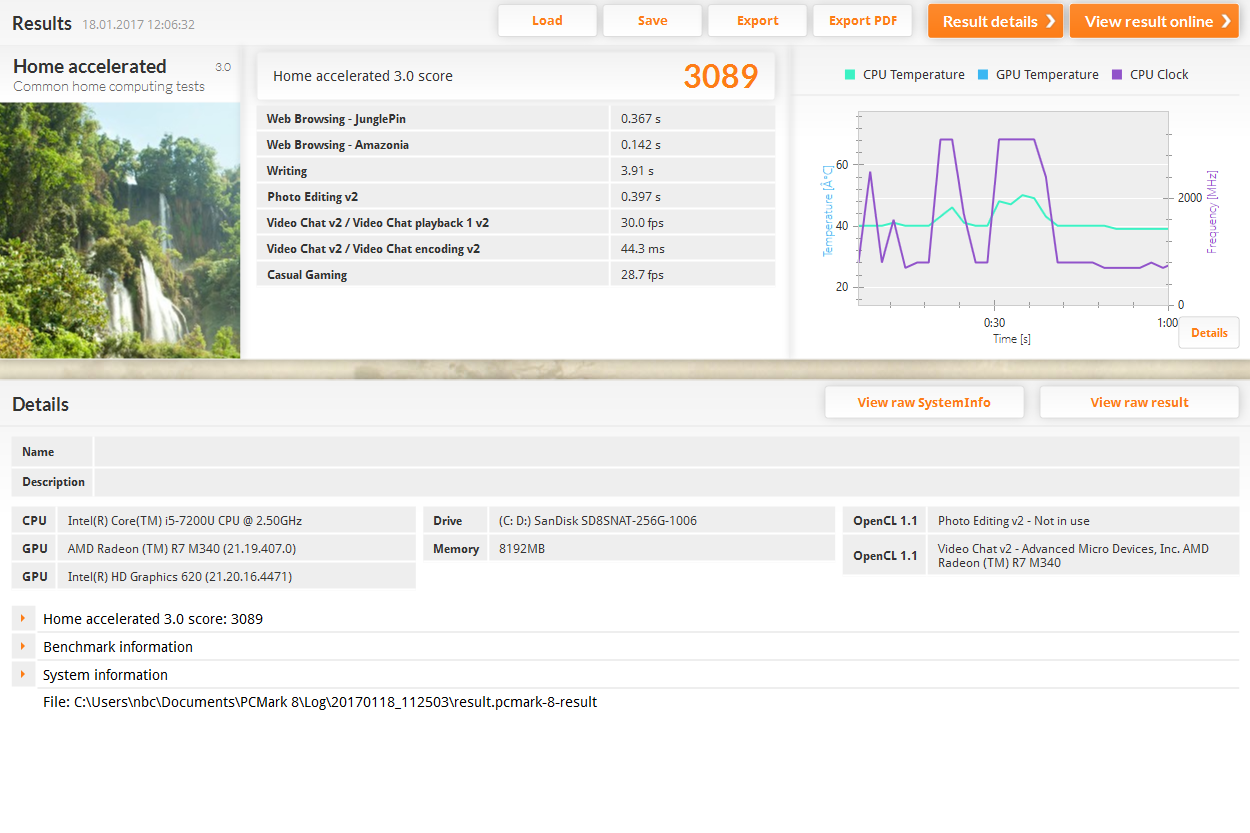

| PCMark 8 | |
| Home Score Accelerated v2 | |
| Lenovo IdeaPad 510-15IKB 80SV0087GE | |
| Lenovo ThinkPad E470-20H2S00400 | |
| Acer Aspire F15 F5-573G-53V1 | |
| Acer Aspire E5-575G-549D | |
| HP Pavilion 17-x110ng | |
| HP Pavilion 15-aw004ng W8Y60EA | |
| Storage Score v2 | |
| HP Pavilion 17-x110ng | |
| Acer Aspire F15 F5-573G-53V1 | |
| Acer Aspire E5-575G-549D | |
| Creative Score Accelerated v2 | |
| HP Pavilion 17-x110ng | |
| Lenovo ThinkPad E470-20H2S00400 | |
| Acer Aspire F15 F5-573G-53V1 | |
| Acer Aspire E5-575G-549D | |
| HP Pavilion 15-aw004ng W8Y60EA | |
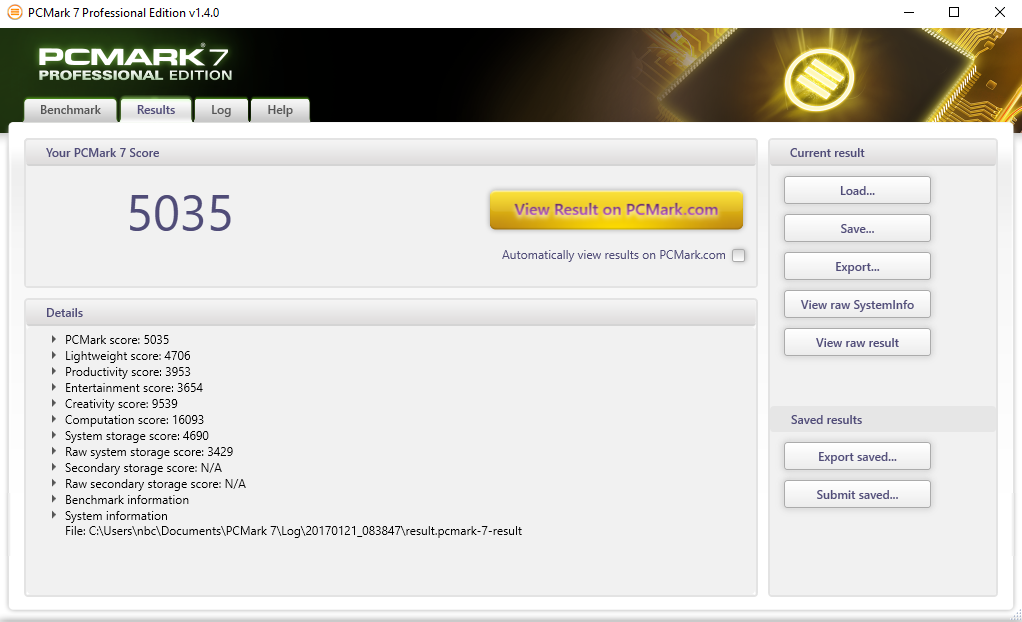
| PCMark 7 | |
| Productivity | |
| HP Pavilion 17-x110ng | |
| HP Pavilion 15-aw004ng W8Y60EA | |
| Acer Aspire F15 F5-573G-53V1 | |
| Score | |
| HP Pavilion 17-x110ng | |
| HP Pavilion 15-aw004ng W8Y60EA | |
| Acer Aspire F15 F5-573G-53V1 | |
| PCMark 7 Score | 5035 pontos | |
| PCMark 8 Home Score Accelerated v2 | 3102 pontos | |
| PCMark 8 Creative Score Accelerated v2 | 4429 pontos | |
Ajuda | ||
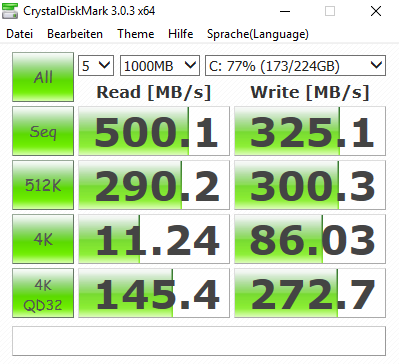
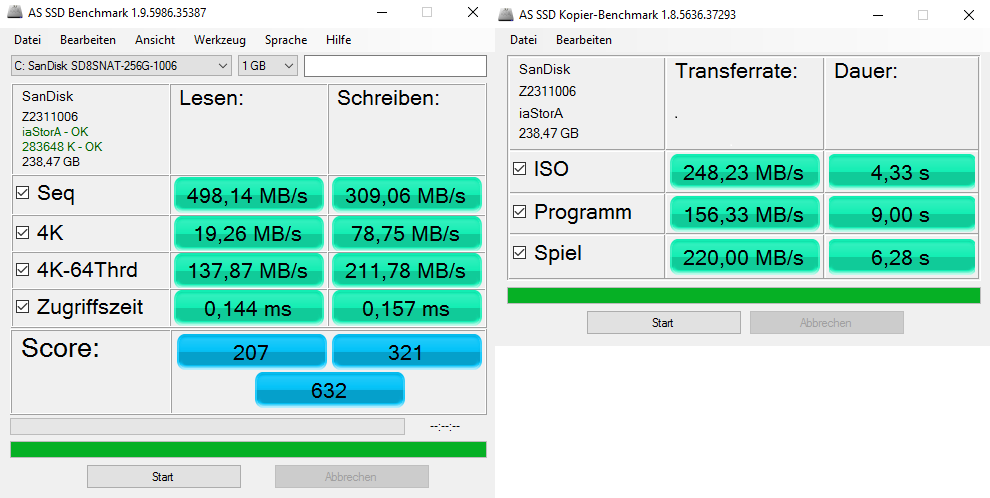
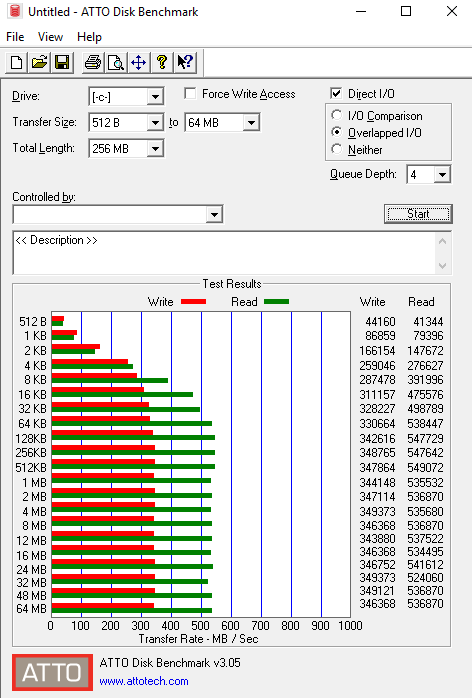
| HP Pavilion 17-x110ng SanDisk Z400s SD8SNAT-256G | Acer Aspire E5-575G-549D Toshiba MQ01ABD100 | Lenovo IdeaPad 510-15IKB 80SV0087GE Liteonit CV3-DE256 | Acer Aspire F15 F5-573G-53V1 WDC Scorpio Blue WD10JPVX-22JC3T0 | Lenovo ThinkPad E470-20H2S00400 SanDisk X400 SED 256GB, SATA (SD8TB8U-256G) | HP Pavilion 15-aw004ng W8Y60EA | |
|---|---|---|---|---|---|---|
| CrystalDiskMark 3.0 | -92% | 40% | -89% | 39% | -10% | |
| Read Seq (MB/s) | 500 | 95.3 -81% | 469.2 -6% | 108.1 -78% | 476.5 -5% | 503 1% |
| Write Seq (MB/s) | 325.1 | 85.6 -74% | 431.5 33% | 105.6 -68% | 458.7 41% | 316.6 -3% |
| Read 512 (MB/s) | 290.2 | 29.32 -90% | 338.3 17% | 35.32 -88% | 346.4 19% | 261.9 -10% |
| Write 512 (MB/s) | 300.3 | 25.93 -91% | 297.9 -1% | 46.13 -85% | 291.1 -3% | 281.2 -6% |
| Read 4k (MB/s) | 11.24 | 0.366 -97% | 28.68 155% | 0.413 -96% | 35.15 213% | 17.04 52% |
| Write 4k (MB/s) | 86 | 0.726 -99% | 66.8 -22% | 0.9 -99% | 78.8 -8% | 46.55 -46% |
| Read 4k QD32 (MB/s) | 145.4 | 0.647 -100% | 364.7 151% | 0.895 -99% | 276 90% | 125 -14% |
| Write 4k QD32 (MB/s) | 272.7 | 0.722 -100% | 245.9 -10% | 0.884 -100% | 178.3 -35% | 131.4 -52% |


| 3DMark | |
| 1280x720 Cloud Gate Standard Graphics | |
| Acer Aspire E5-575G-549D | |
| Acer Aspire F15 F5-573G-53V1 | |
| HP Pavilion 15-aw004ng W8Y60EA | |
| Lenovo ThinkPad E470-20H2S00400 | |
| HP Pavilion 17-x110ng | |
| 1920x1080 Fire Strike Graphics | |
| Acer Aspire E5-575G-549D | |
| Acer Aspire F15 F5-573G-53V1 | |
| HP Pavilion 15-aw004ng W8Y60EA | |
| Lenovo ThinkPad E470-20H2S00400 | |
| HP Pavilion 17-x110ng | |
| 3DMark 11 - 1280x720 Performance GPU | |
| Acer Aspire E5-575G-549D | |
| Acer Aspire F15 F5-573G-53V1 | |
| HP Pavilion 15-aw004ng W8Y60EA | |
| Lenovo ThinkPad E470-20H2S00400 | |
| Lenovo IdeaPad 510-15IKB 80SV0087GE | |
| HP Pavilion 17-x110ng | |
| 3DMark 03 Standard | 18884 pontos | |
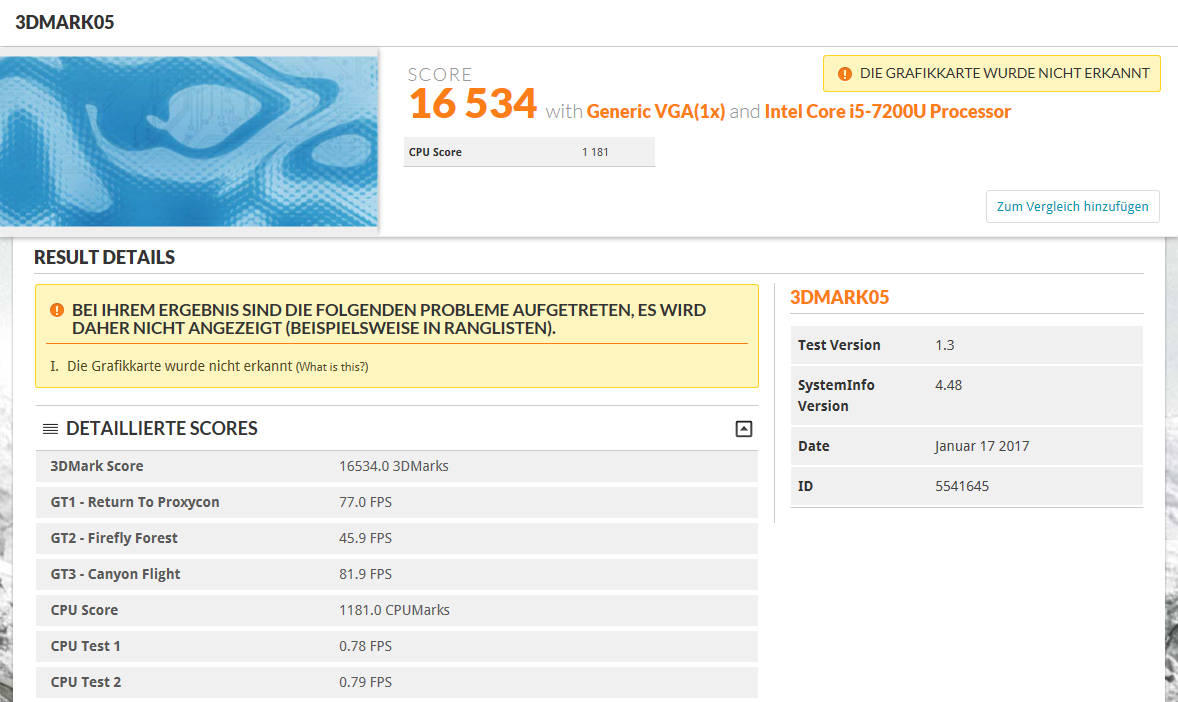
| 3DMark 05 Standard | 16534 pontos | |
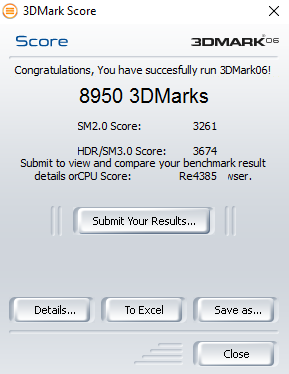
| 3DMark 06 Standard Score | 8950 pontos | |
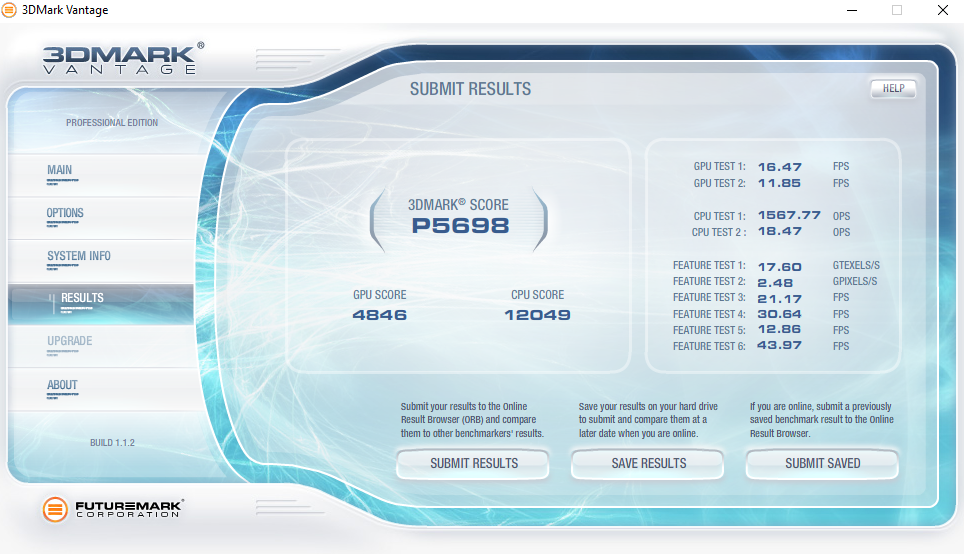
| 3DMark Vantage P Result | 5698 pontos | |
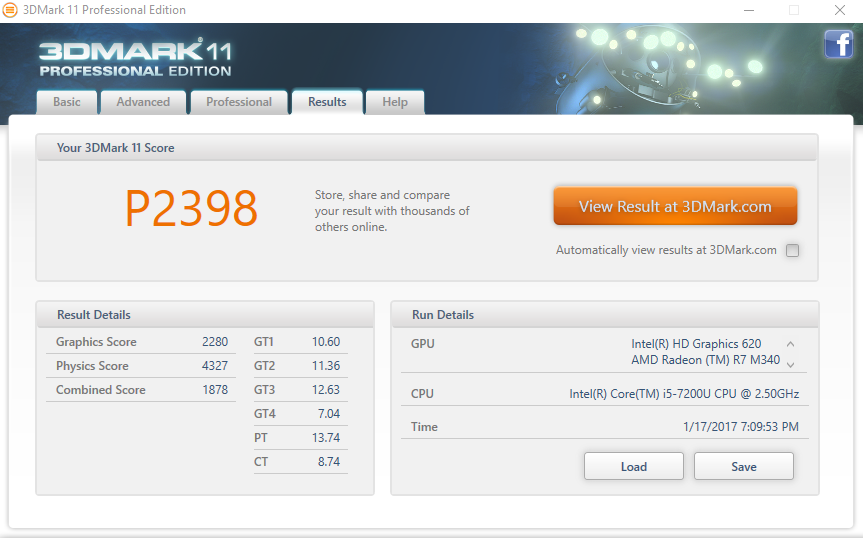
| 3DMark 11 Performance | 2398 pontos | |
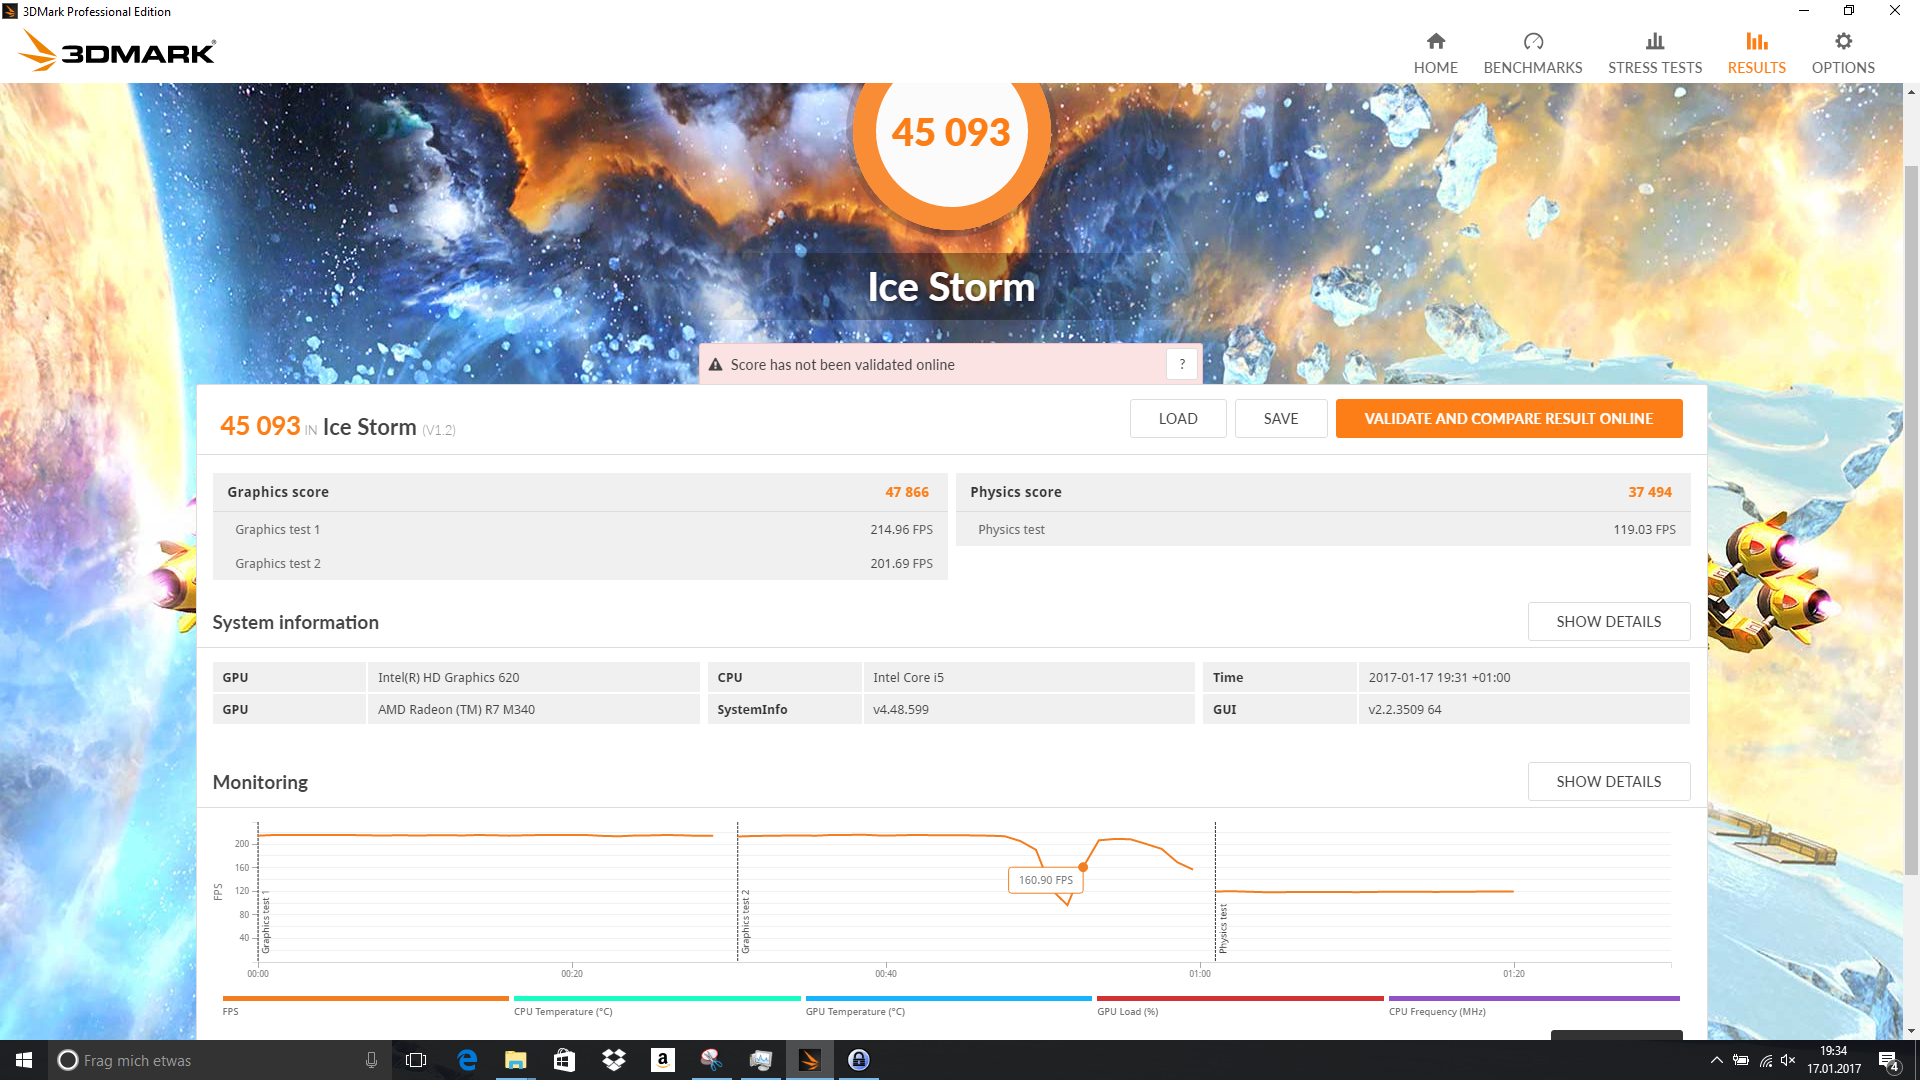
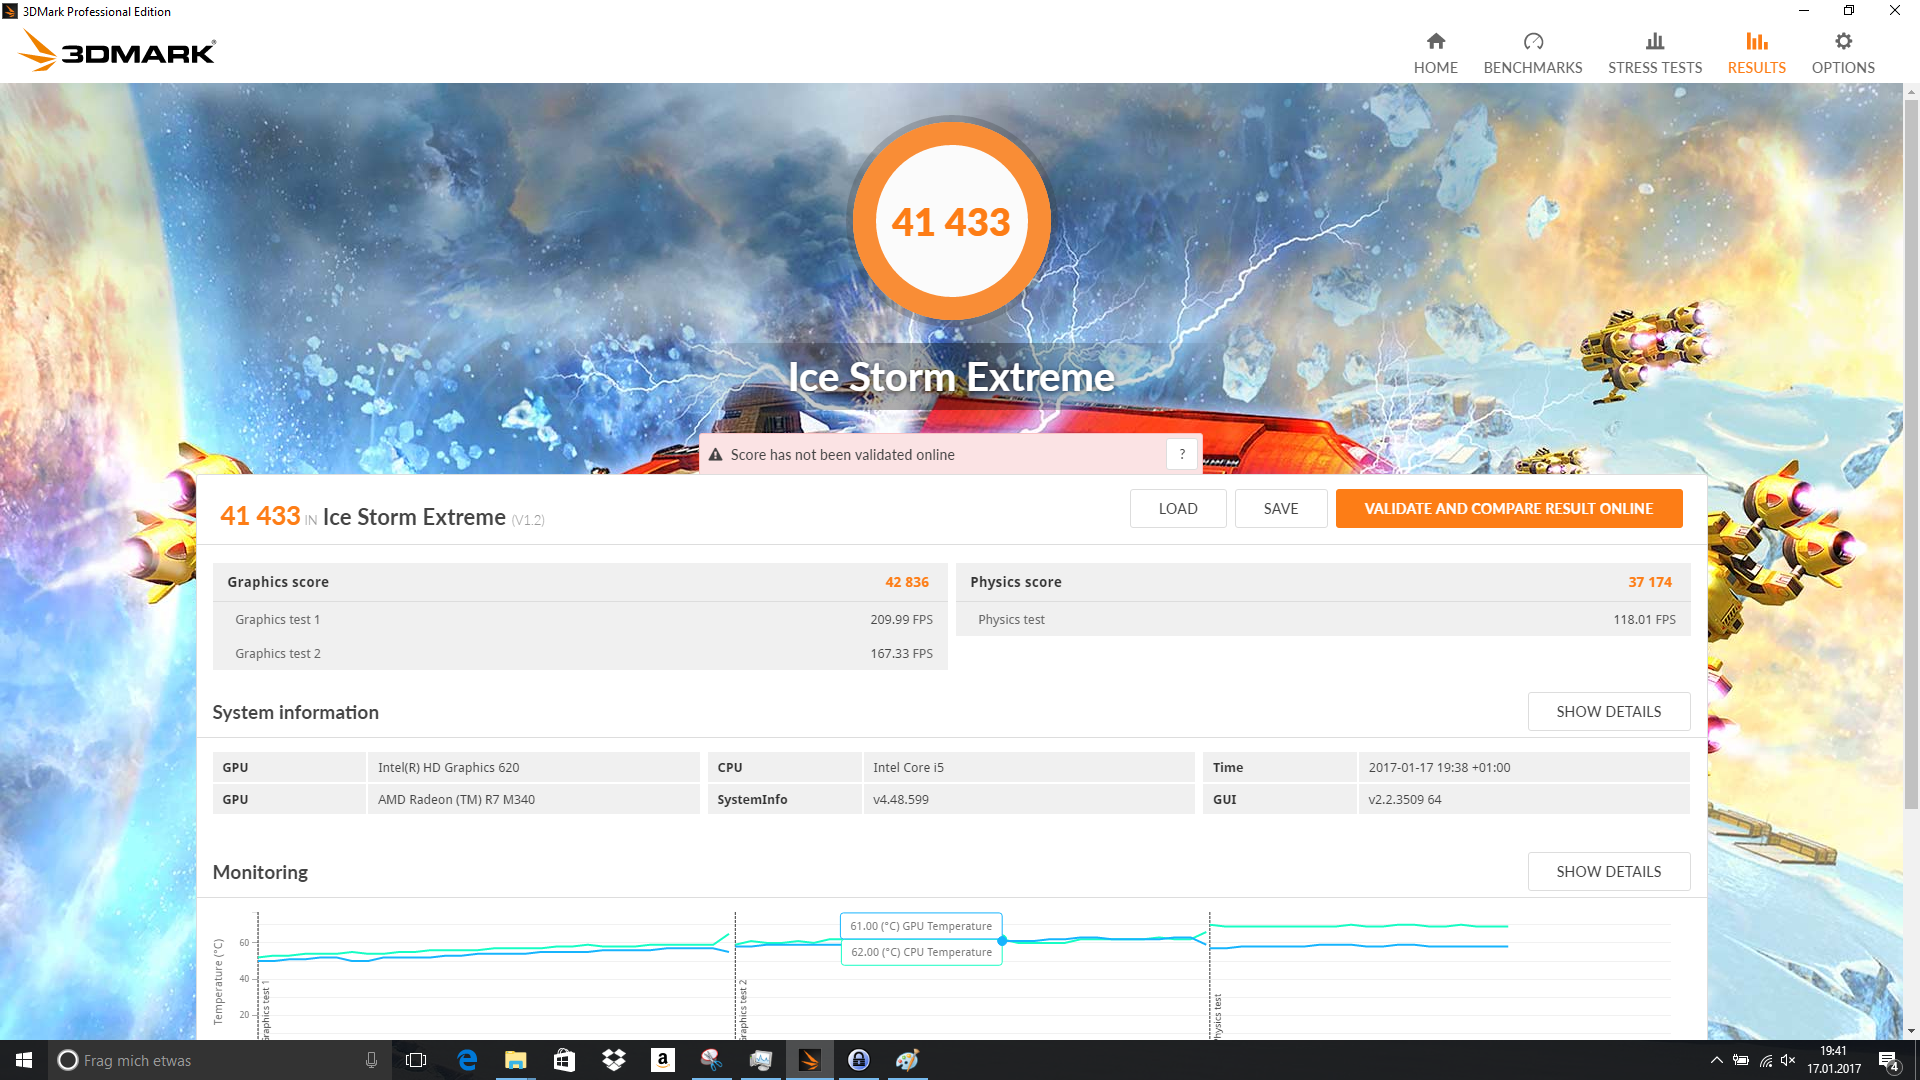
| 3DMark Ice Storm Standard Score | 45093 pontos | |
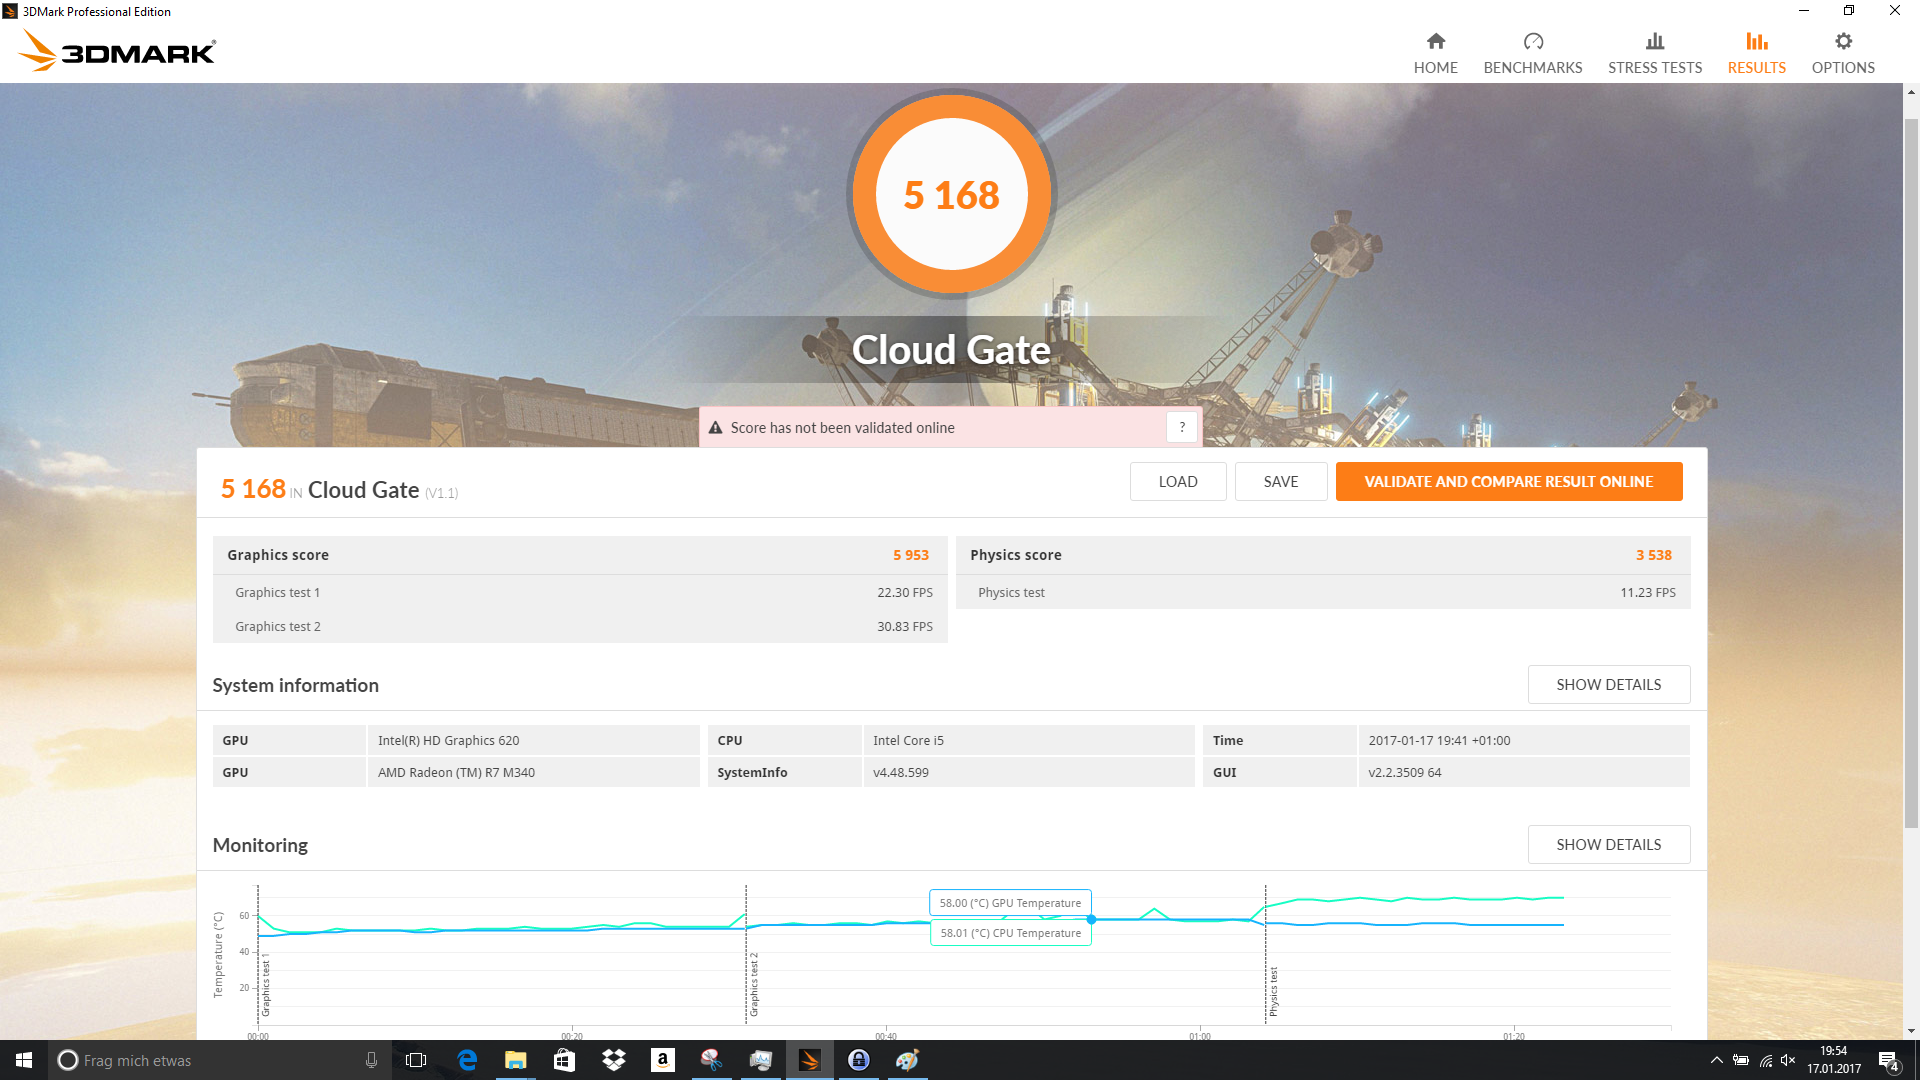
| 3DMark Cloud Gate Standard Score | 5168 pontos | |
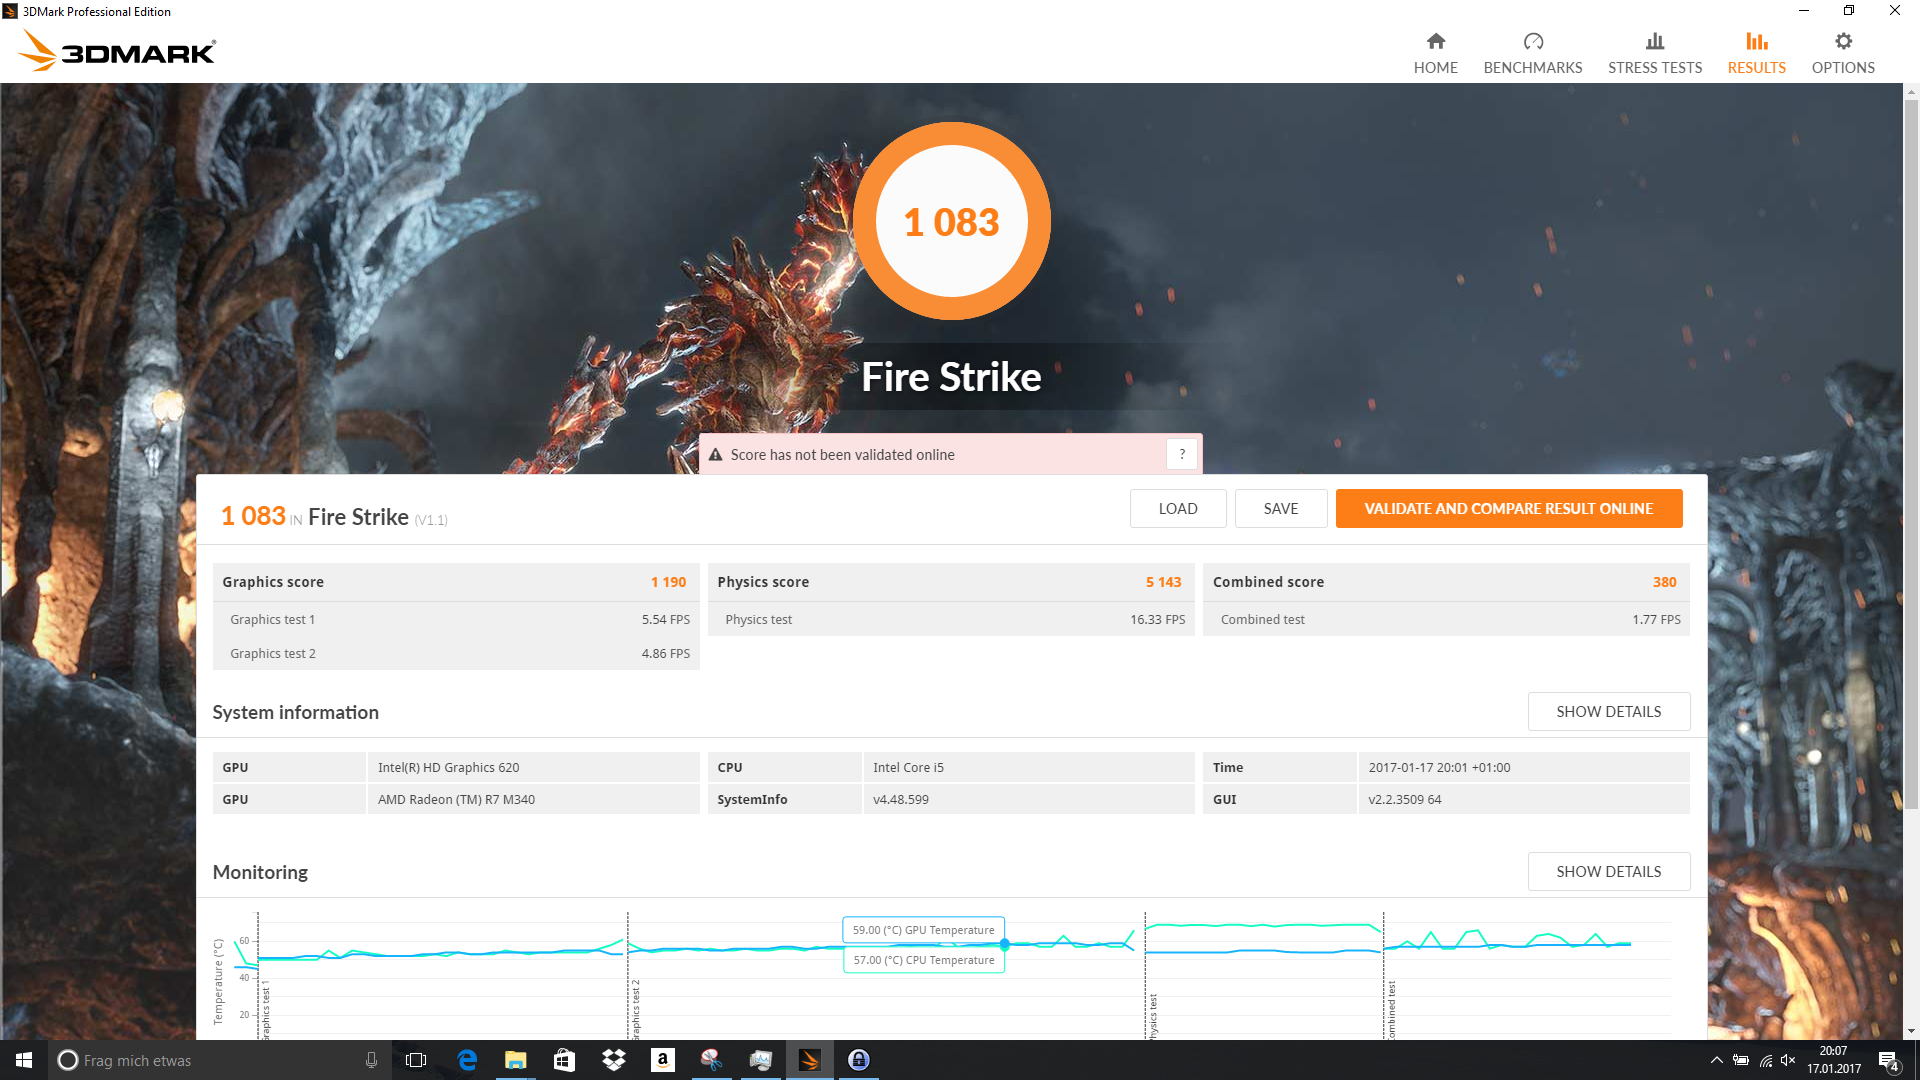
| 3DMark Fire Strike Score | 1083 pontos | |
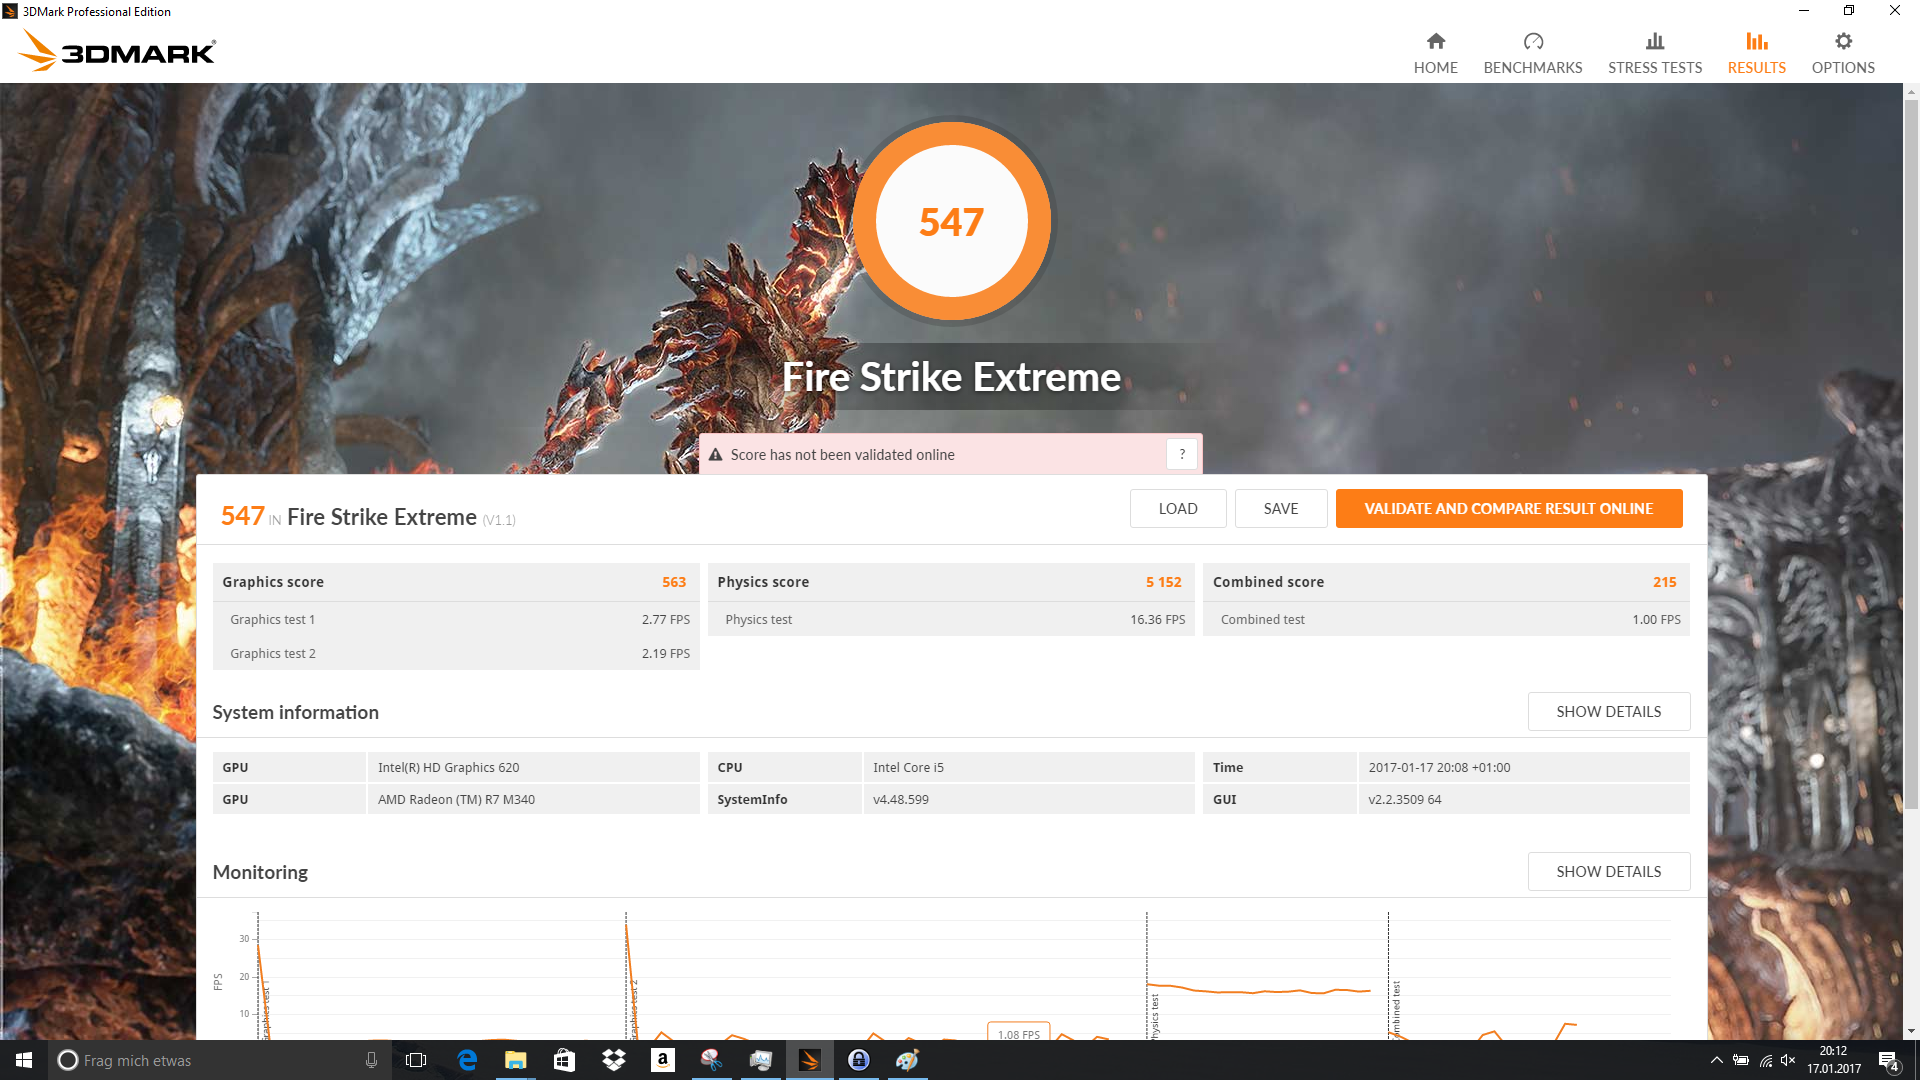
| 3DMark Fire Strike Extreme Score | 547 pontos | |
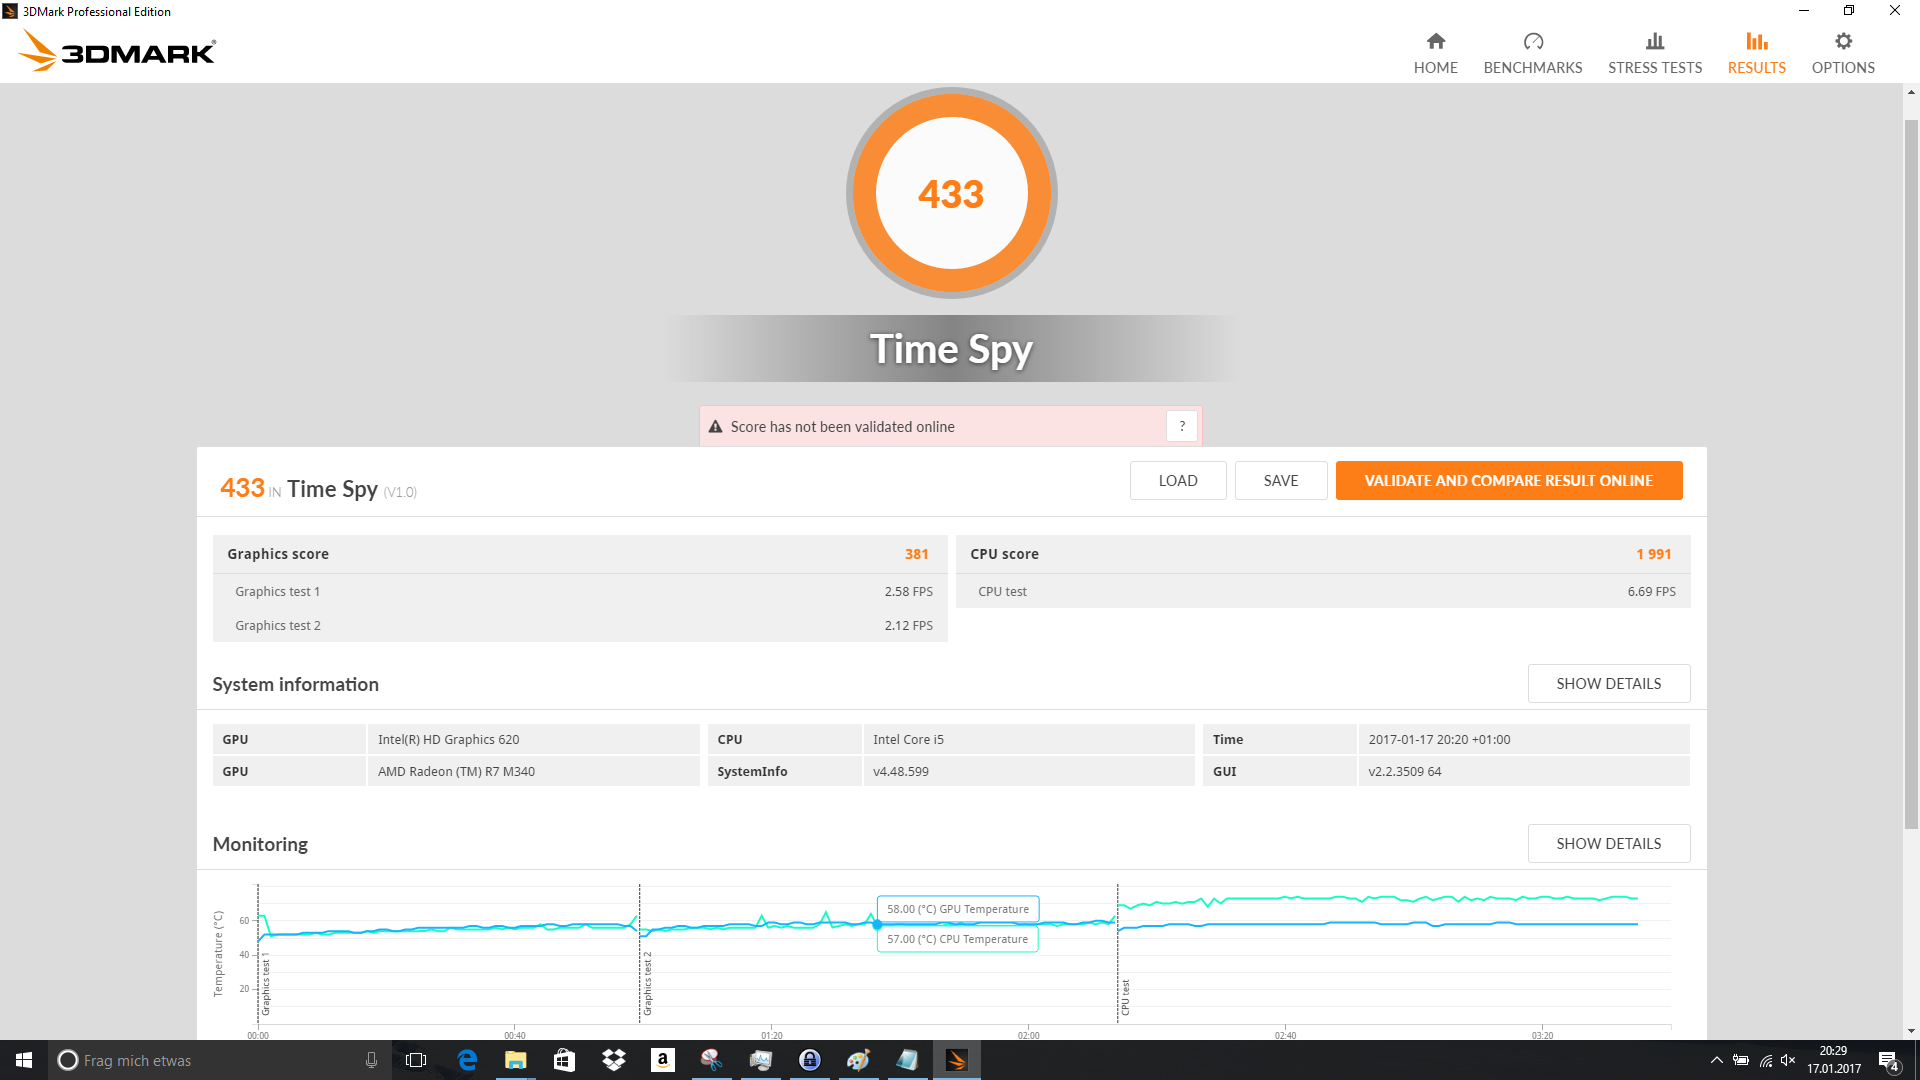
| 3DMark Time Spy Score | 433 pontos | |
Ajuda | ||
| BioShock Infinite - 1366x768 Medium Preset | |
| Acer Aspire E5-575G-549D | |
| Acer Aspire F15 F5-573G-53V1 | |
| Lenovo ThinkPad E470-20H2S00400 | |
| Lenovo IdeaPad 510-15IKB 80SV0087GE | |
| HP Pavilion 15-aw004ng W8Y60EA | |
| HP Pavilion 17-x110ng | |
| Rise of the Tomb Raider - 1366x768 Medium Preset AF:2x | |
| Acer Aspire F15 F5-573G-53V1 | |
| Acer Aspire E5-575G-549D | |
| HP Pavilion 15-aw004ng W8Y60EA | |
| HP Pavilion 17-x110ng | |
| Battlefield 4 - 1366x768 Medium Preset | |
| Acer Aspire F15 F5-573G-53V1 | |
| Acer Aspire E5-575G-549D | |
| Lenovo ThinkPad E470-20H2S00400 | |
| HP Pavilion 15-aw004ng W8Y60EA | |
| HP Pavilion 17-x110ng | |
| baixo | média | alto | ultra | |
|---|---|---|---|---|
| BioShock Infinite (2013) | 73.6 | 42 | 32.6 | 9.6 |
| Battlefield 4 (2013) | 51.2 | 36.9 | 23.3 | 7.6 |
| GTA V (2015) | 50.7 | 43.7 | 12.2 | |
| The Witcher 3 (2015) | 21.1 | 13.4 | 6.9 | |
| Anno 2205 (2015) | 35.3 | 17.1 | 7 | |
| Rainbow Six Siege (2015) | 54 | 42.9 | 26.9 | 20.3 |
| Rise of the Tomb Raider (2016) | 22 | 11.9 | 6 | 3.5 |
| XCOM 2 (2016) | 22.8 | 7.9 | 5.2 | 4.9 |
| Far Cry Primal (2016) | 20.6 | 9.9 | 8.9 | |
| The Division (2016) | 23.1 | 15.6 | 6.2 | |
| Doom (2016) | 22 | 13 | 8.1 | |
| Overwatch (2016) | 60.5 | 42.6 | 22.3 | 12.4 |
| Deus Ex Mankind Divided (2016) | 13.9 | 10.1 | 5.2 | |
| FIFA 17 (2016) | 61.8 | 59.7 | 34.6 | 29.7 |
| Mafia 3 (2016) | 14 | 8.9 | ||
| Battlefield 1 (2016) | 31.8 | 22.7 | 9.6 | 9.6 |
| Civilization 6 (2016) | 36.4 | 26.1 | 9.5 | |
| Farming Simulator 17 (2016) | 69.7 | 59.3 | 21.1 | |
| Titanfall 2 (2016) | 41.1 | 29.8 | 11.2 | |
| Call of Duty Infinite Warfare (2016) | 26.4 | 22.6 | 12.1 | |
| Dishonored 2 (2016) | 10.9 | 9.2 | ||
| Watch Dogs 2 (2016) | 18.7 | 13.6 | ||
| Resident Evil 7 (2017) | 40.5 | 15.9 |
Barulho
| Ocioso |
| 31 / 31 / 31 dB |
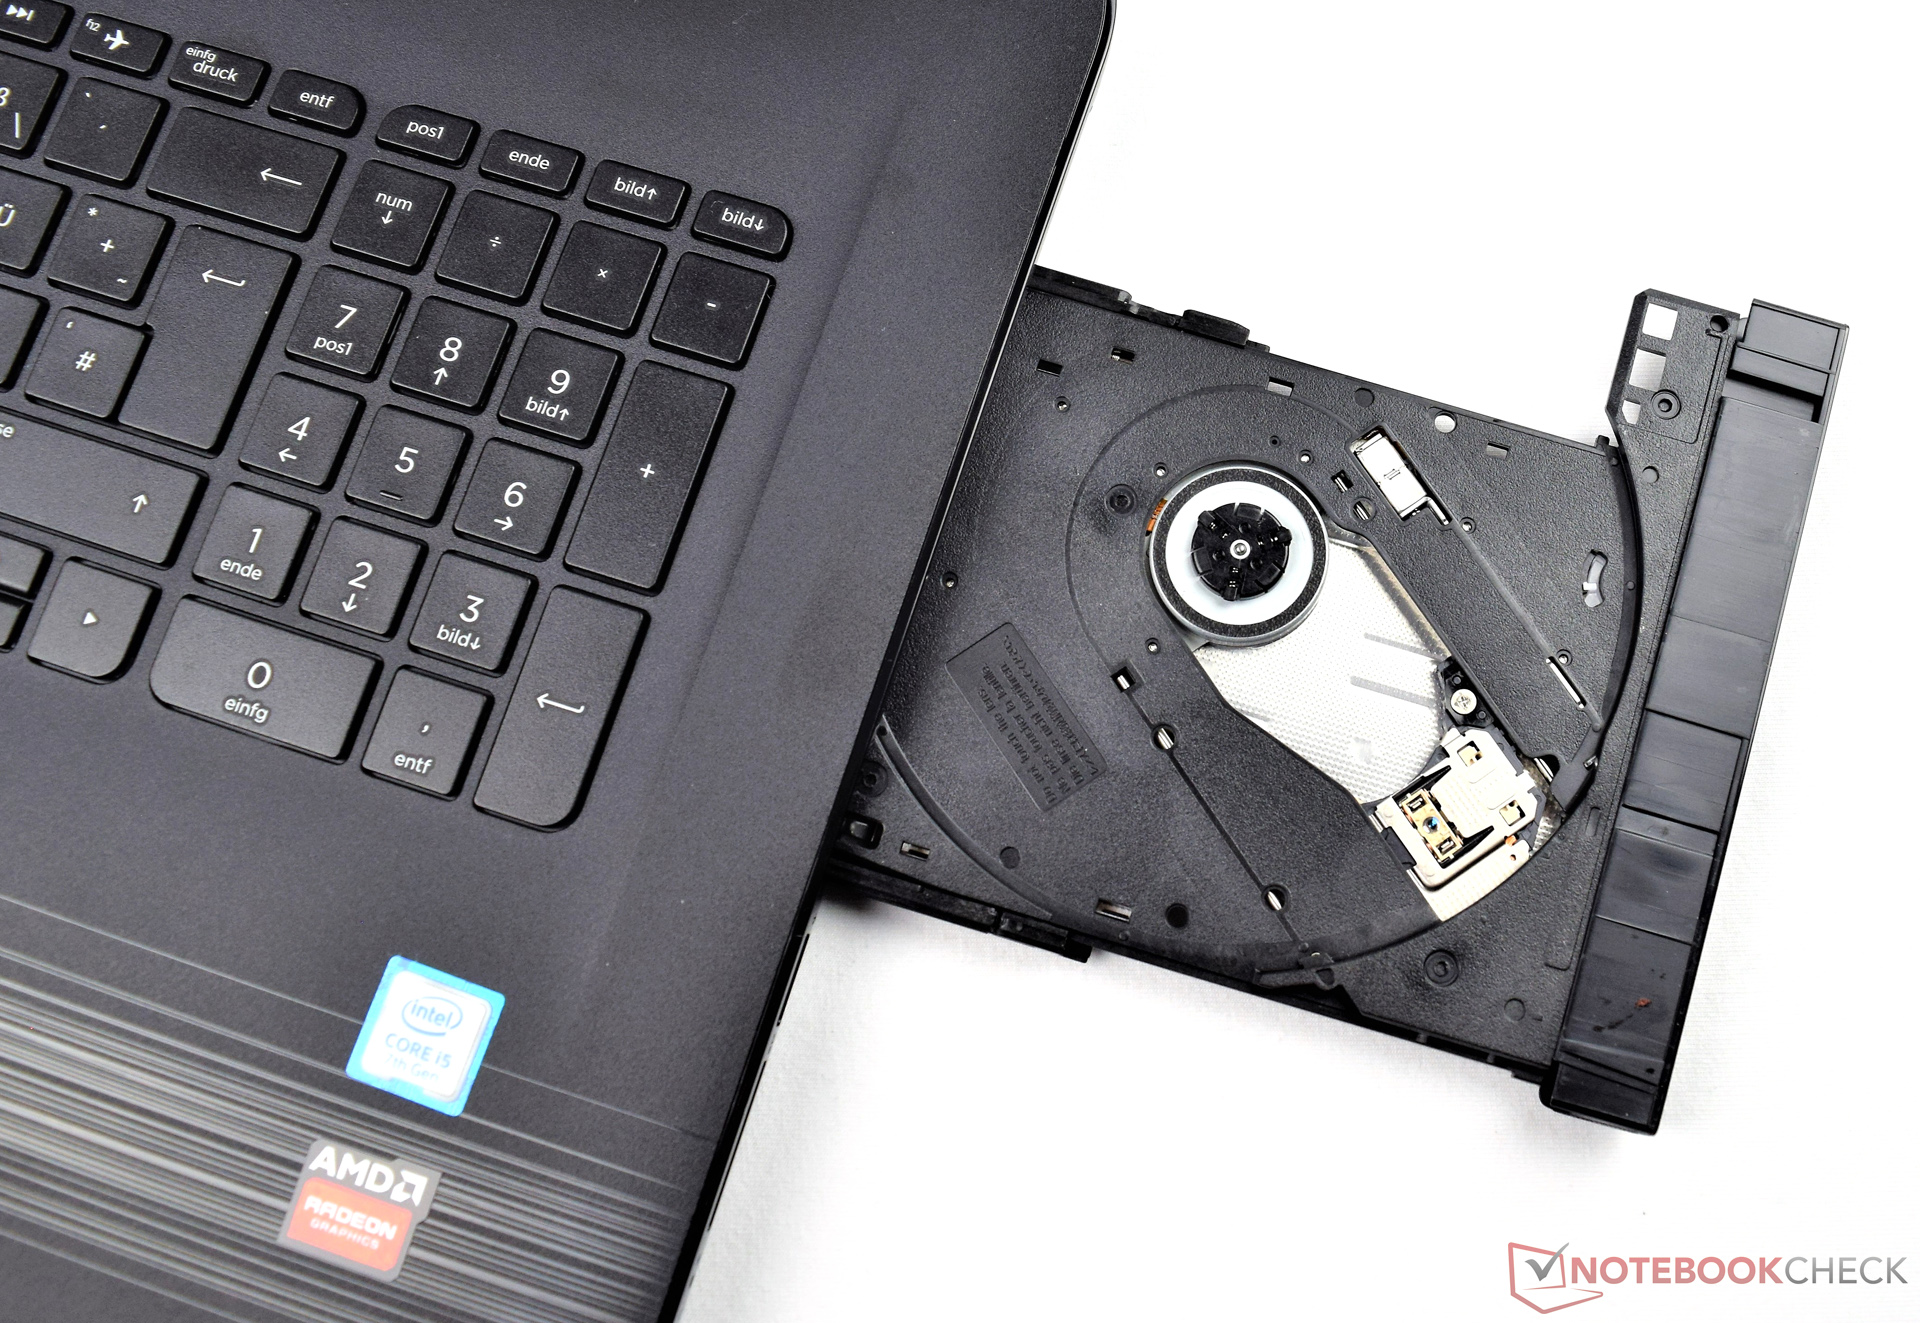
| DVD |
| 35.8 / dB |
| Carga |
| 33.8 / 44.8 dB |
 | ||
30 dB silencioso 40 dB(A) audível 50 dB(A) ruidosamente alto |
||
min: | ||
| HP Pavilion 17-x110ng i5-7200U, Radeon R7 M440 | Acer Aspire E5-575G-549D i5-7200U, GeForce GTX 950M | Lenovo IdeaPad 510-15IKB 80SV0087GE i7-7500U, GeForce 940MX | Acer Aspire F15 F5-573G-53V1 6200U, GeForce GTX 950M | Lenovo ThinkPad E470-20H2S00400 i5-7200U, GeForce 940MX | HP Pavilion 15-aw004ng W8Y60EA A10-9600P, Radeon R8 M445DX | |
|---|---|---|---|---|---|---|
| Noise | 2% | -2% | -3% | 5% | -5% | |
| desligado / ambiente * (dB) | 29 | 28.9 -0% | 31.6 -9% | 31.2 -8% | 29 -0% | 31.2 -8% |
| Idle Minimum * (dB) | 31 | 30.8 1% | 32.6 -5% | 32.4 -5% | 29 6% | 31.7 -2% |
| Idle Average * (dB) | 31 | 30.8 1% | 32.6 -5% | 33.5 -8% | 29 6% | 31.9 -3% |
| Idle Maximum * (dB) | 31 | 30.8 1% | 32.6 -5% | 33.5 -8% | 29 6% | 31.9 -3% |
| Load Average * (dB) | 33.8 | 33.4 1% | 35.3 -4% | 35.2 -4% | 35.6 -5% | 41 -21% |
| Load Maximum * (dB) | 44.8 | 40.1 10% | 37.1 17% | 38.7 14% | 38.5 14% | 42.7 5% |
* ... menor é melhor
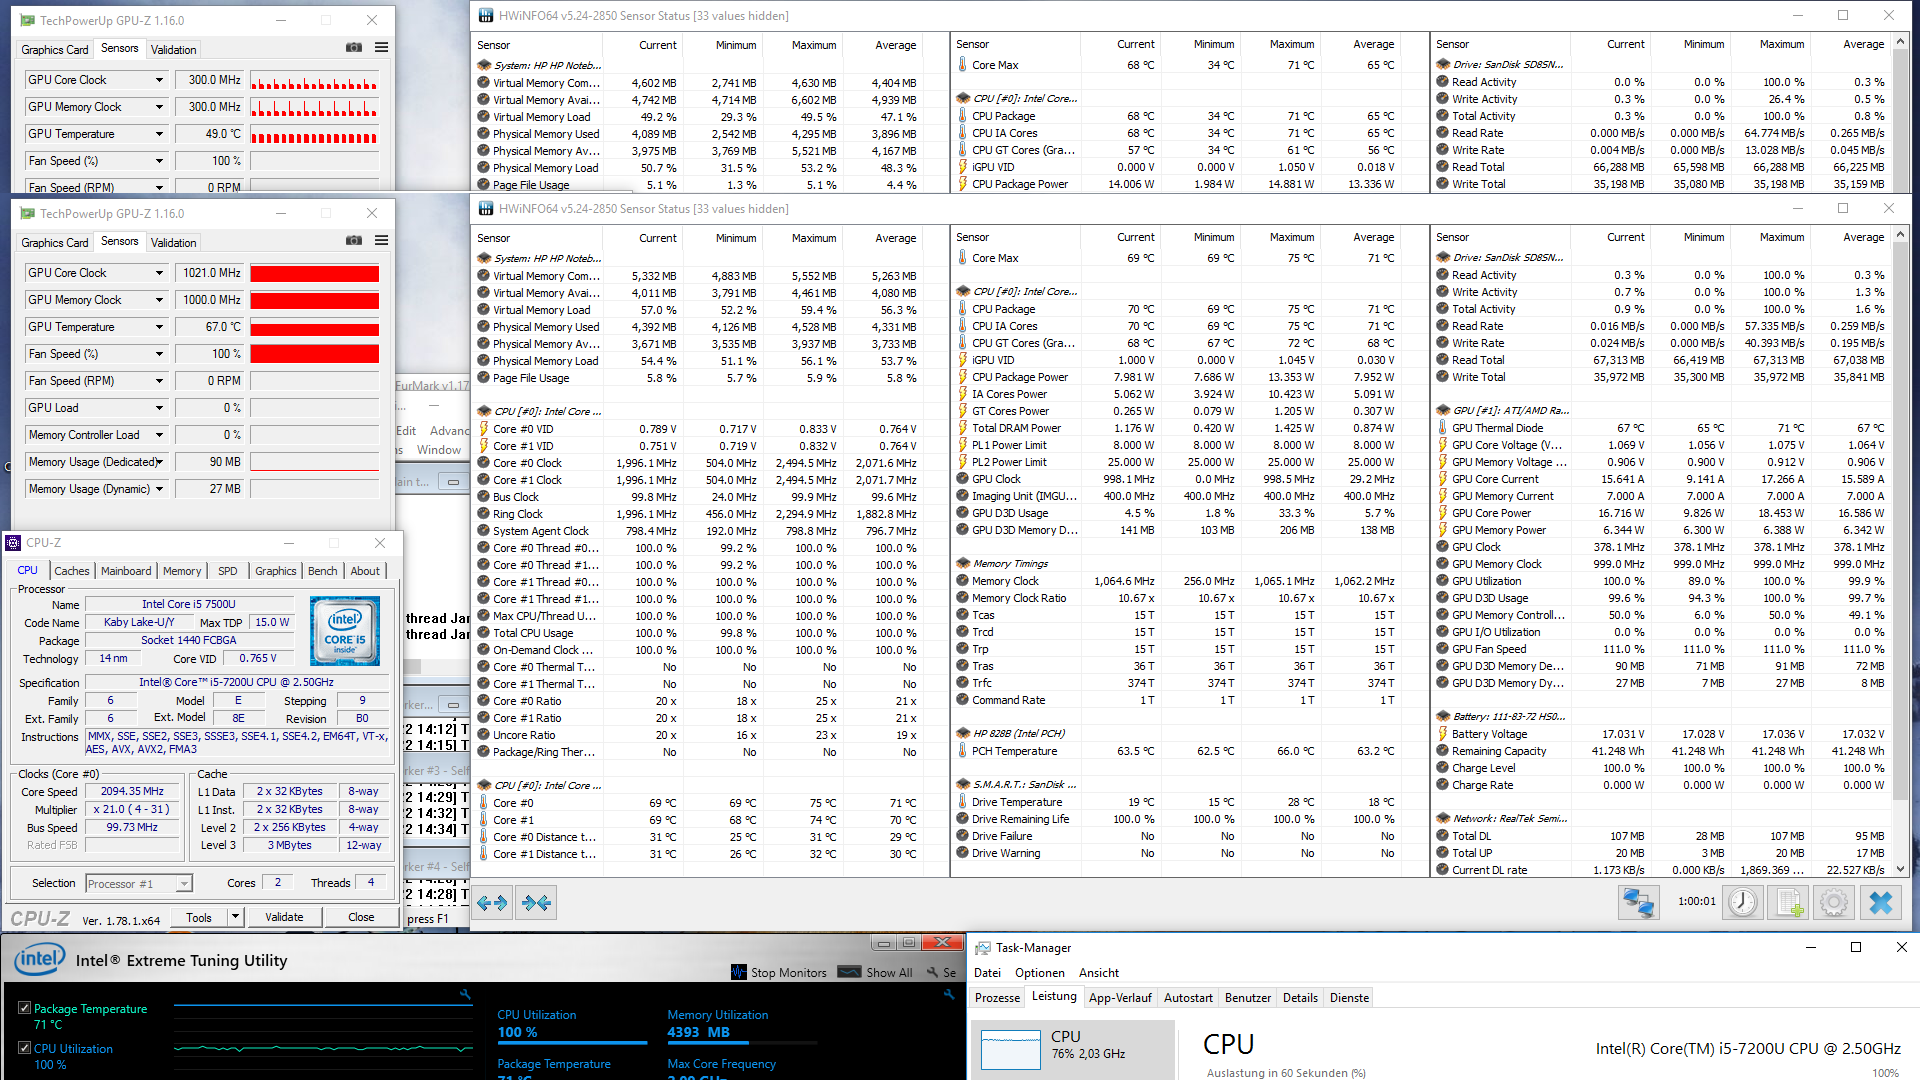
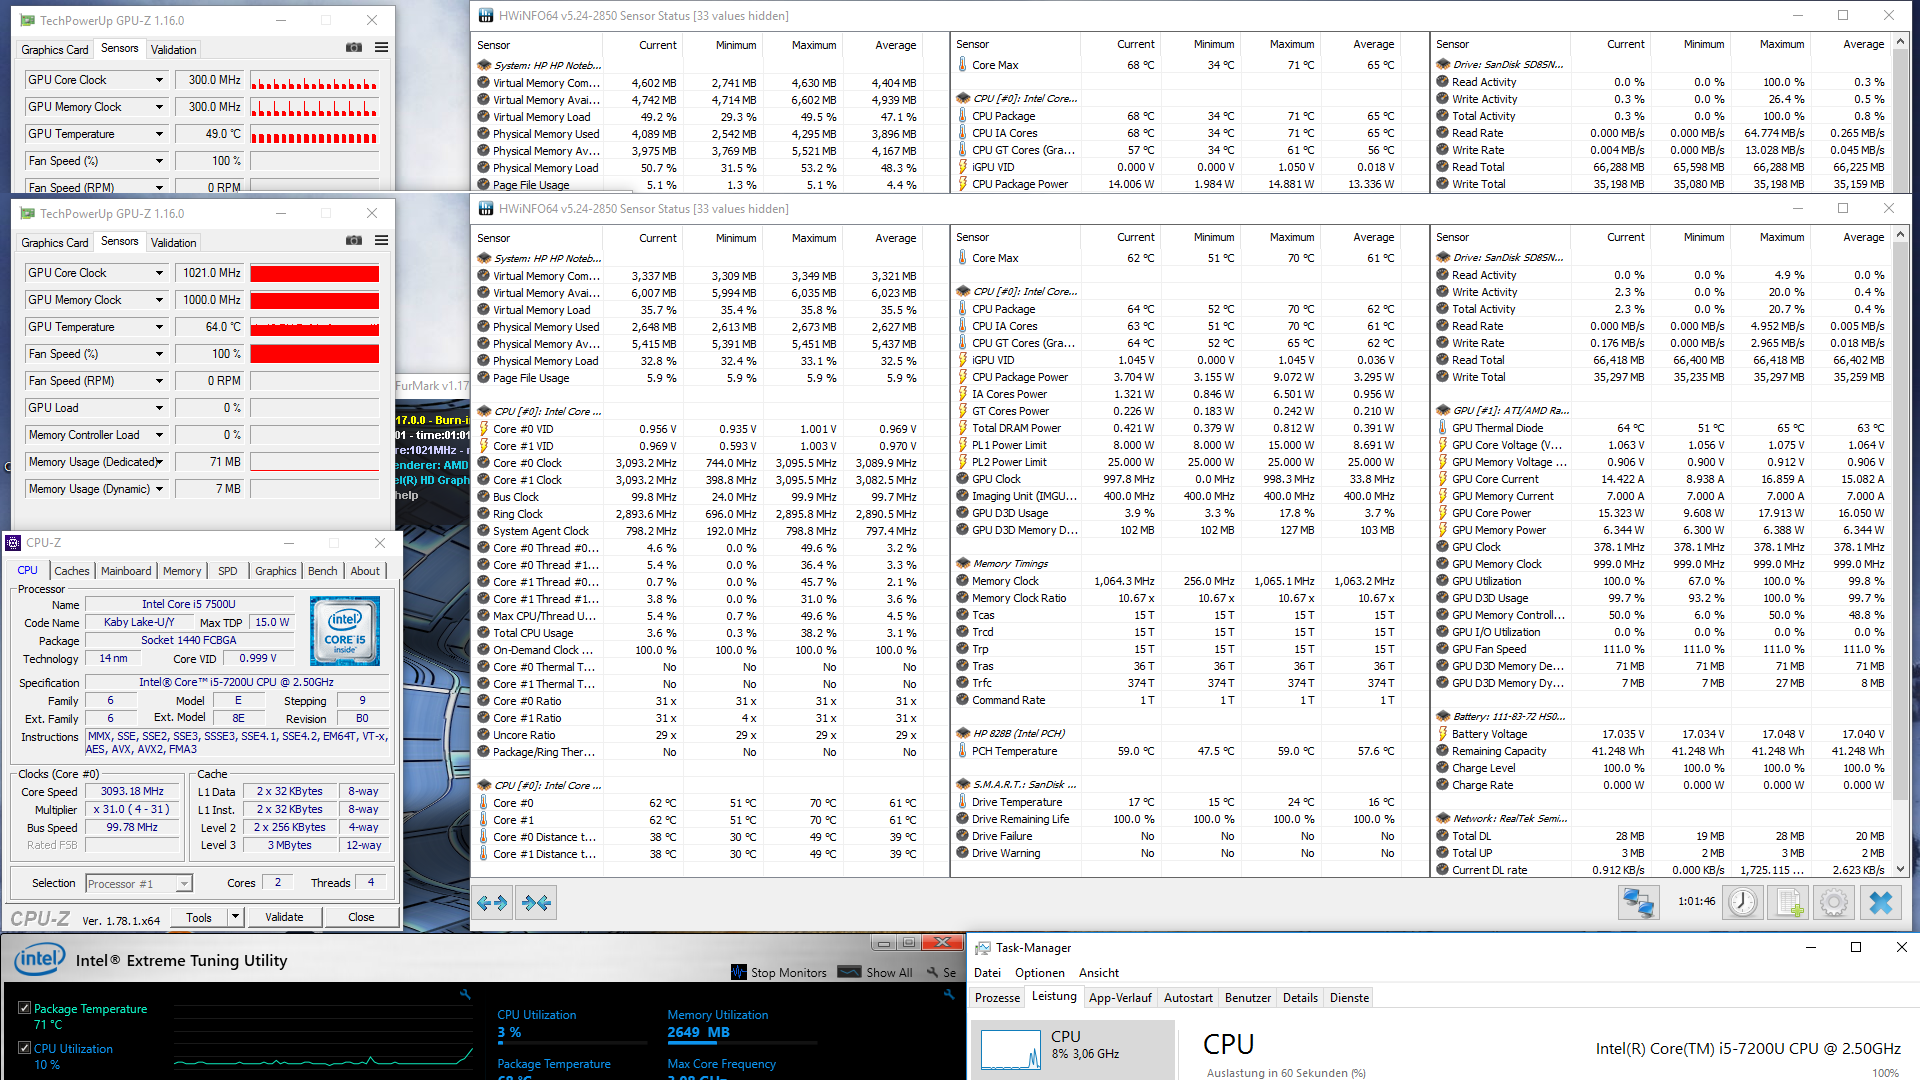
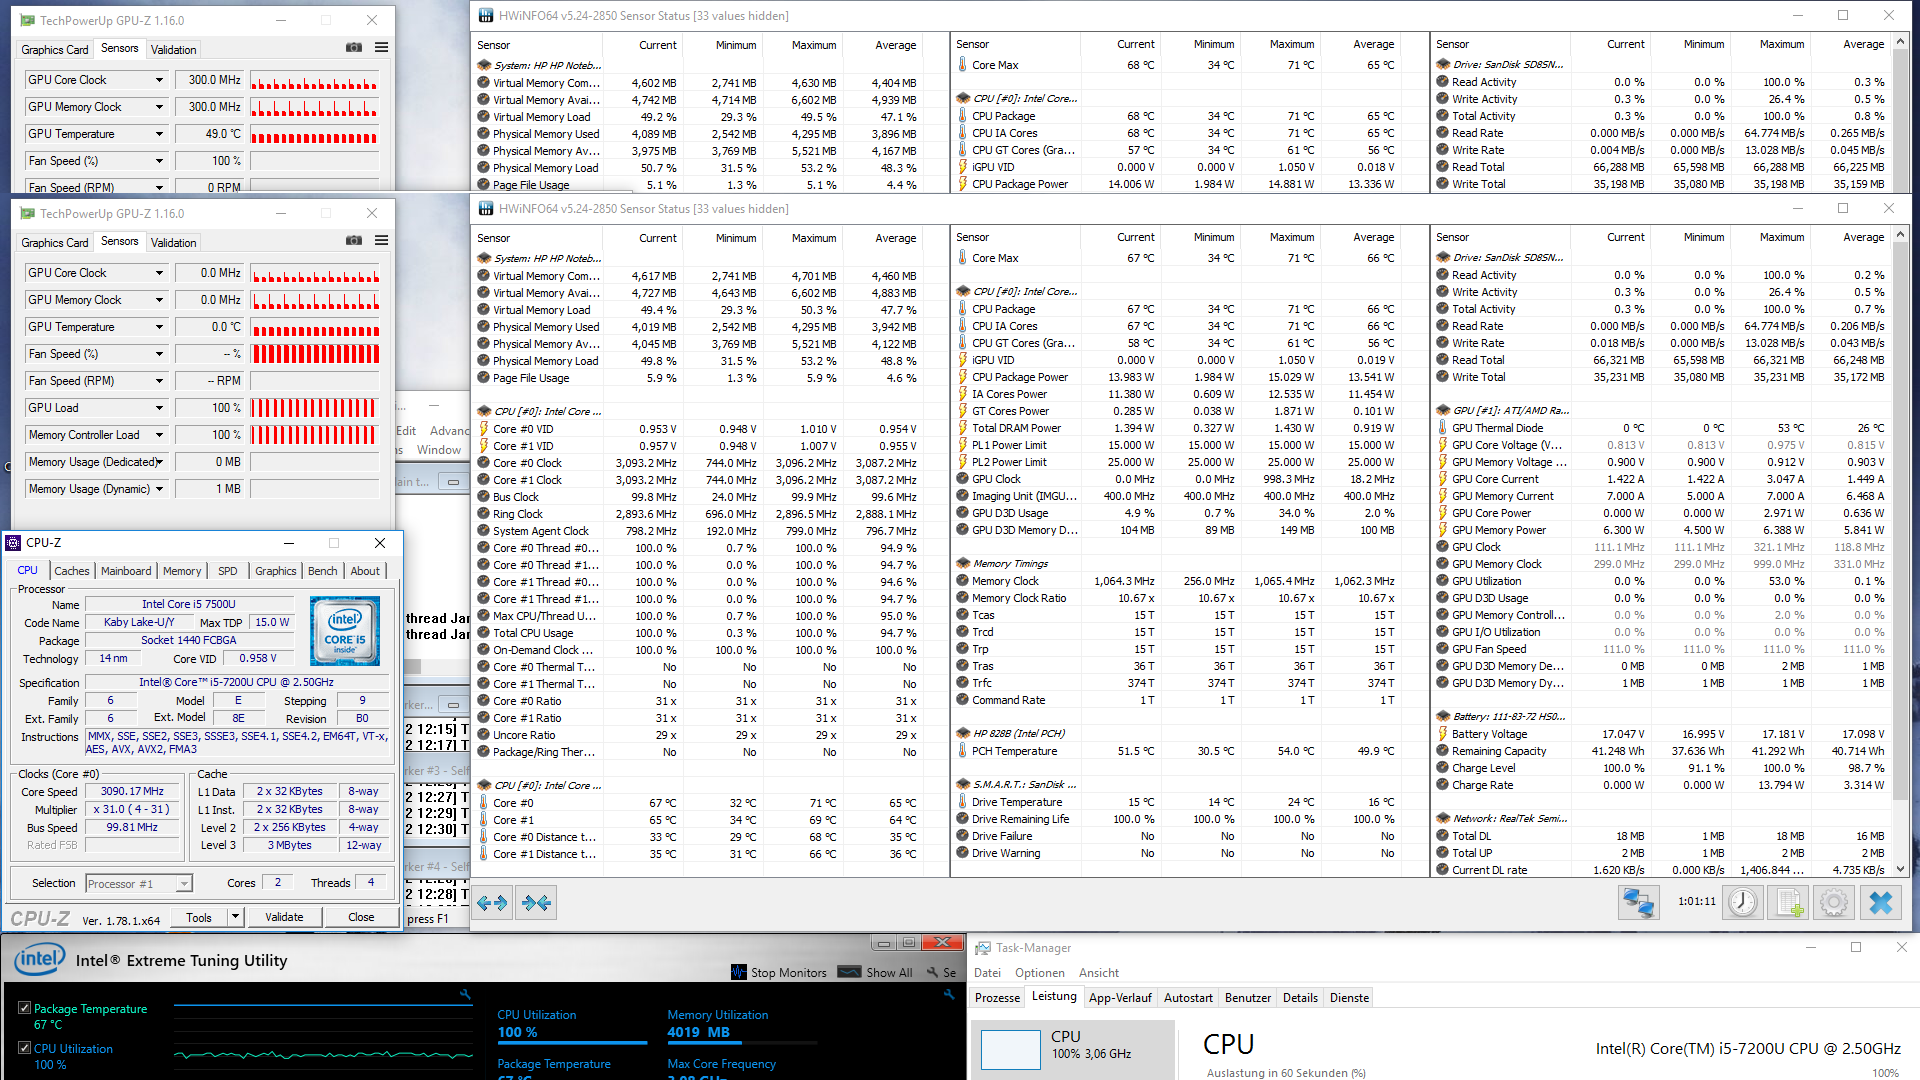
(±) A temperatura máxima no lado superior é 40.3 °C / 105 F, em comparação com a média de 36.8 °C / 98 F , variando de 21 a 71 °C para a classe Multimedia.
(-) A parte inferior aquece até um máximo de 46.1 °C / 115 F, em comparação com a média de 39.1 °C / 102 F
(+) Em uso inativo, a temperatura média para o lado superior é 23 °C / 73 F, em comparação com a média do dispositivo de 31.3 °C / ### class_avg_f### F.
(+) Os apoios para as mãos e o touchpad são mais frios que a temperatura da pele, com um máximo de 31.3 °C / 88.3 F e, portanto, são frios ao toque.
(-) A temperatura média da área do apoio para as mãos de dispositivos semelhantes foi 28.7 °C / 83.7 F (-2.6 °C / -4.6 F).
| HP Pavilion 17-x110ng i5-7200U, Radeon R7 M440 | Acer Aspire E5-575G-549D i5-7200U, GeForce GTX 950M | Lenovo IdeaPad 510-15IKB 80SV0087GE i7-7500U, GeForce 940MX | Acer Aspire F15 F5-573G-53V1 6200U, GeForce GTX 950M | Lenovo ThinkPad E470-20H2S00400 i5-7200U, GeForce 940MX | HP Pavilion 15-aw004ng W8Y60EA A10-9600P, Radeon R8 M445DX | |
|---|---|---|---|---|---|---|
| Heat | -29% | 3% | -27% | -12% | 1% | |
| Maximum Upper Side * (°C) | 40.3 | 48.1 -19% | 38.3 5% | 46.6 -16% | 43.8 -9% | 33.4 17% |
| Maximum Bottom * (°C) | 46.1 | 60.8 -32% | 36 22% | 65.4 -42% | 53 -15% | 32.9 29% |
| Idle Upper Side * (°C) | 23.8 | 30.8 -29% | 24.9 -5% | 28.9 -21% | 25.9 -9% | 27.7 -16% |
| Idle Bottom * (°C) | 23.4 | 31.9 -36% | 25.6 -9% | 29.8 -27% | 27.1 -16% | 29.4 -26% |
* ... menor é melhor
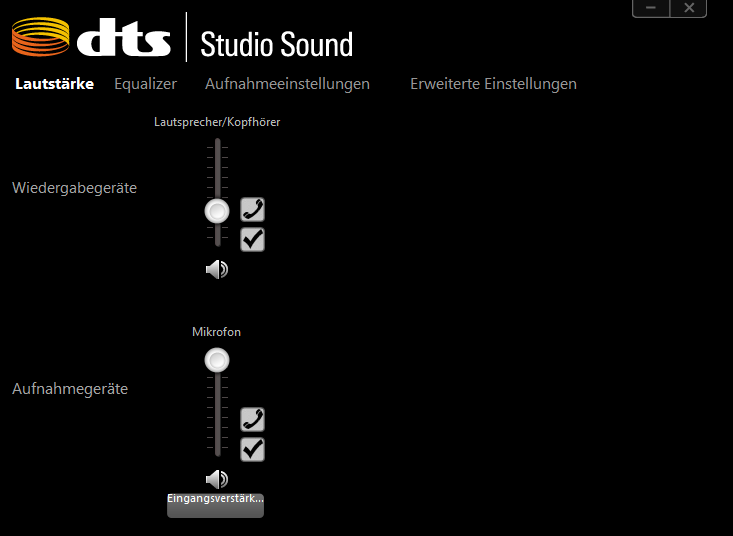
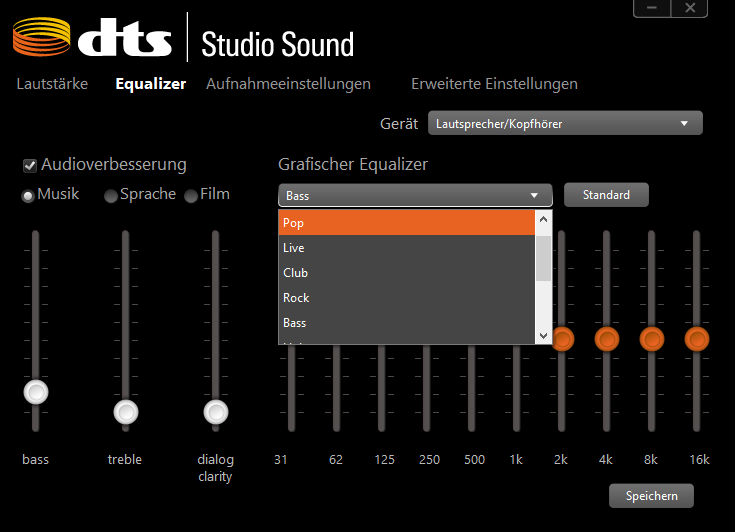
HP Pavilion 17-x110ng análise de áudio
(-) | alto-falantes não muito altos (###valor### dB)
Graves 100 - 315Hz
(±) | graves reduzidos - em média 13.2% menor que a mediana
(+) | o baixo é linear (6.7% delta para a frequência anterior)
Médios 400 - 2.000 Hz
(+) | médios equilibrados - apenas 2.2% longe da mediana
(+) | médios são lineares (5.9% delta para frequência anterior)
Altos 2 - 16 kHz
(+) | agudos equilibrados - apenas 4.5% longe da mediana
(+) | os máximos são lineares (6.6% delta da frequência anterior)
Geral 100 - 16.000 Hz
(±) | a linearidade do som geral é média (16.5% diferença em relação à mediana)
Comparado com a mesma classe
» 43% de todos os dispositivos testados nesta classe foram melhores, 7% semelhantes, 50% piores
» O melhor teve um delta de 5%, a média foi 17%, o pior foi 45%
Comparado com todos os dispositivos testados
» 28% de todos os dispositivos testados foram melhores, 6% semelhantes, 66% piores
» O melhor teve um delta de 4%, a média foi 23%, o pior foi 134%
Apple MacBook 12 (Early 2016) 1.1 GHz análise de áudio
(+) | os alto-falantes podem tocar relativamente alto (###valor### dB)
Graves 100 - 315Hz
(±) | graves reduzidos - em média 11.3% menor que a mediana
(±) | a linearidade dos graves é média (14.2% delta para a frequência anterior)
Médios 400 - 2.000 Hz
(+) | médios equilibrados - apenas 2.4% longe da mediana
(+) | médios são lineares (5.5% delta para frequência anterior)
Altos 2 - 16 kHz
(+) | agudos equilibrados - apenas 2% longe da mediana
(+) | os máximos são lineares (4.5% delta da frequência anterior)
Geral 100 - 16.000 Hz
(+) | o som geral é linear (10.2% diferença em relação à mediana)
Comparado com a mesma classe
» 7% de todos os dispositivos testados nesta classe foram melhores, 2% semelhantes, 90% piores
» O melhor teve um delta de 5%, a média foi 18%, o pior foi 53%
Comparado com todos os dispositivos testados
» 5% de todos os dispositivos testados foram melhores, 1% semelhantes, 94% piores
» O melhor teve um delta de 4%, a média foi 23%, o pior foi 134%
| desligado | |
| Ocioso | |
| Carga |
|
Key:
min: | |
| HP Pavilion 17-x110ng i5-7200U, Radeon R7 M440 | Acer Aspire E5-575G-549D i5-7200U, GeForce GTX 950M | Lenovo IdeaPad 510-15IKB 80SV0087GE i7-7500U, GeForce 940MX | Acer Aspire F15 F5-573G-53V1 6200U, GeForce GTX 950M | Lenovo ThinkPad E470-20H2S00400 i5-7200U, GeForce 940MX | HP Pavilion 15-aw004ng W8Y60EA A10-9600P, Radeon R8 M445DX | |
|---|---|---|---|---|---|---|
| Power Consumption | -2% | 24% | -19% | 26% | 13% | |
| Idle Minimum * (Watt) | 7.7 | 6 22% | 3.9 49% | 8.3 -8% | 2.7 65% | 5.5 29% |
| Idle Average * (Watt) | 14 | 8.1 42% | 7.4 47% | 12.1 14% | 5.5 61% | 8.2 41% |
| Idle Maximum * (Watt) | 15.1 | 9.8 35% | 9.5 37% | 15.4 -2% | 6.5 57% | 9.5 37% |
| Load Average * (Watt) | 33 | 52.5 -59% | 41 -24% | 56 -70% | 44.2 -34% | 44.5 -35% |
| Load Maximum * (Watt) | 54.6 | 81.6 -49% | 48 12% | 70 -28% | 65.2 -19% | 58 -6% |
* ... menor é melhor
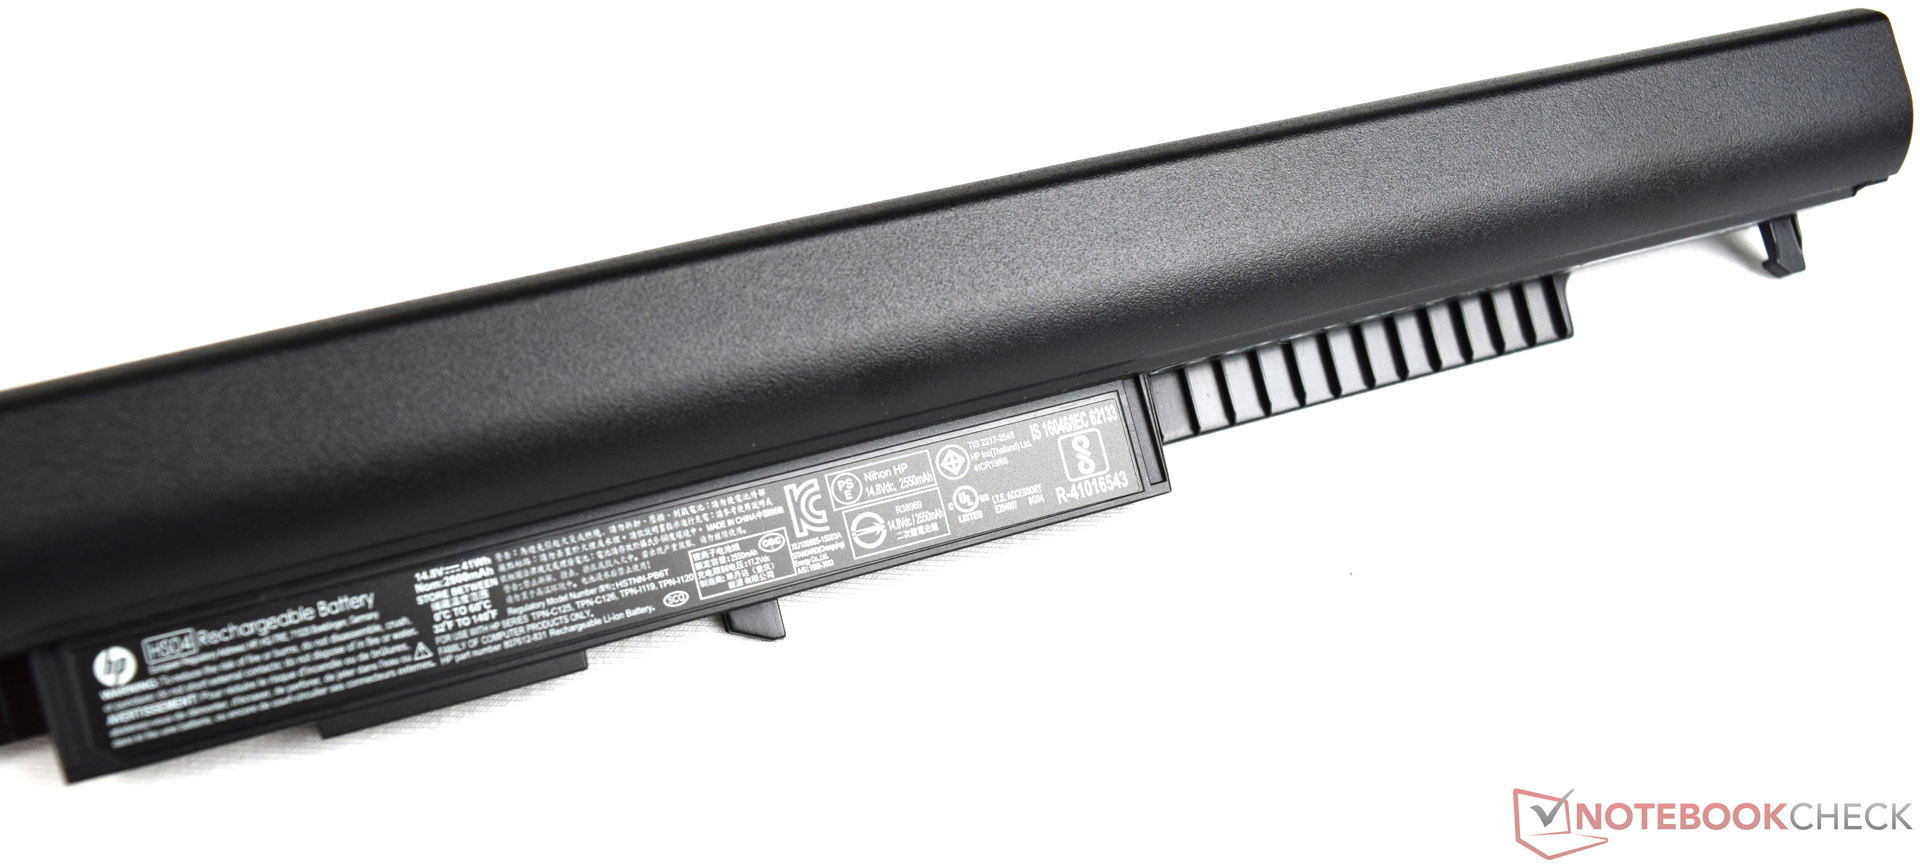
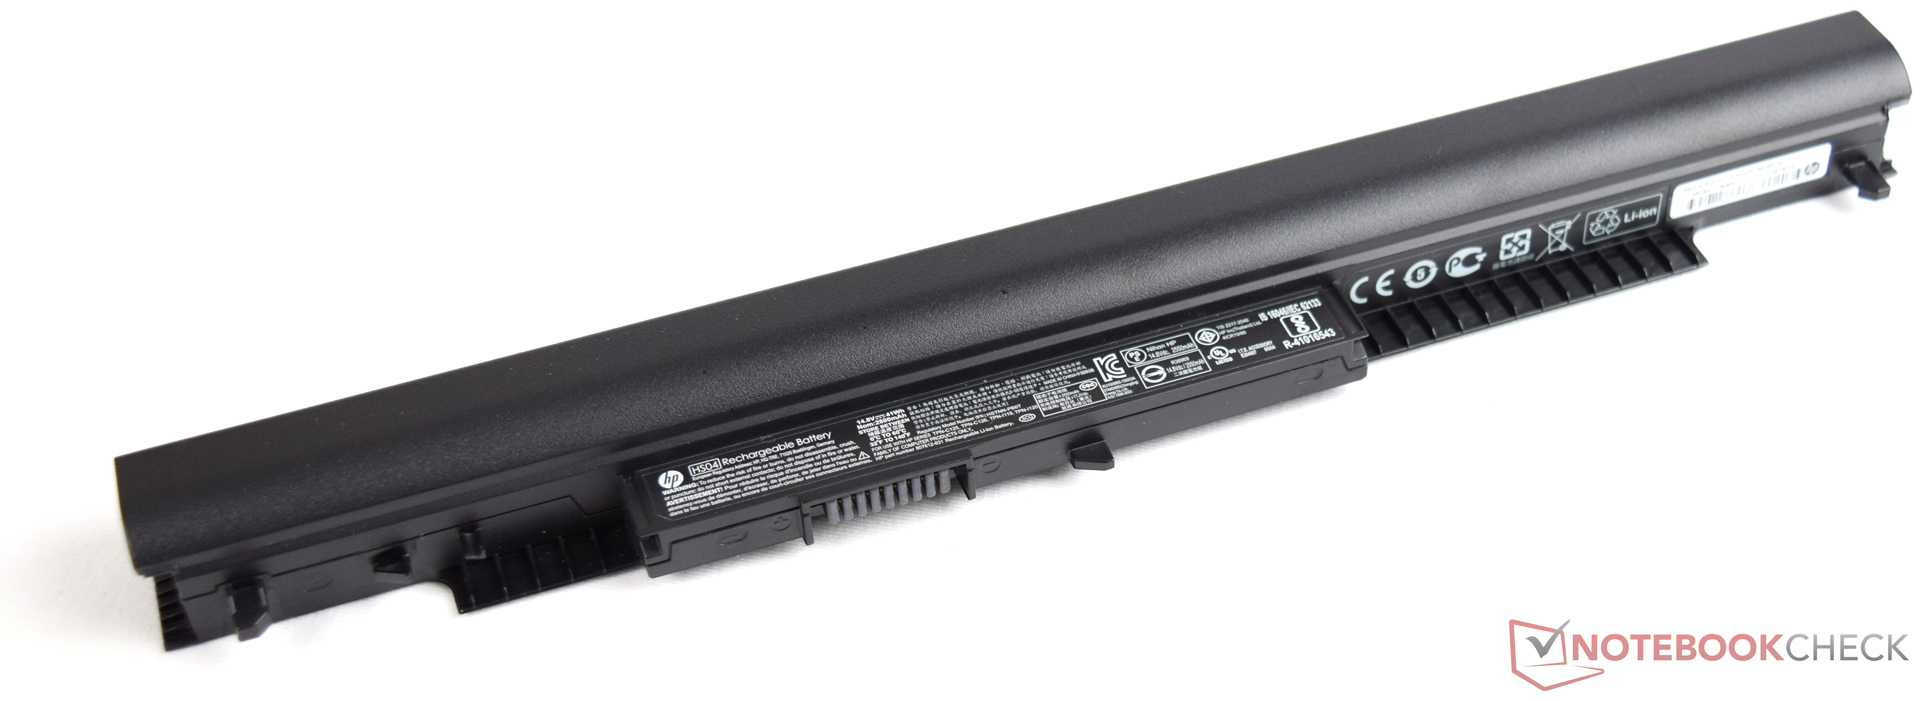


| HP Pavilion 17-x110ng 41 Wh | Acer Aspire E5-575G-549D 62 Wh | Lenovo IdeaPad 510-15IKB 80SV0087GE 30 Wh | Acer Aspire F15 F5-573G-53V1 62 Wh | Lenovo ThinkPad E470-20H2S00400 45 Wh | HP Pavilion 15-aw004ng W8Y60EA 41 Wh | |
|---|---|---|---|---|---|---|
| Duração da bateria | 30% | -21% | 30% | 52% | -12% | |
| Reader / Idle (h) | 8.8 | 12.8 45% | 11.1 26% | 17.4 98% | 9.3 6% | |
| H.264 (h) | 4.8 | 7.7 60% | 5.6 17% | 8.4 75% | 3.2 -33% | |
| WiFi v1.3 (h) | 5.8 | 7.5 29% | 4.6 -21% | 6.4 10% | 5.4 -7% | 4.3 -26% |
| Load (h) | 1.5 | 1.3 -13% | 2.5 67% | 2.1 40% | 1.6 7% |
Pro
Contra
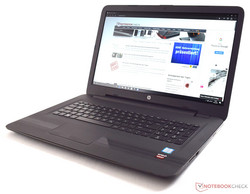
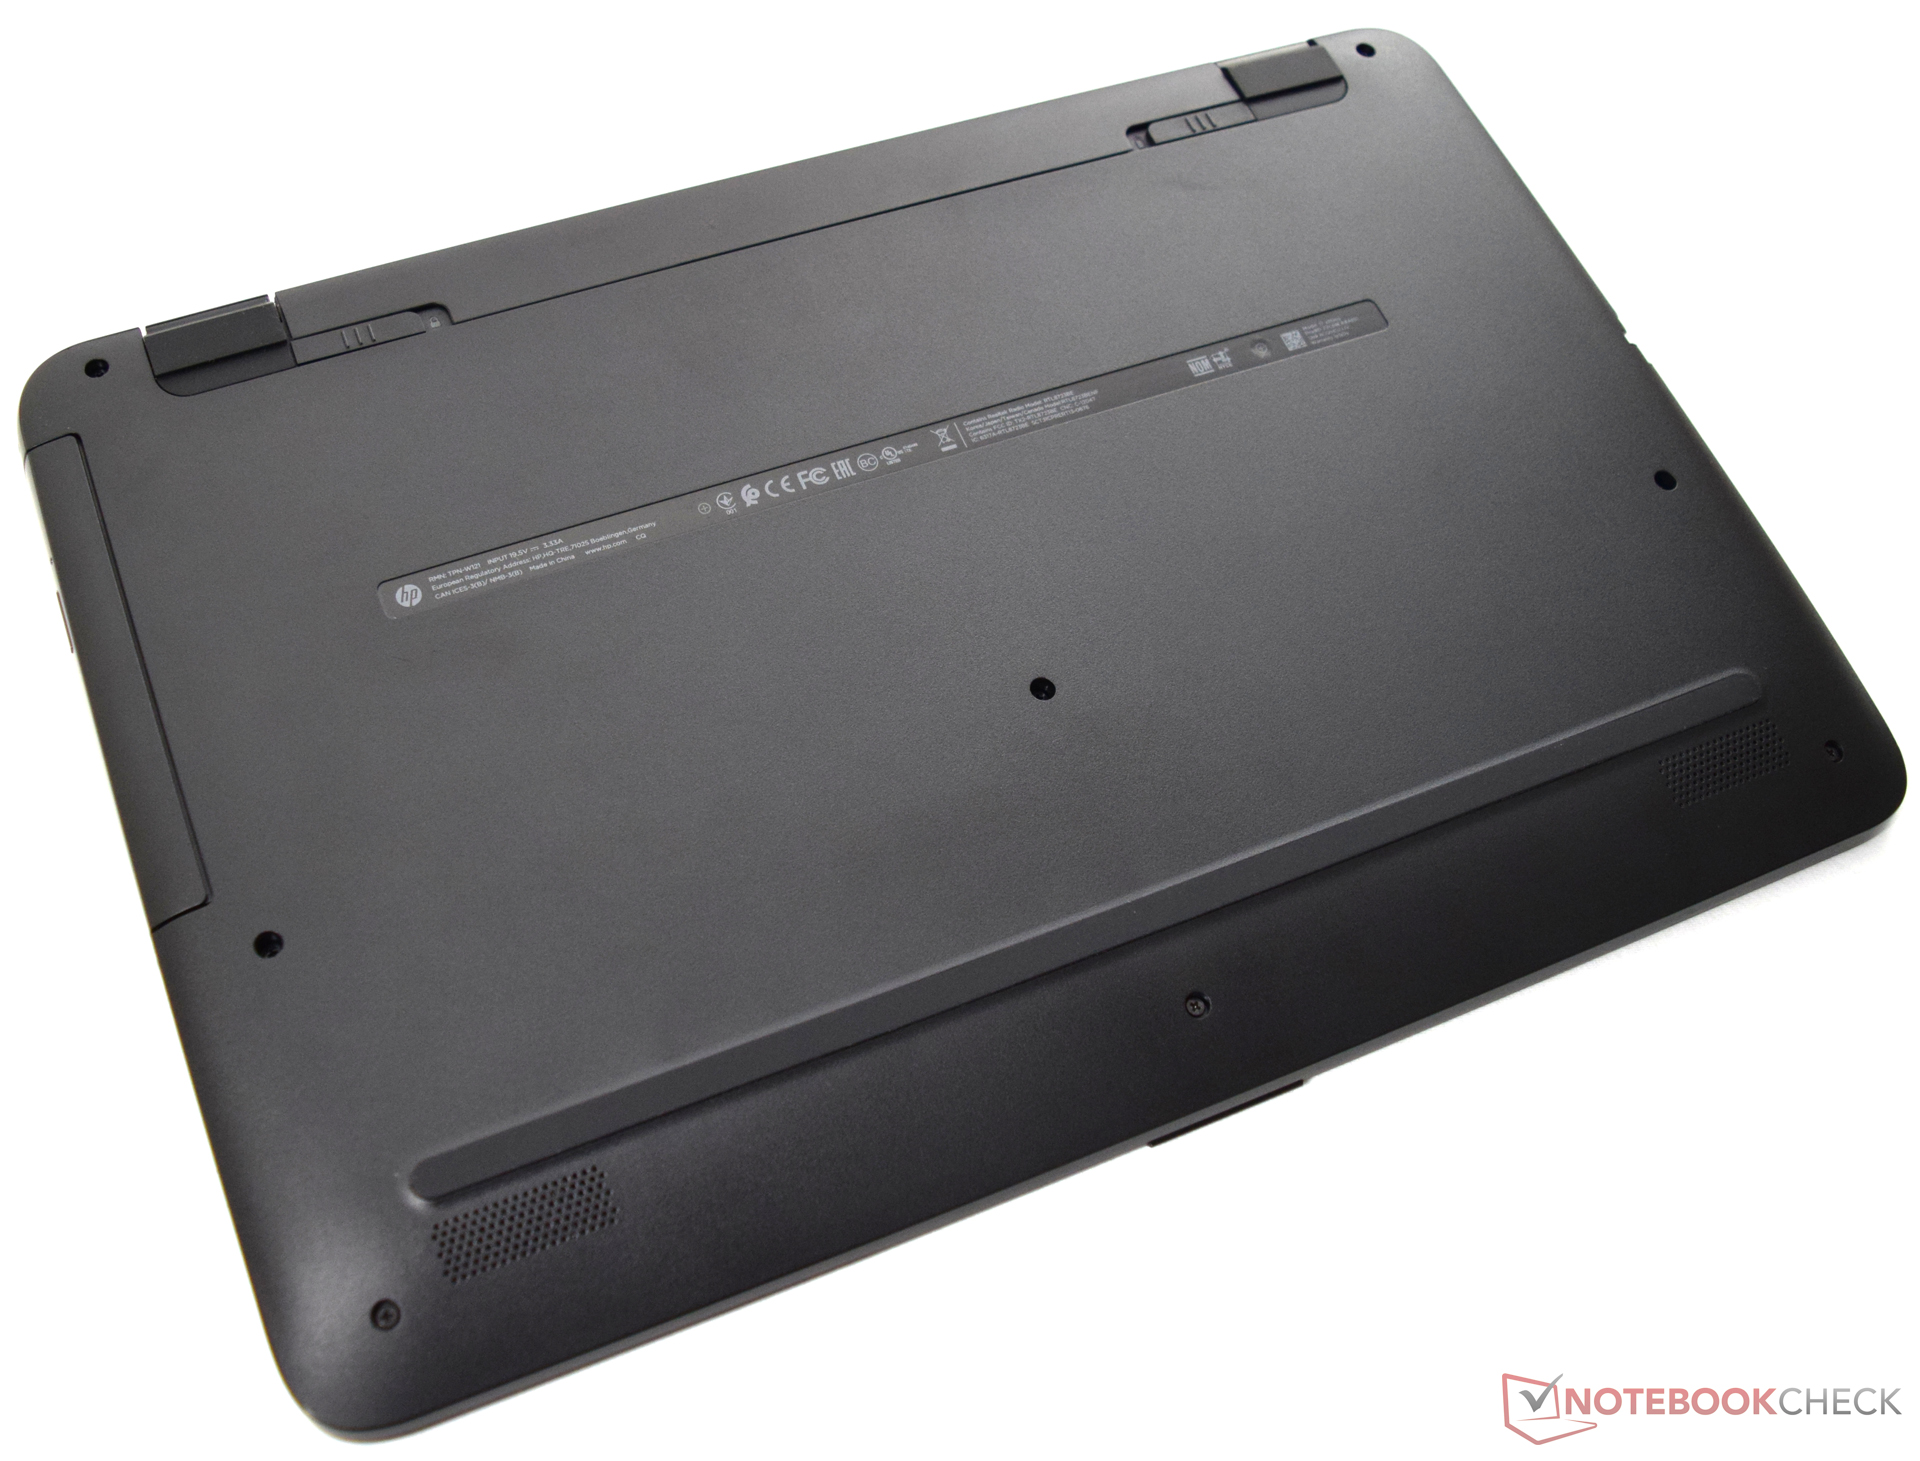
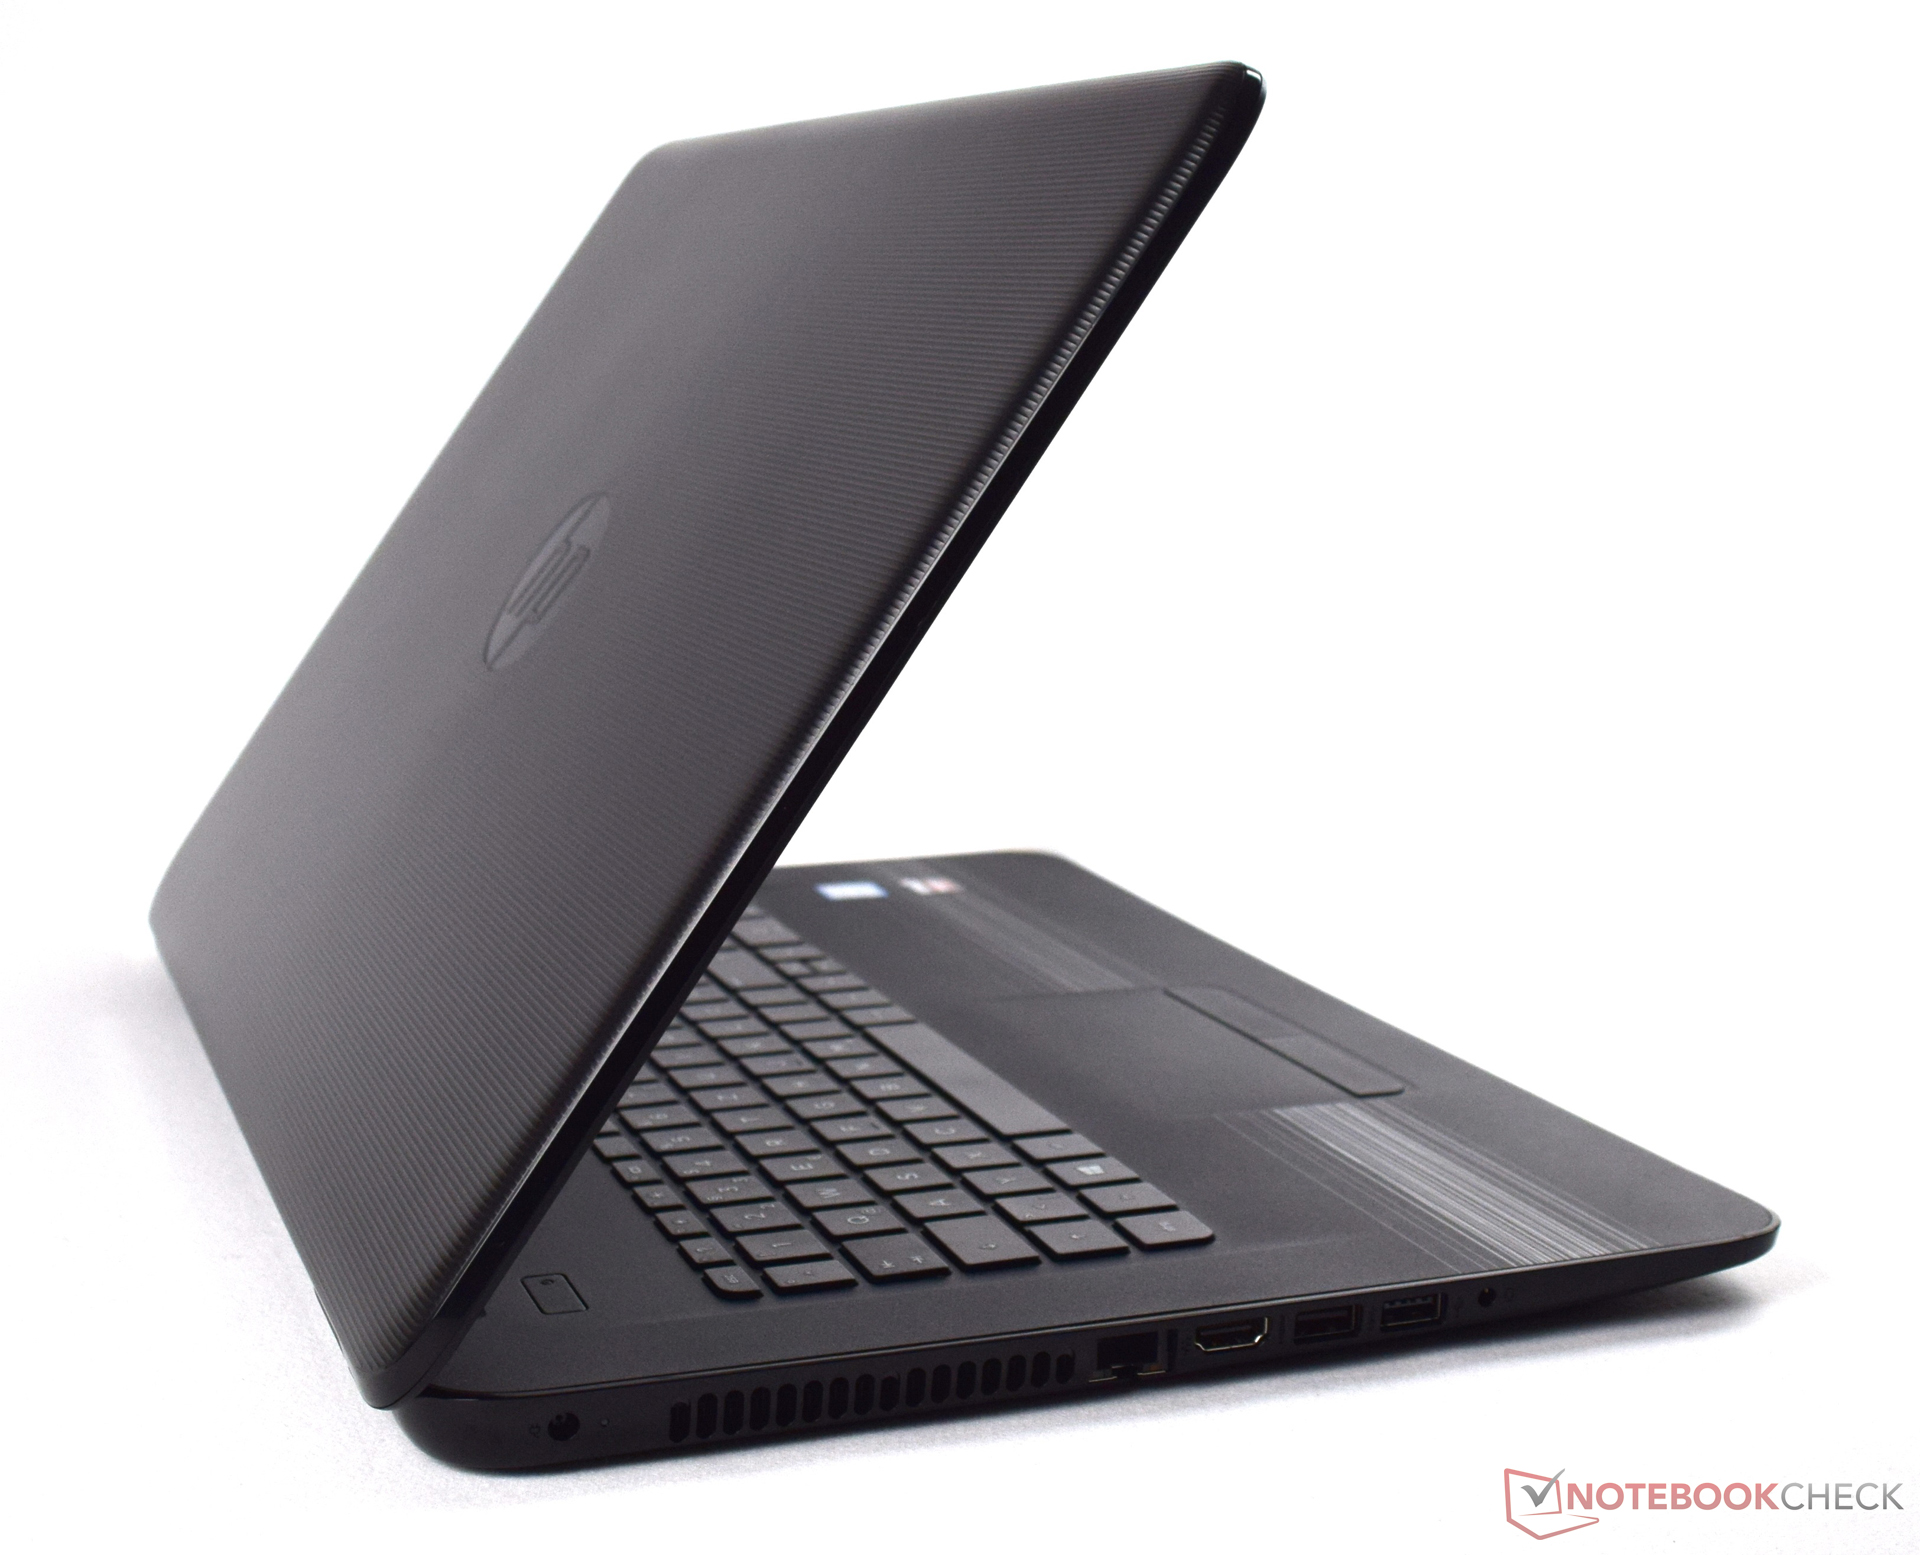
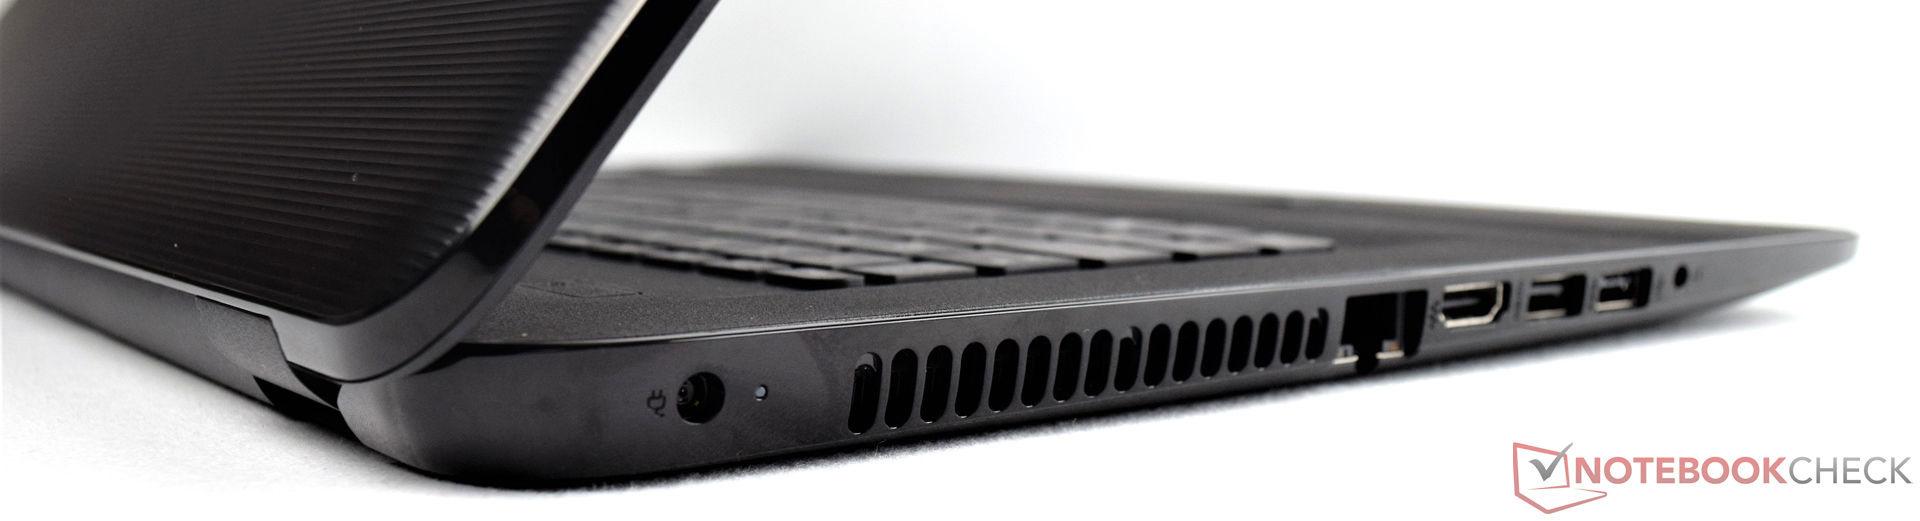
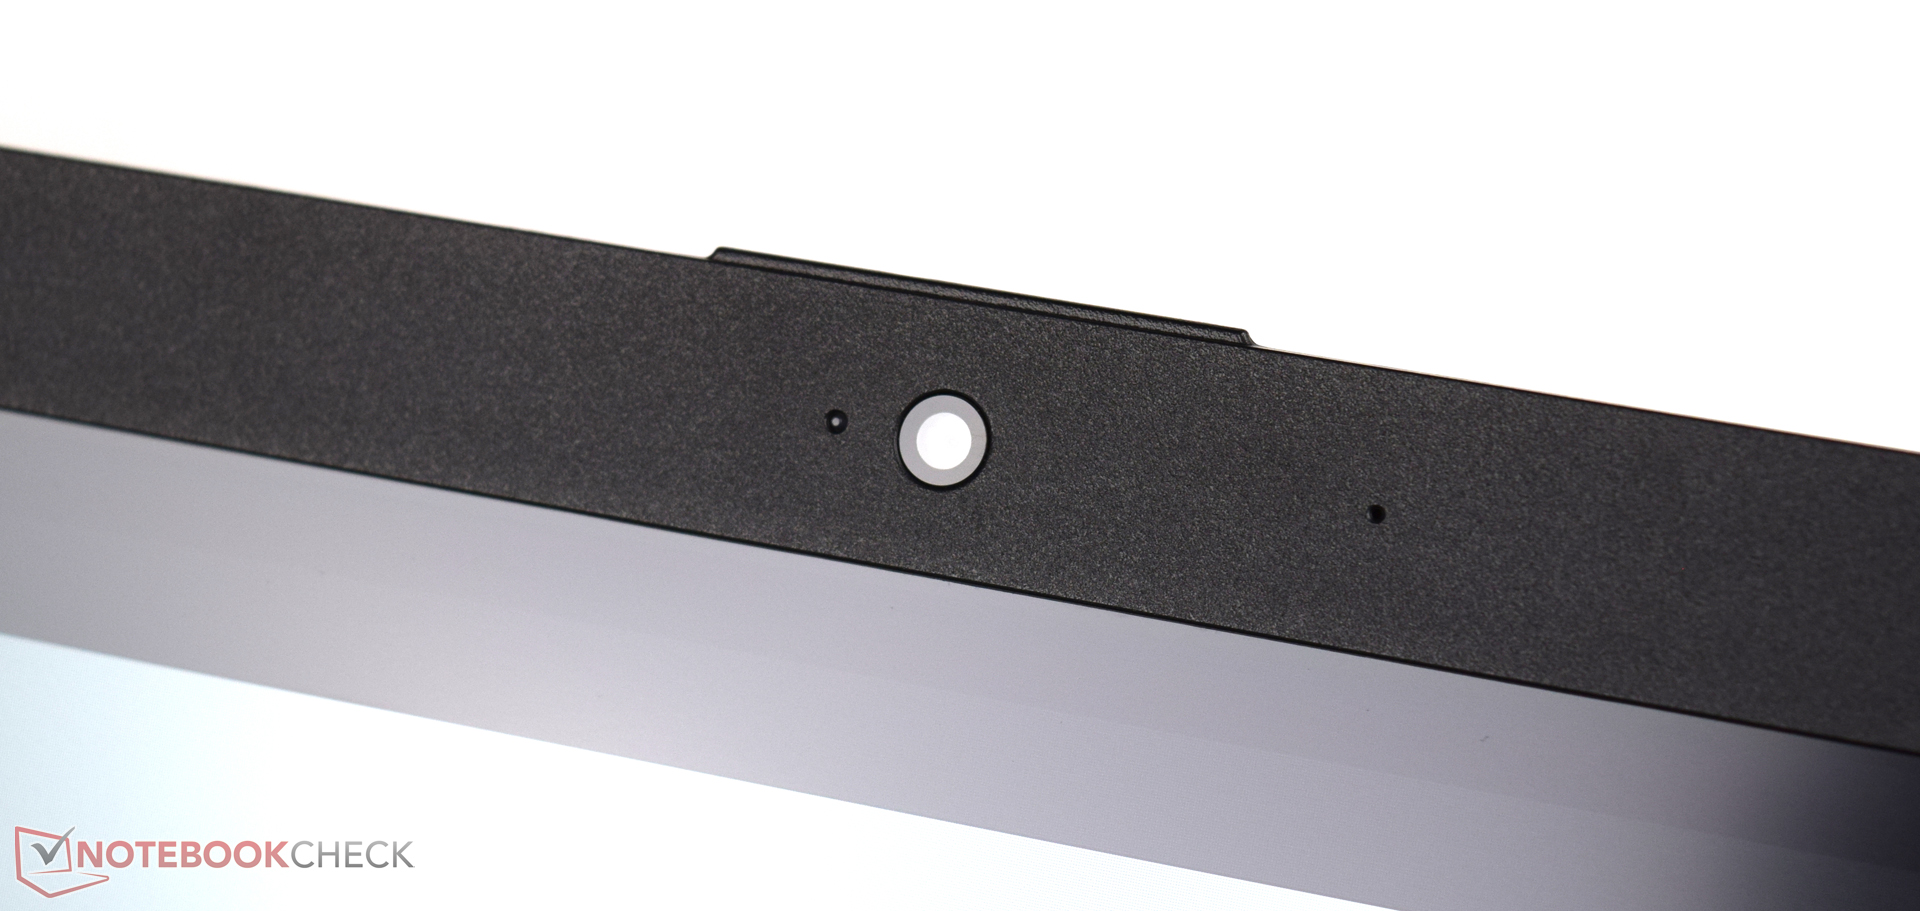
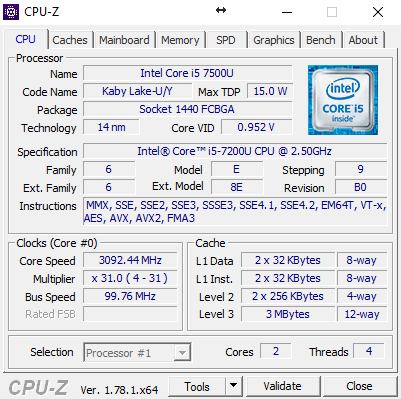
O portátil multimídia de 17 polegadas da HP, o Pavilion 17-x110ng é vendido atualmente por 699 Euros (~$750). Está equipado com uma combinação do processador Intel e placa de vídeo AMD dentro de um discreto chassi de plástico preto. O Intel Core i5-7200U é um moderno chip Kaby Lake, e o eficiente SoC dual-core fornece suficiente desempenho para a maioria de aplicativos multimídia. 8 GB de RAM DDR4 também sçao decentes e não deveria haver problemas, nem mesmo com aplicativos exigentes. A tela IPS fornece amplos ângulos de visão e não podemos determinar um bleeding da iluminação de fundo.
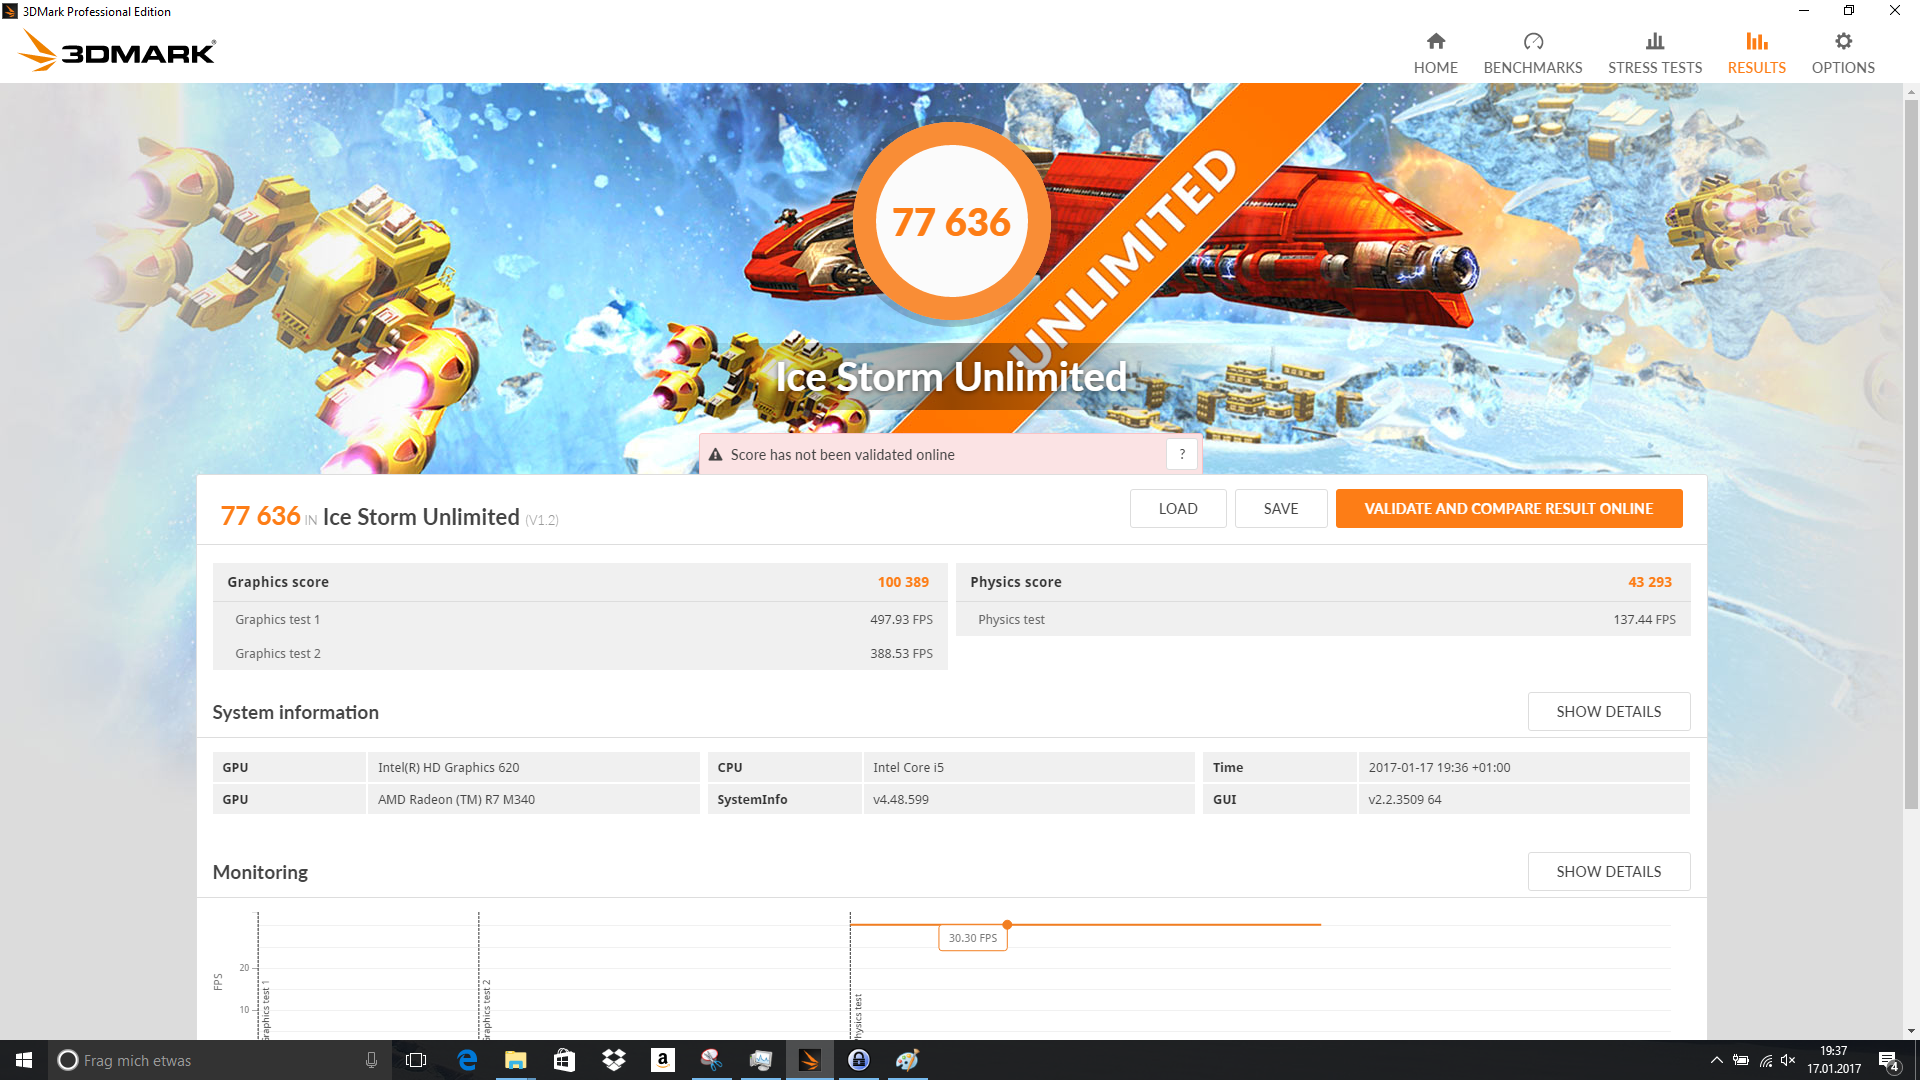
O HP Pavilion 17-x110ng convence com bom desempenho do sistema, mas as capacidades de jogos são limitados devido à lenta placa de vídeo.
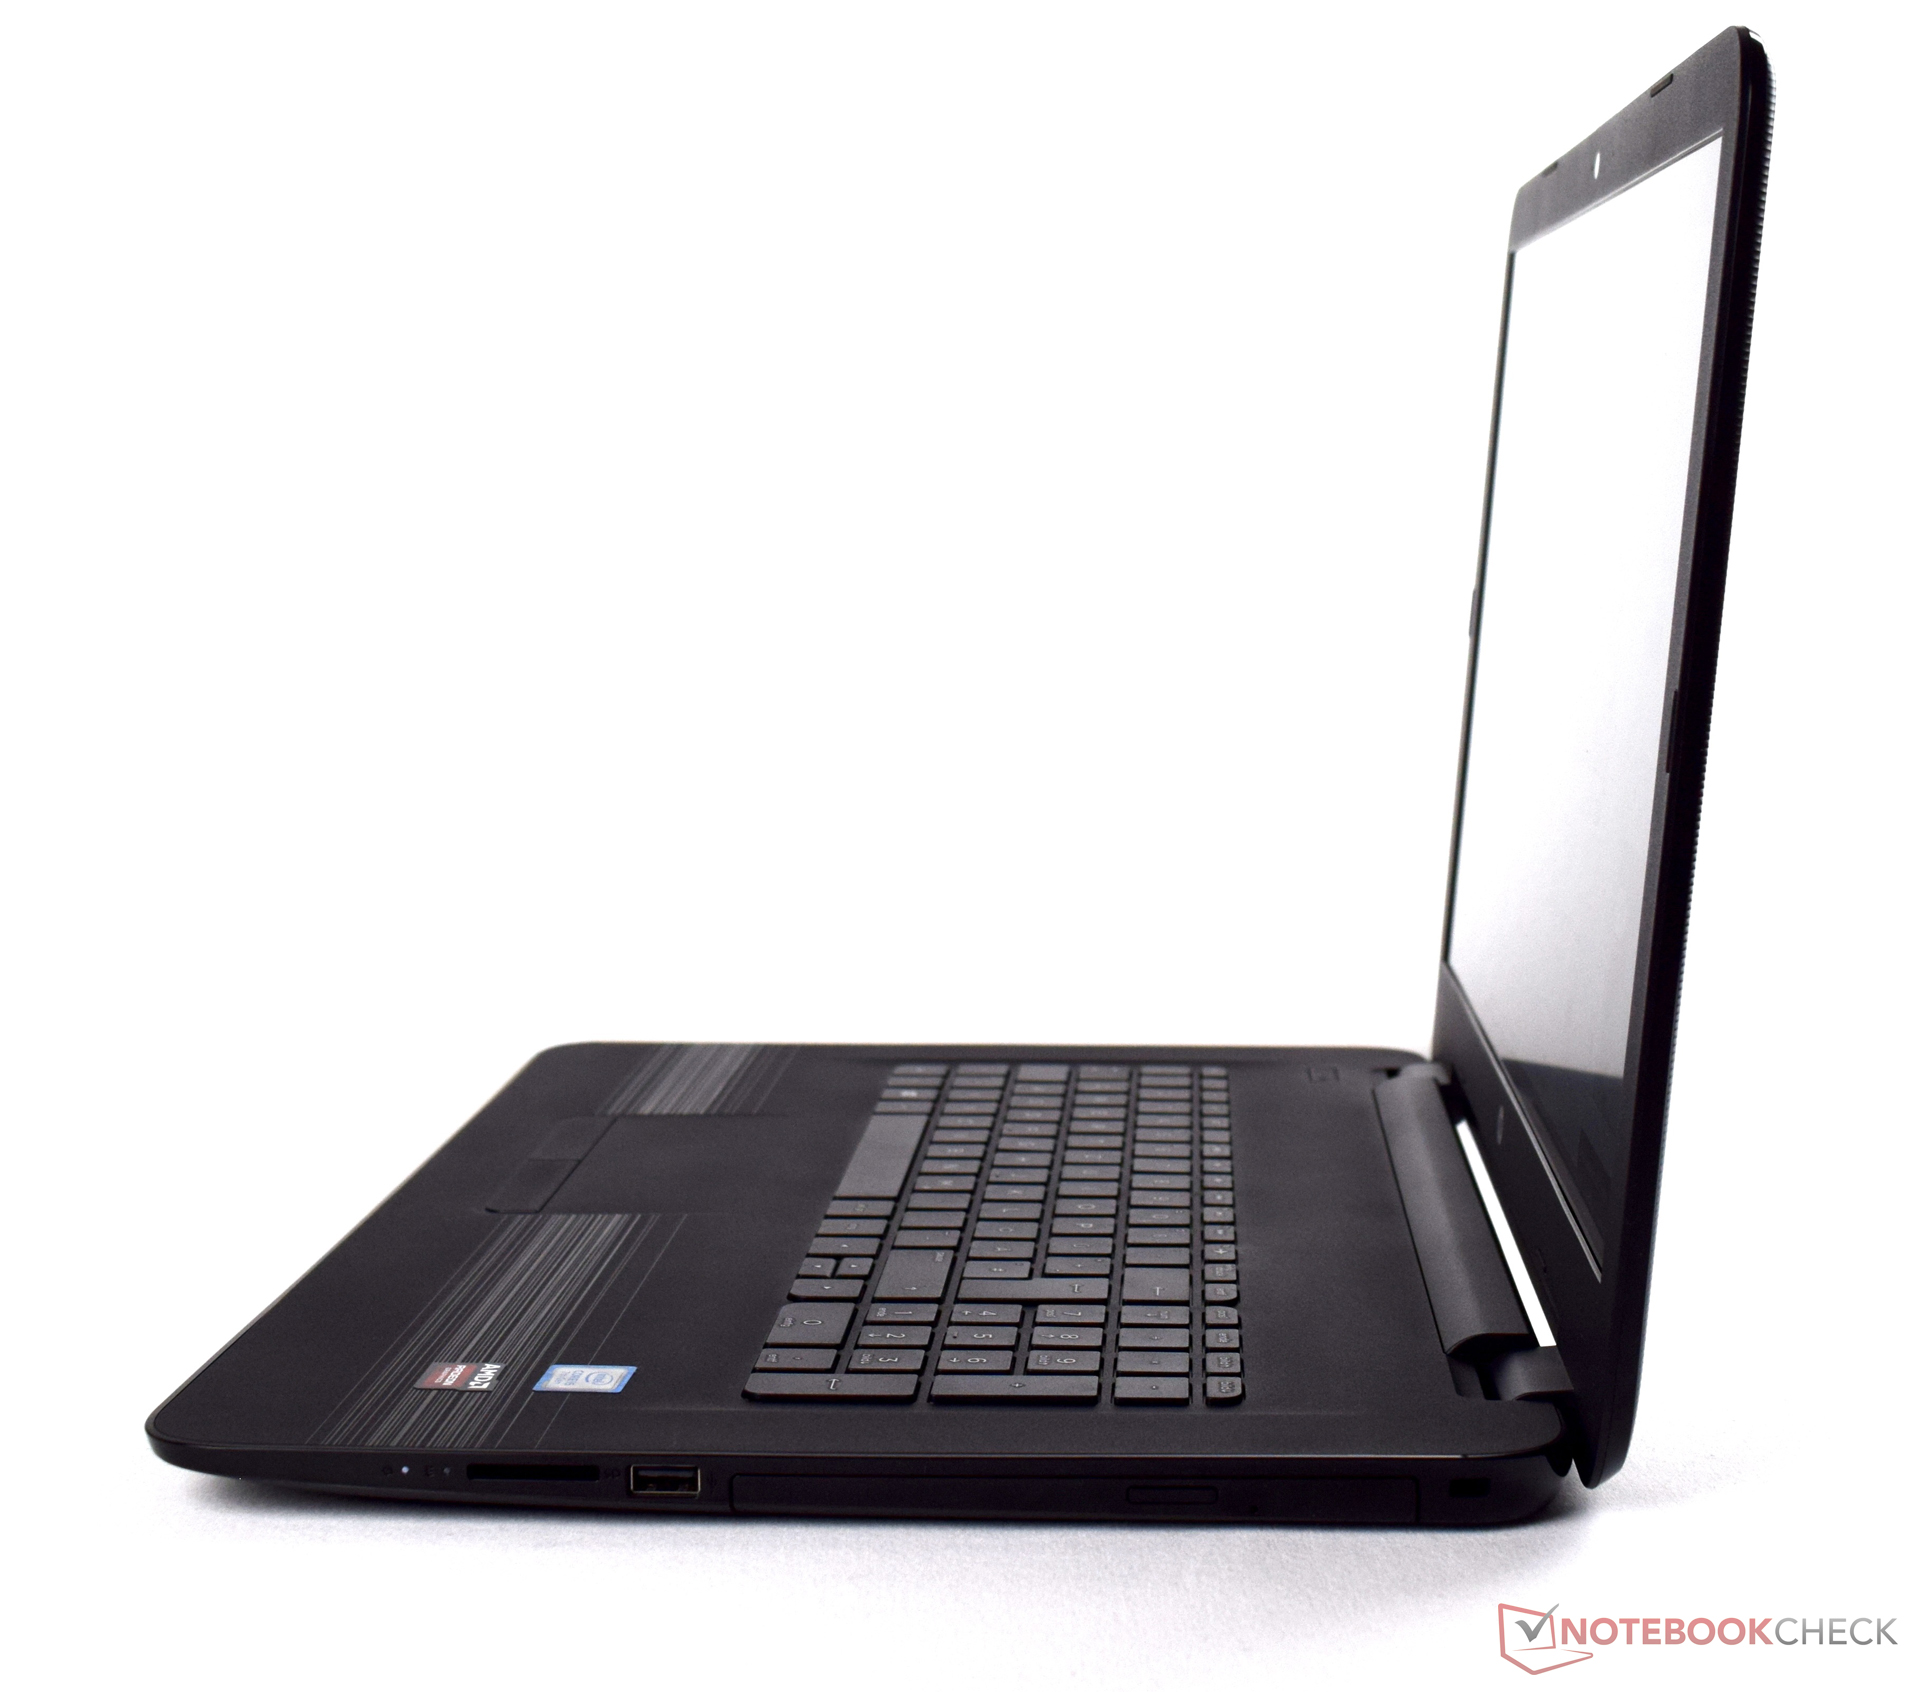
A placa de vídeo dedicada é uma bela adição, mas você realmente deveria pensar sobre seus cenários de uso, porque o desempenho somente é suficiente para uma experiência de jogo fluente em baixas resoluções. A solução de armazenamento é boa e ruim ao mesmo tempo. Faz sentido usar um SSD veloz como unidade do sistema, mas 256 GB não serão suficientes para um aparelho multimídia, onde grandes quantidades de dados são basicamente obrigatórios.
HP Pavilion 17-x110ng
- 01/24/2017 v6 (old)
Sebastian Bade
Price comparison
