Breve Análise do Portátil Lenovo X62


| SD Card Reader | |
| average JPG Copy Test (av. of 3 runs) | |
| Dell Latitude 7280 | |
| Lenovo ThinkPad X270-20HMS00T00 | |
| Lenovo ThinkPad 13-20J2S00G00 | |
| Lenovo ThinkPad X62 | |
| maximum AS SSD Seq Read Test (1GB) | |
| Dell Latitude 7280 | |
| Lenovo ThinkPad X270-20HMS00T00 | |
| Lenovo ThinkPad 13-20J2S00G00 | |
| Lenovo ThinkPad X62 | |
| Networking | |
| iperf3 transmit AX12 | |
| Dell Latitude 7280 | |
| Lenovo ThinkPad X270-20HMS00T00 | |
| Lenovo ThinkPad X62 | |
| Lenovo ThinkPad 13-20J2S00G00 | |
| iperf3 receive AX12 | |
| Lenovo ThinkPad X270-20HMS00T00 | |
| Lenovo ThinkPad 13-20J2S00G00 | |
| Dell Latitude 7280 | |
| Lenovo ThinkPad X62 | |
| |||||||||||||||||||||||||
iluminação: 88 %
Contraste: 306:1 (Preto: 0.55 cd/m²)
ΔE ColorChecker Calman: 6.1 | ∀{0.5-29.43 Ø4.73}
ΔE Greyscale Calman: 0.7 | ∀{0.09-98 Ø4.97}
54.2% sRGB (Argyll 1.6.3 3D)
35% AdobeRGB 1998 (Argyll 1.6.3 3D)
37.95% AdobeRGB 1998 (Argyll 3D)
54.3% sRGB (Argyll 3D)
36.63% Display P3 (Argyll 3D)
Gamma: 2.19
| Lenovo ThinkPad X62 IPS Flexview HV121P01-100, , 12.1", 1400x1050 | Dell XPS 13-9343 SHP1421, IPS, 13.3", 3200x1800 | Lenovo ThinkPad X270-20HMS00T00 Innolux N125HCE-GN1, IPS LED, 12.5", 1920x1080 | Dell Latitude 7280 AUO236D , IPS, 12.5", 1920x1080 | Lenovo ThinkPad 13-20J2S00G00 LP133WF2-SPL78, IPS, LED, 13.3", 1920x1080 | Apple MacBook 12 (Early 2016) 1.1 GHz APPA027, IPS, 12", 2304x1440 | |
|---|---|---|---|---|---|---|
| Display | 88% | 22% | 21% | 10% | 79% | |
| Display P3 Coverage (%) | 36.63 | 72 97% | 44.6 22% 44.6 22% | 44.41 21% | 40.16 10% | 66.8 82% |
| sRGB Coverage (%) | 54.3 | 96 77% | 65.9 21% 65.9 21% | 65.4 20% | 60 10% | 95.4 76% |
| AdobeRGB 1998 Coverage (%) | 37.95 | 71.6 89% | 46.11 22% 46.11 22% | 45.9 21% | 41.54 9% | 68 79% |
| Response Times | 19% | 24% | 24% | 18% | ||
| Response Time Grey 50% / Grey 80% * (ms) | 59.6 ? | 40.8 ? 32% | 32.4 ? 46% | 43.6 ? 27% | 41.2 ? 31% | |
| Response Time Black / White * (ms) | 32 ? | 30.4 ? 5% | 31.2 ? 2% | 25.2 ? 21% | 30.4 ? 5% | |
| PWM Frequency (Hz) | 26040 ? | 30860 ? | ||||
| Screen | 51% | -19% | -12% | 3% | 69% | |
| Brightness middle (cd/m²) | 168.3 | 367.3 118% | 283 68% | 310.4 84% | 306 82% | 387 130% |
| Brightness (cd/m²) | 157 | 372 137% | 281 79% | 301 92% | 307 96% | 358 128% |
| Brightness Distribution (%) | 88 | 77 -12% | 94 7% | 88 0% | 89 1% | 88 0% |
| Black Level * (cd/m²) | 0.55 | 0.178 68% | 0.25 55% | 0.32 42% | 0.36 35% | 0.47 15% |
| Contrast (:1) | 306 | 2063 574% | 1132 270% | 970 217% | 850 178% | 823 169% |
| Colorchecker dE 2000 * | 6.1 | 5.92 3% | 6.1 -0% | 5.9 3% | 5.1 16% | 1.6 74% |
| Colorchecker dE 2000 max. * | 30.5 | 15.4 50% | 21 31% | 13.3 56% | 4 87% | |
| Greyscale dE 2000 * | 0.7 | 4.79 -584% | 6 -757% | 5.1 -629% | 3.9 -457% | 1 -43% |
| Gamma | 2.19 100% | 2.42 91% | 2.05 107% | 2.33 94% | 2.17 101% | 2.26 97% |
| Color Space (Percent of AdobeRGB 1998) (%) | 35 | 63 80% | 42.26 21% | 42 20% | 38.24 9% | 61.6 76% |
| Color Space (Percent of sRGB) (%) | 54.2 | 96.4 78% | 65.43 21% | 65 20% | 59.75 10% | 82.2 52% |
| CCT | 7013 93% | 6832 95% | 6816 95% | 6829 95% | 6680 97% | |
| Média Total (Programa/Configurações) | 70% /
60% | 7% /
-1% | 11% /
-1% | 12% /
7% | 55% /
64% |
* ... menor é melhor
Exibir tempos de resposta
| ↔ Tempo de resposta preto para branco | ||
|---|---|---|
| 32 ms ... ascensão ↗ e queda ↘ combinadas | ↗ 18 ms ascensão | 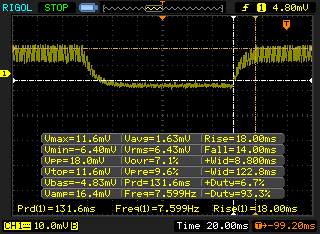 |
| ↘ 14 ms queda | ||
| A tela mostra taxas de resposta lentas em nossos testes e será insatisfatória para os jogadores. Em comparação, todos os dispositivos testados variam de 0.1 (mínimo) a 240 (máximo) ms. » 86 % de todos os dispositivos são melhores. Isso significa que o tempo de resposta medido é pior que a média de todos os dispositivos testados (19.9 ms). | ||
| ↔ Tempo de resposta 50% cinza a 80% cinza | ||
| 59.6 ms ... ascensão ↗ e queda ↘ combinadas | ↗ 16.8 ms ascensão | 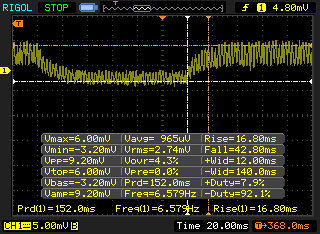 |
| ↘ 42.8 ms queda | ||
| A tela mostra taxas de resposta lentas em nossos testes e será insatisfatória para os jogadores. Em comparação, todos os dispositivos testados variam de 0.165 (mínimo) a 636 (máximo) ms. » 96 % de todos os dispositivos são melhores. Isso significa que o tempo de resposta medido é pior que a média de todos os dispositivos testados (31.1 ms). | ||
Cintilação da tela / PWM (modulação por largura de pulso)
| Tela tremeluzindo / PWM não detectado | ≤ 100 % configuração de brilho | 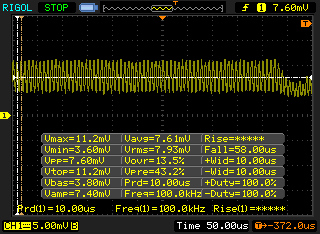 | |
| ≤ 168.3 brilho cd/m² | |||
[pwm_comparison] Em comparação: 52 % de todos os dispositivos testados não usam PWM para escurecer a tela. Se PWM foi detectado, uma média de 7798 (mínimo: 5 - máximo: 343500) Hz foi medida. | |||
| Cinebench R10 | |
| Rendering Multiple CPUs 32Bit | |
| Lenovo ThinkPad 13-20J2S00G00 | |
| Lenovo ThinkPad X62 | |
| Apple MacBook 12 (Early 2016) 1.1 GHz | |
| Dell XPS 13-9343 | |
| Rendering Single 32Bit | |
| Lenovo ThinkPad 13-20J2S00G00 | |
| Lenovo ThinkPad X62 | |
| Apple MacBook 12 (Early 2016) 1.1 GHz | |
| Dell XPS 13-9343 | |
| wPrime 2.10 - 1024m | |
| Apple MacBook 12 (Early 2016) 1.1 GHz | |
| Dell XPS 13-9343 | |
| Dell Latitude 7280 | |
* ... menor é melhor
| PCMark 7 Score | 4729 pontos | |
| PCMark 8 Home Score Accelerated v2 | 2928 pontos | |
| PCMark 8 Creative Score Accelerated v2 | 3349 pontos | |
| PCMark 8 Work Score Accelerated v2 | 3748 pontos | |
Ajuda | ||
| Lenovo ThinkPad X62 | Dell XPS 13-9343 Lite-On IT L8T-256L9G | Apple MacBook 12 (Early 2016) 1.3 GHz Apple SSD AP0256 | Lenovo ThinkPad X270-20HMS00T00 Toshiba NVMe THNSF5512GPUK | Dell Latitude 7280 SanDisk X400 M.2 2280 256GB | Lenovo ThinkPad 13-20J2S00G00 Toshiba NVMe THNSF5512GPUK | |
|---|---|---|---|---|---|---|
| CrystalDiskMark 3.0 | 129% | 134% | 258% | 100% | 236% | |
| Read Seq (MB/s) | 512 | 489.6 -4% | 821 60% | 1190 132% | 470.8 -8% | 1143 123% |
| Write Seq (MB/s) | 154.4 | 424.2 175% | 660 327% | 985 538% | 477.4 209% | 653 323% |
| Read 512 (MB/s) | 462.1 | 371.9 -20% | 672 45% | 858 86% | 370.1 -20% | 629 36% |
| Write 512 (MB/s) | 144.6 | 395.5 174% | 737 410% | 528 265% | 323.2 124% | 518 258% |
| Read 4k (MB/s) | 11.43 | 34.76 204% | 16.28 42% | 35.27 209% | 30.23 164% | 31.96 180% |
| Write 4k (MB/s) | 34.1 | 79.3 133% | 24.87 -27% | 124.5 265% | 59.5 74% | 138.5 306% |
| Read 4k QD32 (MB/s) | 107.1 | 354 231% | 271.9 154% | 495.3 362% | 344.4 222% | 578 440% |
| Write 4k QD32 (MB/s) | 137.7 | 326.3 137% | 223.9 63% | 418.3 204% | 183 33% | 443.1 222% |

| 3DMark | |
| 1280x720 Cloud Gate Standard Graphics | |
| Dell Latitude 7280 | |
| Lenovo ThinkPad X62 | |
| Apple MacBook 12 (Early 2016) 1.3 GHz | |
| Lenovo ThinkPad X270-20HMS00T00 | |
| 1920x1080 Fire Strike Graphics | |
| Dell Latitude 7280 | |
| Apple MacBook 12 (Early 2016) 1.3 GHz | |
| Lenovo ThinkPad X270-20HMS00T00 | |
| Lenovo ThinkPad X62 | |
| 3DMark 06 Standard Score | 7382 pontos | |
| 3DMark 11 Performance | 1220 pontos | |
| 3DMark Cloud Gate Standard Score | 4912 pontos | |
| 3DMark Fire Strike Score | 729 pontos | |
Ajuda | ||
Barulho
| Ocioso |
| 31.8 / 31.8 / 31.8 dB |
| Carga |
| 34.1 / 40.8 dB |
 | ||
30 dB silencioso 40 dB(A) audível 50 dB(A) ruidosamente alto |
||
min: | ||
| Lenovo ThinkPad X62 HD Graphics 5500, 5200U | Dell XPS 13-9343 HD Graphics 5500, 5200U, Lite-On IT L8T-256L9G | Lenovo ThinkPad X270-20HMS00T00 HD Graphics 620, i5-7200U, Toshiba NVMe THNSF5512GPUK | Dell Latitude 7280 HD Graphics 620, i7-7600U, SanDisk X400 M.2 2280 256GB | Lenovo ThinkPad 13-20J2S00G00 HD Graphics 620, i7-7500U, Toshiba NVMe THNSF5512GPUK | |
|---|---|---|---|---|---|
| Noise | -1% | 5% | 8% | 9% | |
| desligado / ambiente * (dB) | 28.8 | 29 -1% | 29.4 -2% | 29.1 -1% | |
| Idle Minimum * (dB) | 31.8 | 30.2 5% | 29 9% | 29.4 8% | 29.1 8% |
| Idle Average * (dB) | 31.8 | 30.3 5% | 29 9% | 29.4 8% | 29.1 8% |
| Idle Maximum * (dB) | 31.8 | 30.4 4% | 30.4 4% | 30 6% | 29.1 8% |
| Load Average * (dB) | 34.1 | 34.4 -1% | 34.1 -0% | 30.6 10% | 31.9 6% |
| Witcher 3 ultra * (dB) | 37.45 | ||||
| Load Maximum * (dB) | 40.8 | 48 -18% | 37.6 8% | 32.7 20% | 31.9 22% |
* ... menor é melhor
(+) A temperatura máxima no lado superior é 39.4 °C / 103 F, em comparação com a média de 36.9 °C / 98 F , variando de 24.7 a 57 °C para a classe .
(±) A parte inferior aquece até um máximo de 44.2 °C / 112 F, em comparação com a média de 38.5 °C / 101 F
(+) Em uso inativo, a temperatura média para o lado superior é 29.5 °C / 85 F, em comparação com a média do dispositivo de 31.9 °C / ### class_avg_f### F.
(±) Os apoios para as mãos e o touchpad podem ficar muito quentes ao toque, com um máximo de 39.4 °C / 102.9 F.
(-) A temperatura média da área do apoio para as mãos de dispositivos semelhantes foi 29.6 °C / 85.3 F (-9.8 °C / -17.6 F).
Lenovo ThinkPad X62 análise de áudio
(-) | alto-falantes não muito altos (###valor### dB)
Graves 100 - 315Hz
(-) | quase nenhum baixo - em média 26.8% menor que a mediana
(+) | o baixo é linear (4.3% delta para a frequência anterior)
Médios 400 - 2.000 Hz
(±) | médios mais altos - em média 7.9% maior que a mediana
(-) | médios não são lineares (16% delta para frequência anterior)
Altos 2 - 16 kHz
(±) | máximos mais altos - em média 9.5% maior que a mediana
(+) | os máximos são lineares (6.2% delta da frequência anterior)
Geral 100 - 16.000 Hz
(-) | o som geral não é linear (39.9% diferença em relação à mediana)
Comparado com a mesma classe
» 95% de todos os dispositivos testados nesta classe foram melhores, 0% semelhantes, 5% piores
» O melhor teve um delta de 4%, a média foi 24%, o pior foi 134%
Comparado com todos os dispositivos testados
» 95% de todos os dispositivos testados foram melhores, 0% semelhantes, 5% piores
» O melhor teve um delta de 4%, a média foi 24%, o pior foi 134%
Lenovo ThinkPad X270-20HMS00T00 análise de áudio
(-) | alto-falantes não muito altos (###valor### dB)
Graves 100 - 315Hz
(-) | quase nenhum baixo - em média 18.8% menor que a mediana
(±) | a linearidade dos graves é média (11.1% delta para a frequência anterior)
Médios 400 - 2.000 Hz
(+) | médios equilibrados - apenas 1.5% longe da mediana
(+) | médios são lineares (5.4% delta para frequência anterior)
Altos 2 - 16 kHz
(+) | agudos equilibrados - apenas 3.1% longe da mediana
(+) | os máximos são lineares (6.4% delta da frequência anterior)
Geral 100 - 16.000 Hz
(±) | a linearidade do som geral é média (22.3% diferença em relação à mediana)
Comparado com a mesma classe
» 59% de todos os dispositivos testados nesta classe foram melhores, 9% semelhantes, 33% piores
» O melhor teve um delta de 7%, a média foi 21%, o pior foi 53%
Comparado com todos os dispositivos testados
» 65% de todos os dispositivos testados foram melhores, 6% semelhantes, 29% piores
» O melhor teve um delta de 4%, a média foi 24%, o pior foi 134%
| desligado | |
| Ocioso | |
| Carga |
|
Key:
min: | |
| Lenovo ThinkPad X62 5200U, HD Graphics 5500, , , 1400x1050, 12.1" | Lenovo ThinkPad 13-20J2S00G00 i7-7500U, HD Graphics 620, Toshiba NVMe THNSF5512GPUK, IPS, LED, 1920x1080, 13.3" | Lenovo ThinkPad X220T 4298-2YG 2620M, HD Graphics 3000, Seagate Momentus Thin ST320LT000-9VL142, , 1366x768, 12.5" | |
|---|---|---|---|
| Power Consumption | 32% | -32% | |
| Idle Minimum * (Watt) | 9.09 | 3.16 65% | 7.4 19% |
| Idle Average * (Watt) | 13.9 | 5.9 58% | 12.2 12% |
| Idle Maximum * (Watt) | 13.99 | 6.5 54% | 13.2 6% |
| Load Average * (Watt) | 23.8 | 30.6 -29% | 53.1 -123% |
| Load Maximum * (Watt) | 39.7 | 35.8 10% | 68.3 -72% |
* ... menor é melhor
| Lenovo ThinkPad X62 5200U, HD Graphics 5500, Wh | Dell XPS 13-9343 5200U, HD Graphics 5500, 52 Wh | Apple MacBook 12 (Early 2016) 1.3 GHz 6Y75, HD Graphics 515, 41.4 Wh | Lenovo ThinkPad X270-20HMS00T00 i5-7200U, HD Graphics 620, 46 Wh | Dell Latitude 7280 i7-7600U, HD Graphics 620, 60 Wh | Lenovo ThinkPad 13-20J2S00G00 i7-7500U, HD Graphics 620, 42 Wh | |
|---|---|---|---|---|---|---|
| Duração da bateria | 393% | 289% | 445% | 732% | 376% | |
| Reader / Idle (h) | 1.9 | 15.2 700% | 17.1 800% | 25.9 1263% | 15.1 695% | |
| WiFi (h) | 2.3 | 9.7 322% | ||||
| Load (h) | 0.9 | 2.3 156% | 3.5 289% | 1.7 89% | 2.7 200% | 1.4 56% |
| WiFi v1.3 (h) | 9.2 | 5.4 | 11.4 | 7.9 |
Pro
Contra
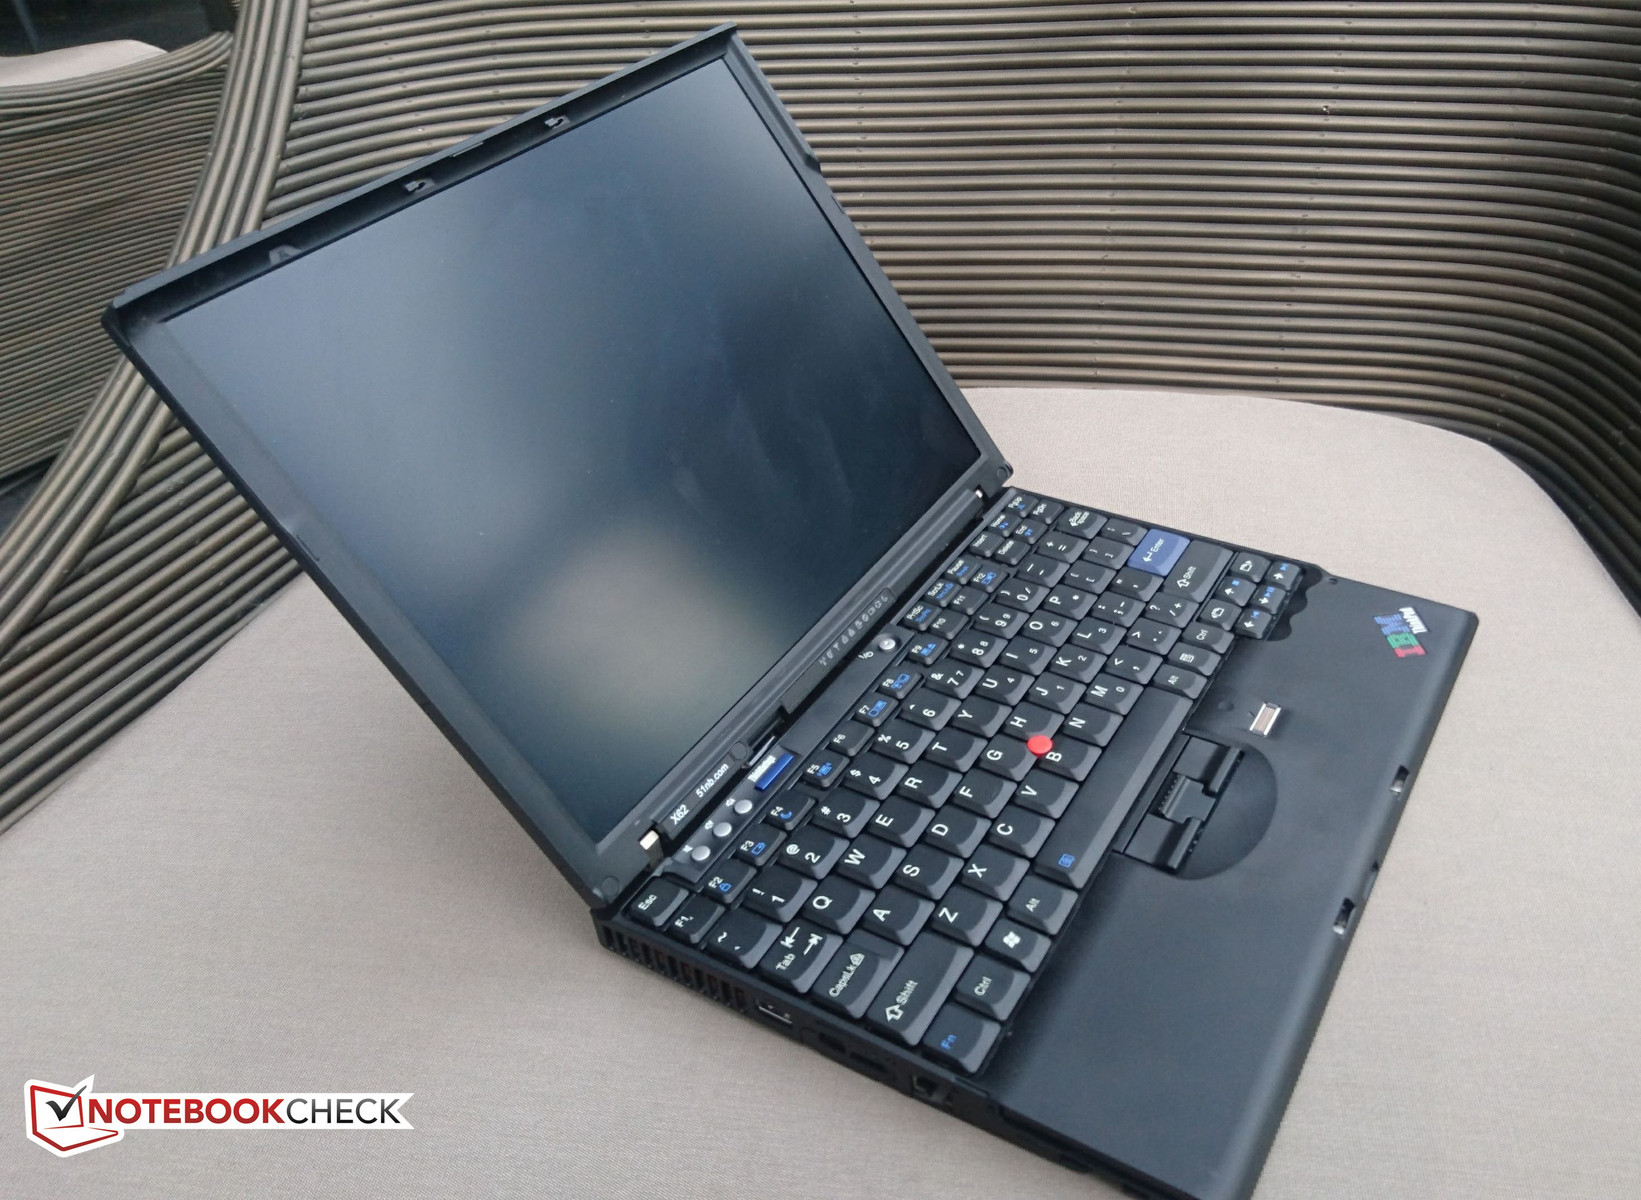
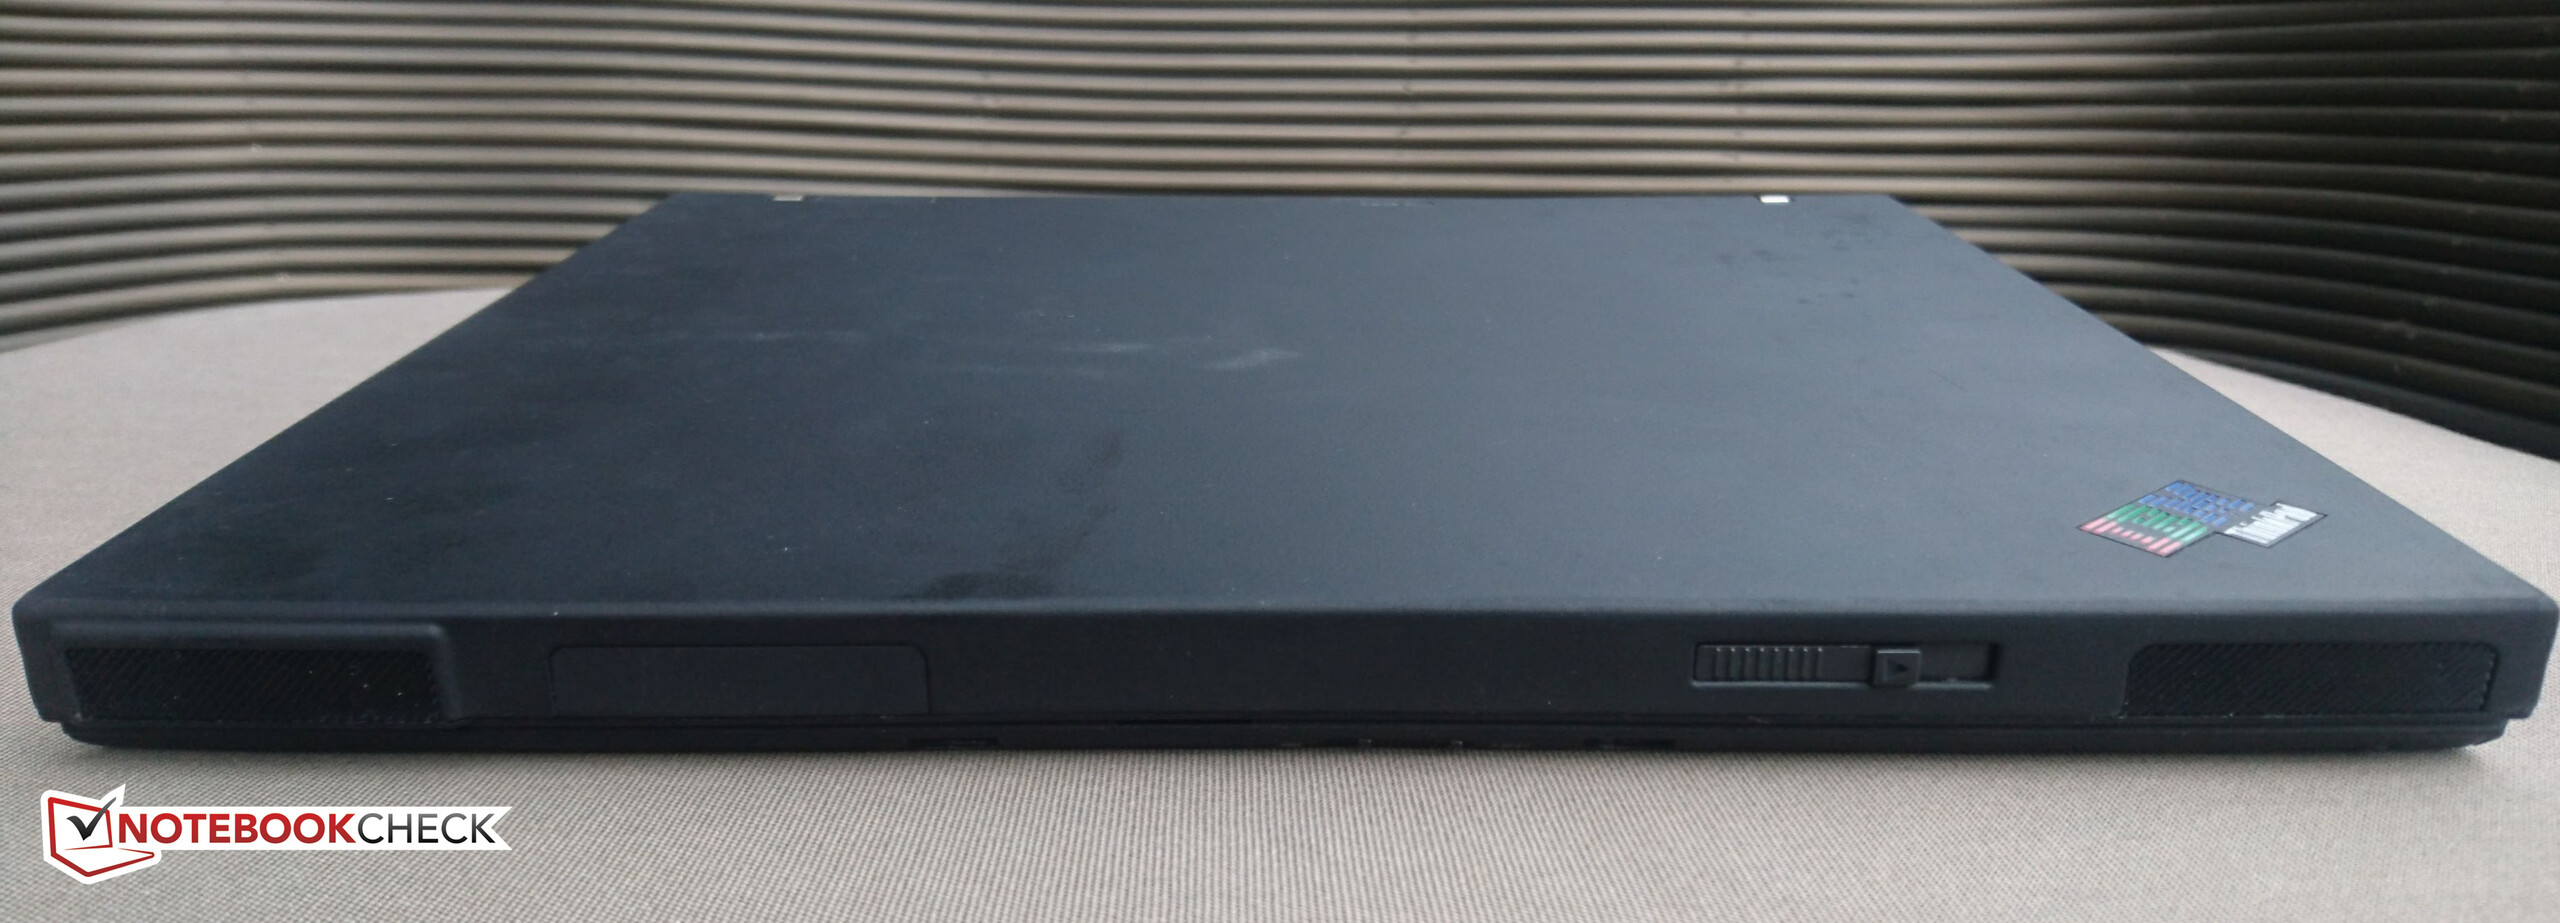
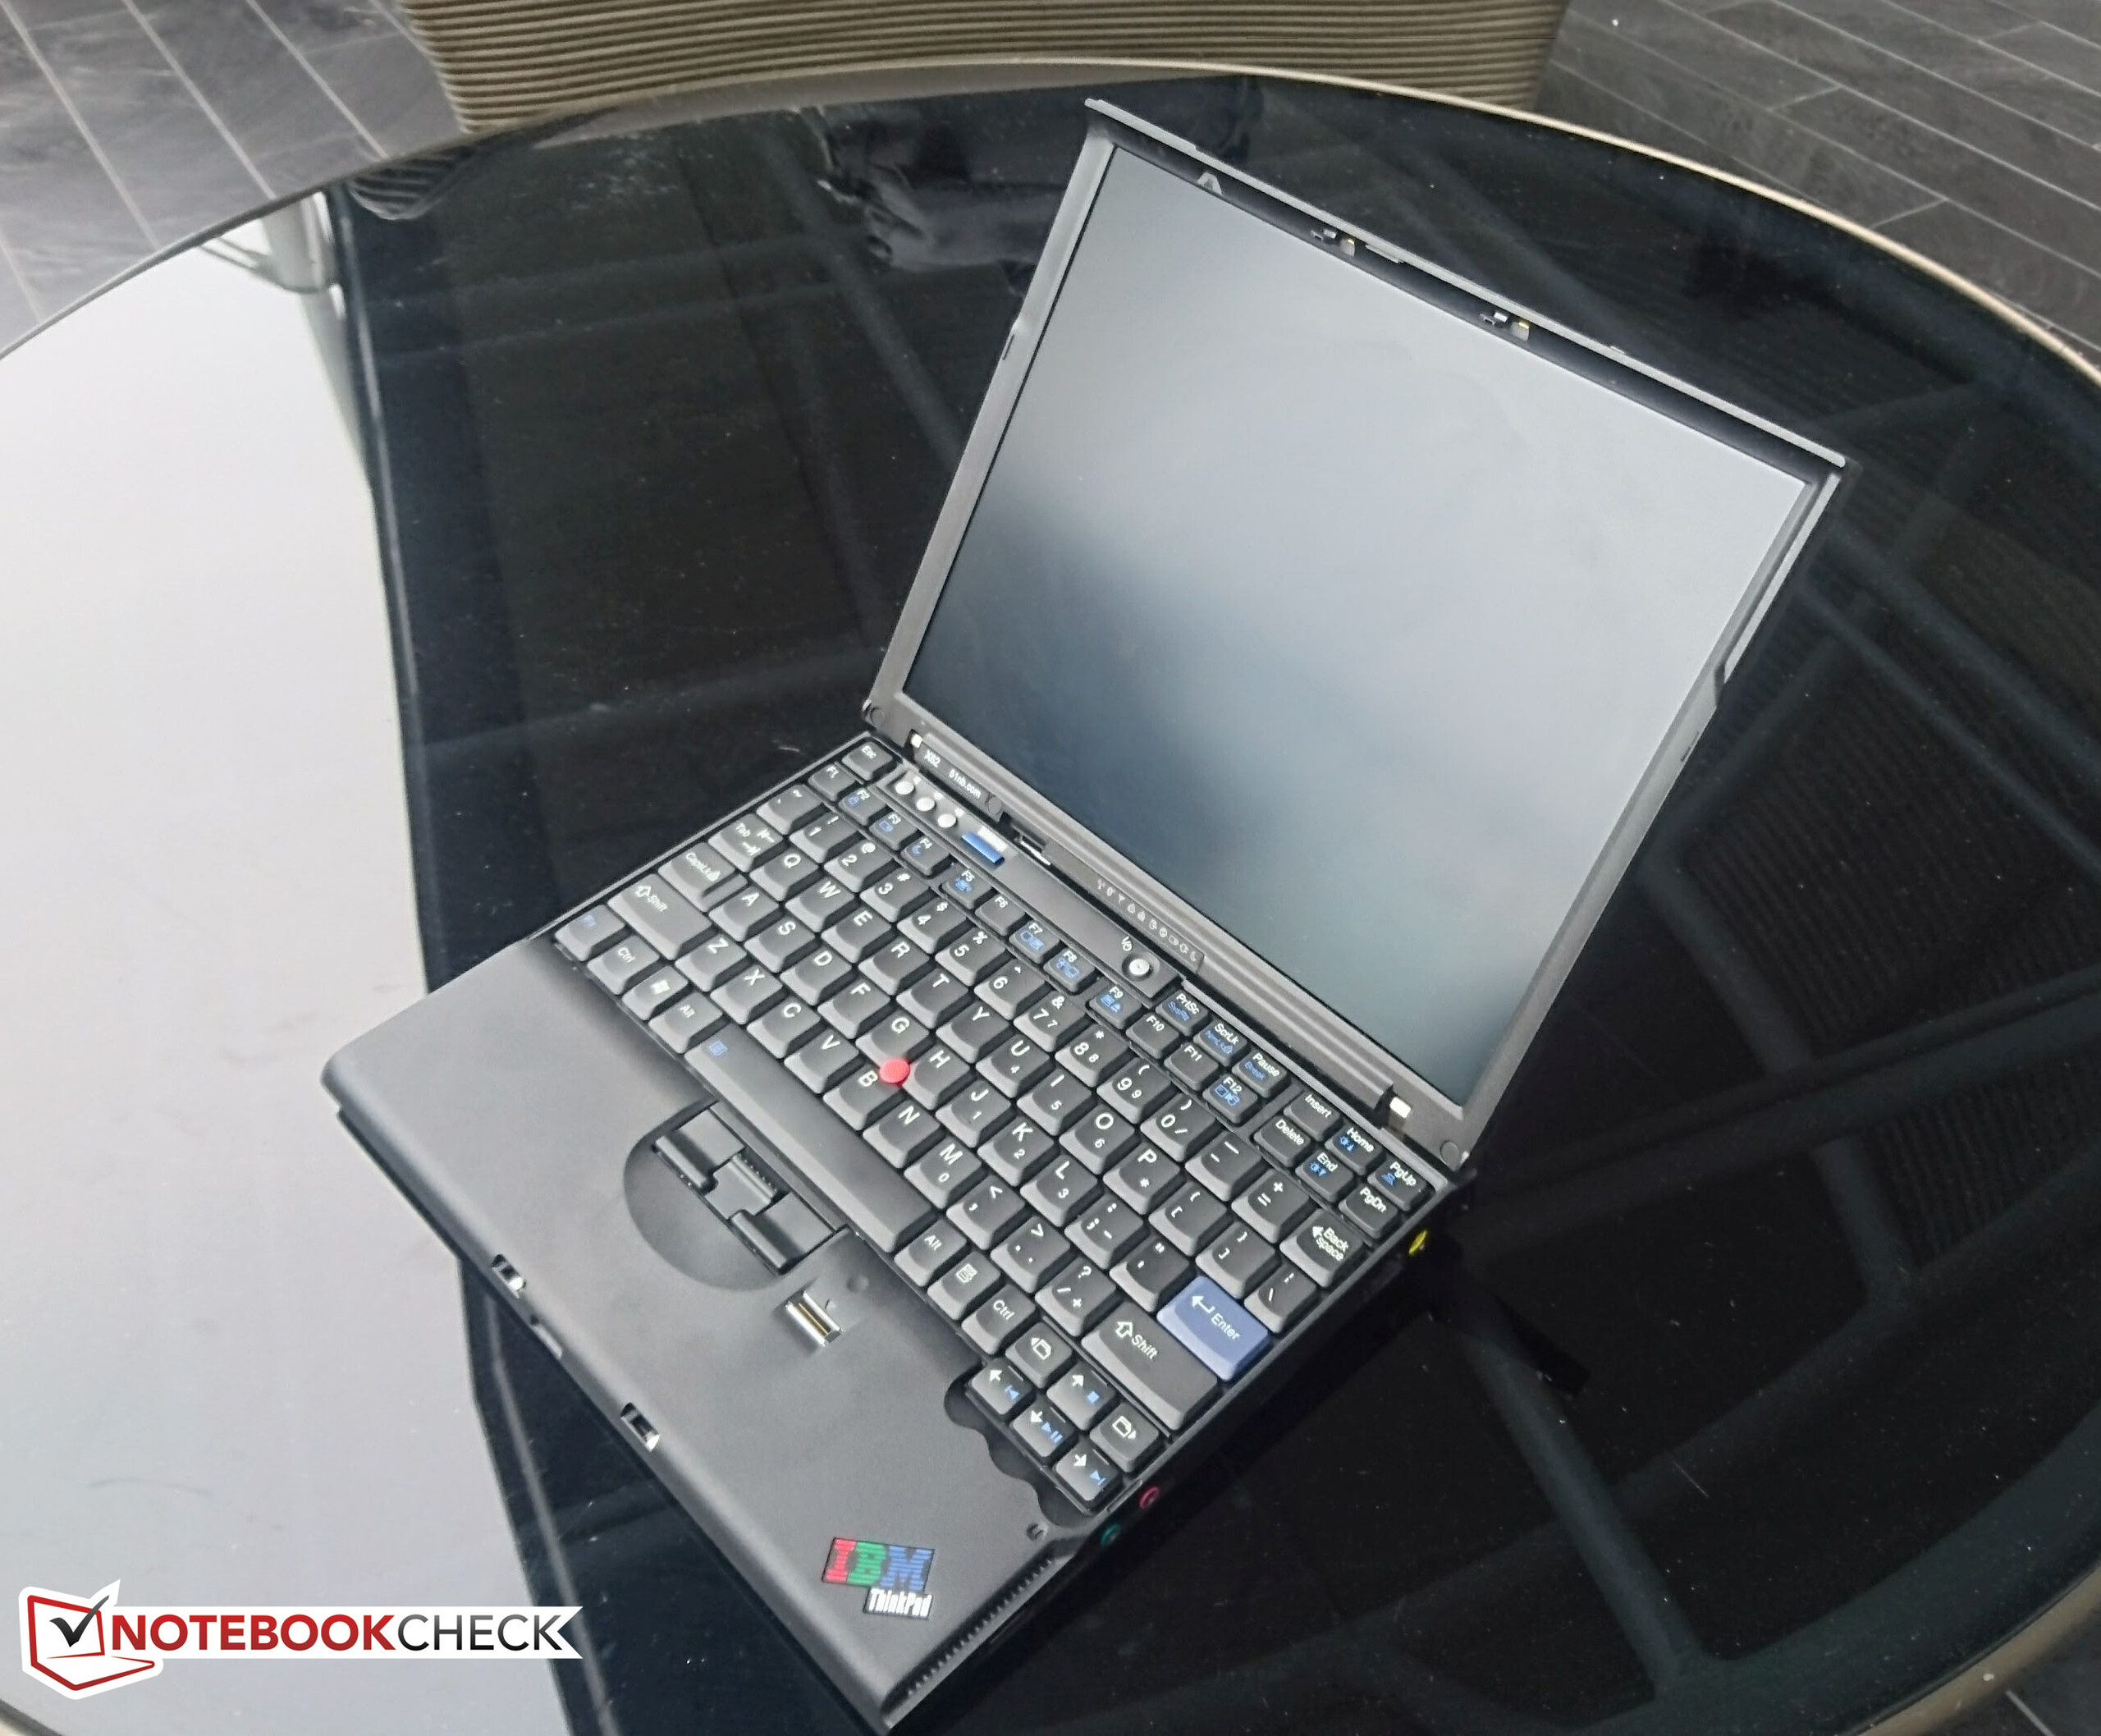
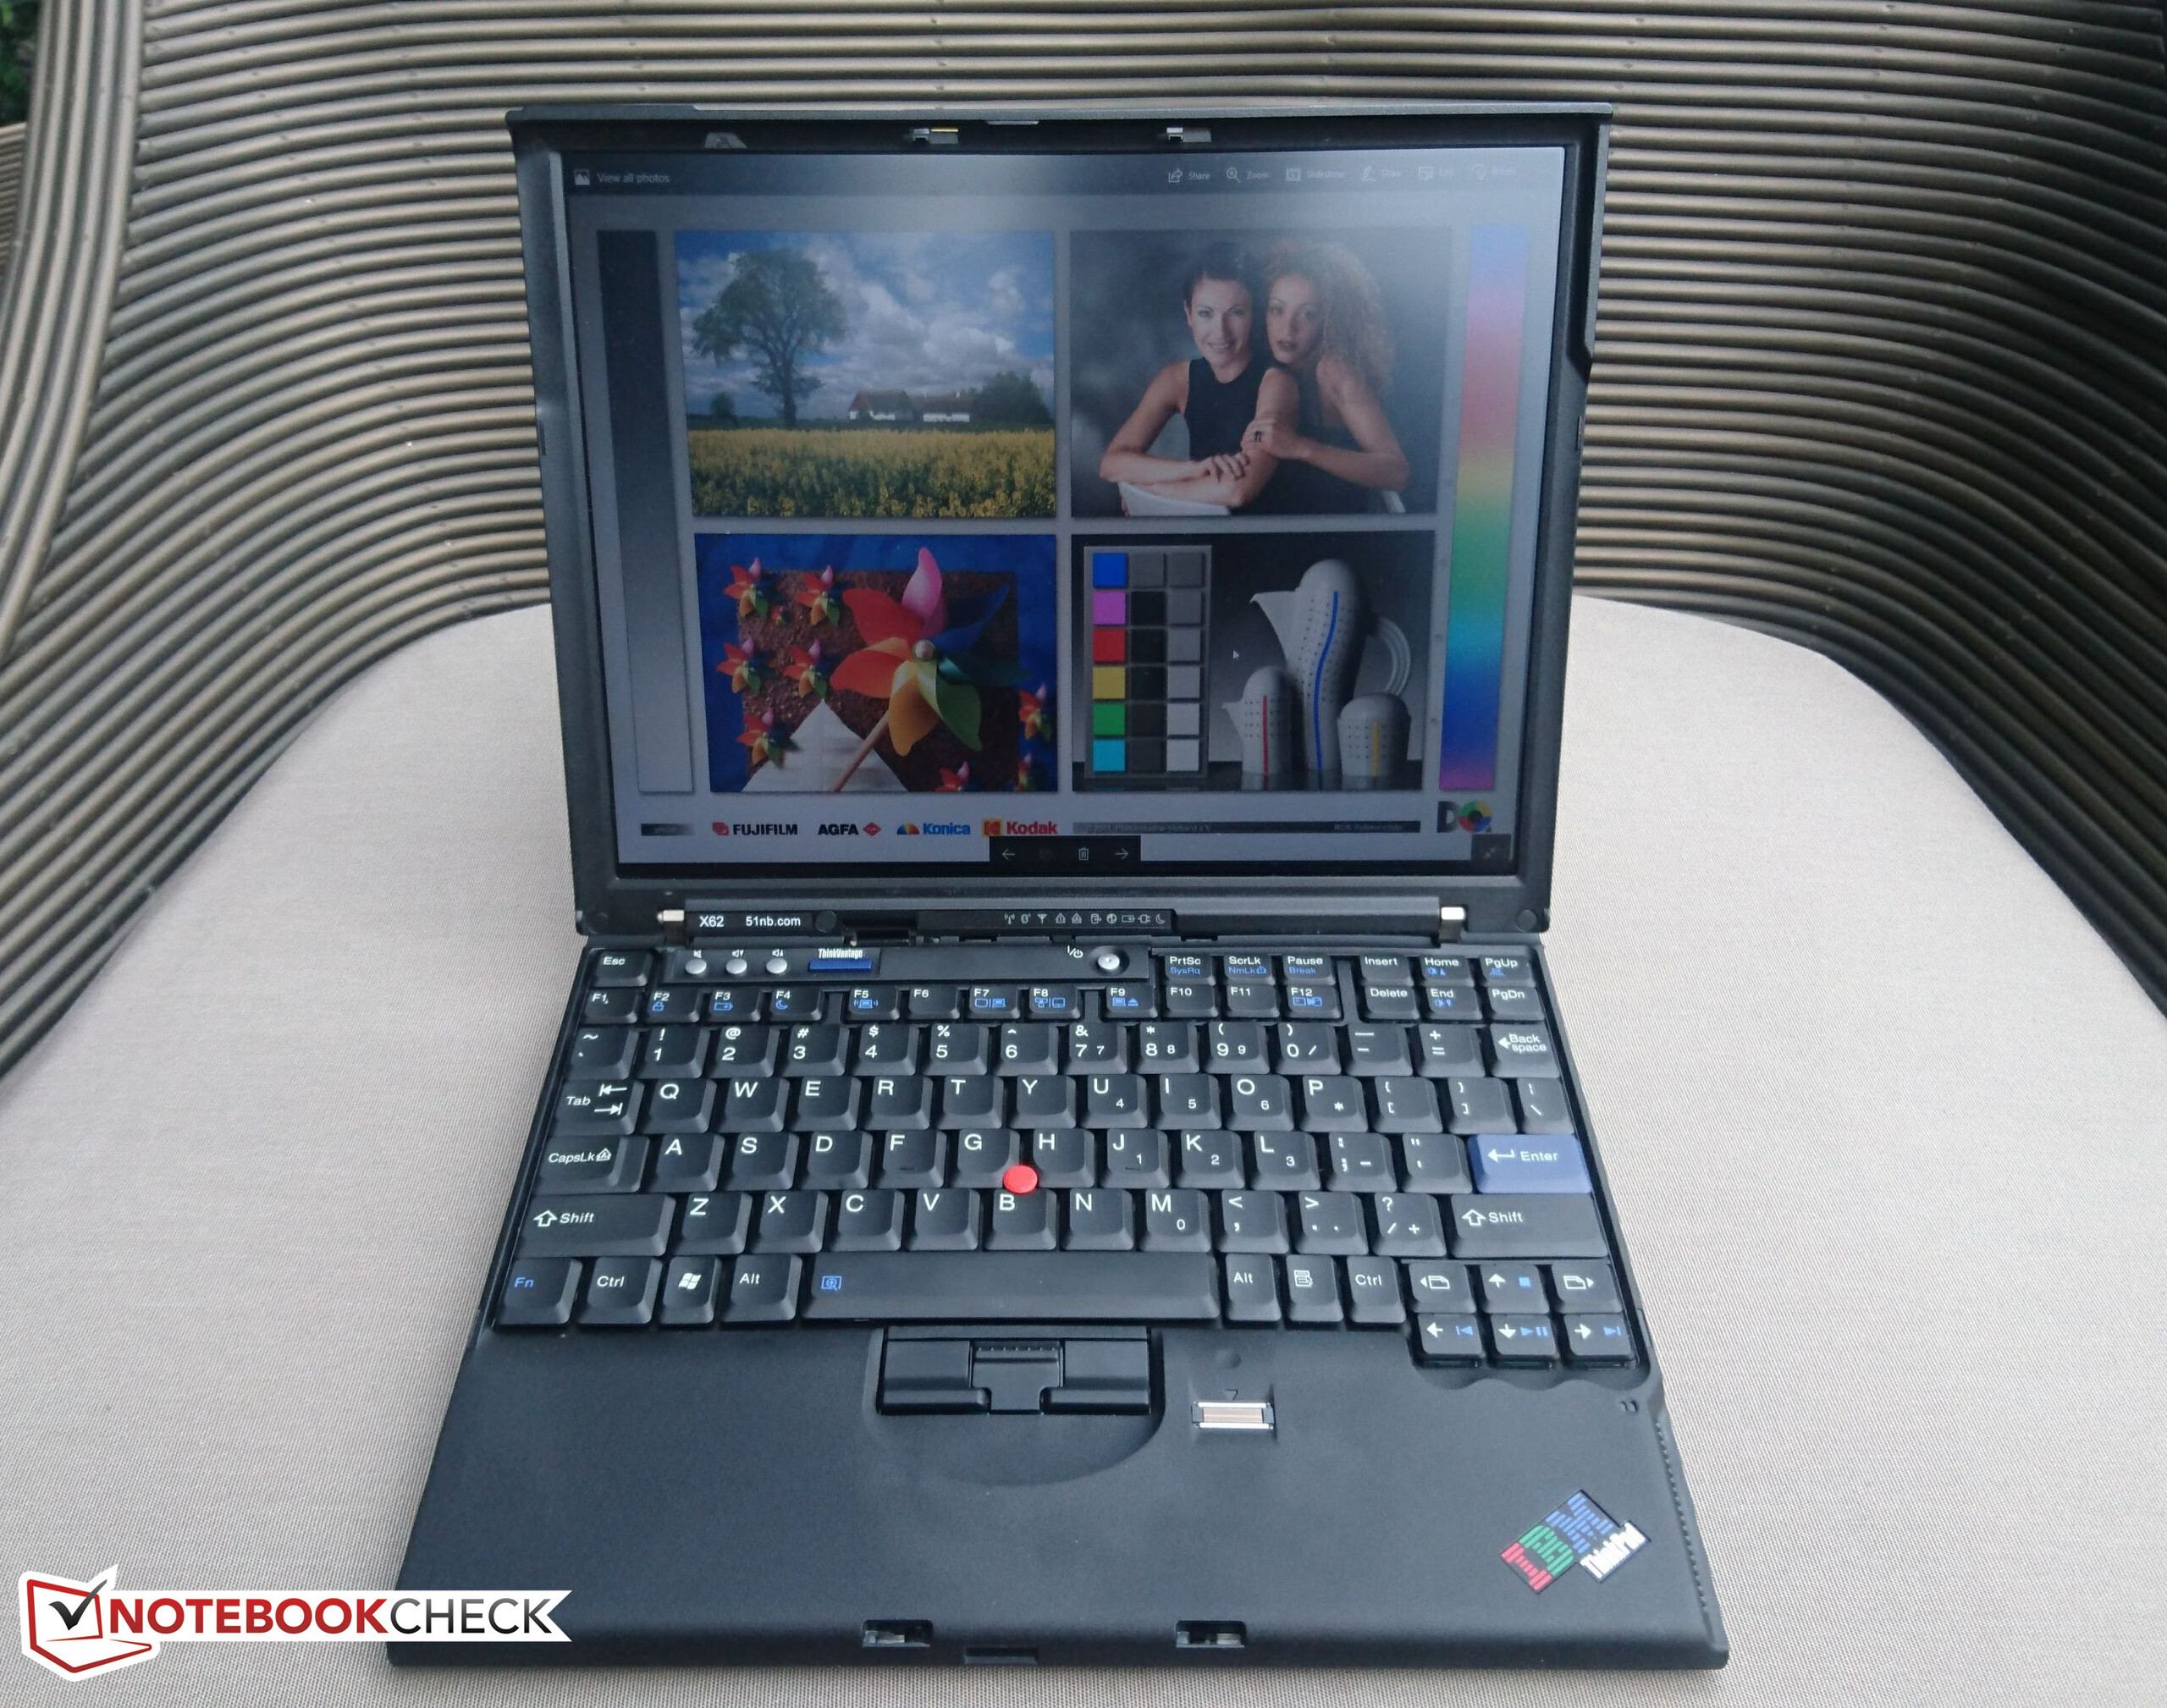
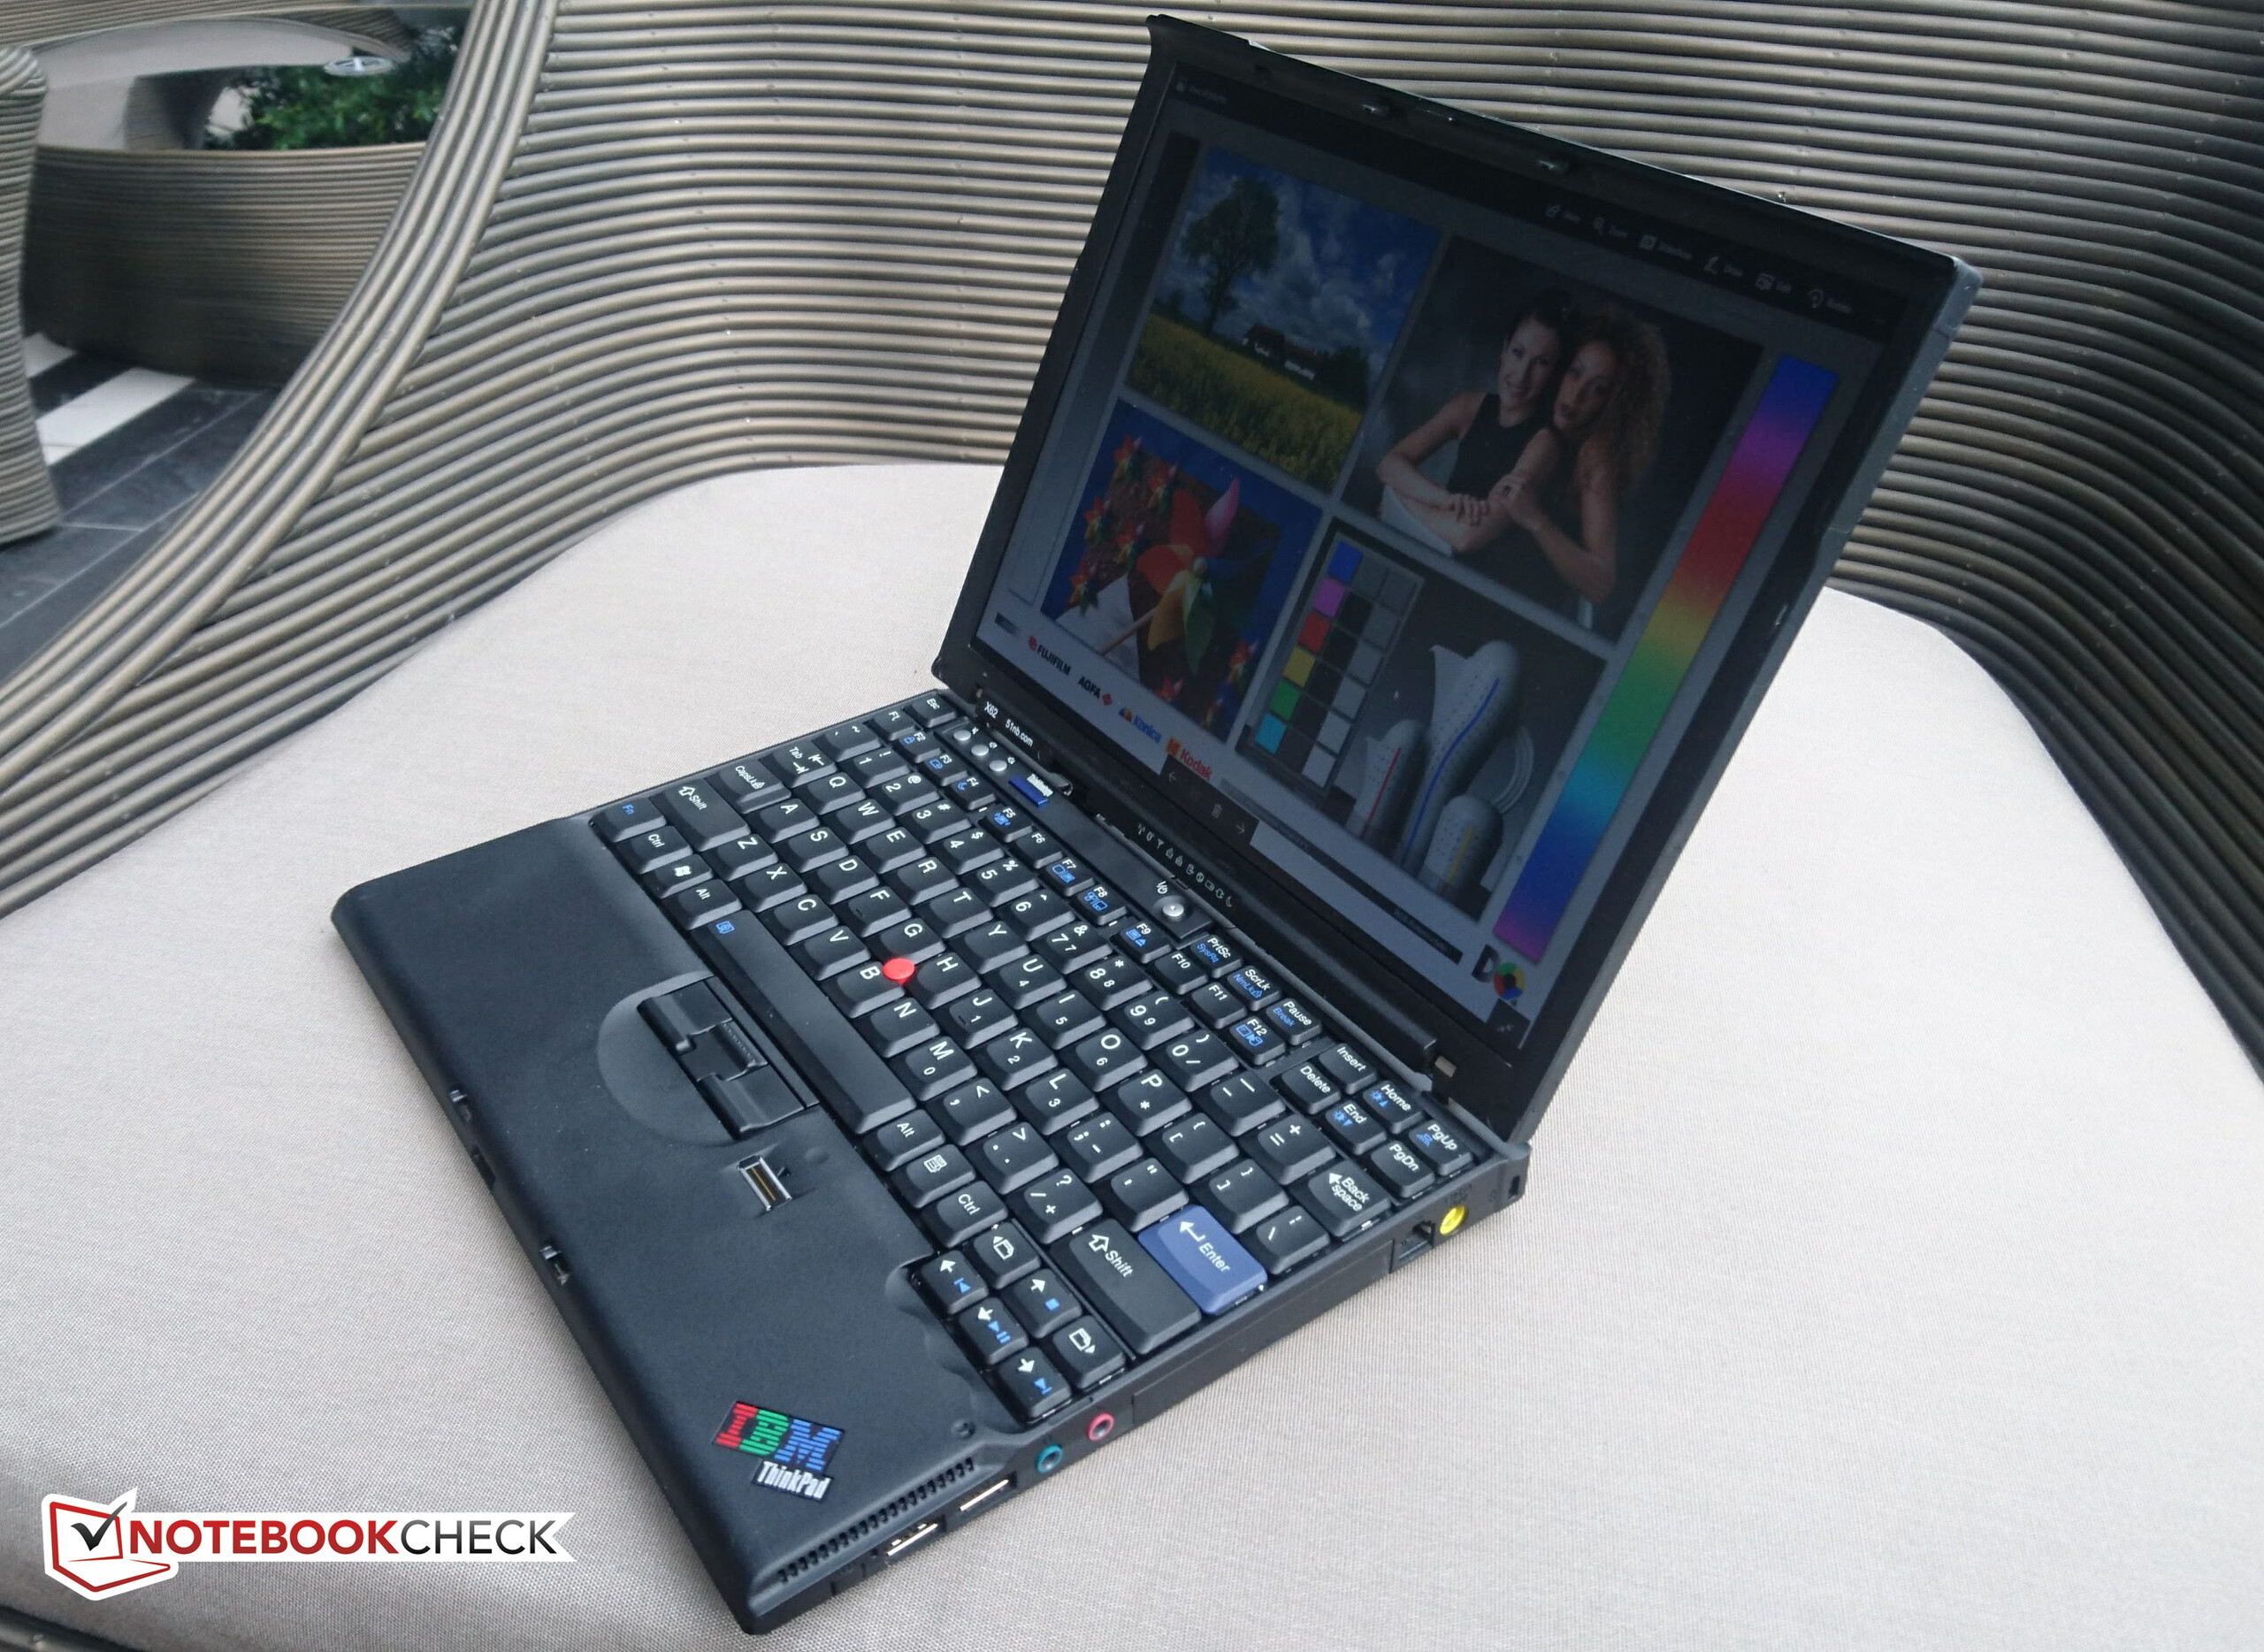
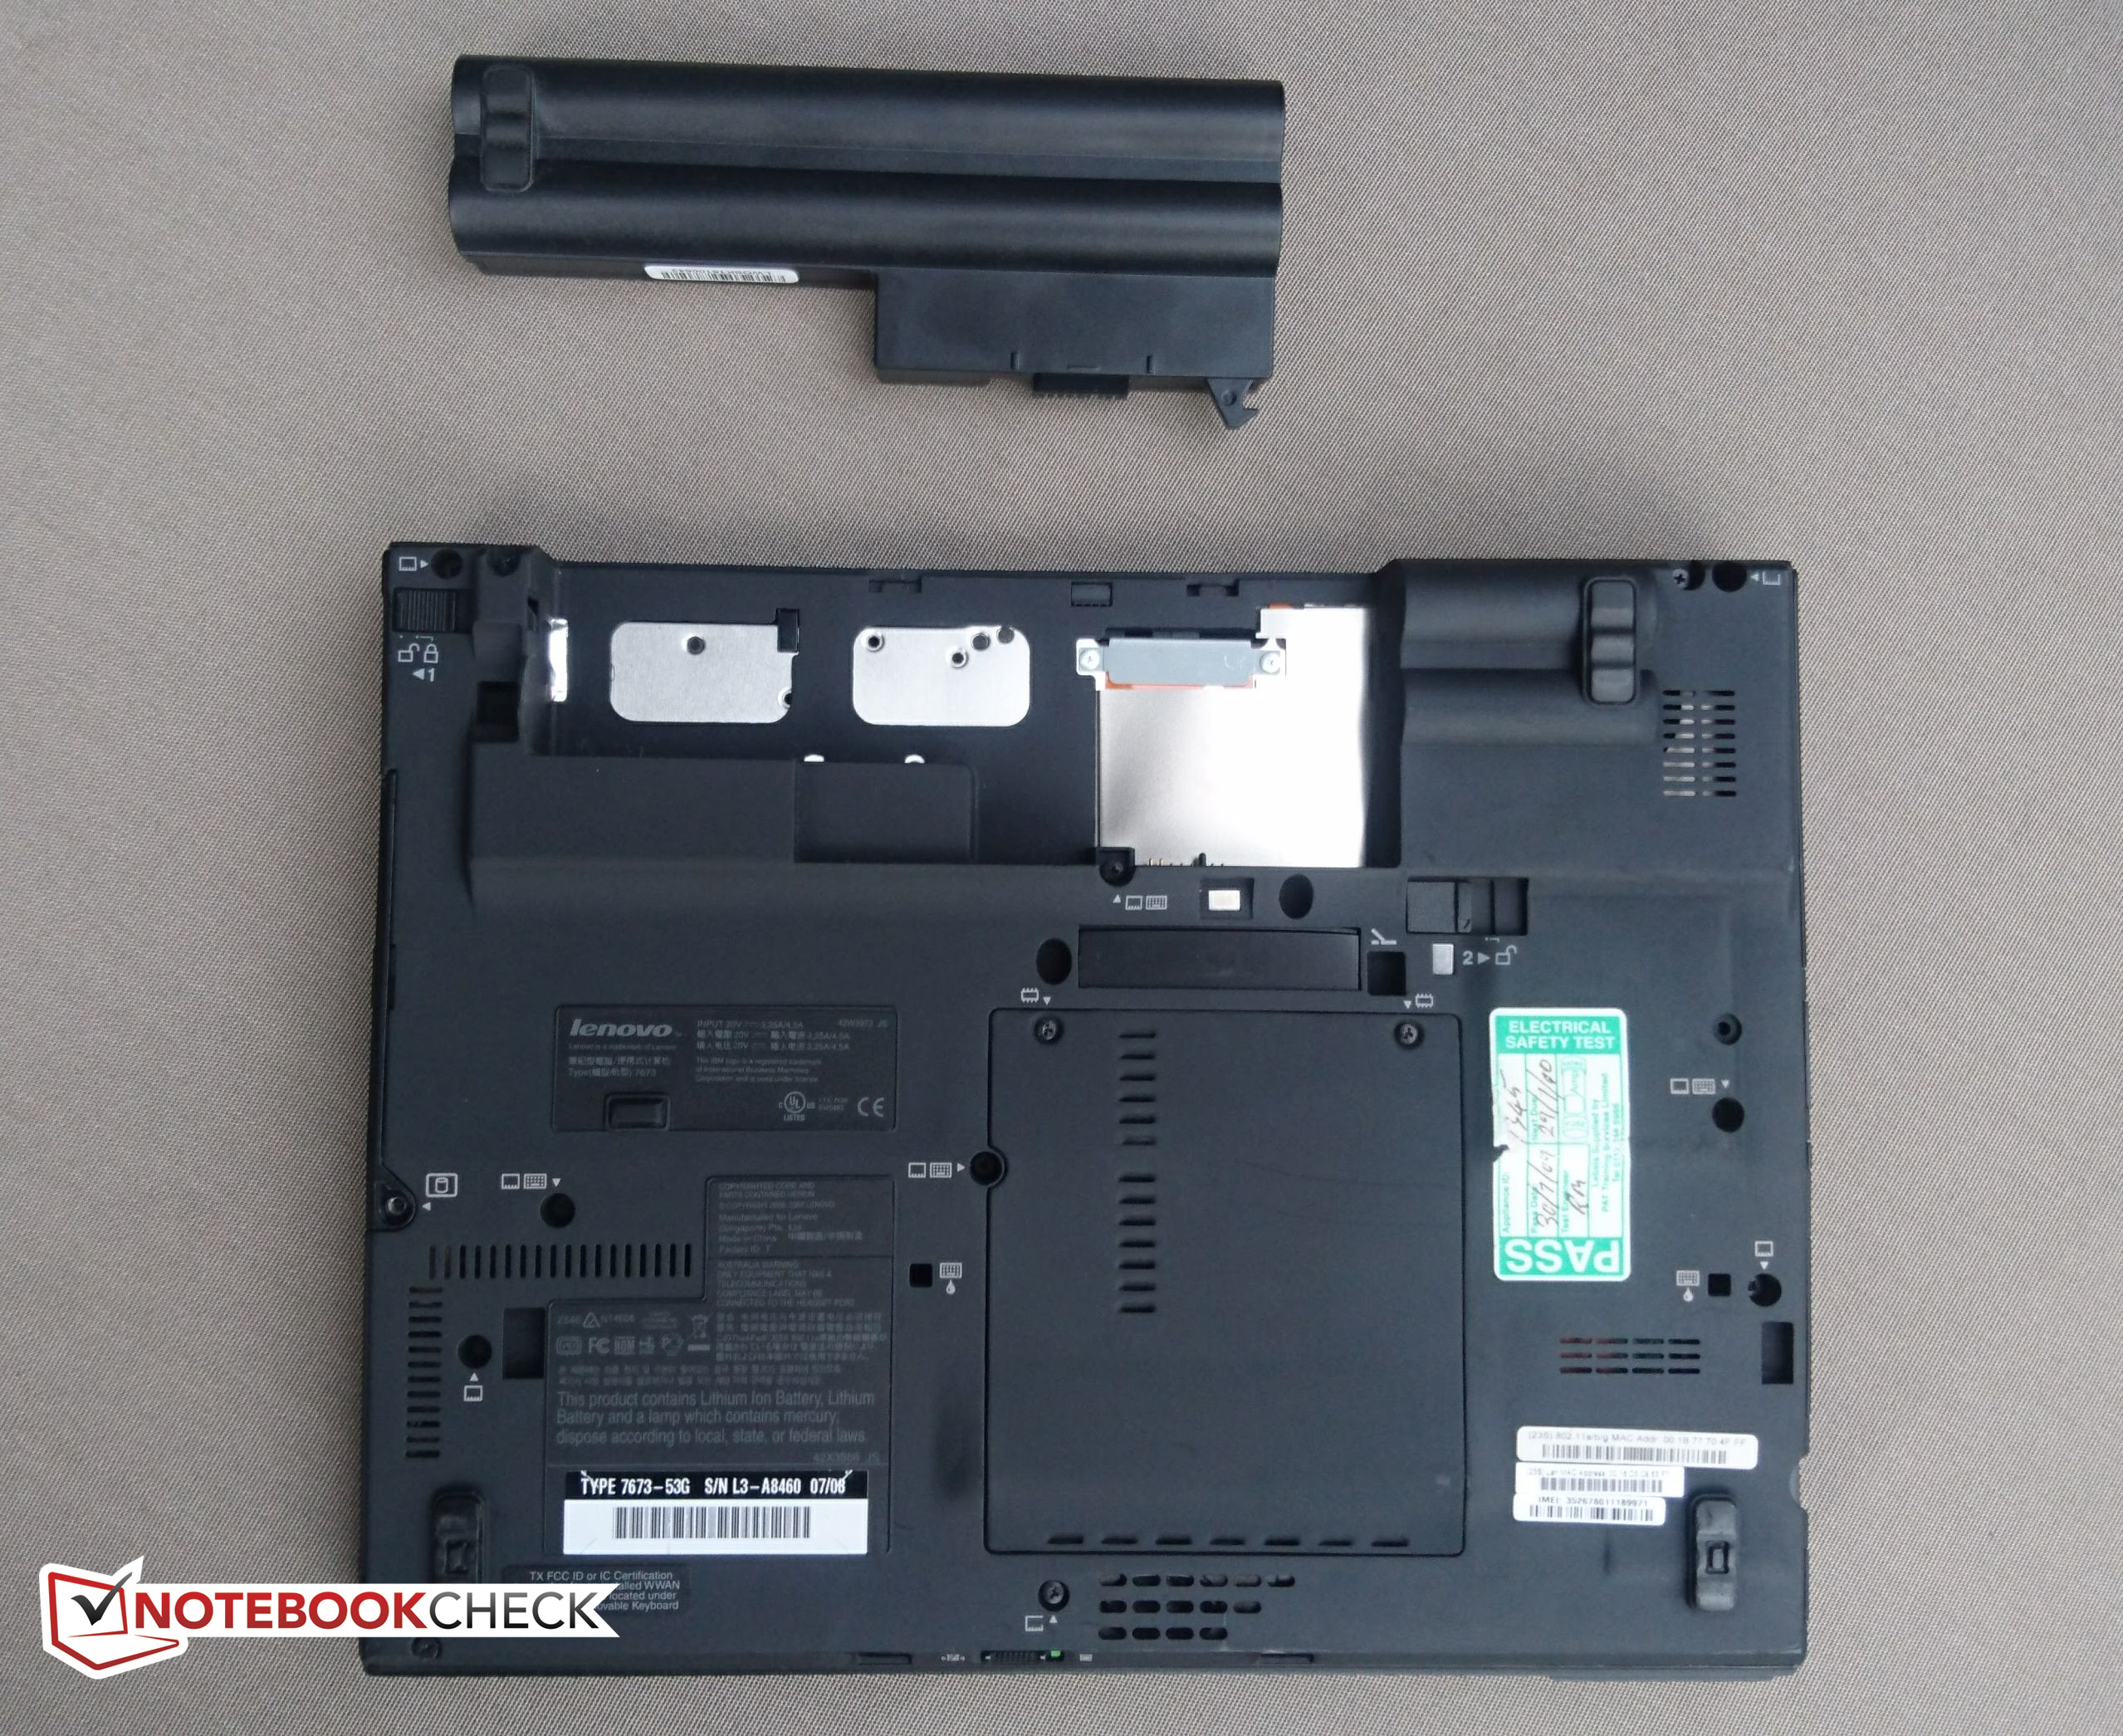
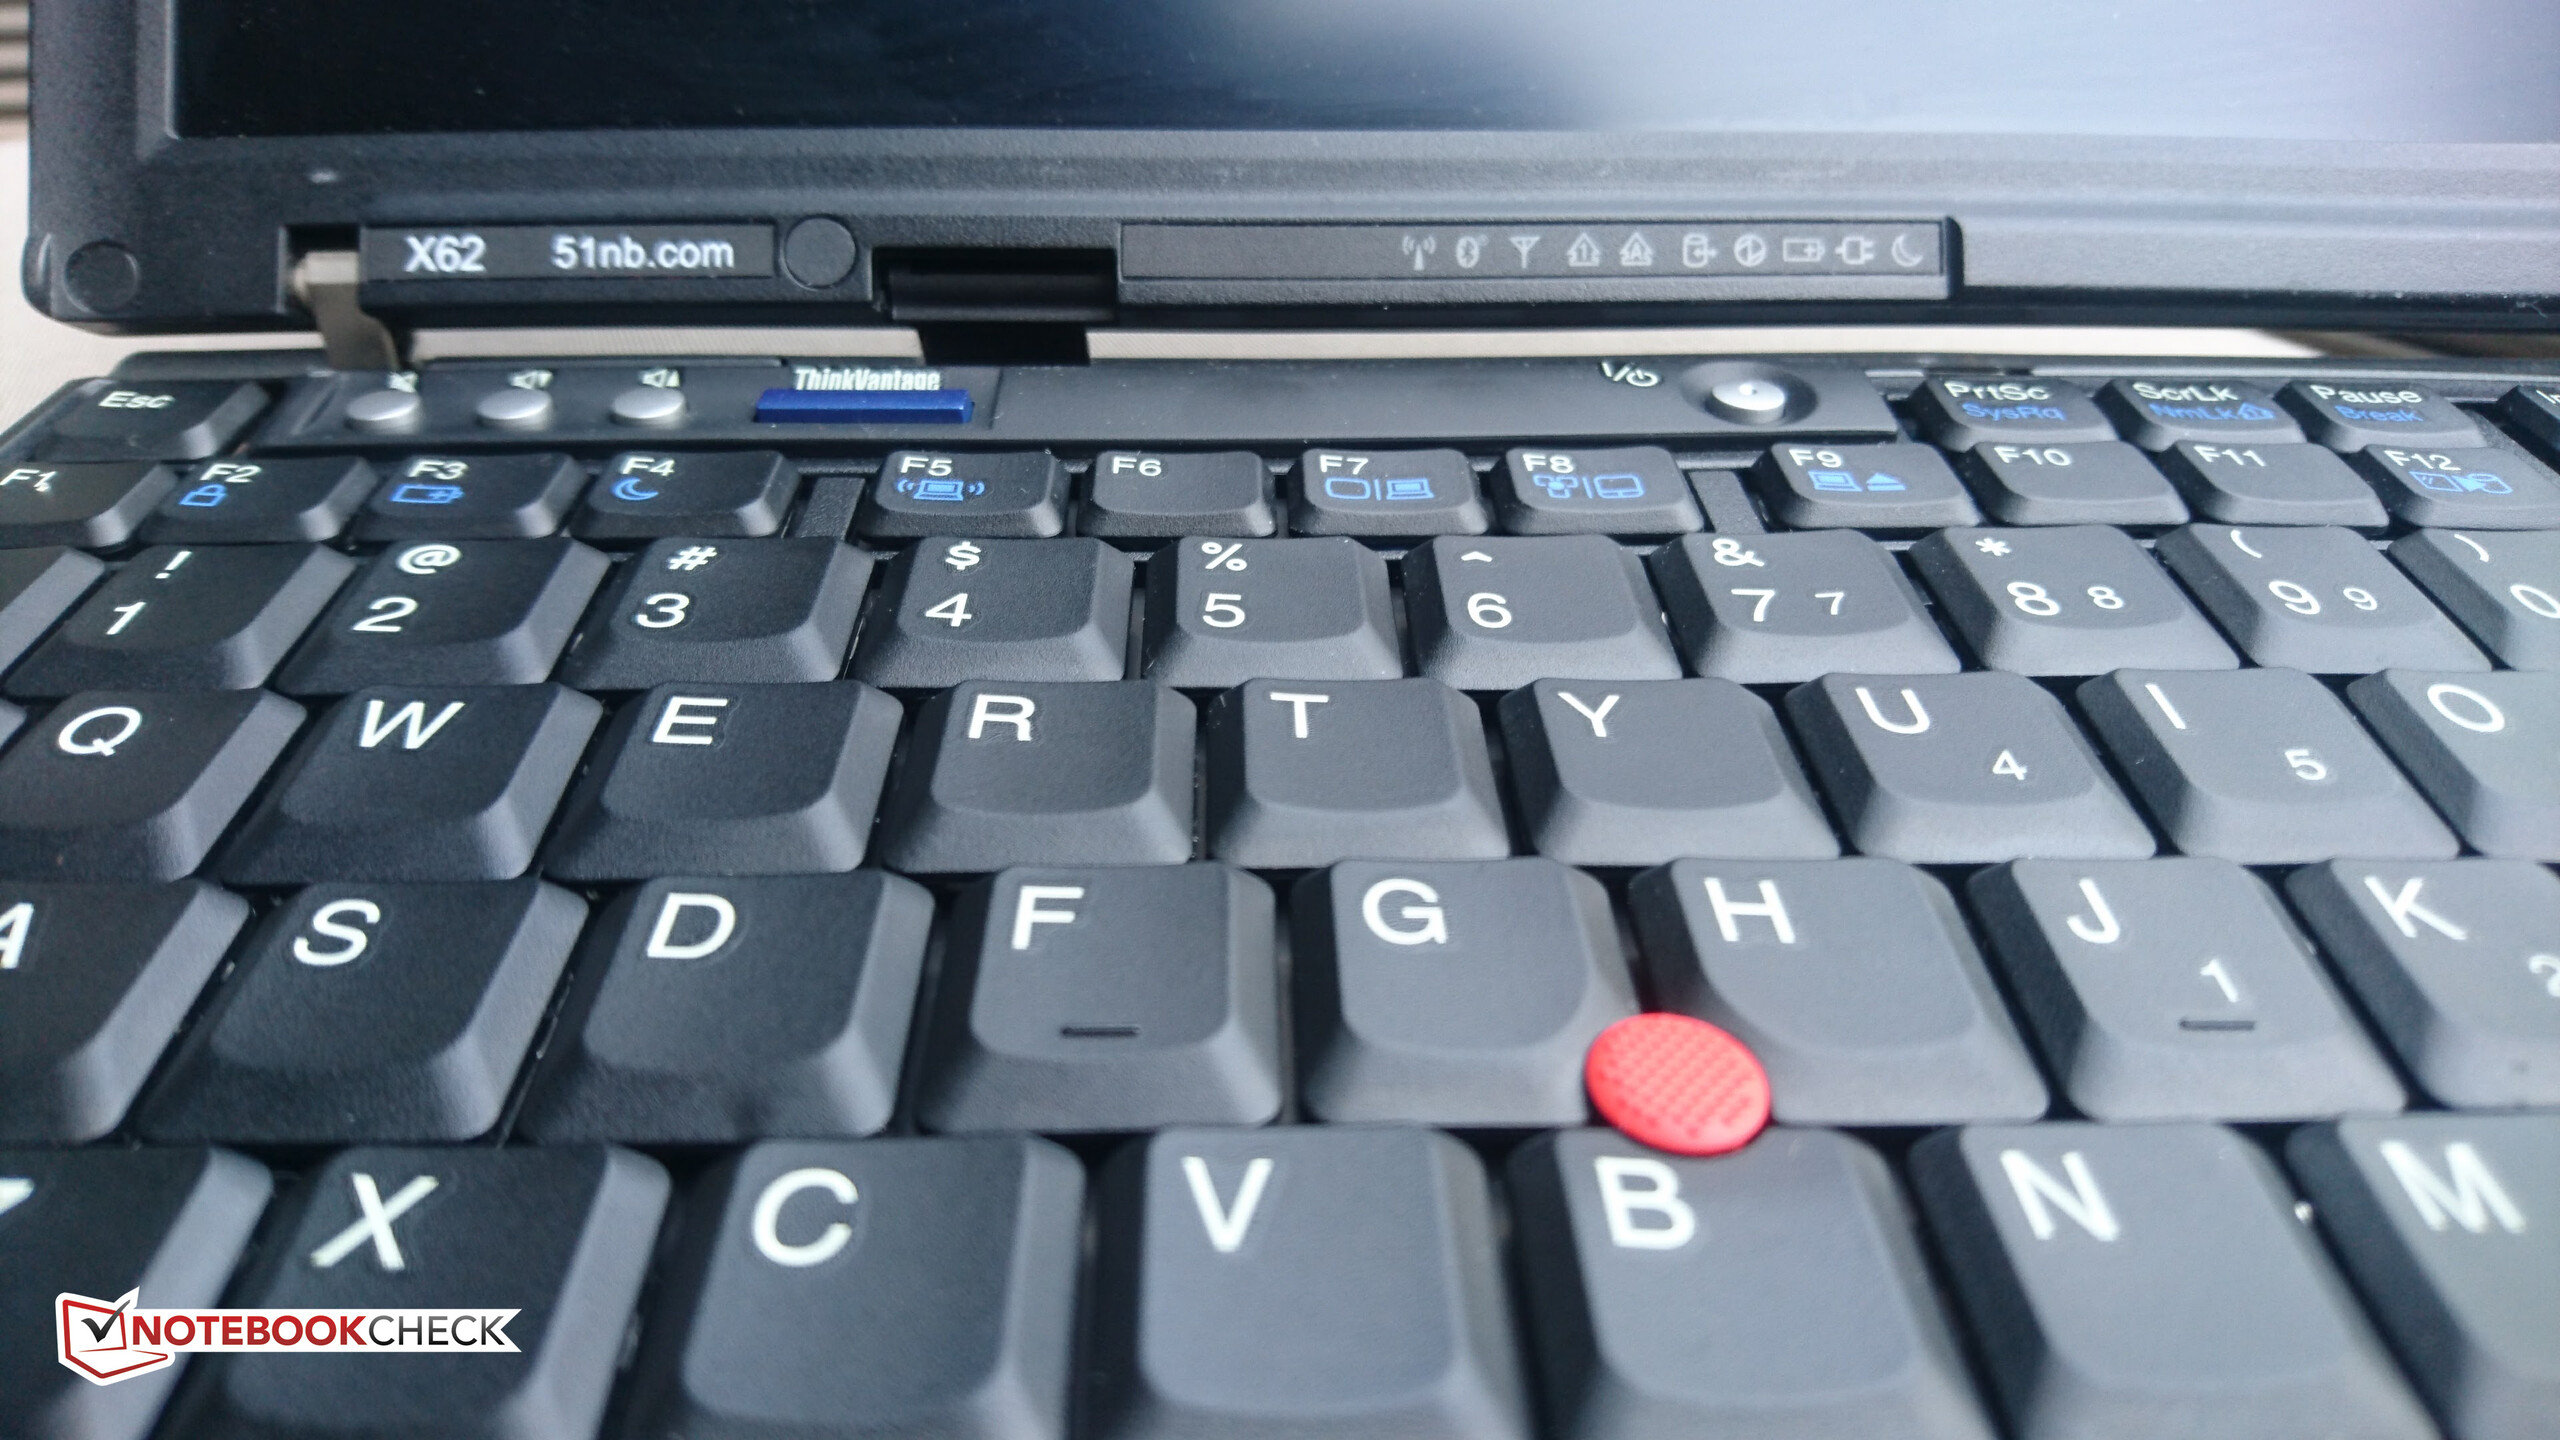
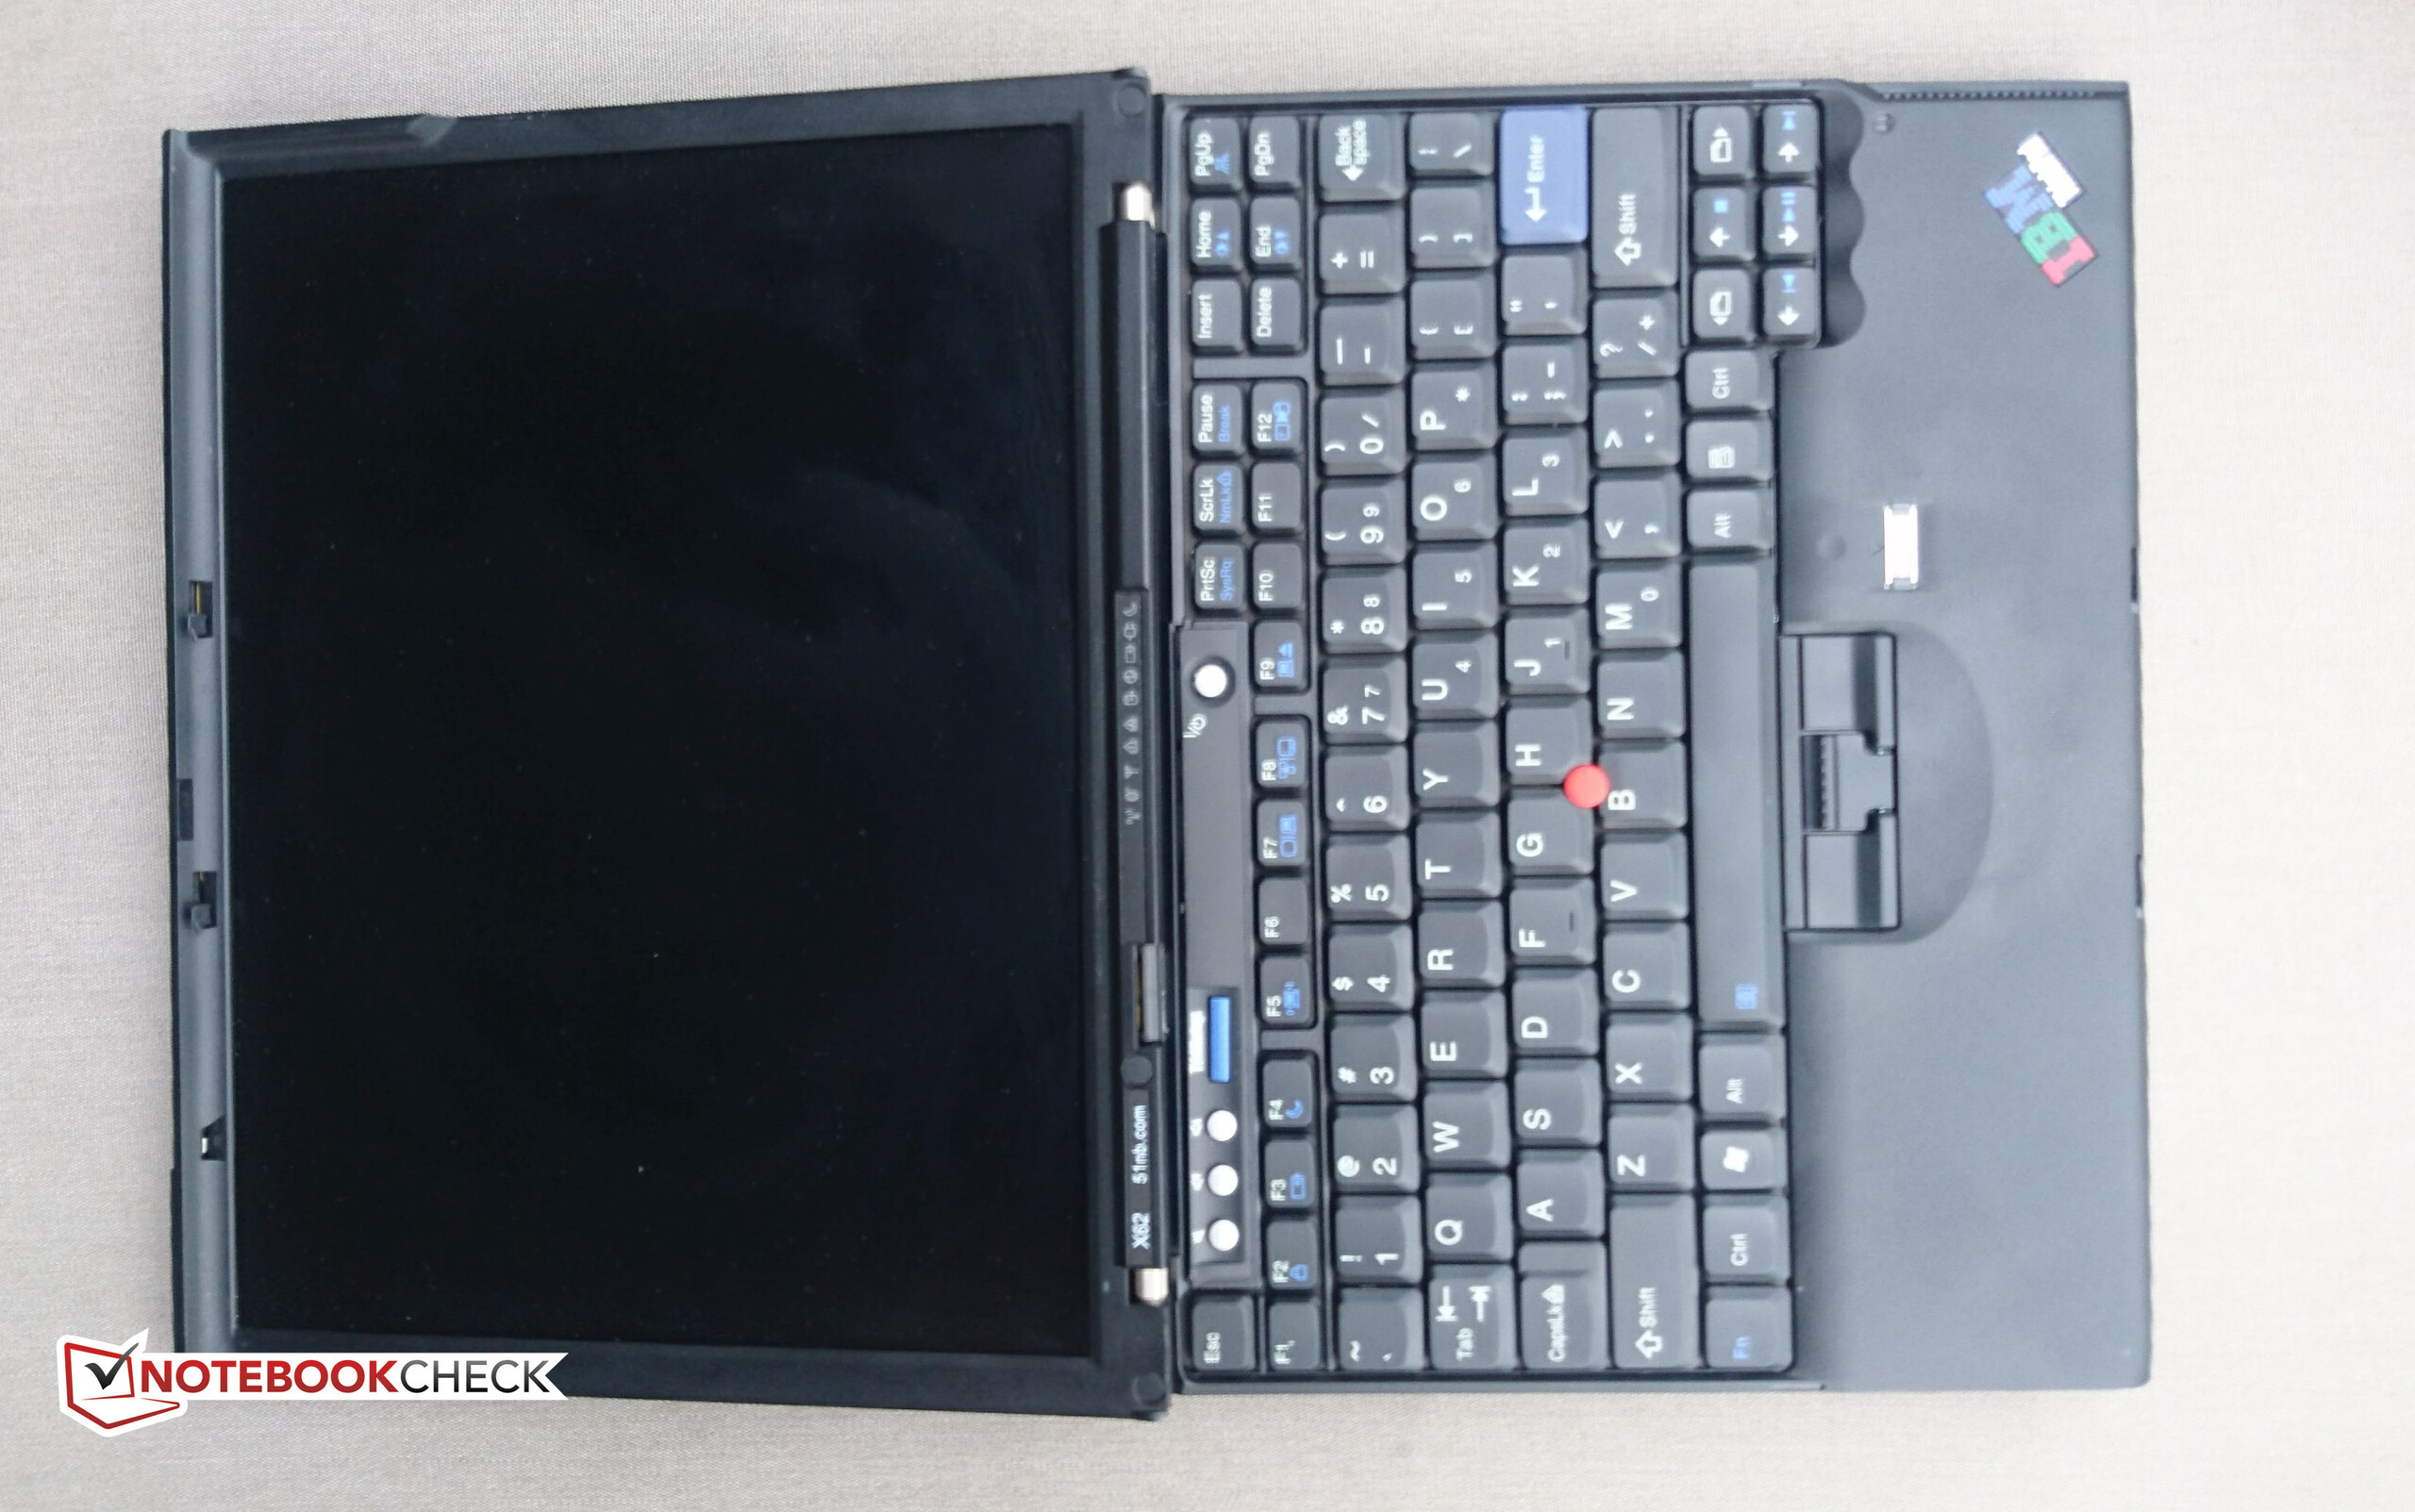
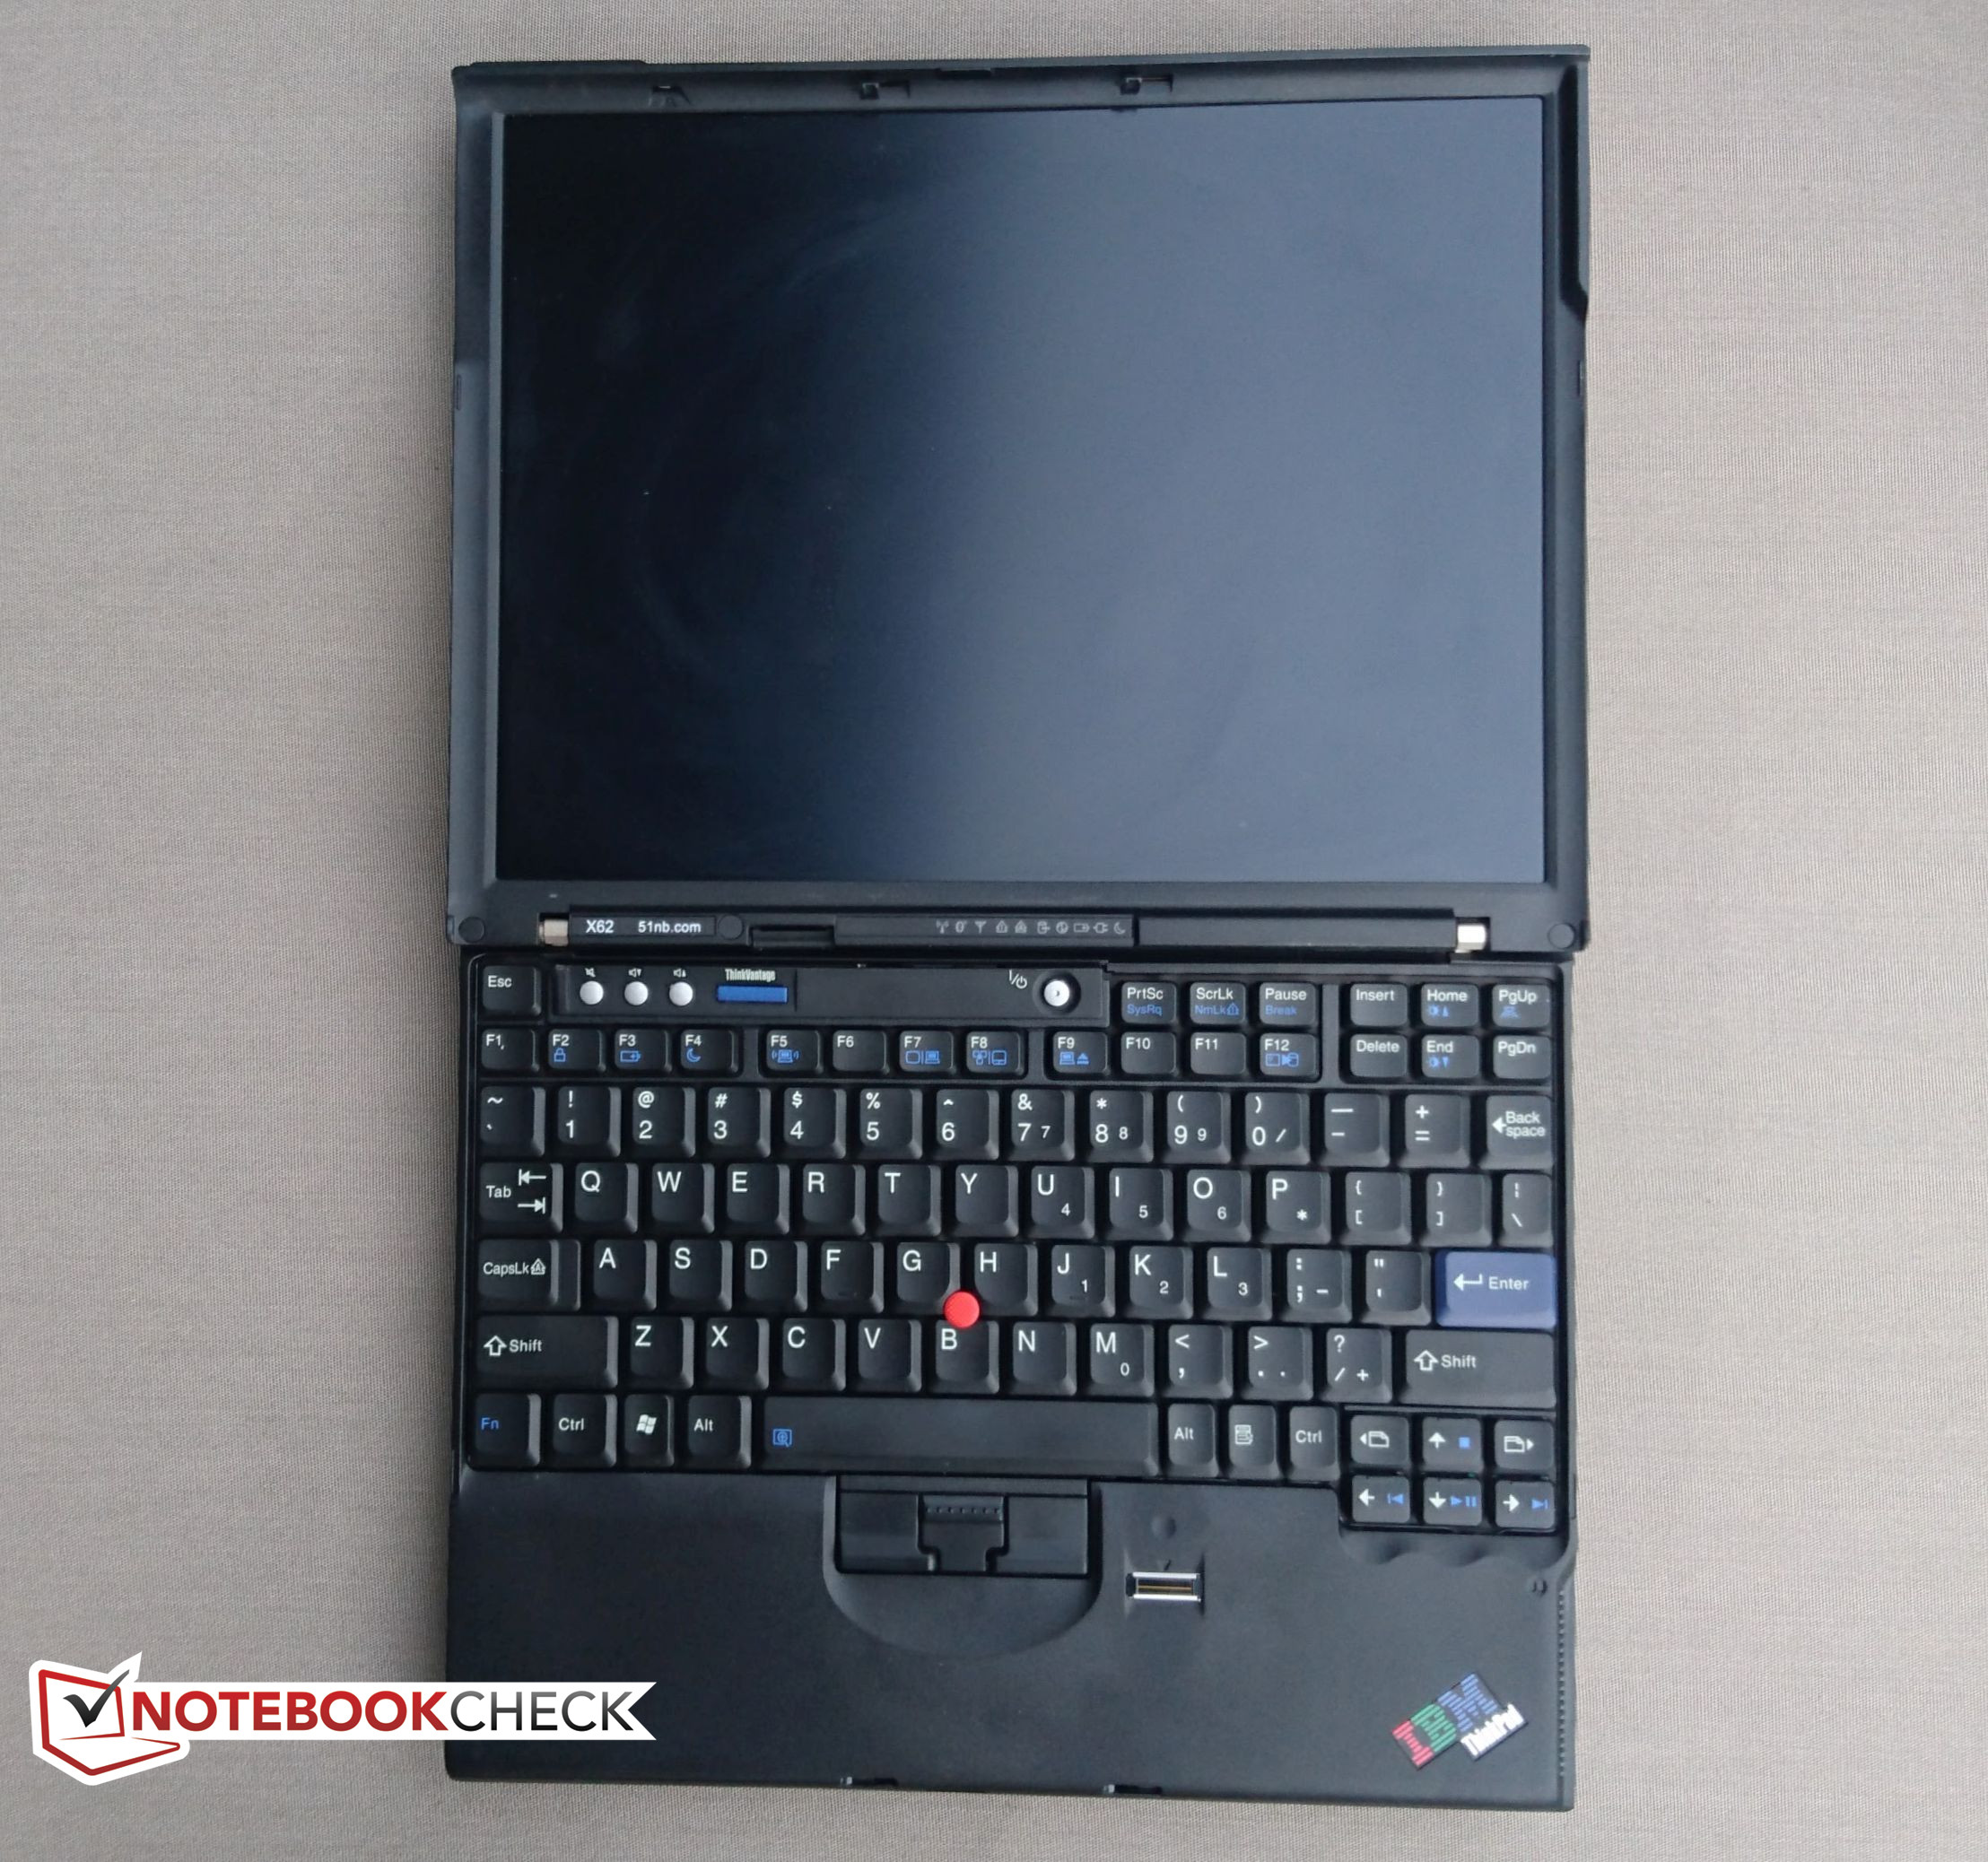
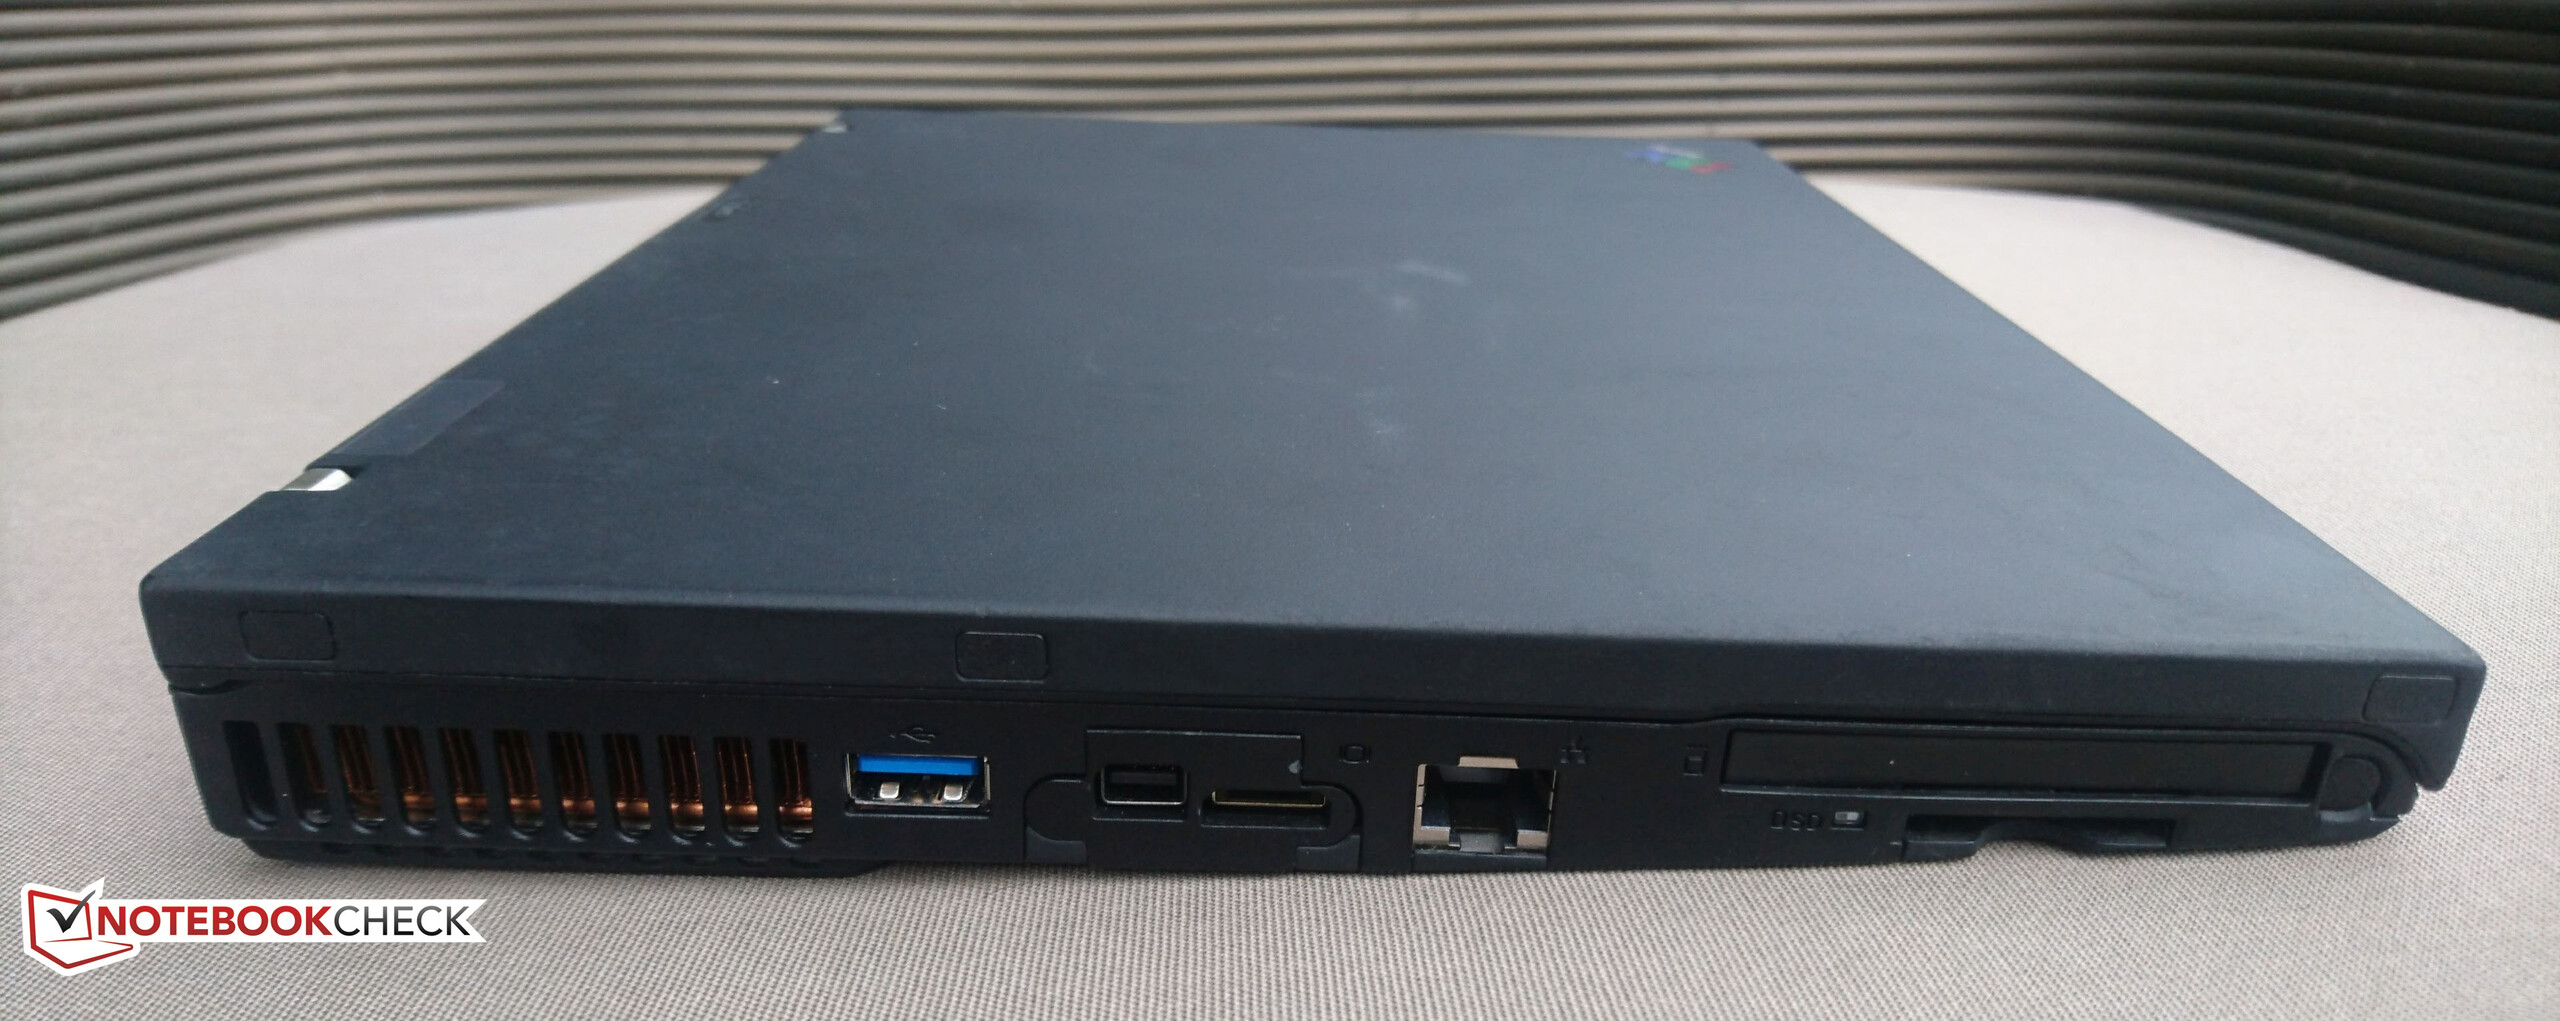
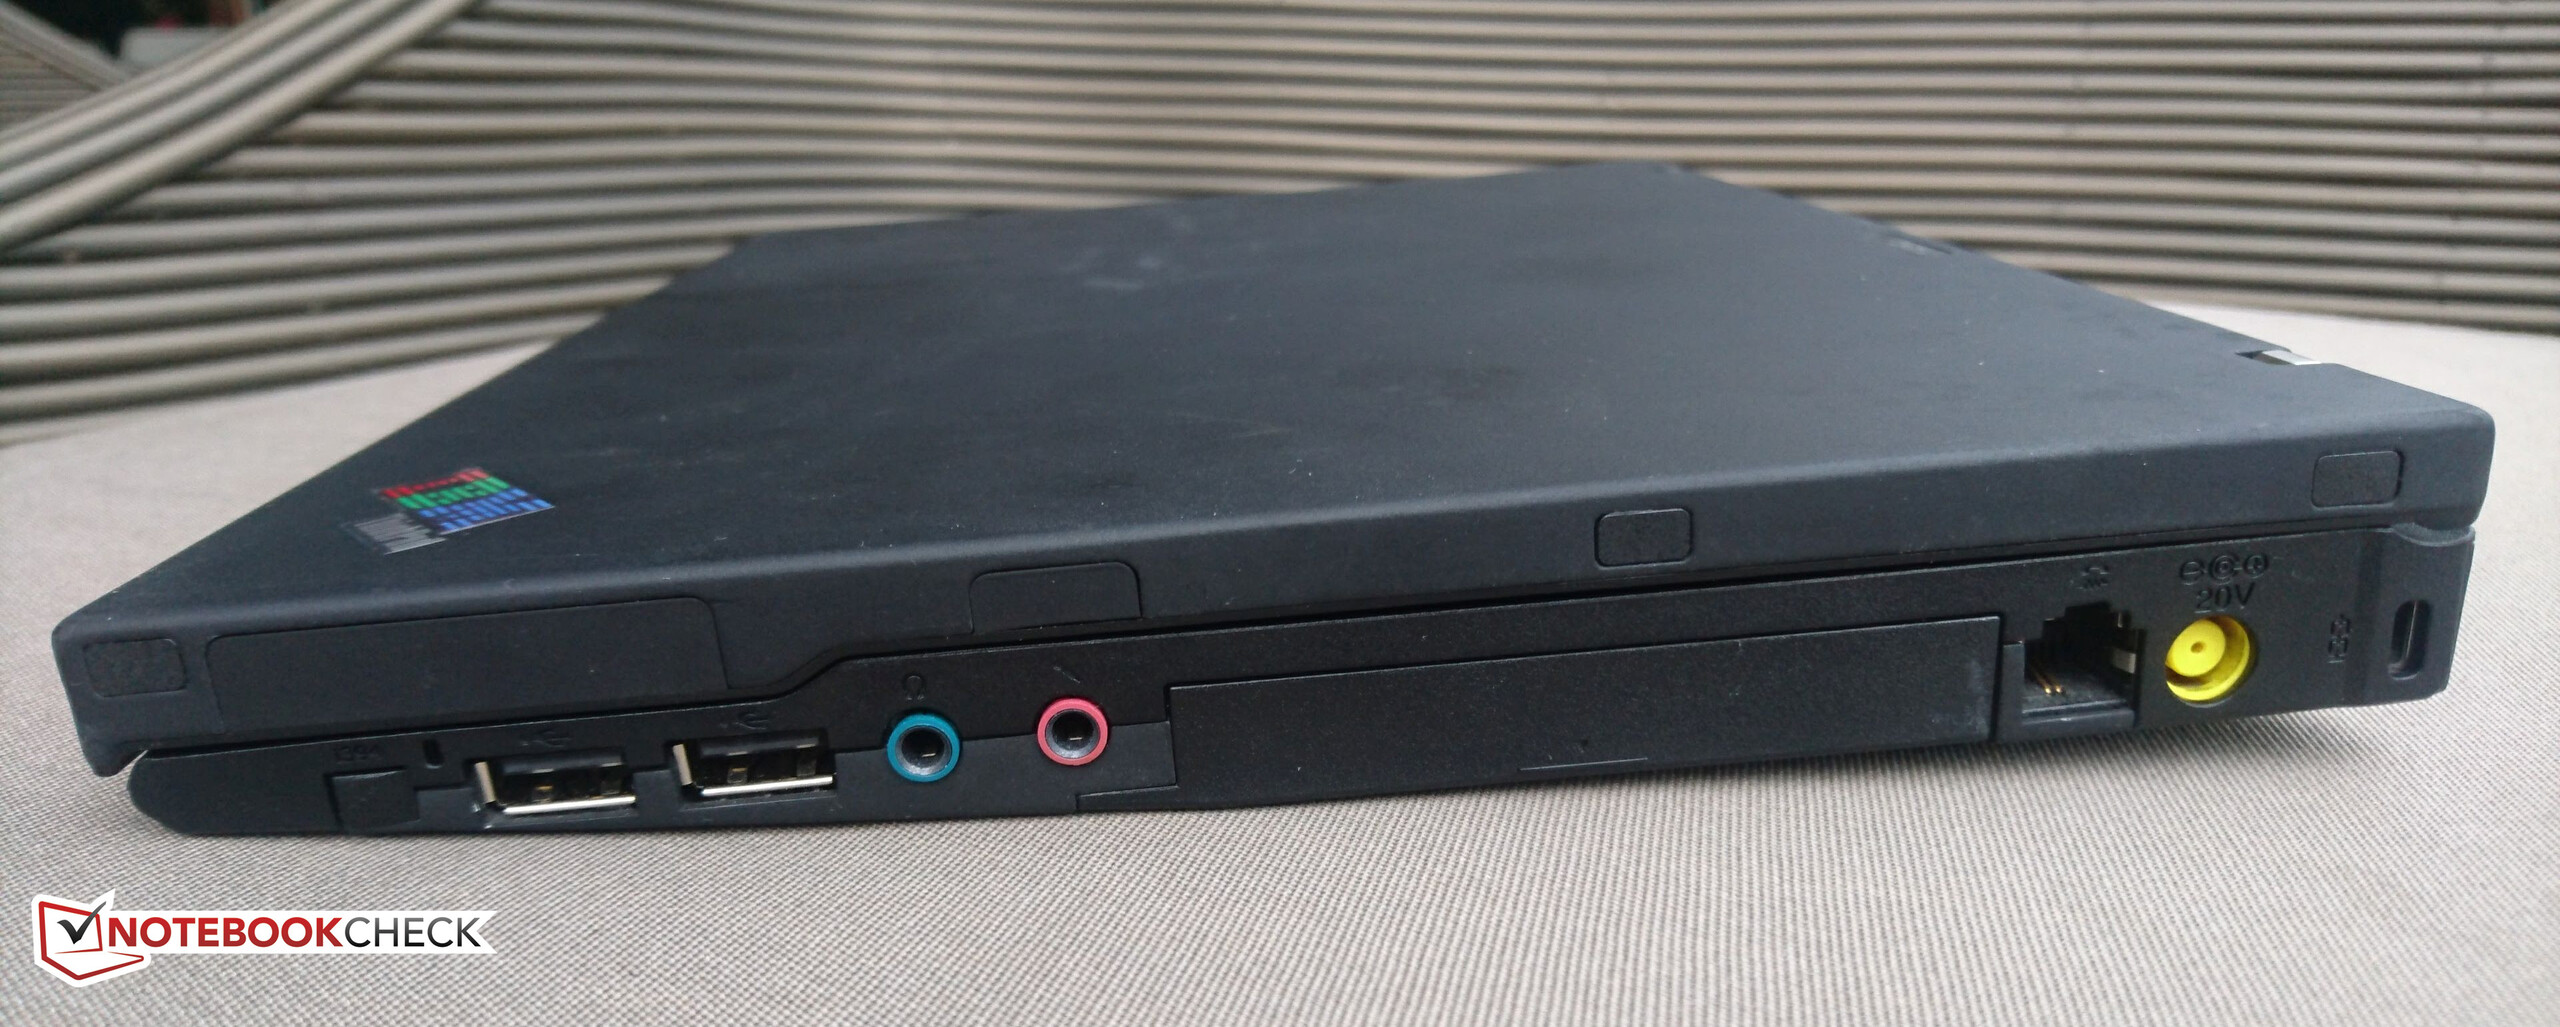
O X62 pega o chassi sólido e compacto de um X61 2007 e tenta moderniza-lo em um a efetiva máquina de trabalho para hoje em dia. Em sua maior parte, podemos dizer que o X62 emprestado para nós pela 51nb tem bastante sucesso neste objetivo: O chassi é ThinkPad clássico em sua melhor expressão, o teclado exibe zero flexões e é um prazer digitar com ele, e o desempenho da quinta geração das CPUs ULV Broadwell está no mesmo nível ou pe superior a portáteis com especificações similares. No entanto, a tela — embora seja uma excelente tela de 12,1 polegadas com resolução de 1400 x 1050 — é escura, inclusive para os padrões ThinkPad. Embora comprar um kit de atualização de iluminação LED seja uma opção, seria aproximadamente outros US$50 sobre o custo inicial do X62. O fato de que a tela precise ser mantida quase no brilho máximo o tempo todo, também afeta a duração da bateria da máquina, o que significa que a bateria aior de 8 células de 75WHr será uma necessidade se não atualizar a iluminação de fundo.
O X62 é um ultra portável absolutamente exclusivo que consegue se posicionar com bastante sucesso como uma mistura de nostalgia e modernidade com apenas alguns engasgos. Não é u portátil para qualquer um, no entanto, e para alcançar o seu potencial será necessário uma atualização pós-venda adicional de um kit de iluminação de fundo de LED.
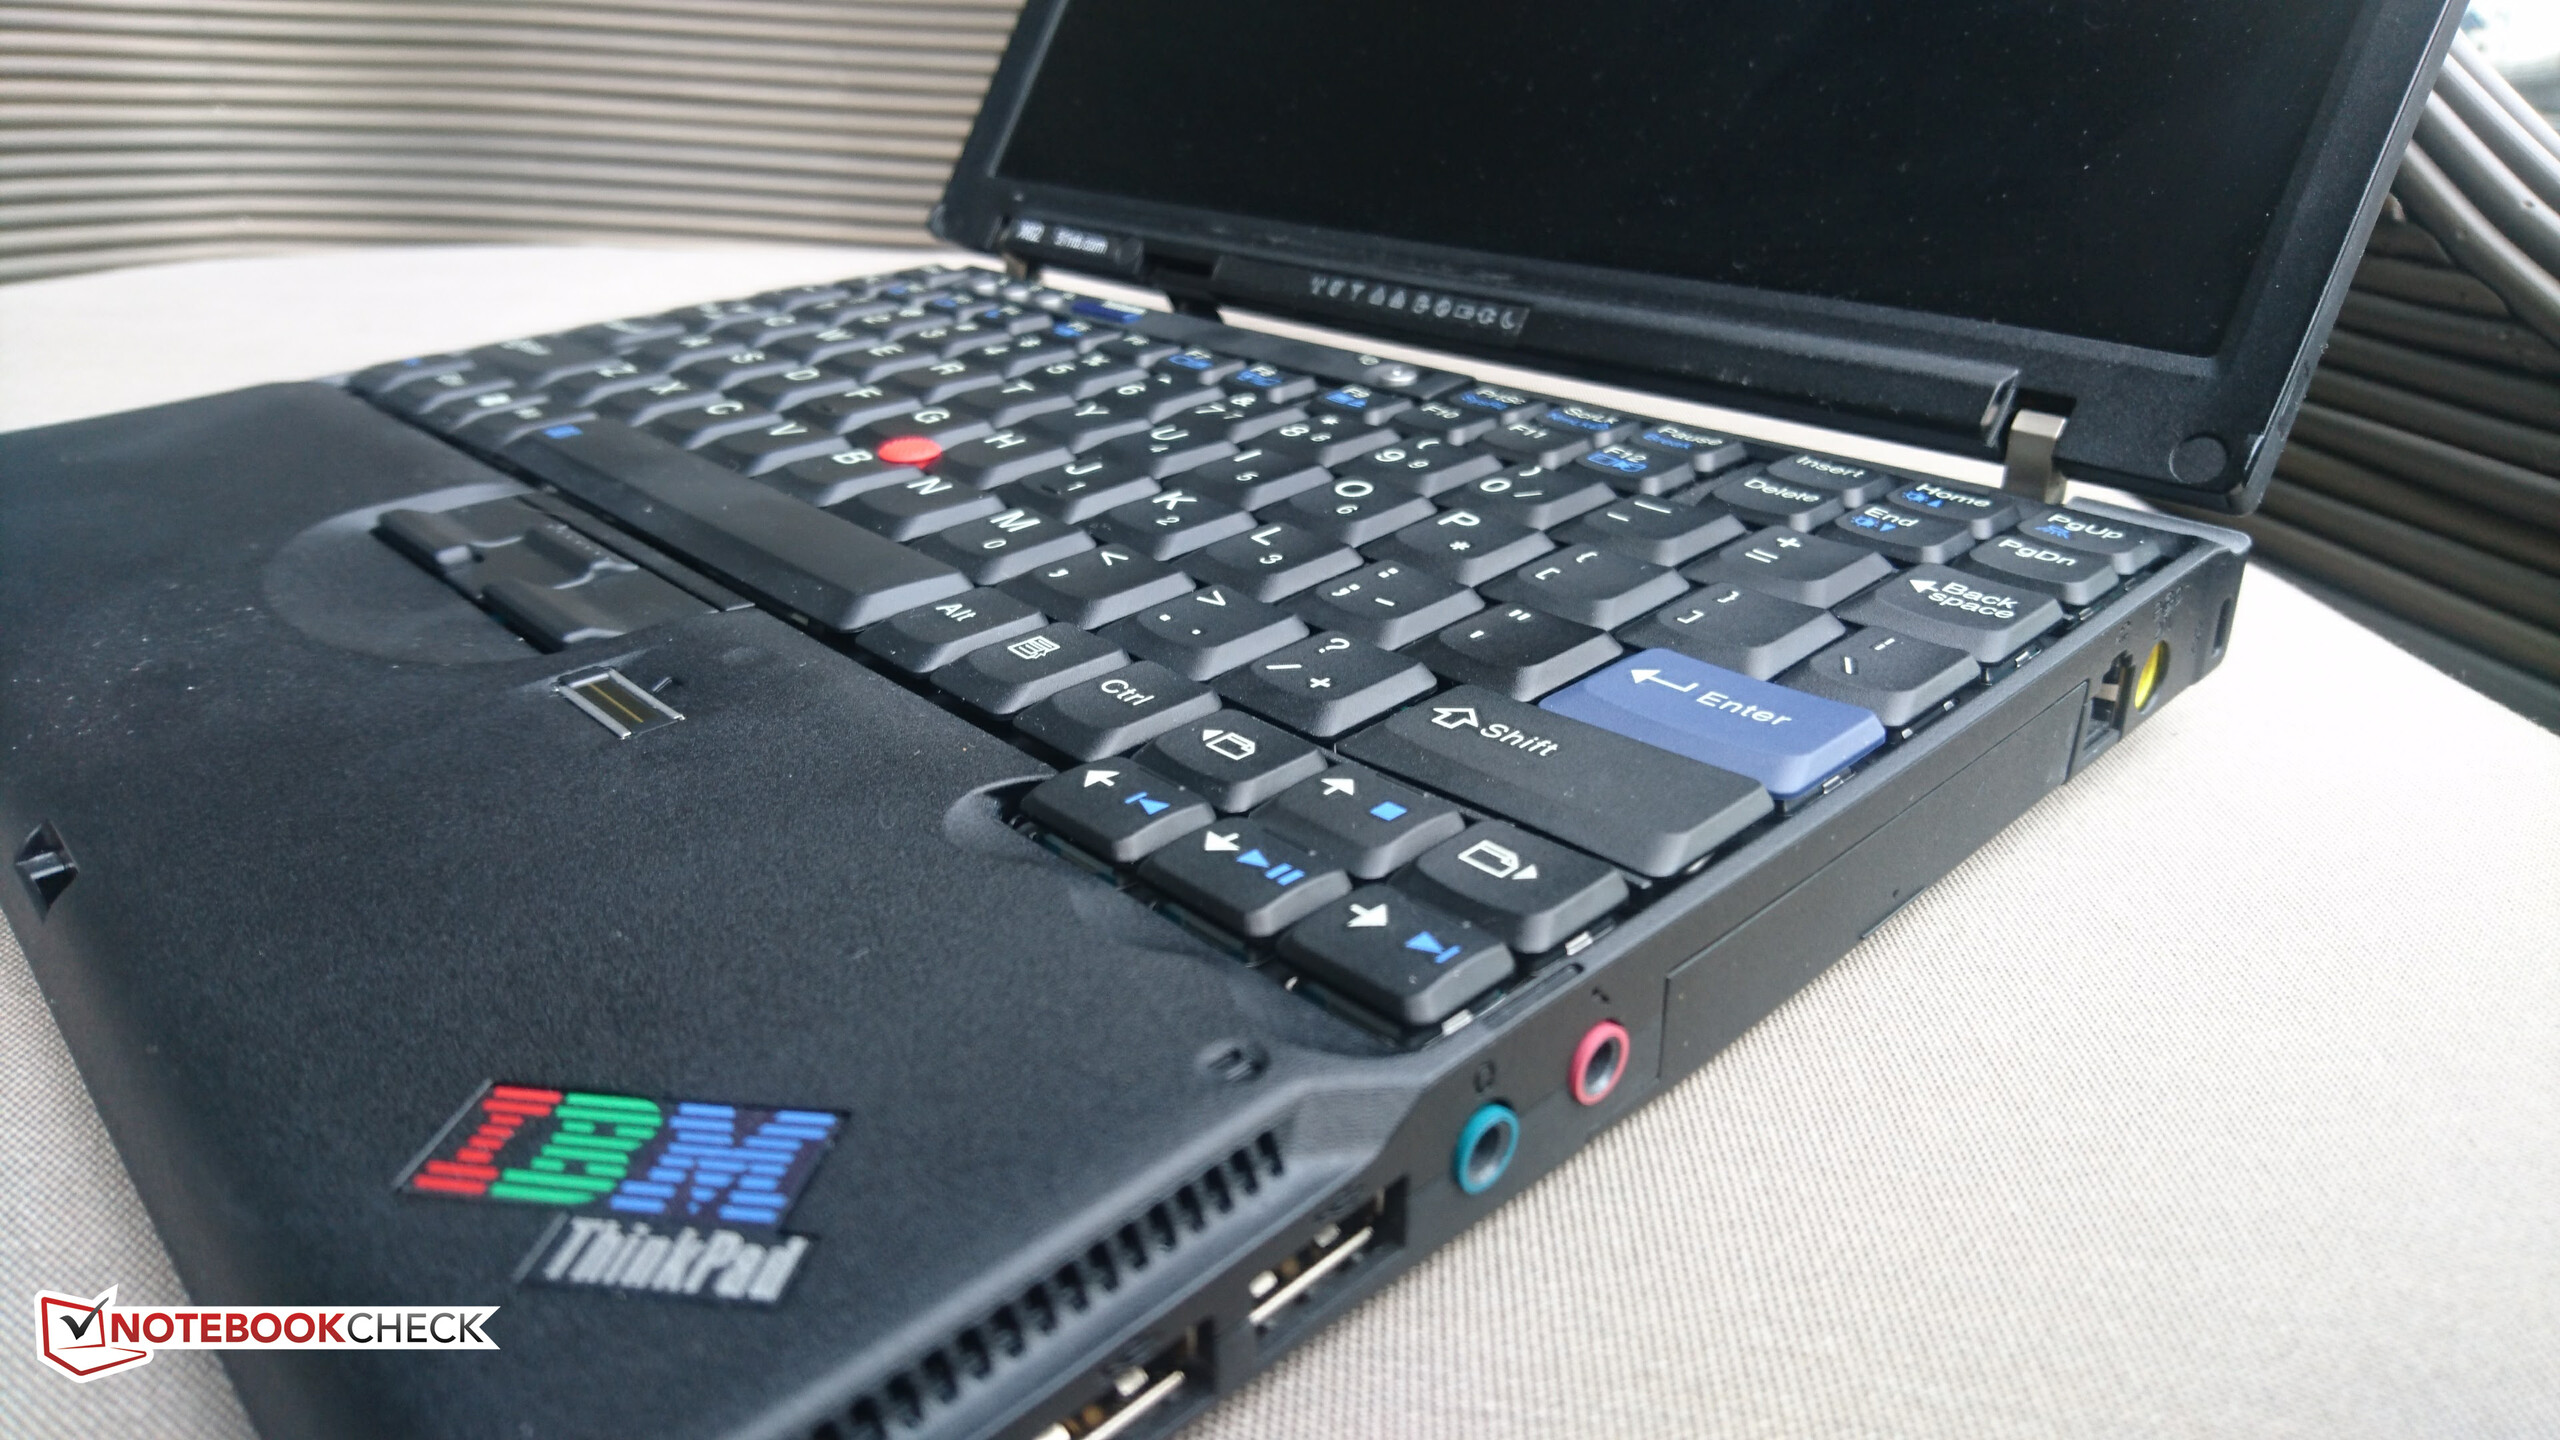
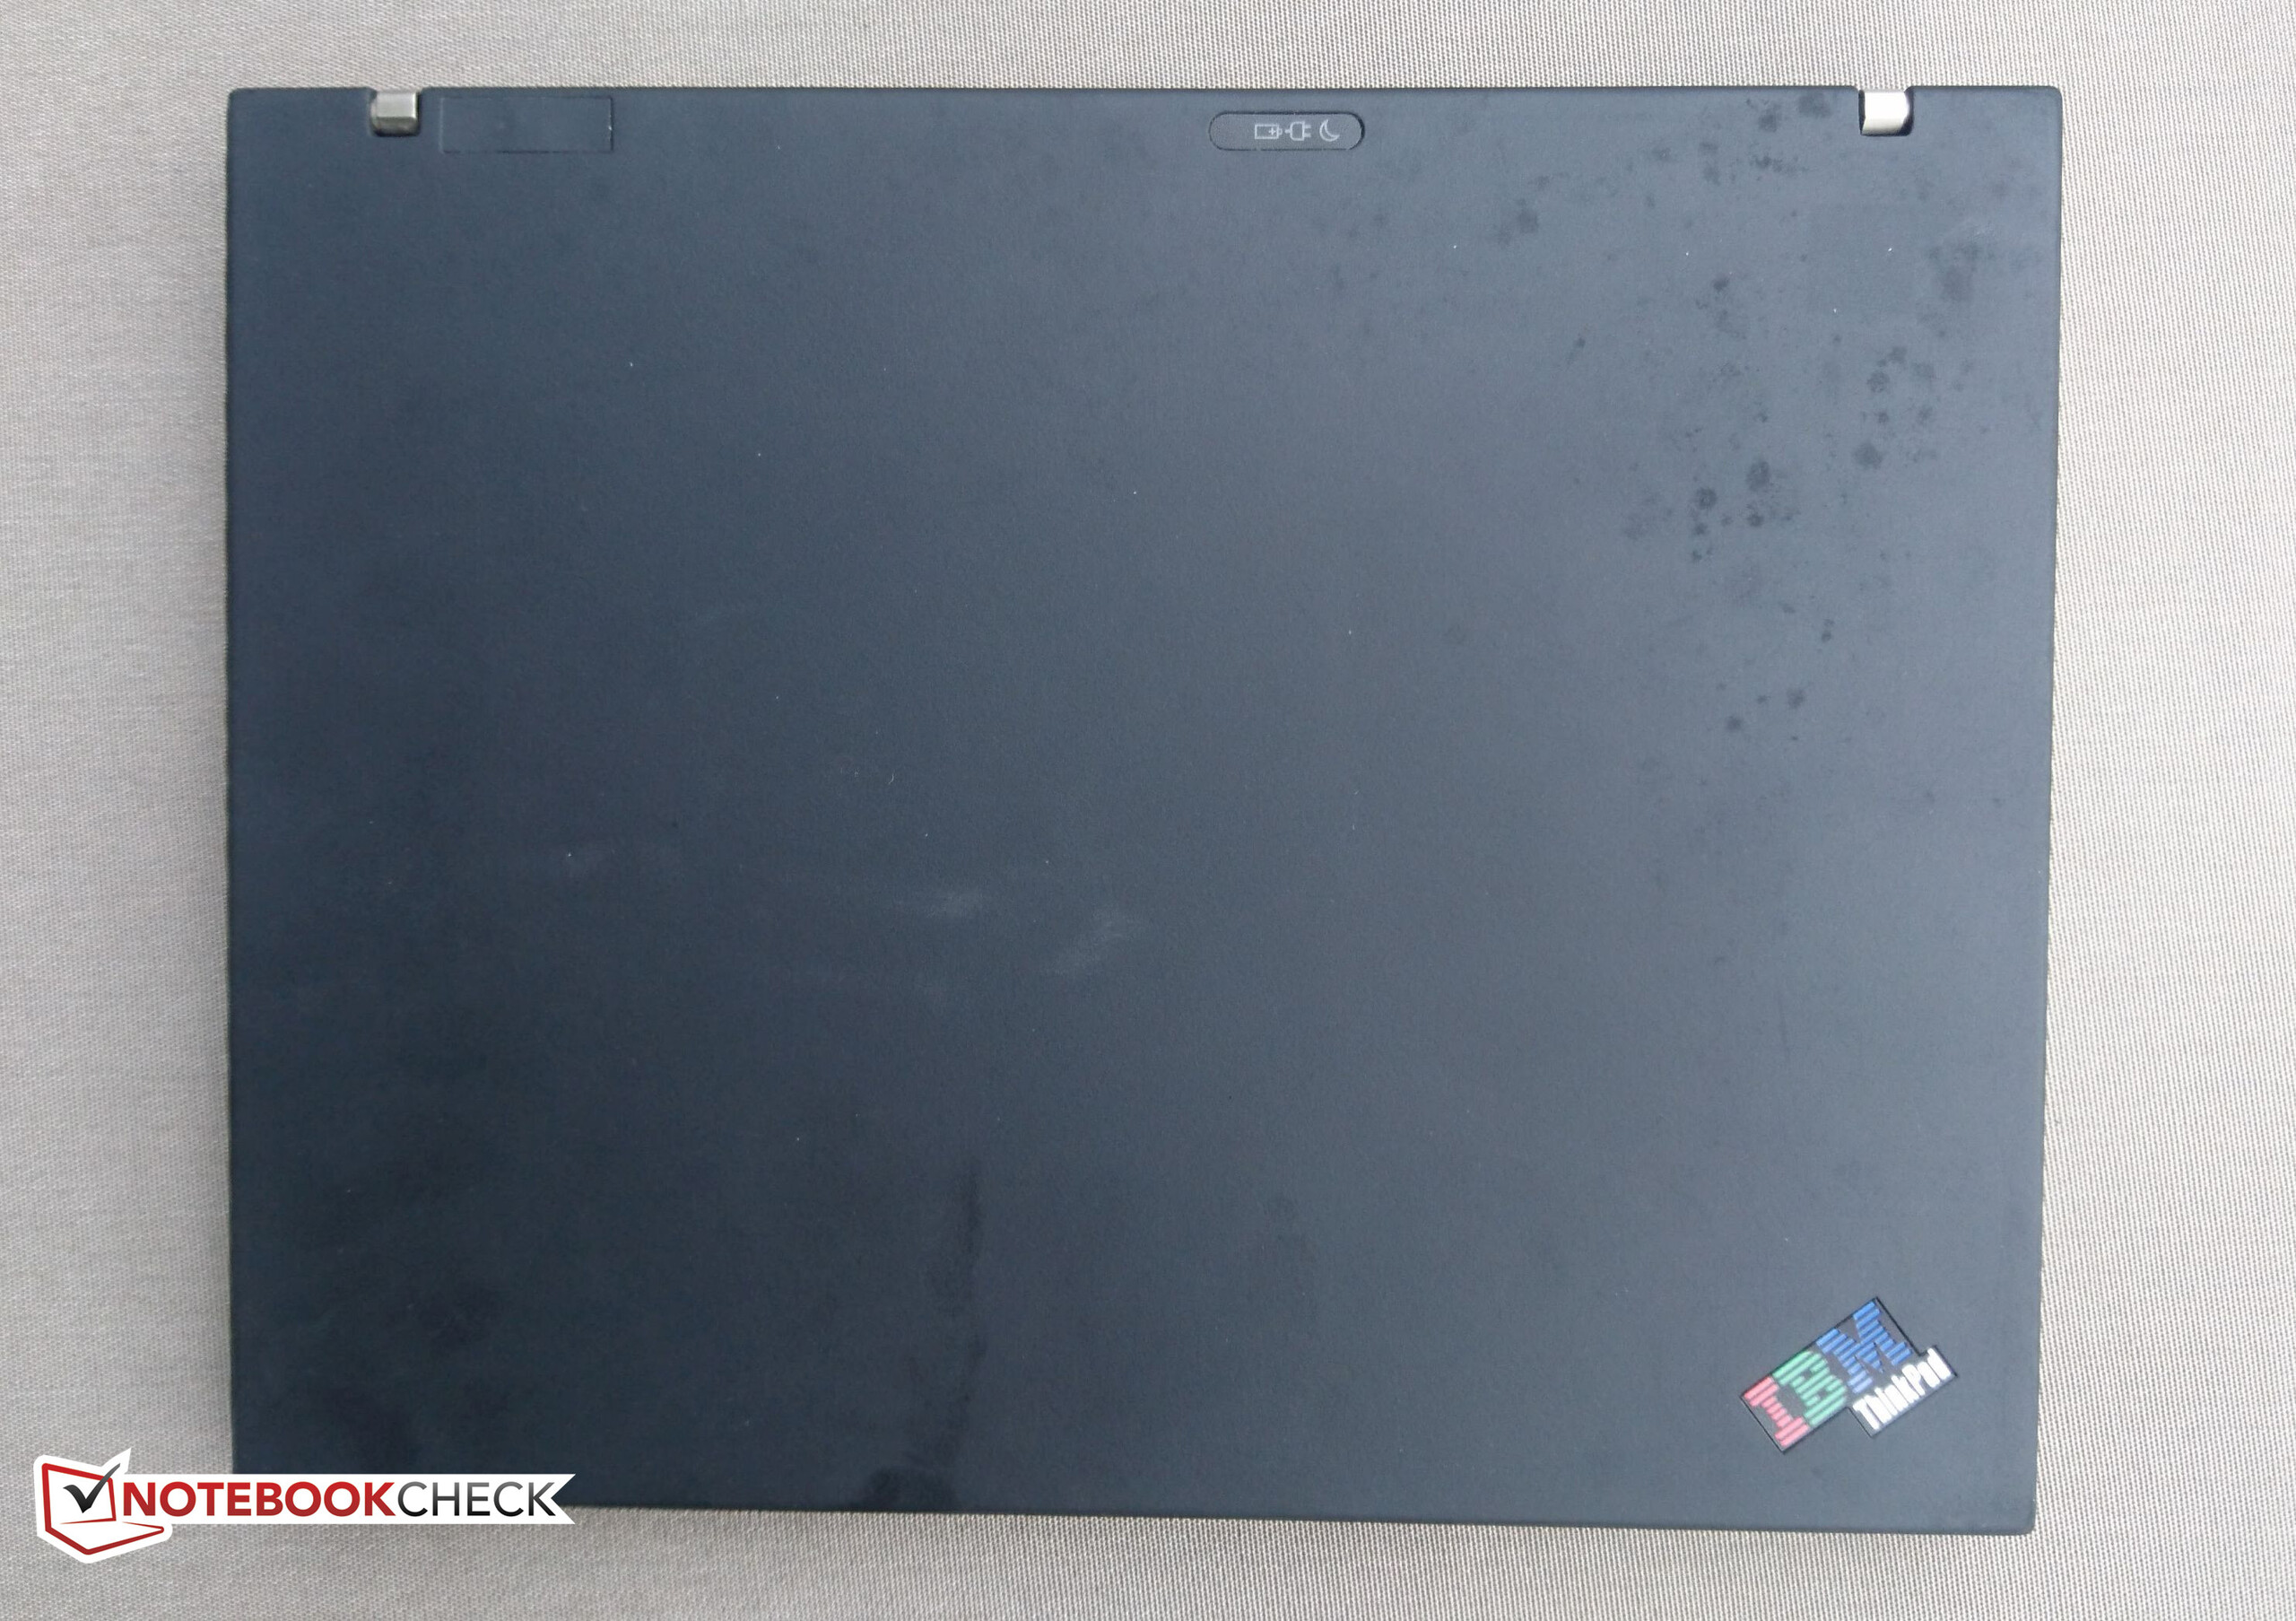
O X62 é uma carta de amor para a época dos ThinkPads e ThinkLights clássicos e para as telas 4:3. A natureza "faça você mesmo" do kit e a a necessidade de uma atualização da luz de fundo de LED, significa que que é um portátil para quem gosta de hobbys e para aqueles confortáveis com "mexer" na máquina, em lugar de para os usuários convencionais. No entanto, achamos que isso é bom, dado que serão produzidos muitos poucos desses portáteis e eles já são um item de coleção. Os bare-bones X62 (sem incluir RAM, HD, bateria, ou adaptador) já têm um valor não-insignificante de US$750 pelo modelo básico i5. Para edições futuras do X62, gostaríamos de ver kit de iluminação de fundo de LED instalado como padrão e que inclua baterias e adaptadores com a unidade.
Se estiver interessado em adquirir um X62 ou outro aparelho da 51nb creations, você pode conferir seu website em inglês aqui para entrar em contato com eles.
Price comparison
