Breve Análise do Portátil Lenovo Yoga S730-13IWL (FHD, Core i7-8565U)
| |||||||||||||||||||||||||
iluminação: 85 %
iluminação com acumulador: 343 cd/m²
Contraste: 1039:1 (Preto: 0.33 cd/m²)
ΔE ColorChecker Calman: 2.38 | ∀{0.5-29.43 Ø4.71}
ΔE Greyscale Calman: 3.01 | ∀{0.09-98 Ø4.96}
98% sRGB (Argyll 1.6.3 3D)
62% AdobeRGB 1998 (Argyll 1.6.3 3D)
67.8% AdobeRGB 1998 (Argyll 3D)
98.2% sRGB (Argyll 3D)
66.3% Display P3 (Argyll 3D)
Gamma: 2.44
CCT: 7198 K
| Lenovo Yoga S730-13IWL B133HAN05.1, , 1920x1080, 13.3" | Lenovo Ideapad 720S-13IKB LG Philips LGD04EF, , 1920x1080, 13.3" | Dell XPS 13 9370 FHD i5 SHP1484, , 1920x1080, 13.3" | HP Envy 13-ah0003ng M133NVF3 R0, , 1920x1080, 13.3" | Asus ZenBook S UX391U AUO B133HAN04.9, , 1920x1080, 13.3" | Apple MacBook Air 2018 APPA039, , 2560x1600, 13.3" | |
|---|---|---|---|---|---|---|
| Display | -10% | 2% | -17% | -5% | 1% | |
| Display P3 Coverage (%) | 66.3 | 64.3 -3% | 68.9 4% | 54.8 -17% | 64.4 -3% | 67.8 2% |
| sRGB Coverage (%) | 98.2 | 82.3 -16% | 96.6 -2% | 82.5 -16% | 90.5 -8% | 96.1 -2% |
| AdobeRGB 1998 Coverage (%) | 67.8 | 60.2 -11% | 69.6 3% | 56.6 -17% | 65.2 -4% | 69.8 3% |
| Response Times | 27% | -33% | 33% | 11% | 18% | |
| Response Time Grey 50% / Grey 80% * (ms) | 53 ? | 35 ? 34% | 62.4 ? -18% | 31 ? 42% | 44.8 ? 15% | 39.6 ? 25% |
| Response Time Black / White * (ms) | 31 ? | 25 ? 19% | 45.6 ? -47% | 24 ? 23% | 29.2 ? 6% | 28 ? 10% |
| PWM Frequency (Hz) | 131000 ? | 1008 ? | 1000 ? | 113600 ? | ||
| Screen | -46% | -8% | 8% | -37% | 15% | |
| Brightness middle (cd/m²) | 343 | 335 -2% | 428 25% | 289 -16% | 299 -13% | 320 -7% |
| Brightness (cd/m²) | 323 | 303 -6% | 405 25% | 310 -4% | 300 -7% | 315 -2% |
| Brightness Distribution (%) | 85 | 85 0% | 87 2% | 85 0% | 92 8% | 95 12% |
| Black Level * (cd/m²) | 0.33 | 0.46 -39% | 0.26 21% | 0.23 30% | 0.26 21% | 0.29 12% |
| Contrast (:1) | 1039 | 728 -30% | 1646 58% | 1257 21% | 1150 11% | 1103 6% |
| Colorchecker dE 2000 * | 2.38 | 5.09 -114% | 3.8 -60% | 1.64 31% | 5.6 -135% | 1.2 50% |
| Colorchecker dE 2000 max. * | 3.55 | 11.92 -236% | 7.2 -103% | 3.31 7% | 9.1 -156% | 3.2 10% |
| Greyscale dE 2000 * | 3.01 | 3.23 -7% | 4.4 -46% | 1.71 43% | 5.5 -83% | 0.8 73% |
| Gamma | 2.44 90% | 2.18 101% | 2.21 100% | 2.32 95% | 2.47 89% | 2.2 100% |
| CCT | 7198 90% | 6214 105% | 7067 92% | 6291 103% | 7533 86% | 6548 99% |
| Color Space (Percent of AdobeRGB 1998) (%) | 62 | 54 -13% | 62.8 1% | 52 -16% | 58.9 -5% | 62.1 0% |
| Color Space (Percent of sRGB) (%) | 98 | 82 -16% | 96.4 -2% | 82 -16% | 90.3 -8% | 96 -2% |
| Colorchecker dE 2000 calibrated * | 0.99 | 2.6 | 0.5 | |||
| Média Total (Programa/Configurações) | -10% /
-29% | -13% /
-9% | 8% /
6% | -10% /
-24% | 11% /
13% |
* ... menor é melhor
Exibir tempos de resposta
| ↔ Tempo de resposta preto para branco | ||
|---|---|---|
| 31 ms ... ascensão ↗ e queda ↘ combinadas | ↗ 16 ms ascensão | 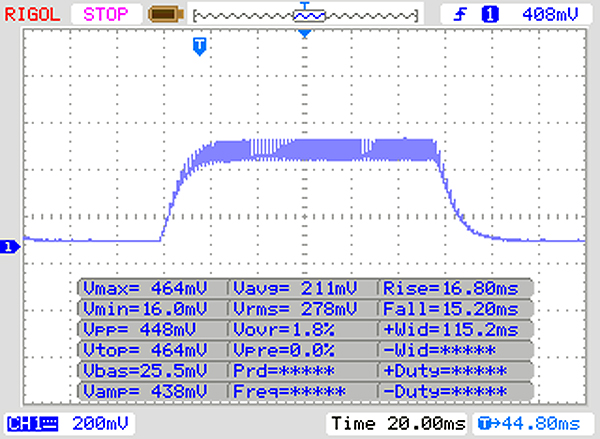 |
| ↘ 15 ms queda | ||
| A tela mostra taxas de resposta lentas em nossos testes e será insatisfatória para os jogadores. Em comparação, todos os dispositivos testados variam de 0.1 (mínimo) a 240 (máximo) ms. » 84 % de todos os dispositivos são melhores. Isso significa que o tempo de resposta medido é pior que a média de todos os dispositivos testados (19.8 ms). | ||
| ↔ Tempo de resposta 50% cinza a 80% cinza | ||
| 53 ms ... ascensão ↗ e queda ↘ combinadas | ↗ 27 ms ascensão | 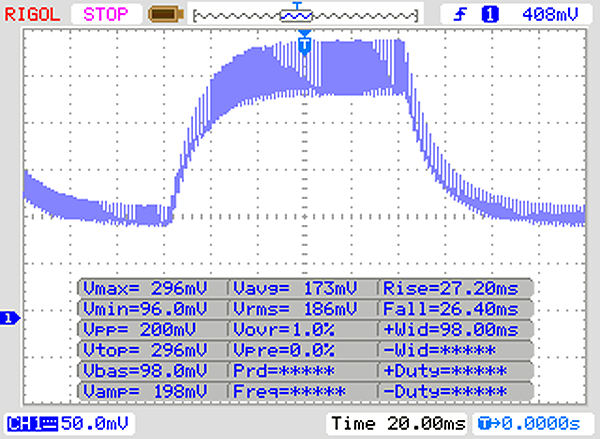 |
| ↘ 26 ms queda | ||
| A tela mostra taxas de resposta lentas em nossos testes e será insatisfatória para os jogadores. Em comparação, todos os dispositivos testados variam de 0.165 (mínimo) a 636 (máximo) ms. » 90 % de todos os dispositivos são melhores. Isso significa que o tempo de resposta medido é pior que a média de todos os dispositivos testados (31 ms). | ||
Cintilação da tela / PWM (modulação por largura de pulso)
| Tela tremeluzindo / PWM não detectado | 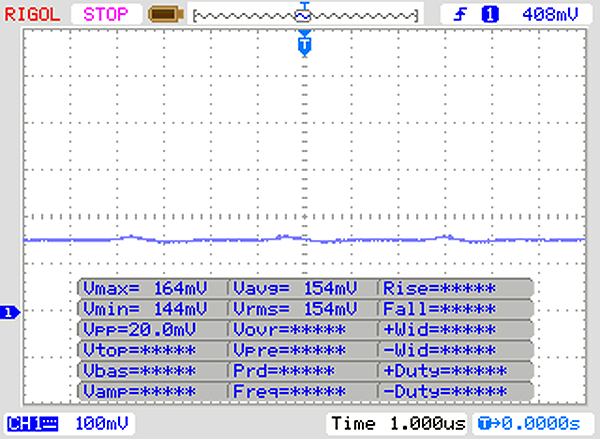 | ||
[pwm_comparison] Em comparação: 52 % de todos os dispositivos testados não usam PWM para escurecer a tela. Se PWM foi detectado, uma média de 7754 (mínimo: 5 - máximo: 343500) Hz foi medida. | |||
| PCMark 8 Home Score Accelerated v2 | 3096 pontos | |
| PCMark 8 Work Score Accelerated v2 | 4733 pontos | |
| PCMark 10 Score | 4022 pontos | |
Ajuda | ||
| Lenovo Yoga S730-13IWL Samsung SSD PM981 MZVLB1T0HALR | Dell XPS 13 9370 FHD i5 Toshiba XG5 KXG50ZNV256G | HP Envy 13-ah0003ng SK Hynix BC501 HFM512GDJTNG | Asus ZenBook S UX391U Samsung PM961 NVMe MZVLW512HMJP | Lenovo Ideapad 720S-13IKB Samsung PM961 MZVLW256HEHP | Média Samsung SSD PM981 MZVLB1T0HALR | |
|---|---|---|---|---|---|---|
| CrystalDiskMark 5.2 / 6 | -0% | -30% | -12% | -5% | 16% | |
| Write 4K (MB/s) | 139.6 | 128.2 -8% | 112.9 -19% | 98.9 -29% | 115 -18% | 165.7 ? 19% |
| Read 4K (MB/s) | 36.97 | 48.09 30% | 38.69 5% | 38.33 4% | 41.36 12% | 44.6 ? 21% |
| Write Seq (MB/s) | 1490 | 1088 -27% | 654 -56% | 1414 -5% | 1208 -19% | 1982 ? 33% |
| Read Seq (MB/s) | 1321 | 1877 42% | 642 -51% | 1051 -20% | 1448 10% | 1764 ? 34% |
| Write 4K Q32T1 (MB/s) | 302.4 | 367.1 21% | 305.9 1% | 370.7 23% | 395 31% | 395 ? 31% |
| Read 4K Q32T1 (MB/s) | 375.4 | 411.9 10% | 351.6 -6% | 251.4 -33% | 373.9 0% | 434 ? 16% |
| Write Seq Q32T1 (MB/s) | 2391 | 1078 -55% | 869 -64% | 1606 -33% | 1217 -49% | 2351 ? -2% |
| Read Seq Q32T1 (MB/s) | 3272 | 2771 -15% | 1683 -49% | 3218 -2% | 3167 -3% | 3234 ? -1% |
| Write 4K Q8T8 (MB/s) | 1254 | 1408 ? 12% | ||||
| Read 4K Q8T8 (MB/s) | 1525 | 1449 ? -5% |

| 3DMark 11 Performance | 2025 pontos | |
| 3DMark Cloud Gate Standard Score | 6769 pontos | |
| 3DMark Fire Strike Score | 1073 pontos | |
| 3DMark Time Spy Score | 444 pontos | |
Ajuda | ||
| baixo | média | alto | ultra | |
|---|---|---|---|---|
| BioShock Infinite (2013) | 81.7 | 41 | 34.1 | 10.38 |
| Rise of the Tomb Raider (2016) | 19 | |||
| Civilization 6 (2016) | 39.9 | 17.2 |
Barulho
| Ocioso |
| 30.6 / 30.6 / 30.6 dB |
| Carga |
| 37.5 / 34.5 dB |
 | ||
30 dB silencioso 40 dB(A) audível 50 dB(A) ruidosamente alto |
||
min: | ||
(-) A temperatura máxima no lado superior é 46.1 °C / 115 F, em comparação com a média de 34.3 °C / 94 F , variando de 21.2 a 62.5 °C para a classe Office.
(±) A parte inferior aquece até um máximo de 43.9 °C / 111 F, em comparação com a média de 36.8 °C / 98 F
(+) Em uso inativo, a temperatura média para o lado superior é 26.4 °C / 80 F, em comparação com a média do dispositivo de 29.5 °C / ### class_avg_f### F.
(+) Os apoios para as mãos e o touchpad são mais frios que a temperatura da pele, com um máximo de 30 °C / 86 F e, portanto, são frios ao toque.
(-) A temperatura média da área do apoio para as mãos de dispositivos semelhantes foi 27.5 °C / 81.5 F (-2.5 °C / -4.5 F).
Lenovo Yoga S730-13IWL análise de áudio
(-) | alto-falantes não muito altos (###valor### dB)
Graves 100 - 315Hz
(±) | graves reduzidos - em média 10.4% menor que a mediana
(-) | graves não são lineares (15.9% delta para frequência anterior)
Médios 400 - 2.000 Hz
(±) | médios mais altos - em média 6.3% maior que a mediana
(+) | médios são lineares (4.7% delta para frequência anterior)
Altos 2 - 16 kHz
(+) | agudos equilibrados - apenas 3.1% longe da mediana
(+) | os máximos são lineares (4.9% delta da frequência anterior)
Geral 100 - 16.000 Hz
(±) | a linearidade do som geral é média (17.7% diferença em relação à mediana)
Comparado com a mesma classe
» 29% de todos os dispositivos testados nesta classe foram melhores, 6% semelhantes, 65% piores
» O melhor teve um delta de 7%, a média foi 21%, o pior foi 53%
Comparado com todos os dispositivos testados
» 35% de todos os dispositivos testados foram melhores, 8% semelhantes, 57% piores
» O melhor teve um delta de 4%, a média foi 23%, o pior foi 134%
Apple MacBook Air 2018 análise de áudio
(±) | o volume do alto-falante é médio, mas bom (###valor### dB)
Graves 100 - 315Hz
(±) | graves reduzidos - em média 8.1% menor que a mediana
(±) | a linearidade dos graves é média (10% delta para a frequência anterior)
Médios 400 - 2.000 Hz
(+) | médios equilibrados - apenas 2.9% longe da mediana
(+) | médios são lineares (5.6% delta para frequência anterior)
Altos 2 - 16 kHz
(+) | agudos equilibrados - apenas 2.2% longe da mediana
(+) | os máximos são lineares (4.5% delta da frequência anterior)
Geral 100 - 16.000 Hz
(+) | o som geral é linear (12.3% diferença em relação à mediana)
Comparado com a mesma classe
» 16% de todos os dispositivos testados nesta classe foram melhores, 5% semelhantes, 79% piores
» O melhor teve um delta de 5%, a média foi 18%, o pior foi 53%
Comparado com todos os dispositivos testados
» 10% de todos os dispositivos testados foram melhores, 3% semelhantes, 87% piores
» O melhor teve um delta de 4%, a média foi 23%, o pior foi 134%
Lenovo Yoga C930-13IKB análise de áudio
(±) | o volume do alto-falante é médio, mas bom (###valor### dB)
Graves 100 - 315Hz
(+) | bons graves - apenas 4.8% longe da mediana
(±) | a linearidade dos graves é média (8.8% delta para a frequência anterior)
Médios 400 - 2.000 Hz
(+) | médios equilibrados - apenas 3% longe da mediana
(+) | médios são lineares (4.6% delta para frequência anterior)
Altos 2 - 16 kHz
(±) | máximos reduzidos - em média 5.1% menor que a mediana
(+) | os máximos são lineares (5.4% delta da frequência anterior)
Geral 100 - 16.000 Hz
(+) | o som geral é linear (14.1% diferença em relação à mediana)
Comparado com a mesma classe
» 20% de todos os dispositivos testados nesta classe foram melhores, 4% semelhantes, 76% piores
» O melhor teve um delta de 6%, a média foi 20%, o pior foi 57%
Comparado com todos os dispositivos testados
» 17% de todos os dispositivos testados foram melhores, 4% semelhantes, 79% piores
» O melhor teve um delta de 4%, a média foi 23%, o pior foi 134%
| desligado | |
| Ocioso | |
| Carga |
|
Key:
min: | |
| Lenovo Yoga S730-13IWL i7-8565U, UHD Graphics 620, Samsung SSD PM981 MZVLB1T0HALR, IPS LED, 1920x1080, 13.3" | Dell XPS 13 9370 FHD i5 i5-8250U, UHD Graphics 620, Toshiba XG5 KXG50ZNV256G, IPS, 1920x1080, 13.3" | HP Envy 13-ah0003ng i5-8550U, GeForce MX150, SK Hynix BC501 HFM512GDJTNG, IPS, 1920x1080, 13.3" | Asus ZenBook S UX391U i5-8550U, UHD Graphics 620, Samsung PM961 NVMe MZVLW512HMJP, IPS, 1920x1080, 13.3" | Apple MacBook Air 2018 i5-8210Y, UHD Graphics 617, Apple SSD AP0256, IPS, 2560x1600, 13.3" | Lenovo Ideapad 720S-13IKB i5-8250U, UHD Graphics 620, Samsung PM961 MZVLW256HEHP, IPS, 1920x1080, 13.3" | Média Intel UHD Graphics 620 | Média da turma Office | |
|---|---|---|---|---|---|---|---|---|
| Power Consumption | 10% | -16% | -0% | 21% | -3% | -3% | -18% | |
| Idle Minimum * (Watt) | 3 | 3.14 -5% | 5.3 -77% | 3.24 -8% | 2.2 27% | 3.9 -30% | 3.81 ? -27% | 4.26 ? -42% |
| Idle Average * (Watt) | 5.6 | 5.22 7% | 7.3 -30% | 6.1 -9% | 5.7 -2% | 7.7 -38% | 6.94 ? -24% | 7.31 ? -31% |
| Idle Maximum * (Watt) | 11 | 6 45% | 9.3 15% | 9.2 16% | 10.3 6% | 10.4 5% | 8.75 ? 20% | 8.55 ? 22% |
| Load Average * (Watt) | 38 | 38.5 -1% | 39 -3% | 38.8 -2% | 25.6 33% | 33.3 12% | 35 ? 8% | 43.8 ? -15% |
| Load Maximum * (Watt) | 53 | 50.4 5% | 46 13% | 52.6 1% | 30.6 42% | 34 36% | 47.5 ? 10% | 64.5 ? -22% |
* ... menor é melhor
| Lenovo Yoga S730-13IWL i7-8565U, UHD Graphics 620, 42 Wh | Dell XPS 13 9370 FHD i5 i5-8250U, UHD Graphics 620, 52 Wh | HP Envy 13-ah0003ng i5-8550U, GeForce MX150, 53.2 Wh | Asus ZenBook S UX391U i5-8550U, UHD Graphics 620, 50 Wh | Apple MacBook Air 2018 i5-8210Y, UHD Graphics 617, 50.3 Wh | Lenovo Ideapad 720S-13IKB i5-8250U, UHD Graphics 620, 46 Wh | Média da turma Office | |
|---|---|---|---|---|---|---|---|
| Duração da bateria | 44% | -1% | 22% | 43% | 14% | 56% | |
| Reader / Idle (h) | 15.9 | 23.6 48% | 15.5 -3% | 22.3 40% | 17.3 9% | 24.5 ? 54% | |
| H.264 (h) | 8.9 | 13.9 56% | 6.3 -29% | 10.4 17% | 12.3 38% | 15.5 ? 74% | |
| WiFi v1.3 (h) | 6.9 | 10.7 55% | 8 16% | 8.2 19% | 11.1 61% | 10.1 46% | 13.2 ? 91% |
| Load (h) | 1.7 | 2 18% | 1.9 12% | 1.9 12% | 2.2 29% | 1.5 -12% | 1.808 ? 6% |
Pro
Contra

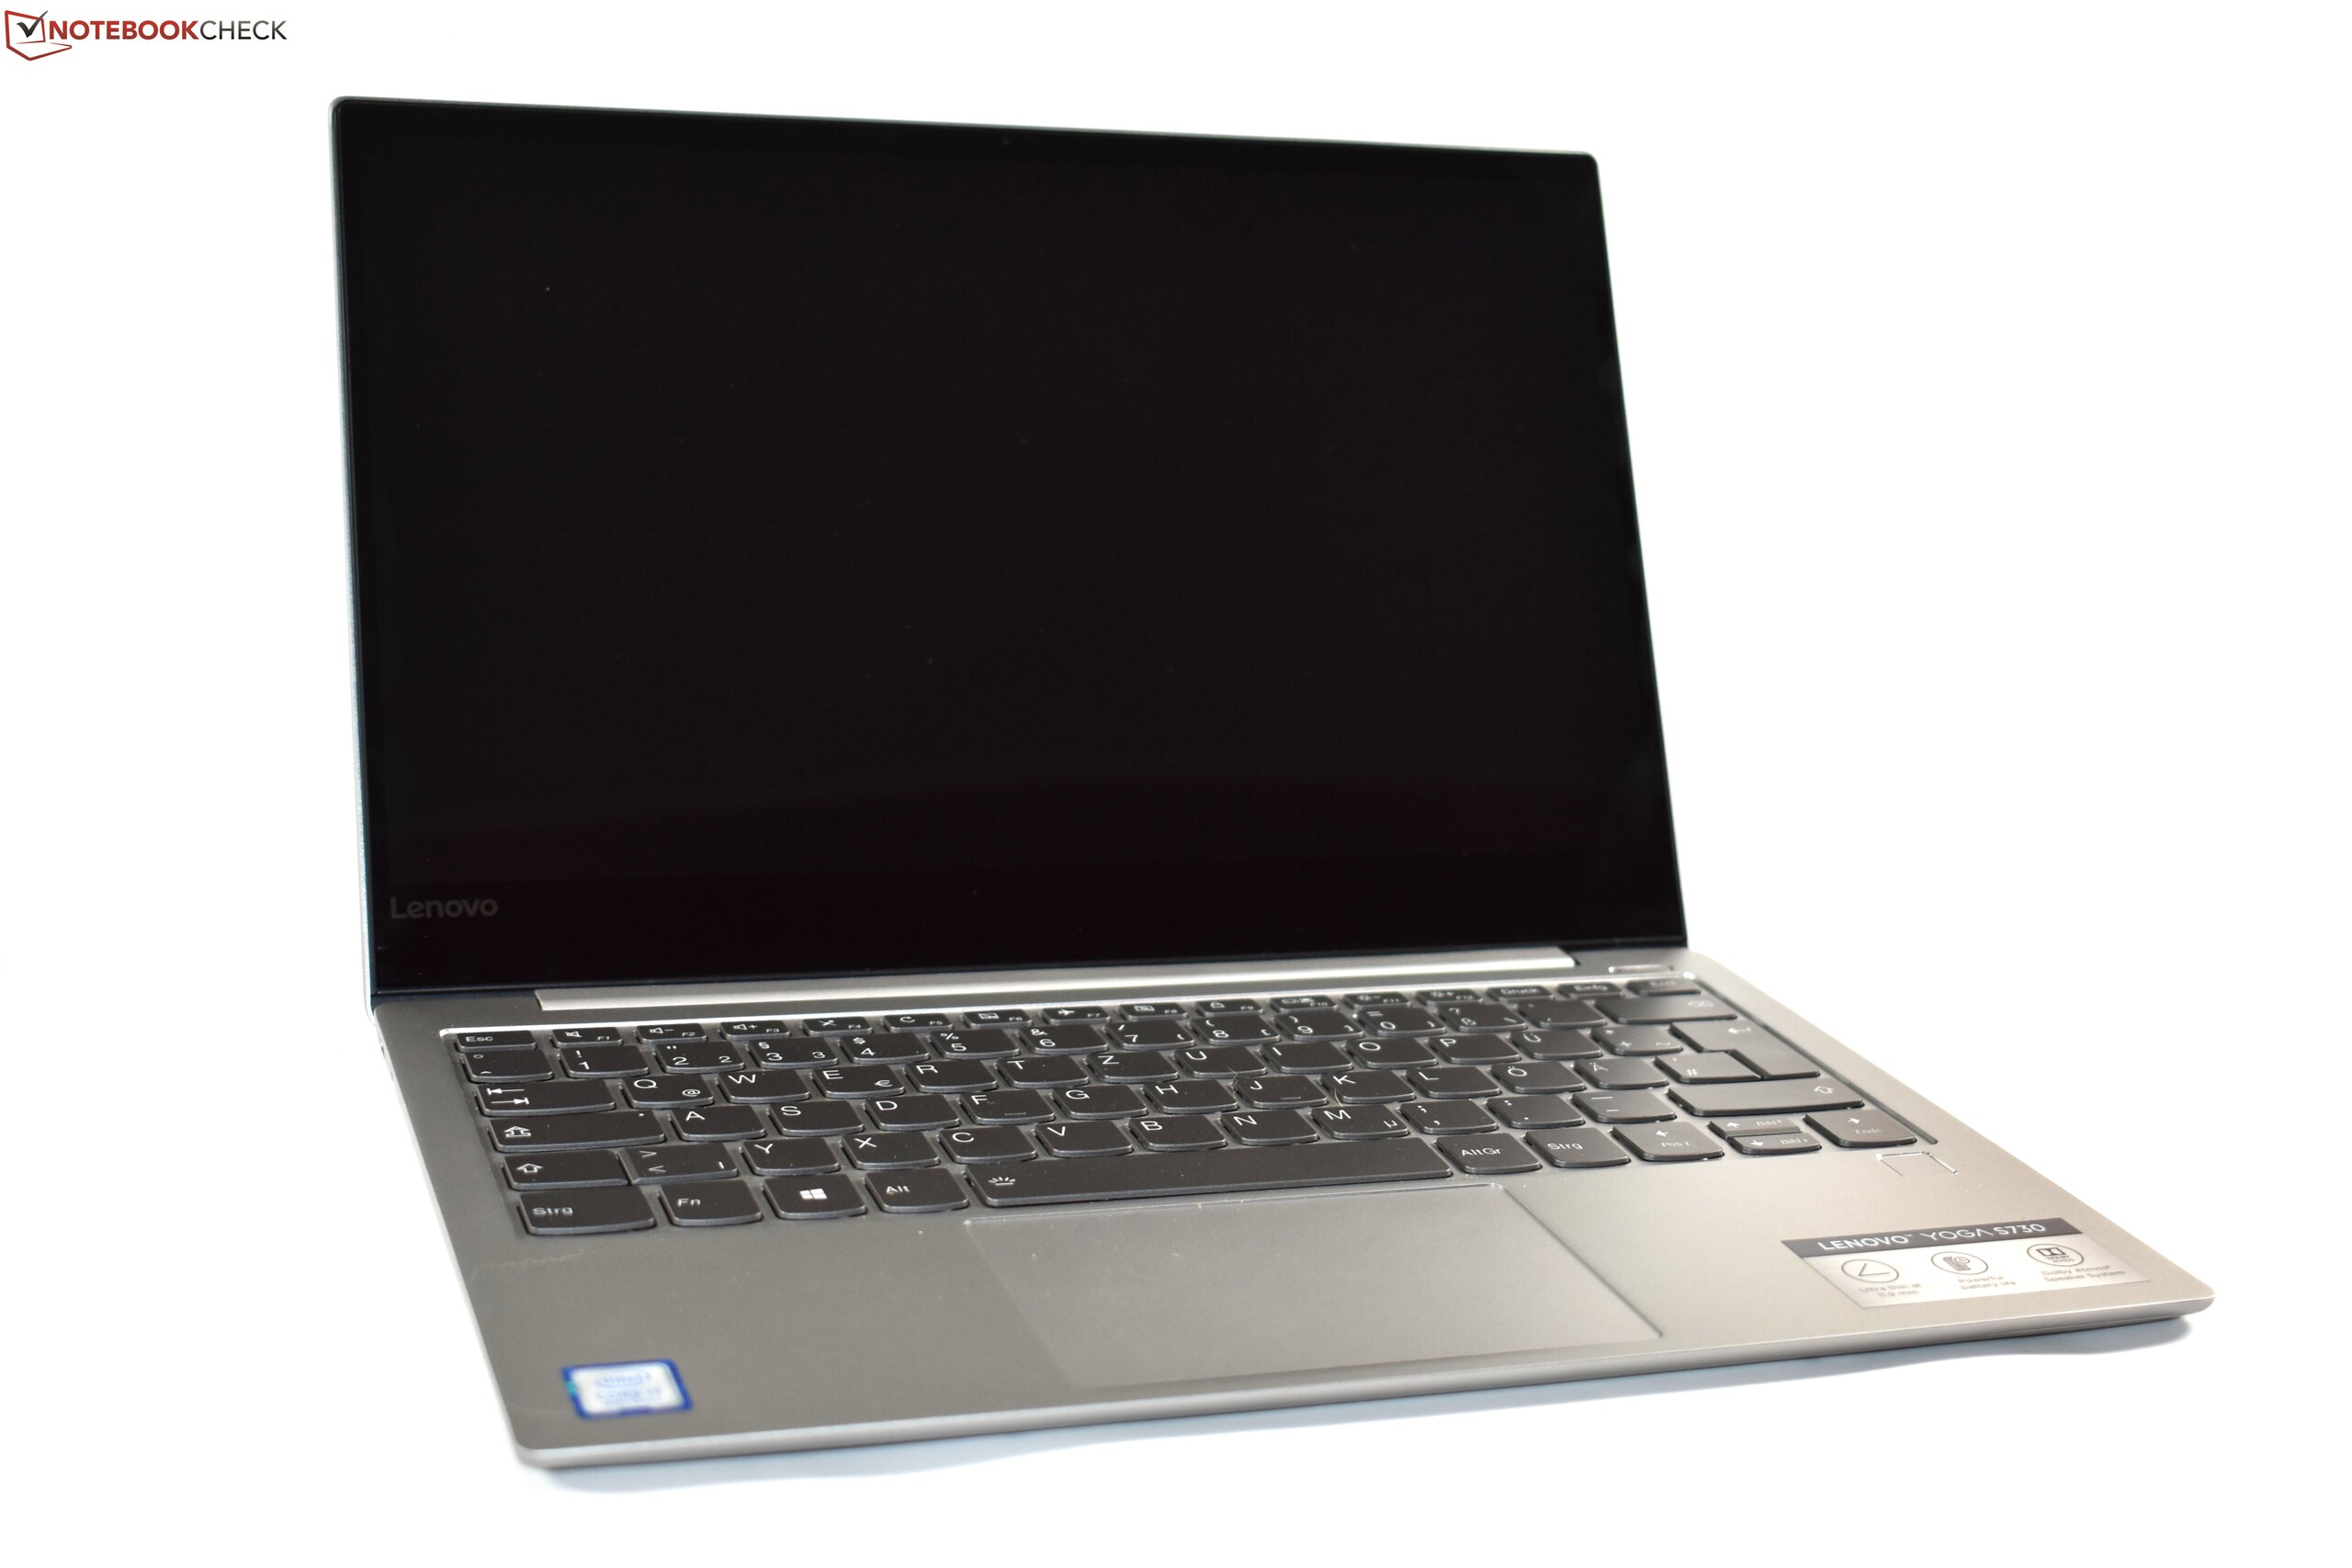
A Lenovo deixou para trás as formas populares de sua série Yoga com o lançamento do Yoga S730-13IWL; pelo menos na Europa e na Ásia, dado que a empresa vende o dispositivo como o IdeaPad 730s-13IWL no Canadá e nos EUA. A Lenovo tentou reduzir o desempenho do Dell XPS 13 com o IdeaPad 710s-13ISK e o IdeaPad 720s-13IKB, mas o conceito está se esgotando com o S730-13IWL.
A Lenovo fez muitos compromissos com o Yoga S730-13IWL, o que faz com que fique aquém dos melhores ultrabooks compactos que a Lenovo está desesperadamente tentando superar.
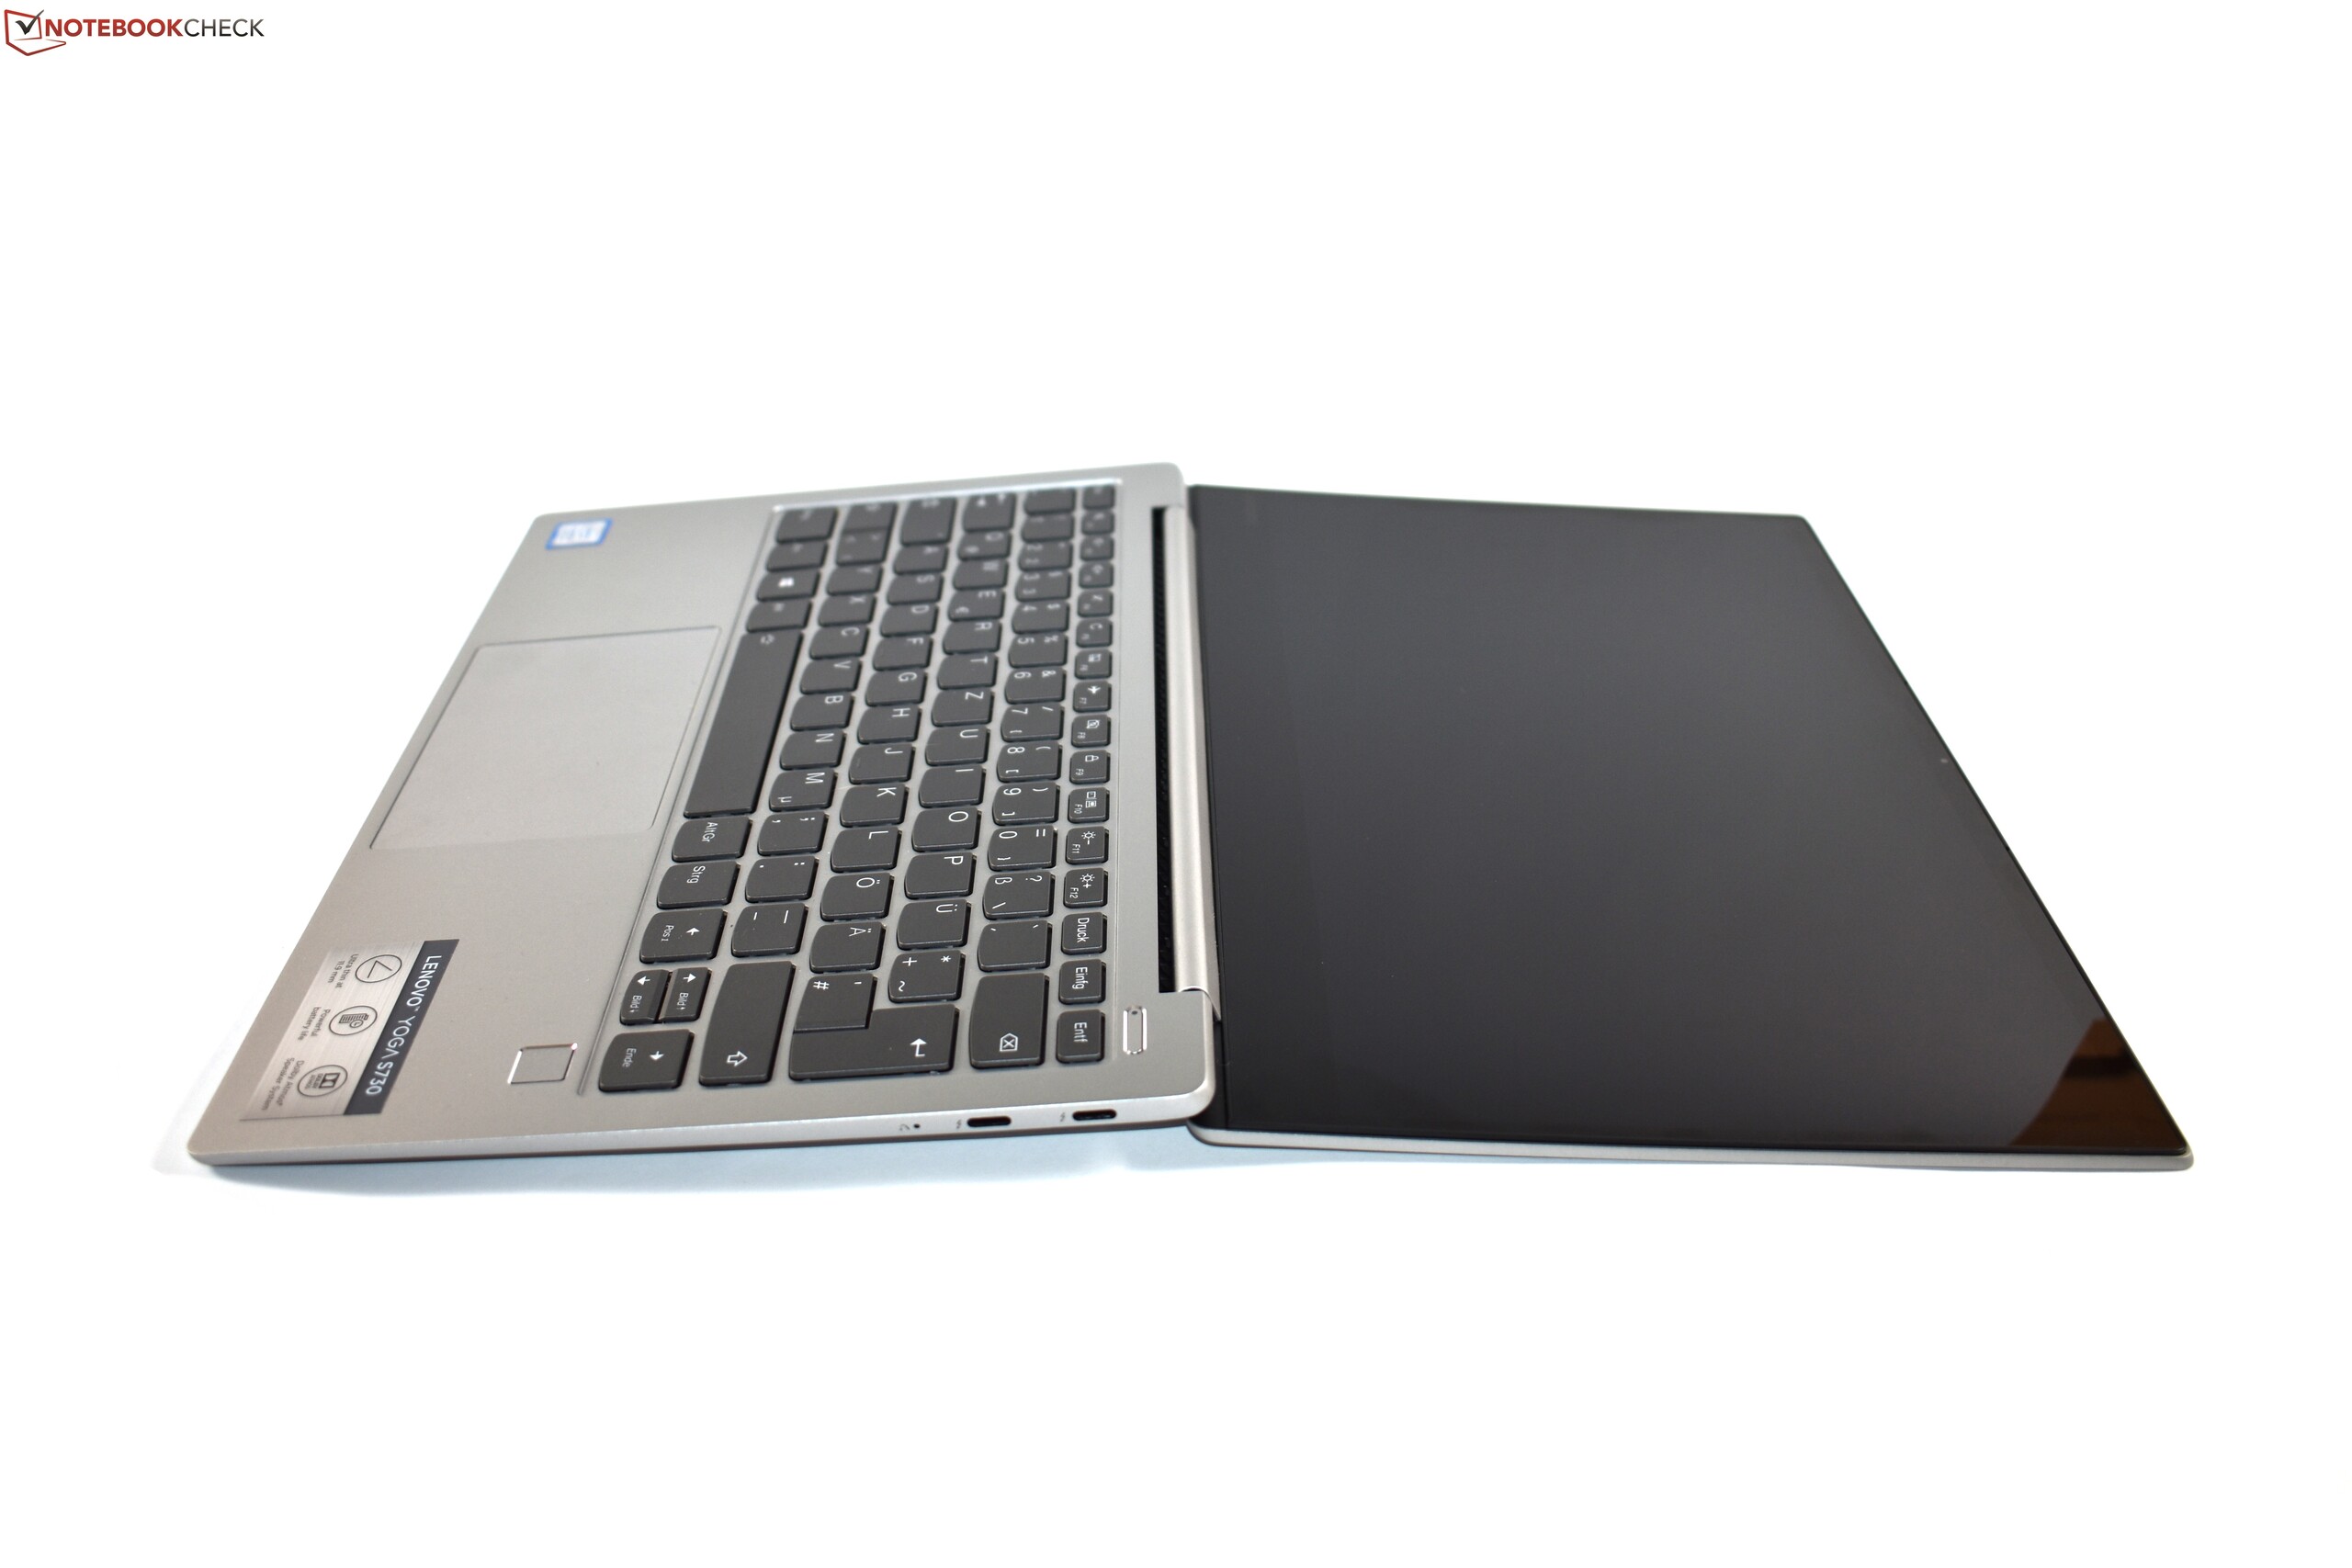
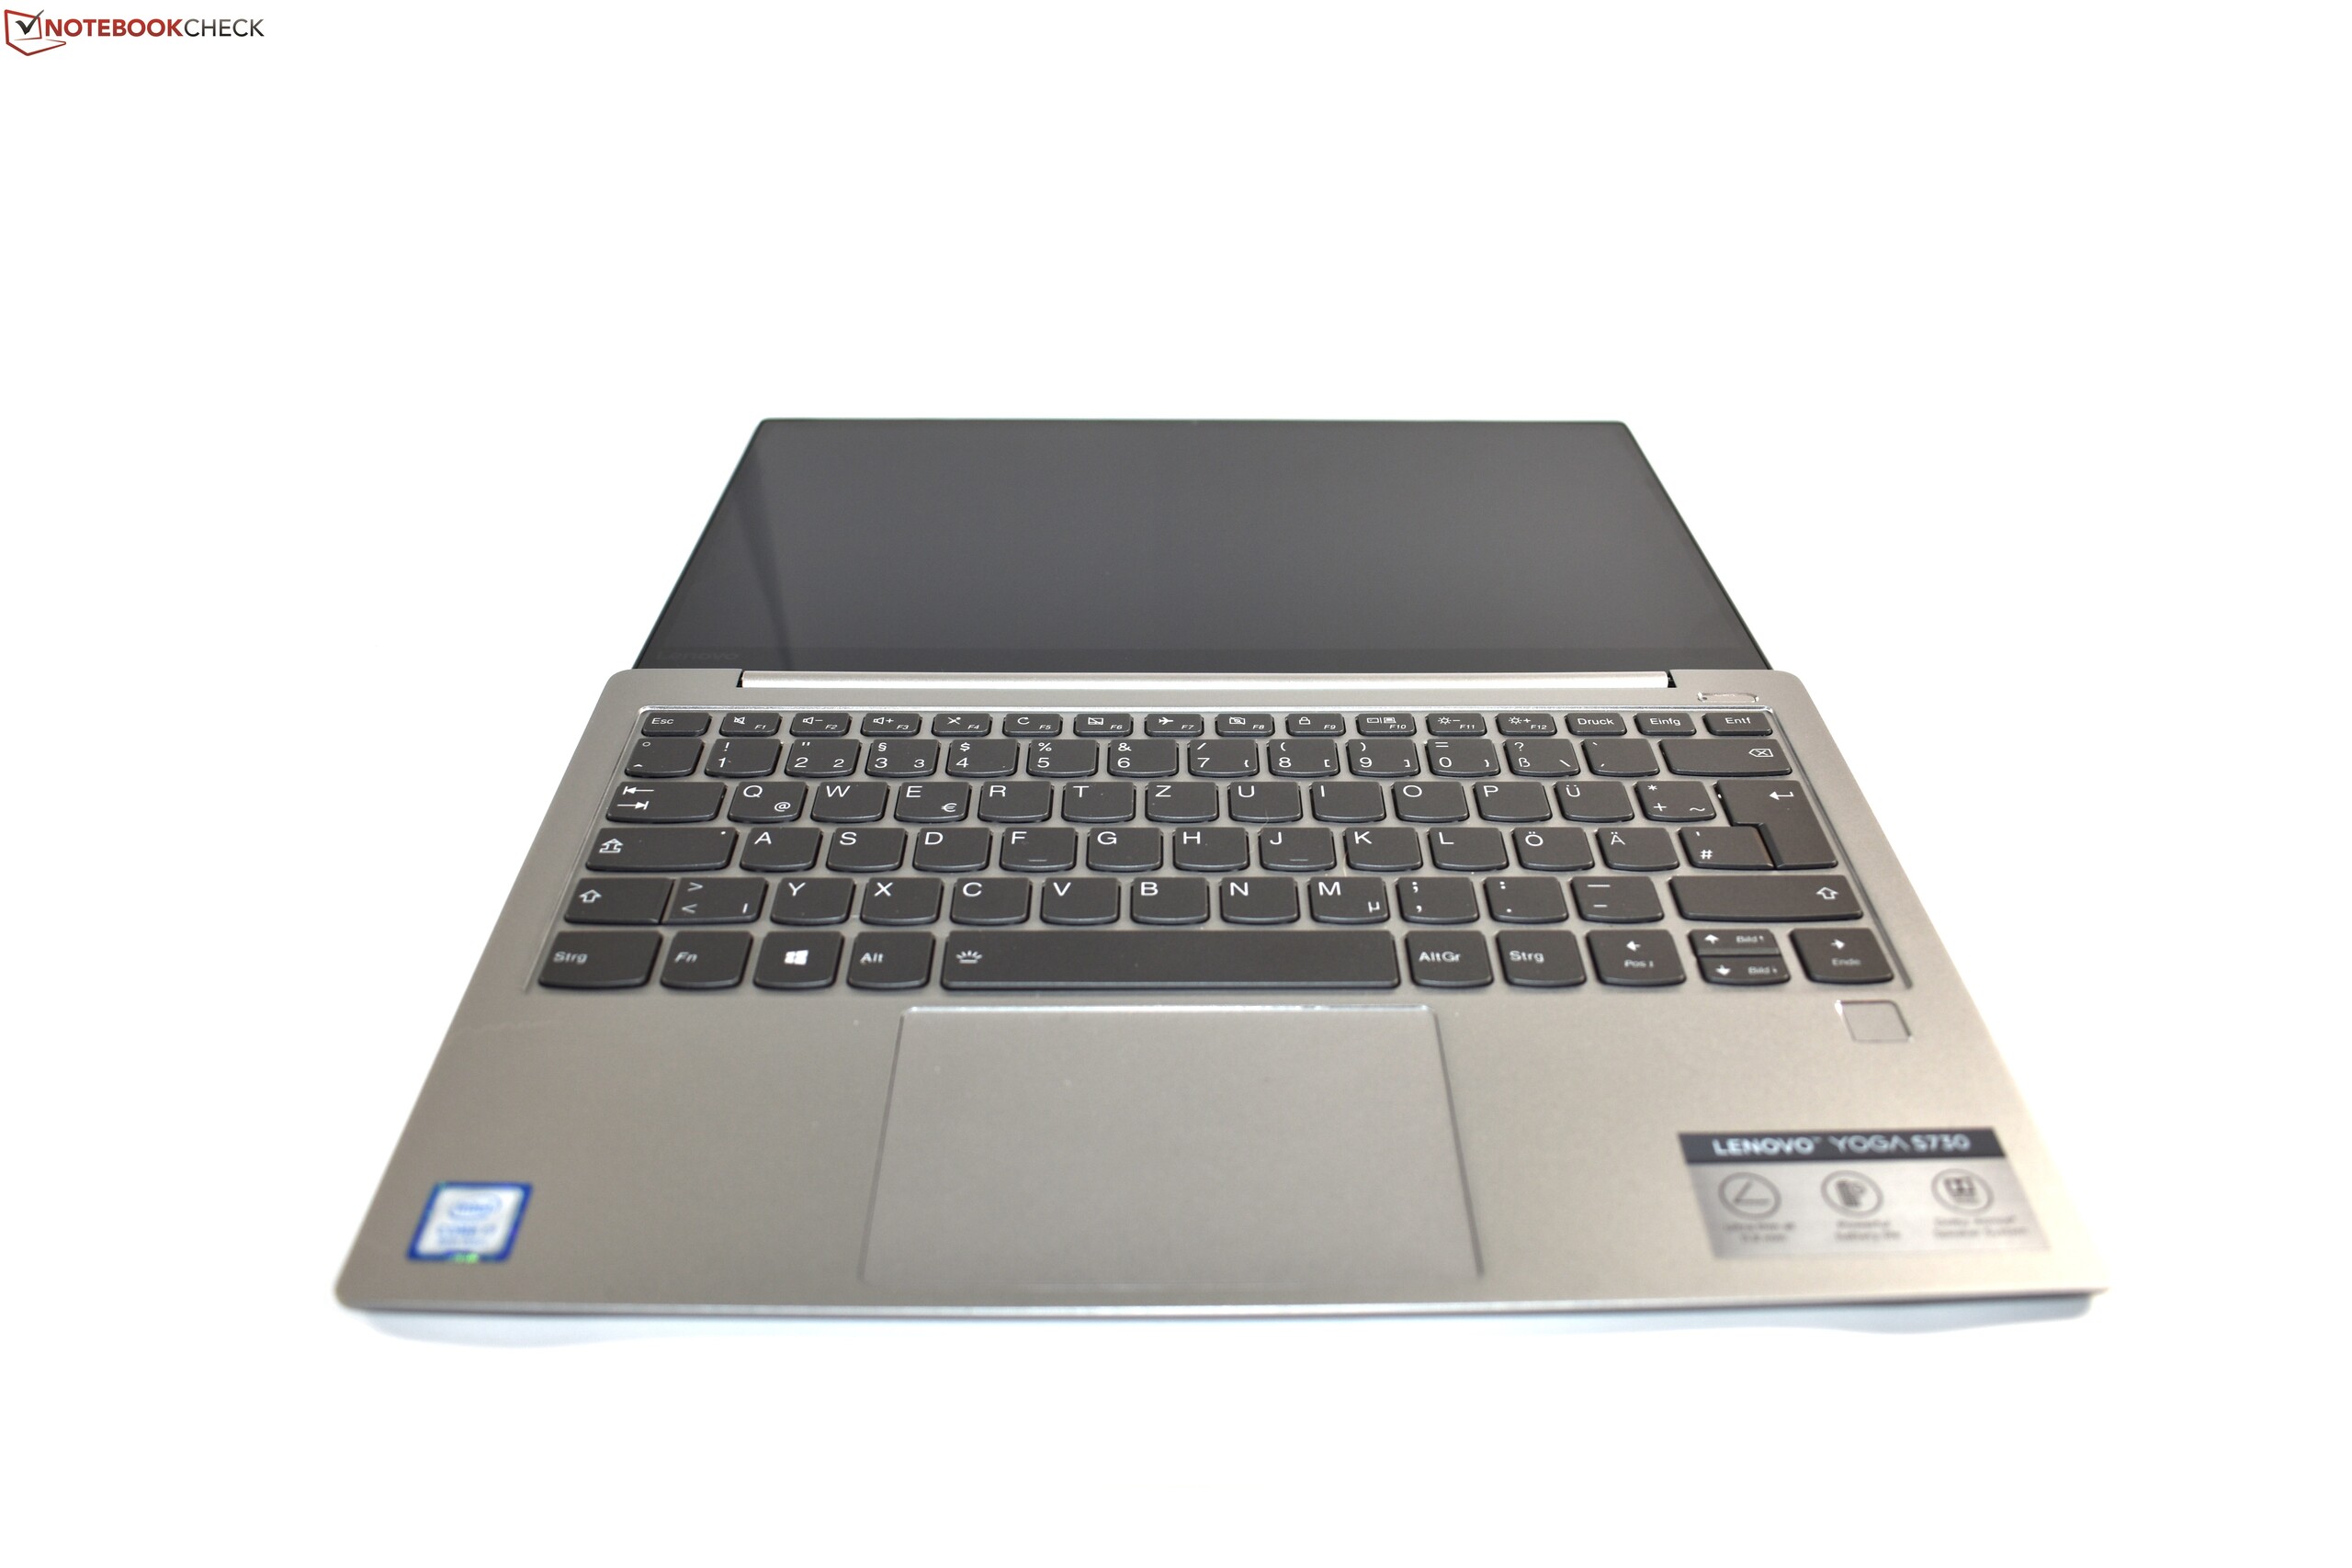
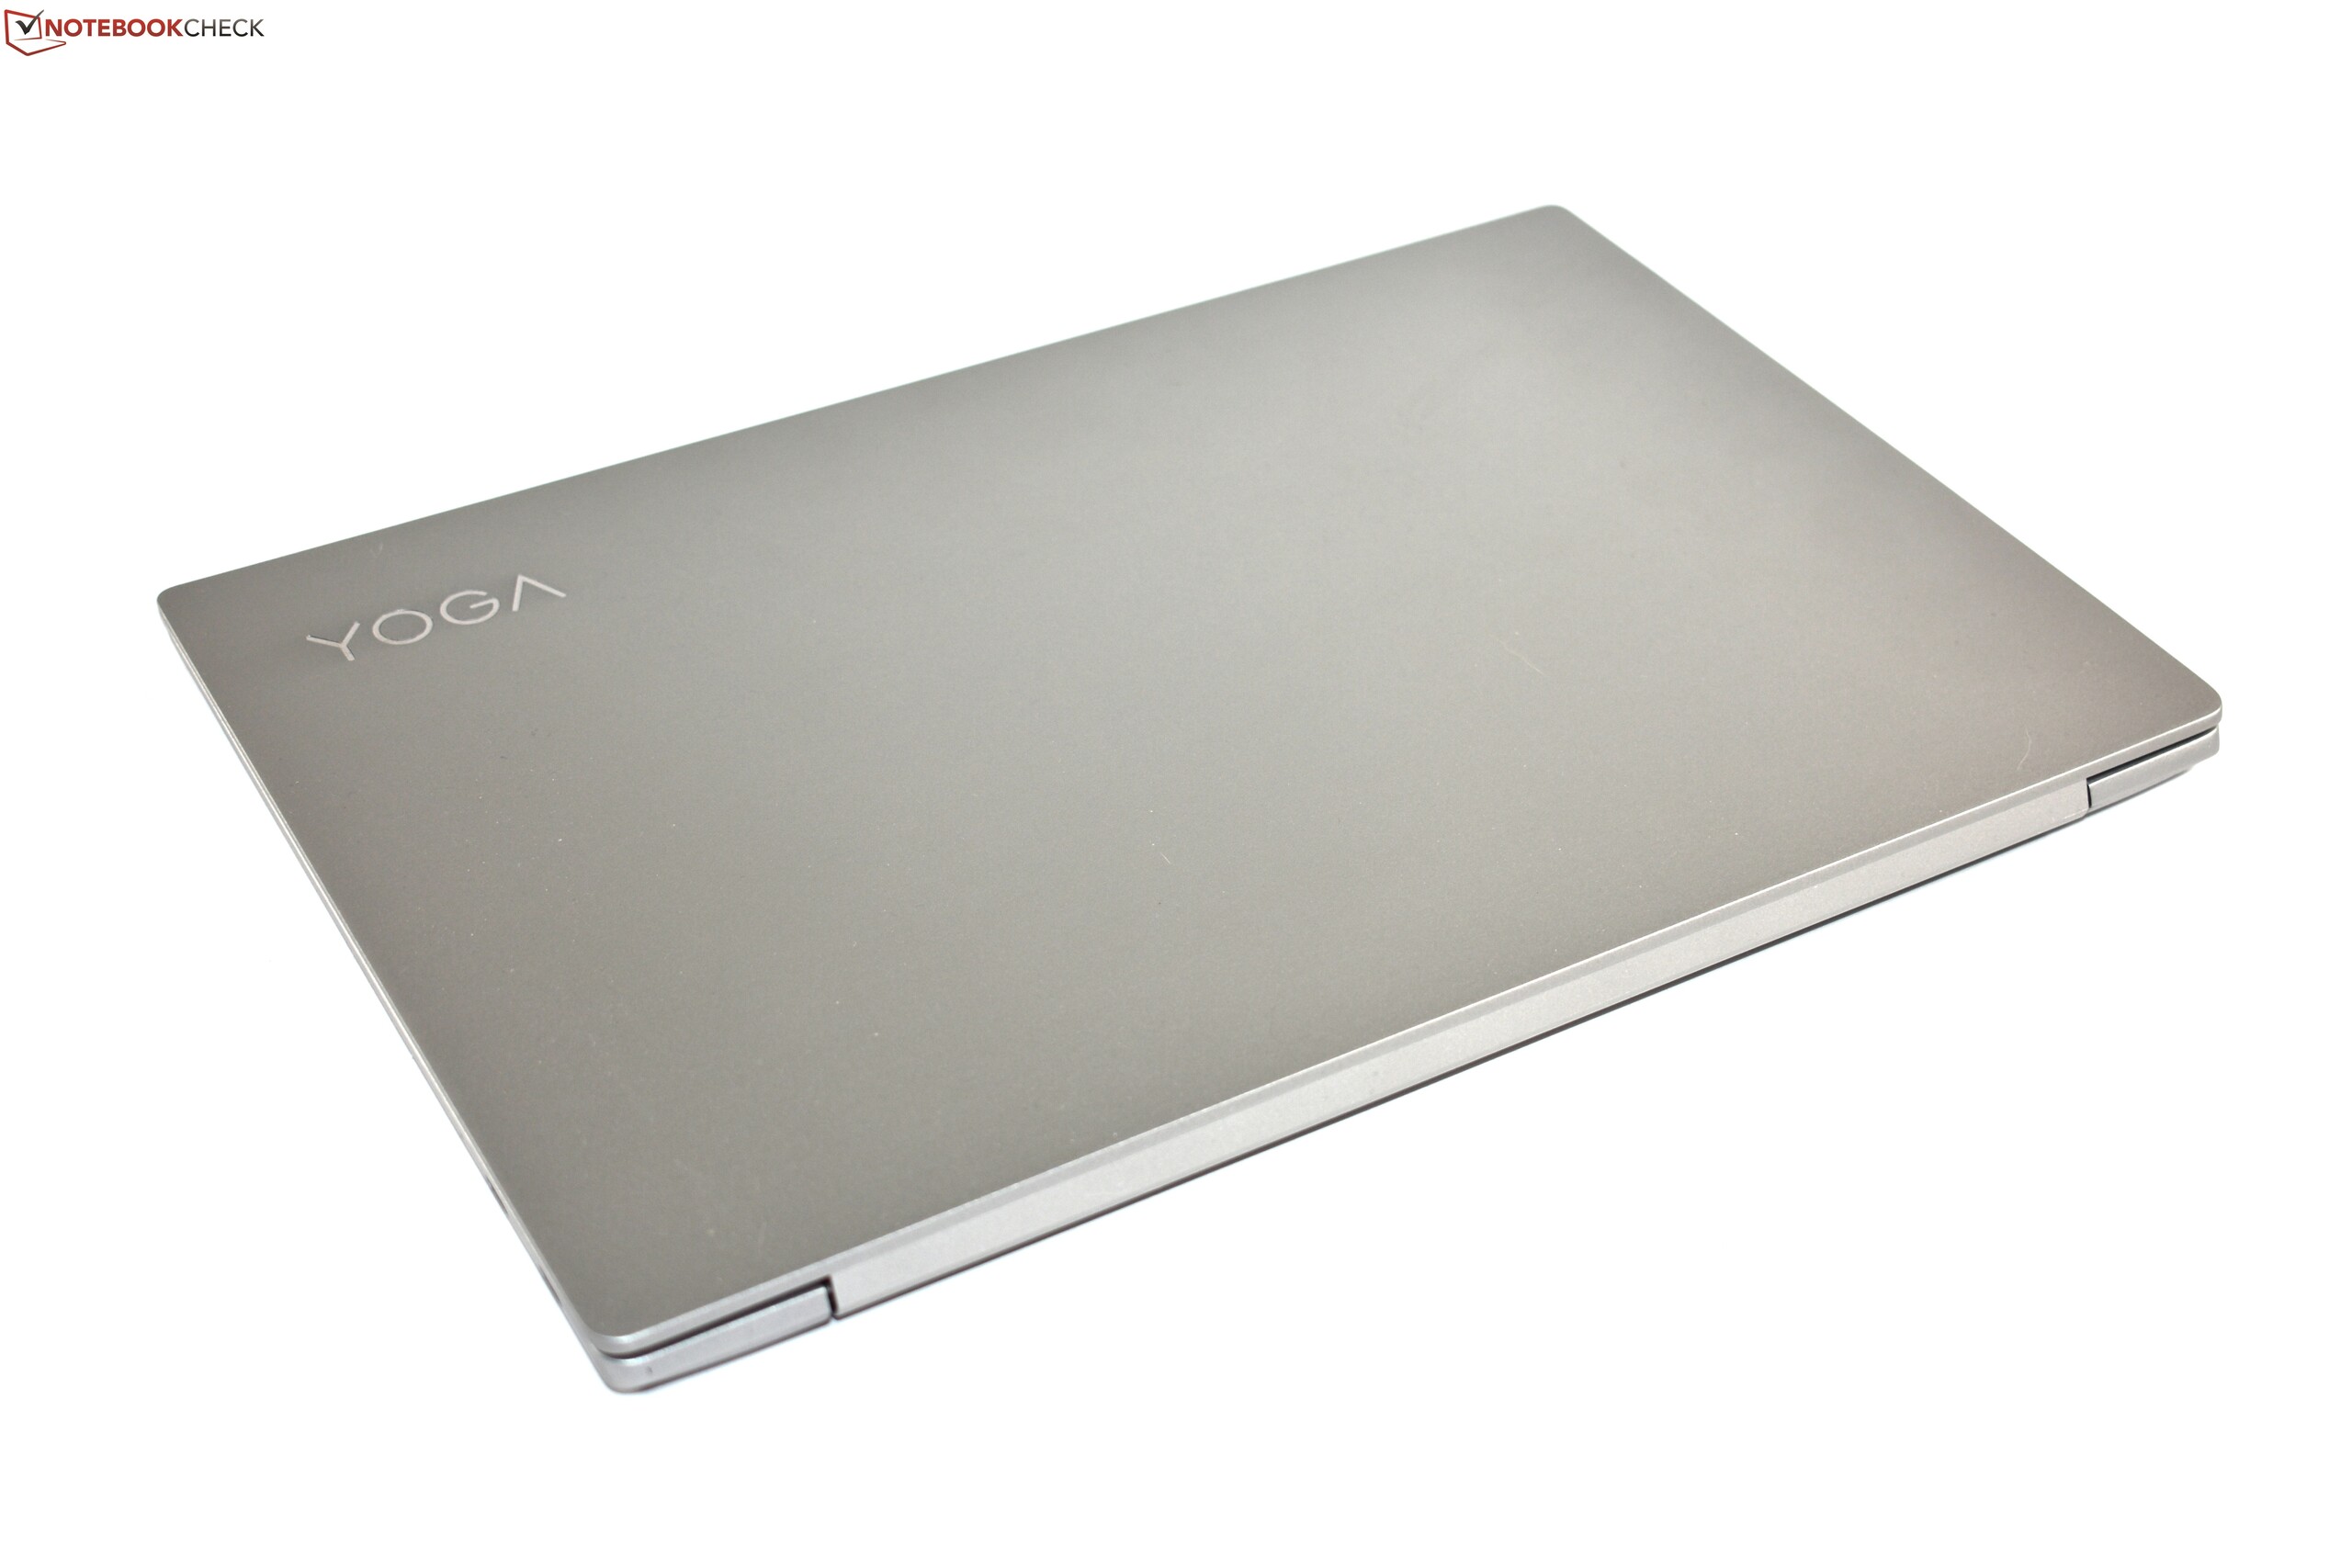
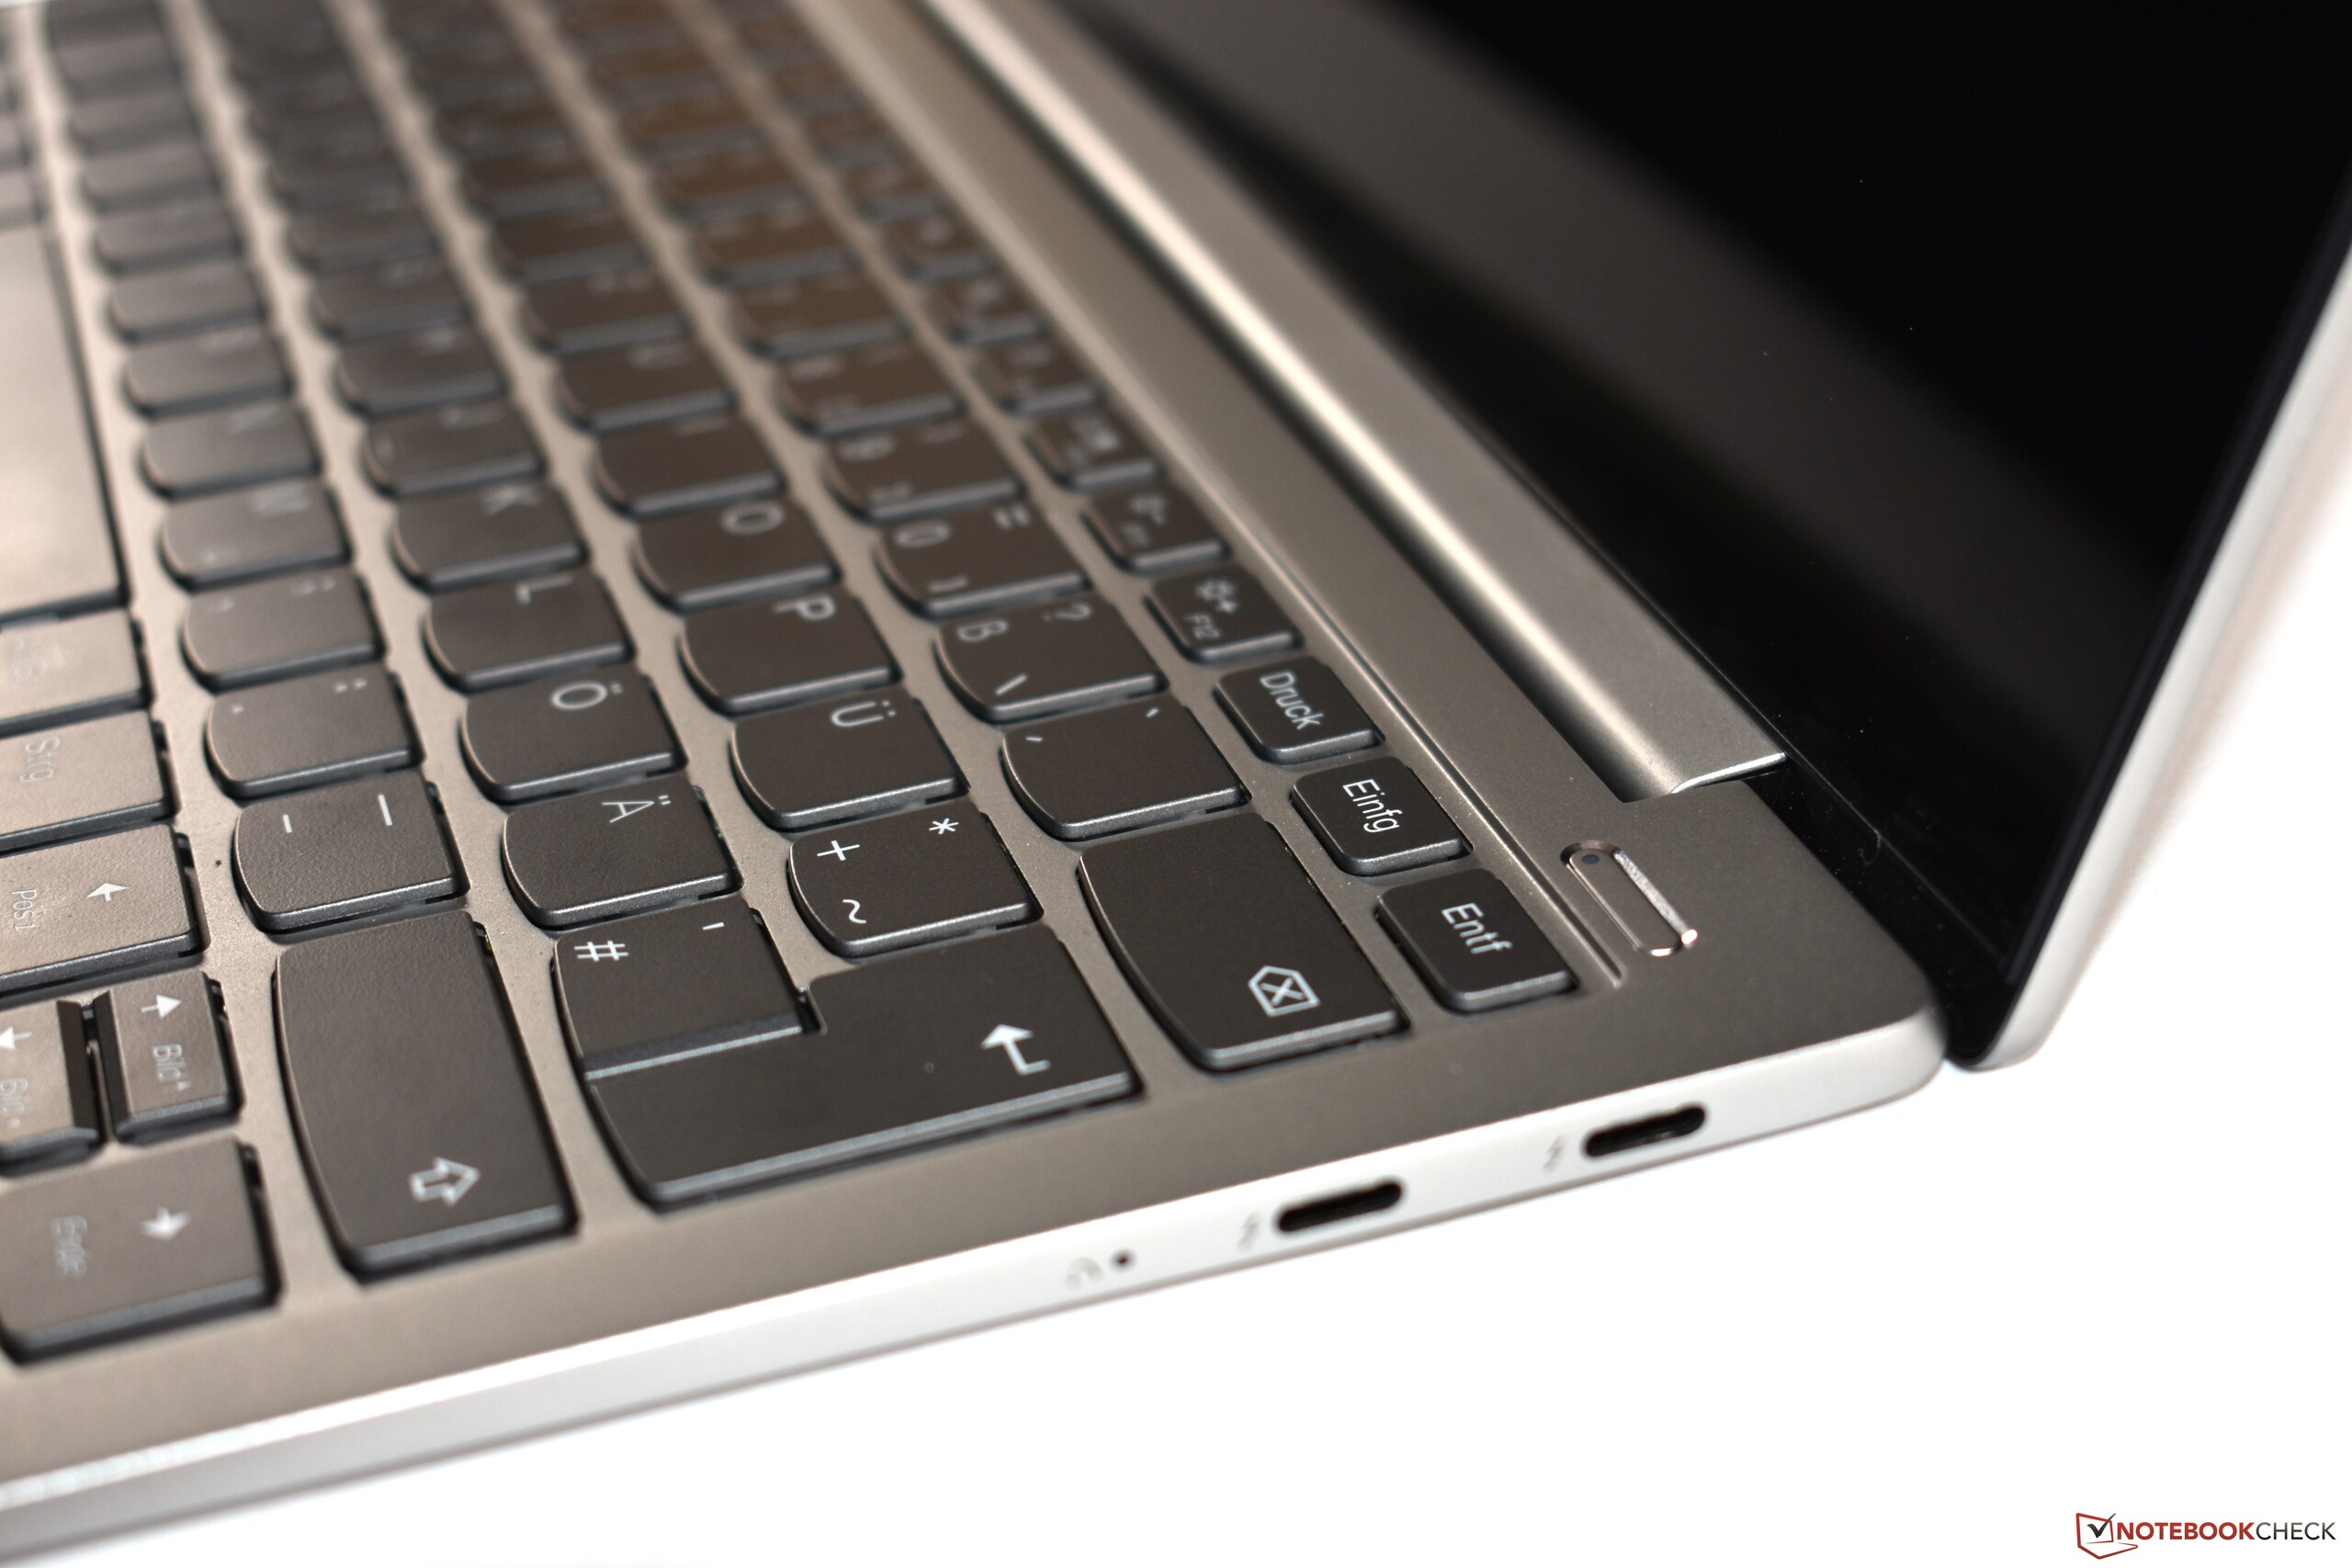
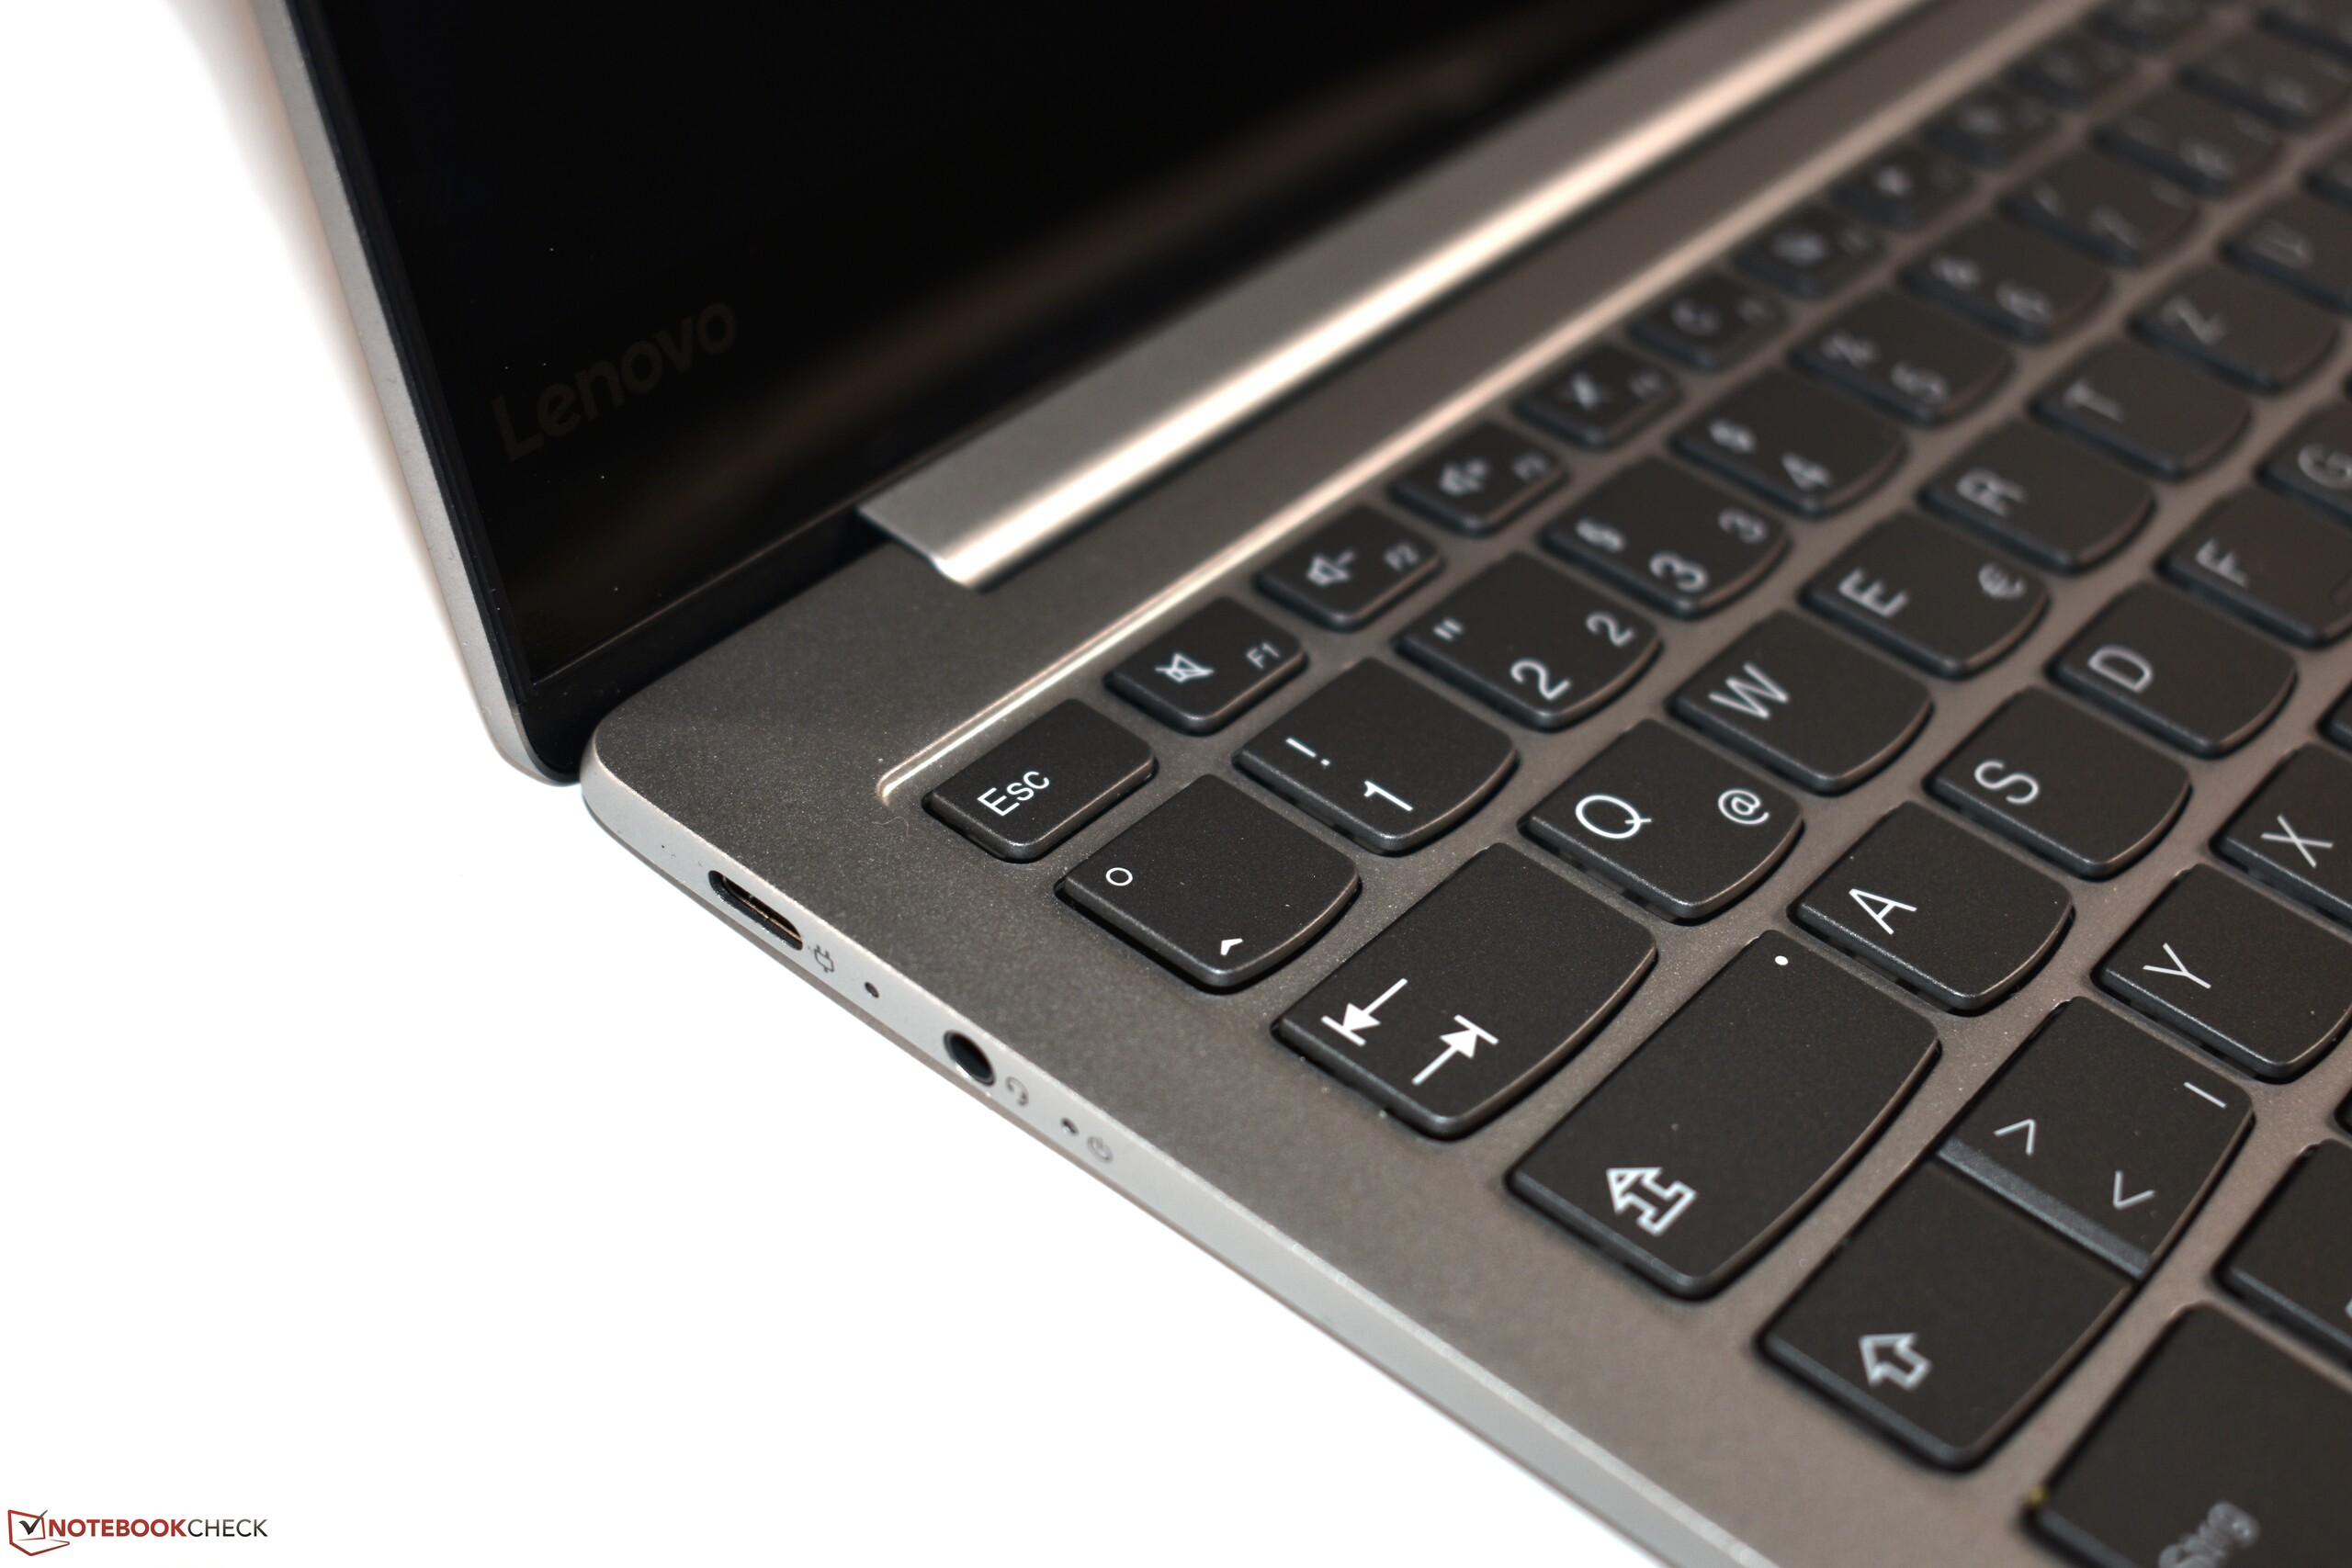
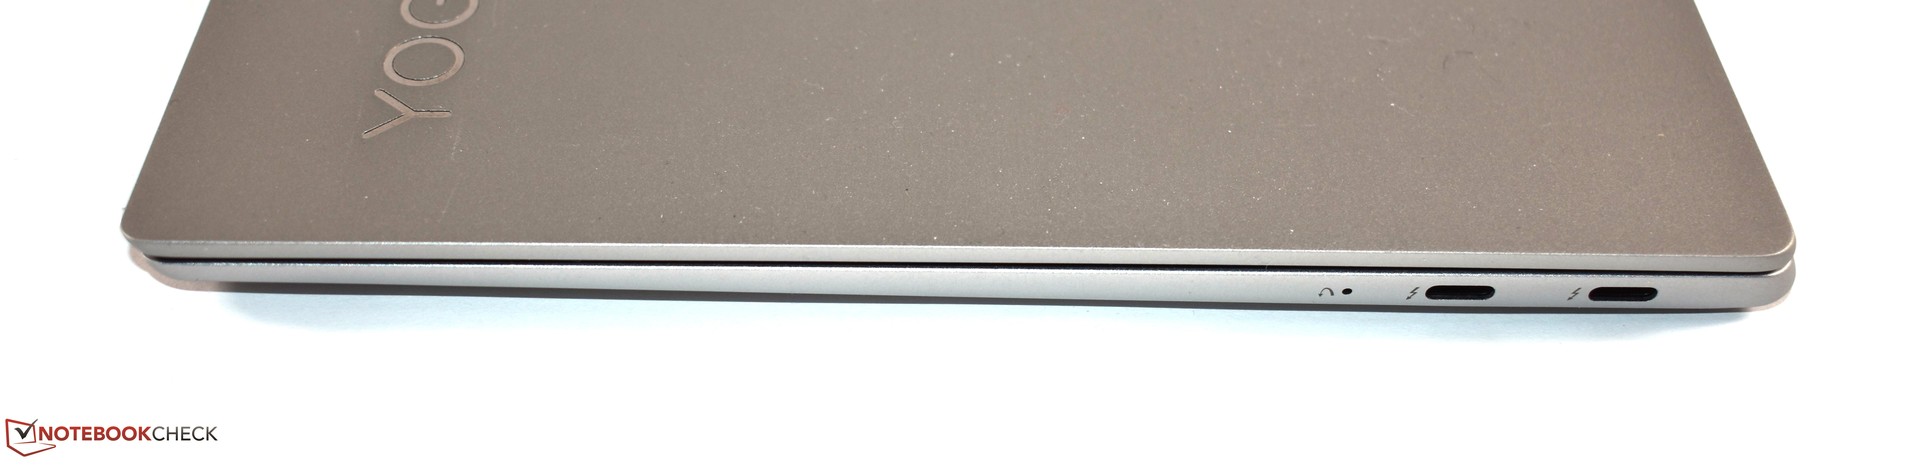
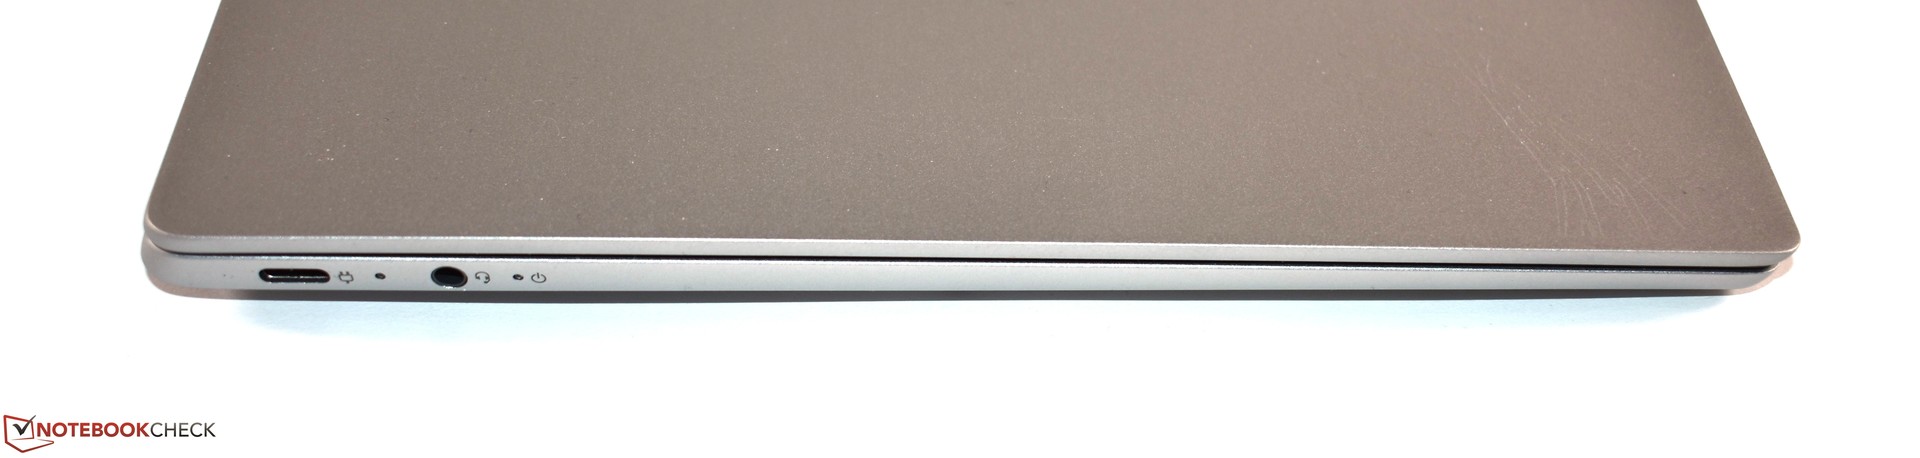
Algumas mudanças são bem-vindas, como a carcaça de alumínio premium, que é confortável de segurar graças a alguns milímetros mais finos. Além disso, aplaudimos a Lenovo por incluir três portas USB tipo C e por fazer duas delas Thunderbolt 3. Ter portas USB tipo C em ambos os lados do dispositivo permite carregá-lo de ambos os lados, o que é inerentemente mais flexível do que ter um lado para escolher.
A tela também é muito melhor com uma cobertura de espaço de cor alta e sem PWM. O teclado também tem um bom deslocamento, embora não esteja no nível do ThinkPad. Da mesma forma, gostamos do trackpad de vidro, enquanto a inclusão de um SSD Samsung PM981 é louvável, pois é atualmente o padrão de portas das unidades NVMe. Por fim, a abertura da dobradiça de 180° é útil e é algo que estamos mais acostumados a ver em portáteis comerciais do que em portáteis de consumo.
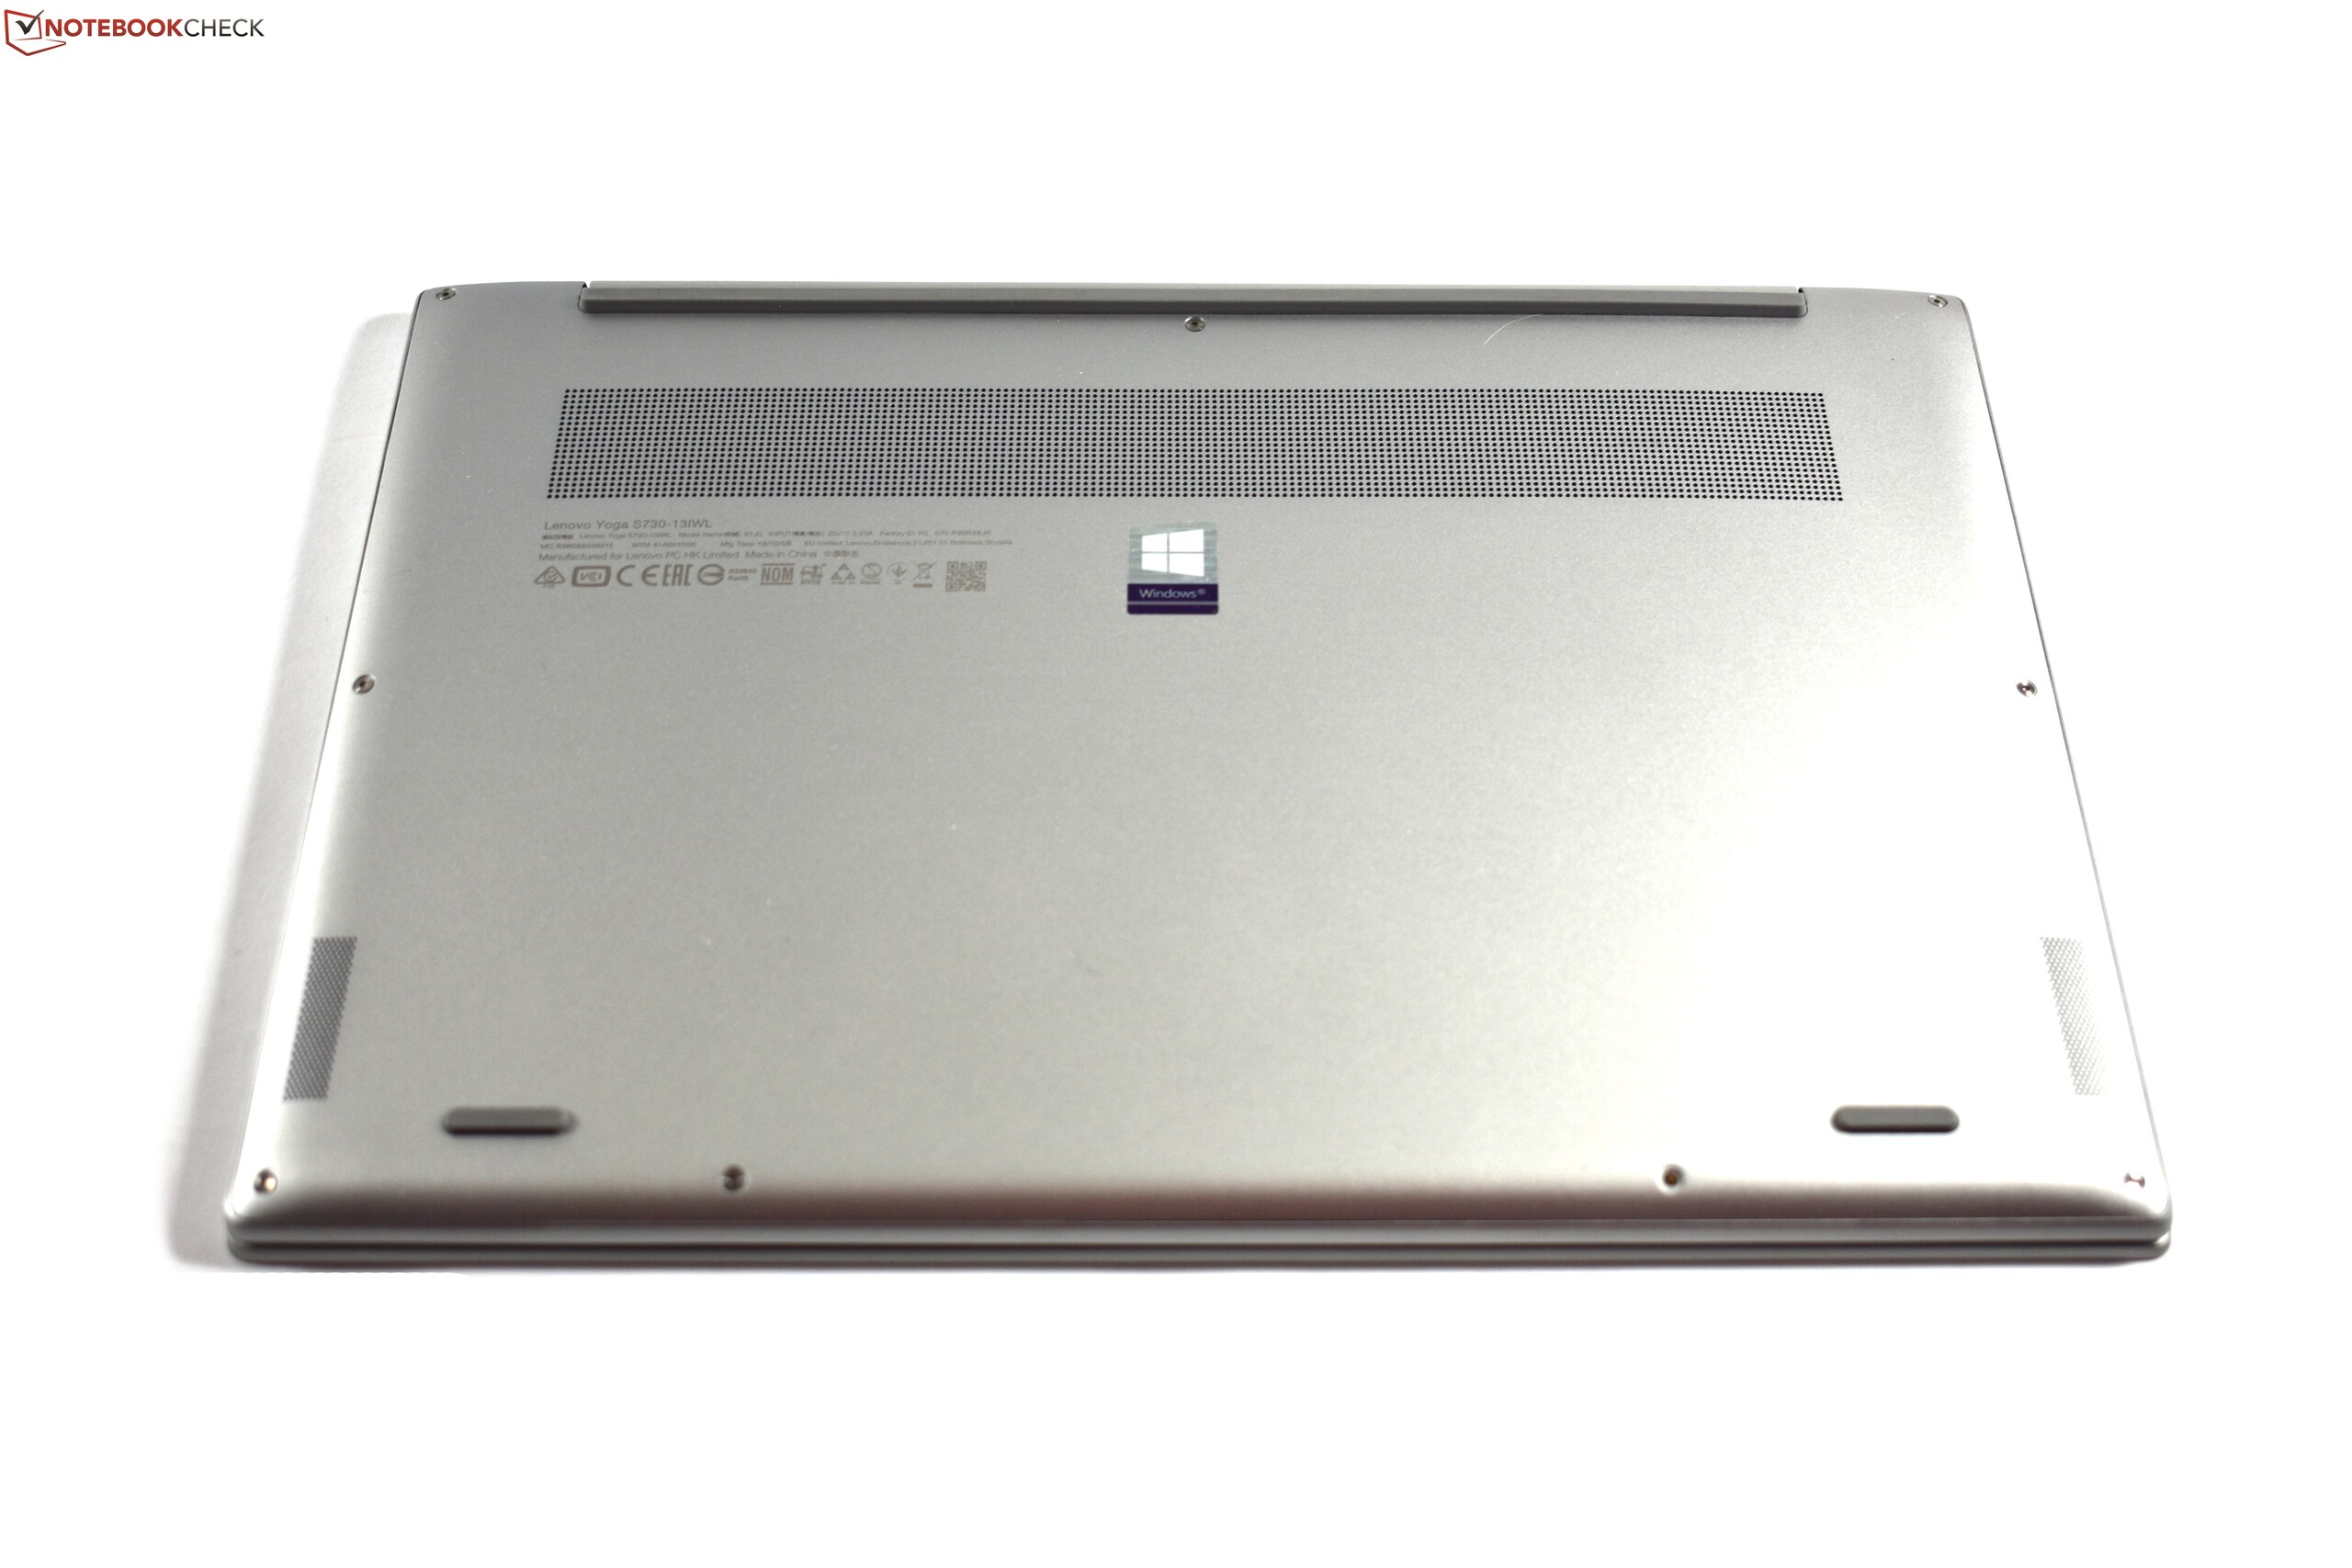
Infelizmente, existem algumas desvantagens, que derivam principalmente da carcaça fina. A bateria é comparativamente pequena e oferece uma duração de bateria decepcionante. Igualmente, a falta de USB Type-A pode frustrar algumas pessoas, assim como a ausência de uma opção de GPU dedicada. Além disso, a Lenovo equipou o dispositivo com um único ventilador, o que faz com que o processador sofra de um afogamento térmico pesado. Teríamos gostado também das opções de tela mate ou 4K porque o acabamento refletivo atrai digitais e reflexos. Além disso, a placa de Wi-Fi é uma opção fraca para um portátil caro, enquanto o ruído da bobina pode se tornar irritante a longo prazo.
O Lenovo Yoga S730-13IWL é um portátil decente em geral, mas não é aquele que podemos recomendar sobre seus concorrentes. É um ultrabook sólido em muitos aspectos, mas dispositivos como o Dell XPS 13 9370 são mais completos, enquanto outros concorrentes, como o HP Envy 13, têm opções de tela 4K e GPUs dedicadas. Em suma, recomendamos que você considere o melhor dos nossos dispositivos de comparação antes de pensar em comprar o Lenovo Yoga S730-13IWL.
Lenovo Yoga S730-13IWL
- 12/22/2018 v6 (old)
Benjamin Herzig