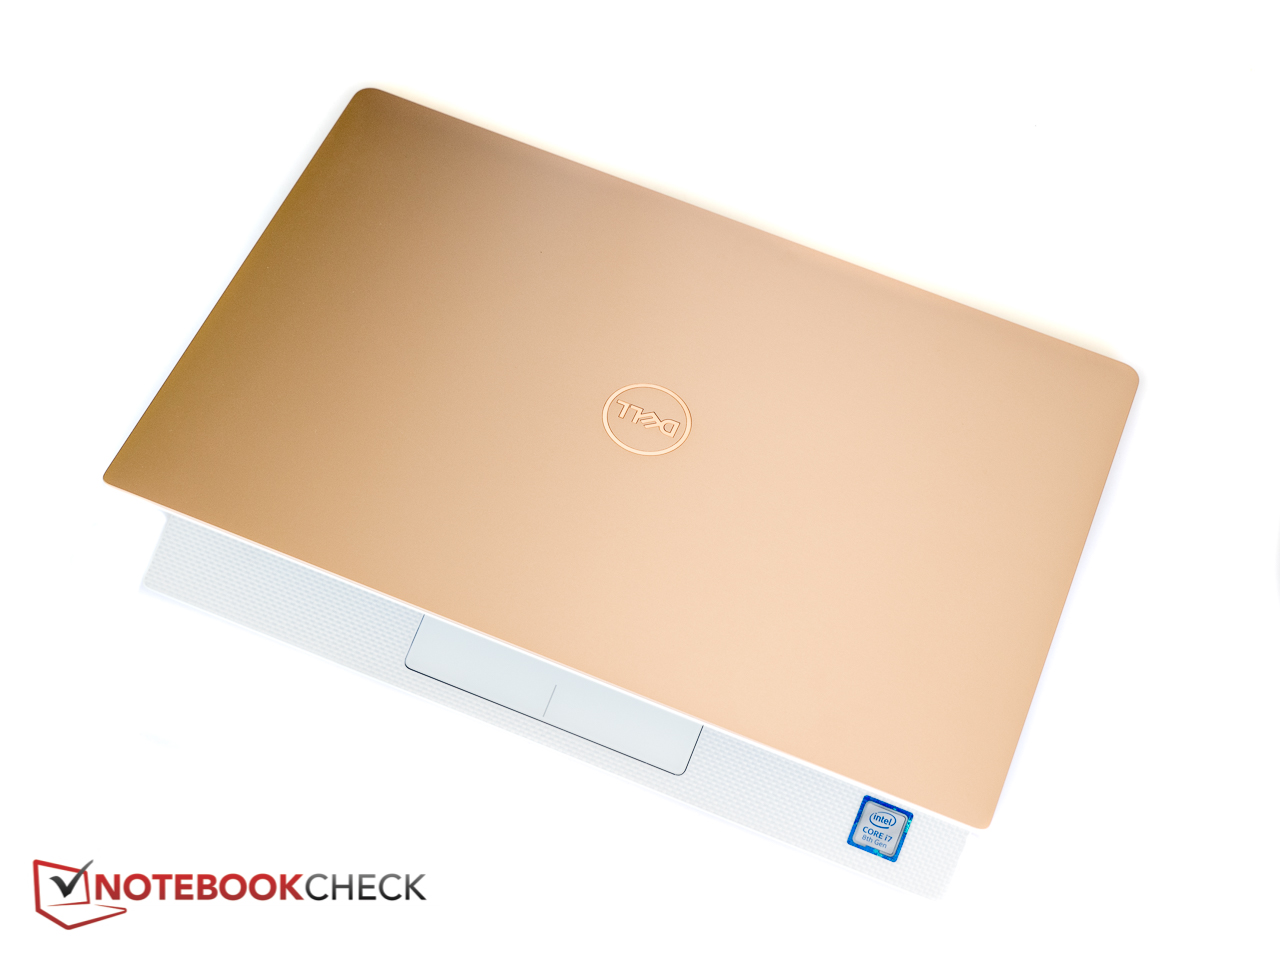
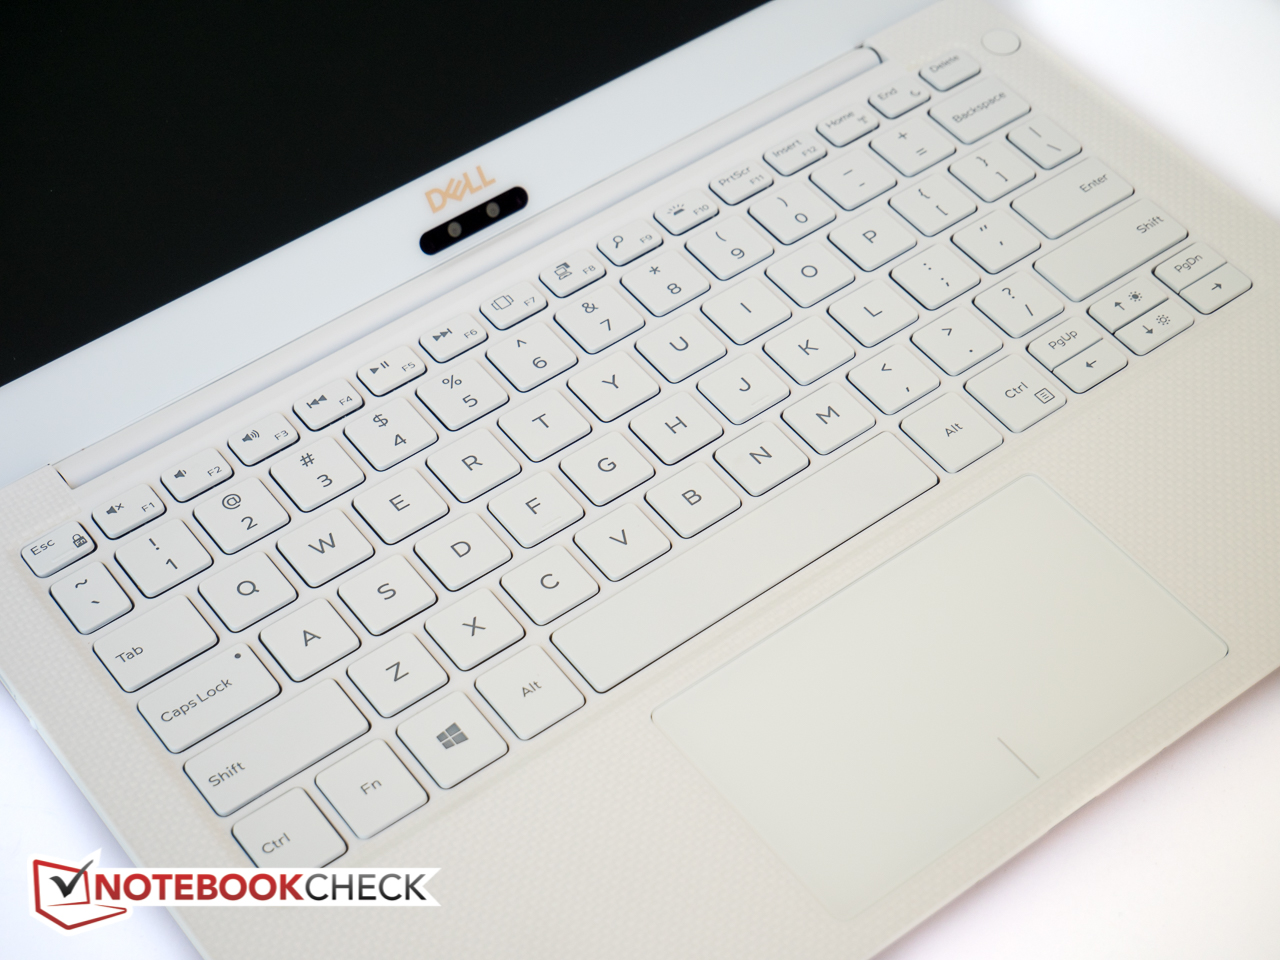
Breve Análise do Portátil Dell XPS 13 9370 (i7-8550U, 4K UHD)
| SD Card Reader | |
| average JPG Copy Test (av. of 3 runs) | |
| Lenovo ThinkPad X1 Carbon 2018-20KGS03900 (Toshiba Exceria Pro M501) | |
| Dell XPS 13 9370 i5 UHD (Toshiba Exceria Pro M501 64 GB UHS-II) | |
| Dell XPS 13 9370 i7 UHD (Toshiba Exceria Pro UHS-II) | |
| Lenovo IdeaPad 320S-13IKB (Toshiba Exceria Pro M501) | |
| Média da turma Subnotebook (23.7 - 188, n=9, últimos 2 anos) | |
| Asus ZenBook 13 UX331UN (Toshiba Exceria Pro M501 microSDXC 64GB) | |
| maximum AS SSD Seq Read Test (1GB) | |
| Lenovo ThinkPad X1 Carbon 2018-20KGS03900 (Toshiba Exceria Pro M501) | |
| Dell XPS 13 9370 i5 UHD (Toshiba Exceria Pro M501 64 GB UHS-II) | |
| Dell XPS 13 9370 i7 UHD (Toshiba Exceria Pro UHS-II) | |
| Média da turma Subnotebook (24.9 - 195, n=8, últimos 2 anos) | |
| Lenovo IdeaPad 320S-13IKB (Toshiba Exceria Pro M501) | |
| Asus ZenBook 13 UX331UN (Toshiba Exceria Pro M501 microSDXC 64GB) | |
| |||||||||||||||||||||||||
iluminação: 86 %
iluminação com acumulador: 478.5 cd/m²
Contraste: 1113:1 (Preto: 0.43 cd/m²)
ΔE ColorChecker Calman: 3.09 | ∀{0.5-29.43 Ø4.71}
calibrated: 2.06
ΔE Greyscale Calman: 2.4 | ∀{0.09-98 Ø4.96}
98.36% sRGB (Argyll 1.6.3 3D)
69.47% AdobeRGB 1998 (Argyll 1.6.3 3D)
69.5% AdobeRGB 1998 (Argyll 3D)
98.4% sRGB (Argyll 3D)
68.9% Display P3 (Argyll 3D)
Gamma: 2.063
CCT: 6883 K
| Dell XPS 13 9370 i7 UHD ID: Sharp SHP148B, Name: LQ133D1, Dell P/N: 8XDHY, IPS, 13.3", 3840x2160 | Dell XPS 13 9370 i5 UHD ID: Sharp SHP148B, Name: LQ133D1, Dell P/N: 8XDHY, IPS, 13.3", 3840x2160 | Asus ZenBook 13 UX331UN AU Optronics B133HAN04.9, IPS, 13.3", 1920x1080 | Lenovo IdeaPad 320S-13IKB InfoVision M133NWF4R0, IPS LED, 13.3", 1920x1080 | Lenovo ThinkPad X1 Carbon 2018-20KGS03900 B140QAN02.0, IPS, 14", 2560x1440 | Samsung Notebook 9 NP900X3N-K01US ID: BOE06E1, Name: NV133FHB-N31, IPS, 13.3", 1920x1080 | |
|---|---|---|---|---|---|---|
| Display | 0% | -10% | -2% | 24% | -9% | |
| Display P3 Coverage (%) | 68.9 | 68.9 0% | 63.3 -8% | 66.3 -4% | 87.7 27% | 63.4 -8% |
| sRGB Coverage (%) | 98.4 | 98.4 0% | 86.7 -12% | 97.4 -1% | 100 2% | 88.6 -10% |
| AdobeRGB 1998 Coverage (%) | 69.5 | 69.5 0% | 63.4 -9% | 68.1 -2% | 99.9 44% | 64 -8% |
| Response Times | 4% | 41% | 23% | 19% | 32% | |
| Response Time Grey 50% / Grey 80% * (ms) | 69.6 ? | 67.2 ? 3% | 44 ? 37% | 56.8 ? 18% | 59.2 ? 15% | 41.6 ? 40% |
| Response Time Black / White * (ms) | 44 ? | 41.6 ? 5% | 24 ? 45% | 31.6 ? 28% | 34.4 ? 22% | 34 ? 23% |
| PWM Frequency (Hz) | 3759 ? | 2500 ? | 198.4 ? | 210.1 ? | ||
| Screen | -8% | -13% | 5% | 20% | -10% | |
| Brightness middle (cd/m²) | 478.5 | 496.4 4% | 329 -31% | 330 -31% | 578 21% | 510.7 7% |
| Brightness (cd/m²) | 466 | 469 1% | 306 -34% | 304 -35% | 533 14% | 481 3% |
| Brightness Distribution (%) | 86 | 84 -2% | 86 0% | 88 2% | 84 -2% | 90 5% |
| Black Level * (cd/m²) | 0.43 | 0.5 -16% | 0.3 30% | 0.25 42% | 0.38 12% | 0.66 -53% |
| Contrast (:1) | 1113 | 993 -11% | 1097 -1% | 1320 19% | 1521 37% | 774 -30% |
| Colorchecker dE 2000 * | 3.09 | 2.9 6% | 4.07 -32% | 1.8 42% | 1.9 39% | 2.4 22% |
| Colorchecker dE 2000 max. * | 5.94 | 5.26 11% | 7.05 -19% | 4.3 28% | 3.8 36% | 7.3 -23% |
| Colorchecker dE 2000 calibrated * | 2.06 | 0.8 61% | ||||
| Greyscale dE 2000 * | 2.4 | 3.9 -63% | 2.76 -15% | 2.5 -4% | 3 -25% | 2.4 -0% |
| Gamma | 2.063 107% | 2.066 106% | 2.56 86% | 2.11 104% | 2.14 103% | 2.23 99% |
| CCT | 6883 94% | 7169 91% | 6915 94% | 6588 99% | 6377 102% | 6747 96% |
| Color Space (Percent of AdobeRGB 1998) (%) | 69.47 | 63.9 -8% | 56 -19% | 61.8 -11% | 88.8 28% | 57 -18% |
| Color Space (Percent of sRGB) (%) | 98.36 | 98.2 0% | 86 -13% | 97.3 -1% | 100 2% | 88.1 -10% |
| Média Total (Programa/Configurações) | -1% /
-5% | 6% /
-5% | 9% /
6% | 21% /
21% | 4% /
-4% |
* ... menor é melhor
Exibir tempos de resposta
| ↔ Tempo de resposta preto para branco | ||
|---|---|---|
| 44 ms ... ascensão ↗ e queda ↘ combinadas | ↗ 24.4 ms ascensão | 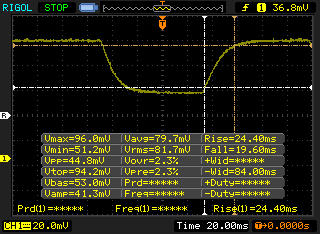 |
| ↘ 19.6 ms queda | ||
| A tela mostra taxas de resposta lentas em nossos testes e será insatisfatória para os jogadores. Em comparação, todos os dispositivos testados variam de 0.1 (mínimo) a 240 (máximo) ms. » 98 % de todos os dispositivos são melhores. Isso significa que o tempo de resposta medido é pior que a média de todos os dispositivos testados (19.8 ms). | ||
| ↔ Tempo de resposta 50% cinza a 80% cinza | ||
| 69.6 ms ... ascensão ↗ e queda ↘ combinadas | ↗ 32.4 ms ascensão | 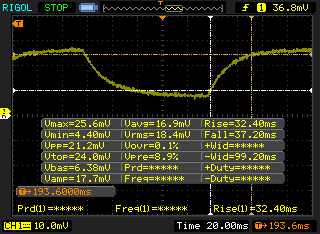 |
| ↘ 37.2 ms queda | ||
| A tela mostra taxas de resposta lentas em nossos testes e será insatisfatória para os jogadores. Em comparação, todos os dispositivos testados variam de 0.165 (mínimo) a 636 (máximo) ms. » 99 % de todos os dispositivos são melhores. Isso significa que o tempo de resposta medido é pior que a média de todos os dispositivos testados (31 ms). | ||
Cintilação da tela / PWM (modulação por largura de pulso)
| Tela tremeluzindo/PWM detectado | 3759 Hz | ≤ 20 % configuração de brilho | 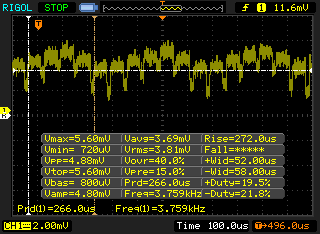 |
A luz de fundo da tela pisca em 3759 Hz (pior caso, por exemplo, utilizando PWM) Cintilação detectada em uma configuração de brilho de 20 % e abaixo. Não deve haver cintilação ou PWM acima desta configuração de brilho. A frequência de 3759 Hz é bastante alta, então a maioria dos usuários sensíveis ao PWM não deve notar nenhuma oscilação. [pwm_comparison] Em comparação: 52 % de todos os dispositivos testados não usam PWM para escurecer a tela. Se PWM foi detectado, uma média de 7757 (mínimo: 5 - máximo: 343500) Hz foi medida. | |||
XPS 13 9370 i7-8550U
XPS 13 9360 i7-8550U
XPS 13 9370 i5-8250U
* ... menor é melhor
| PCMark 8 Home Score Accelerated v2 | 3371 pontos | |
| PCMark 8 Creative Score Accelerated v2 | 4865 pontos | |
| PCMark 8 Work Score Accelerated v2 | 4125 pontos | |
| PCMark 10 Score | 3728 pontos | |
Ajuda | ||
| Dell XPS 13 9370 i7 UHD Toshiba XG5 KXG50ZNV512G | Dell XPS 13 9370 i5 UHD Toshiba XG5 KXG50ZNV256G | Asus ZenBook 13 UX331UN SK Hynix HFS256G39TND-N210A | Lenovo ThinkPad X1 Carbon 2018-20KGS03900 Samsung SSD PM981 MZVLB512HAJQ | HP Spectre 13-af033ng Samsung PM961 NVMe MZVLW512HMJP | |
|---|---|---|---|---|---|
| AS SSD | 16% | -71% | 88% | -310% | |
| Copy Game MB/s (MB/s) | 503 | 291.4 -42% | 154.1 -69% | 1107 120% | 381.2 -24% |
| Copy Program MB/s (MB/s) | 570 | 207 -64% | 129.7 -77% | 460.2 -19% | 337.8 -41% |
| Copy ISO MB/s (MB/s) | 585 | 357.4 -39% | 192.4 -67% | 1247 113% | 695 19% |
| Score Total (Points) | 1911 | 2437 28% | 991 -48% | 3529 85% | 1879 -2% |
| Score Write (Points) | 596 | 1135 90% | 323 -46% | 1801 202% | 105 -82% |
| Score Read (Points) | 926 | 894 -3% | 445 -52% | 1168 26% | 1201 30% |
| Access Time Write * (ms) | 0.055 | 0.038 31% | 0.23 -318% | 0.027 51% | 2.294 -4071% |
| Access Time Read * (ms) | 0.059 | 0.063 -7% | 0.09 -53% | 0.029 51% | 0.073 -24% |
| 4K-64 Write (MB/s) | 444.8 | 937 111% | 233.1 -48% | 1529 244% | 69.7 -84% |
| 4K-64 Read (MB/s) | 678 | 657 -3% | 368.4 -46% | 876 29% | 1020 50% |
| 4K Write (MB/s) | 107.4 | 107.2 0% | 68.9 -36% | 134.3 25% | 1.07 -99% |
| 4K Read (MB/s) | 29.36 | 33.81 15% | 27.98 -5% | 52.4 78% | 45.86 56% |
| Seq Write (MB/s) | 435.8 | 907 108% | 213.7 -51% | 1376 216% | 337.5 -23% |
| Seq Read (MB/s) | 2205 | 2037 -8% | 483.7 -78% | 2396 9% | 1351 -39% |
* ... menor é melhor

| 3DMark 11 Performance | 2117 pontos | |
| 3DMark Ice Storm Standard Score | 71022 pontos | |
| 3DMark Cloud Gate Standard Score | 8813 pontos | |
| 3DMark Fire Strike Score | 1182 pontos | |
Ajuda | ||
| baixo | média | alto | ultra | |
|---|---|---|---|---|
| BioShock Infinite (2013) | 71.2 | 34.6 | 30.2 | 10 |
| Rise of the Tomb Raider (2016) | 22 | 12.2 |
Barulho
| Ocioso |
| 28 / 28 / 28 dB |
| Carga |
| 32.5 / 42.2 dB |
 | ||
30 dB silencioso 40 dB(A) audível 50 dB(A) ruidosamente alto |
||
min: | ||
| Dell XPS 13 9370 i7 UHD UHD Graphics 620, i5-8550U, Toshiba XG5 KXG50ZNV512G | Dell XPS 13 9370 i5 UHD UHD Graphics 620, i5-8250U, Toshiba XG5 KXG50ZNV256G | Asus ZenBook 13 UX331UN GeForce MX150, i5-8550U, SK Hynix HFS256G39TND-N210A | Lenovo IdeaPad 320S-13IKB GeForce MX150, i5-8250U, Samsung PM961 NVMe MZVLW512HMJP | Lenovo ThinkPad X1 Carbon 2018-20KGS03900 UHD Graphics 620, i5-8550U, Samsung SSD PM981 MZVLB512HAJQ | Samsung Notebook 9 NP900X3N-K01US HD Graphics 620, i5-7200U, Samsung CM871a MZNTY256HDHP | HP Spectre 13-af033ng UHD Graphics 620, i5-8550U, Samsung PM961 NVMe MZVLW512HMJP | |
|---|---|---|---|---|---|---|---|
| Noise | -2% | -8% | -3% | -3% | 2% | -1% | |
| desligado / ambiente * (dB) | 28 | 29 -4% | 30.13 -8% | 29.4 -5% | 28.9 -3% | 28.4 -1% | 30.13 -8% |
| Idle Minimum * (dB) | 28 | 29 -4% | 30.13 -8% | 30 -7% | 28.9 -3% | 28.4 -1% | 30.13 -8% |
| Idle Average * (dB) | 28 | 29 -4% | 30.3 -8% | 30 -7% | 28.9 -3% | 28.4 -1% | 30.13 -8% |
| Idle Maximum * (dB) | 28 | 29 -4% | 30.3 -8% | 30 -7% | 32.5 -16% | 28.4 -1% | 30.13 -8% |
| Load Average * (dB) | 32.5 | 32 2% | 39.2 -21% | 32.2 1% | 35.1 -8% | 33.2 -2% | 31.5 3% |
| Load Maximum * (dB) | 42.2 | 40.1 5% | 41 3% | 38.8 8% | 35.1 17% | 35.2 17% | 33.5 21% |
| Witcher 3 ultra * (dB) | 35.2 |
* ... menor é melhor
(-) A temperatura máxima no lado superior é 45.2 °C / 113 F, em comparação com a média de 35.9 °C / 97 F , variando de 21.4 a 59 °C para a classe Subnotebook.
(-) A parte inferior aquece até um máximo de 47.4 °C / 117 F, em comparação com a média de 39.2 °C / 103 F
(+) Em uso inativo, a temperatura média para o lado superior é 25.4 °C / 78 F, em comparação com a média do dispositivo de 30.8 °C / ### class_avg_f### F.
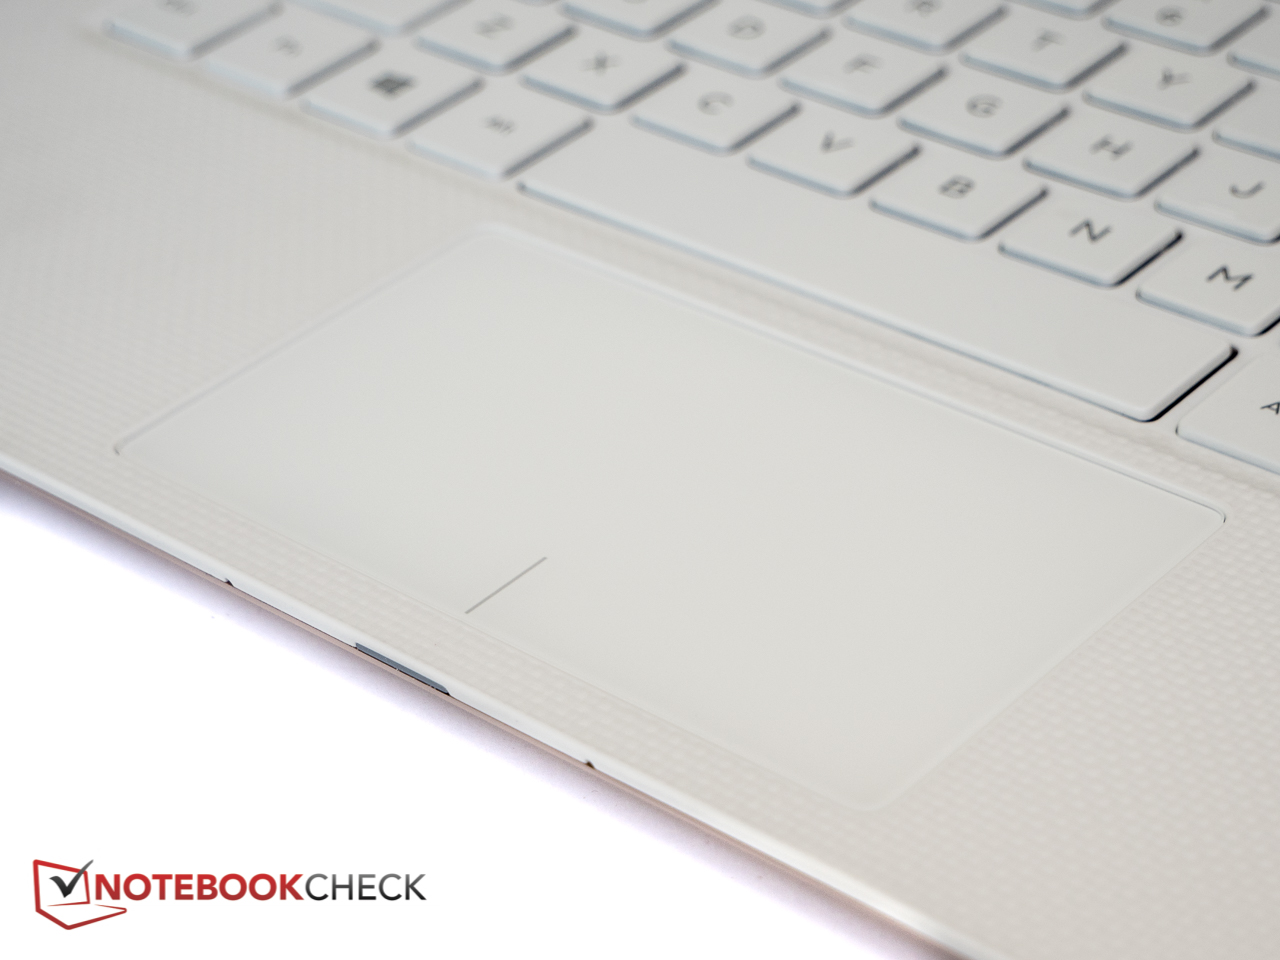
(+) Os apoios para as mãos e o touchpad são mais frios que a temperatura da pele, com um máximo de 28 °C / 82.4 F e, portanto, são frios ao toque.
(±) A temperatura média da área do apoio para as mãos de dispositivos semelhantes foi 28.2 °C / 82.8 F (+0.2 °C / 0.4 F).
Dell XPS 13 9370 i7 UHD análise de áudio
(±) | o volume do alto-falante é médio, mas bom (###valor### dB)
Graves 100 - 315Hz
(-) | quase nenhum baixo - em média 15.3% menor que a mediana
(±) | a linearidade dos graves é média (11.5% delta para a frequência anterior)
Médios 400 - 2.000 Hz
(+) | médios equilibrados - apenas 4.5% longe da mediana
(+) | médios são lineares (4.9% delta para frequência anterior)
Altos 2 - 16 kHz
(+) | agudos equilibrados - apenas 2.6% longe da mediana
(±) | a linearidade dos máximos é média (7.1% delta para frequência anterior)
Geral 100 - 16.000 Hz
(±) | a linearidade do som geral é média (18.9% diferença em relação à mediana)
Comparado com a mesma classe
» 57% de todos os dispositivos testados nesta classe foram melhores, 6% semelhantes, 36% piores
» O melhor teve um delta de 5%, a média foi 18%, o pior foi 53%
Comparado com todos os dispositivos testados
» 44% de todos os dispositivos testados foram melhores, 8% semelhantes, 48% piores
» O melhor teve um delta de 4%, a média foi 23%, o pior foi 134%
Apple MacBook 12 (Early 2016) 1.1 GHz análise de áudio
(+) | os alto-falantes podem tocar relativamente alto (###valor### dB)
Graves 100 - 315Hz
(±) | graves reduzidos - em média 11.3% menor que a mediana
(±) | a linearidade dos graves é média (14.2% delta para a frequência anterior)
Médios 400 - 2.000 Hz
(+) | médios equilibrados - apenas 2.4% longe da mediana
(+) | médios são lineares (5.5% delta para frequência anterior)
Altos 2 - 16 kHz
(+) | agudos equilibrados - apenas 2% longe da mediana
(+) | os máximos são lineares (4.5% delta da frequência anterior)
Geral 100 - 16.000 Hz
(+) | o som geral é linear (10.2% diferença em relação à mediana)
Comparado com a mesma classe
» 7% de todos os dispositivos testados nesta classe foram melhores, 2% semelhantes, 90% piores
» O melhor teve um delta de 5%, a média foi 18%, o pior foi 53%
Comparado com todos os dispositivos testados
» 5% de todos os dispositivos testados foram melhores, 1% semelhantes, 94% piores
» O melhor teve um delta de 4%, a média foi 23%, o pior foi 134%
| desligado | |
| Ocioso | |
| Carga |
|
Key:
min: | |
| Dell XPS 13 9370 i7 UHD i5-8550U, UHD Graphics 620, Toshiba XG5 KXG50ZNV512G, IPS, 3840x2160, 13.3" | Dell XPS 13 9370 i5 UHD i5-8250U, UHD Graphics 620, Toshiba XG5 KXG50ZNV256G, IPS, 3840x2160, 13.3" | Asus ZenBook 13 UX331UN i5-8550U, GeForce MX150, SK Hynix HFS256G39TND-N210A, IPS, 1920x1080, 13.3" | Lenovo IdeaPad 320S-13IKB i5-8250U, GeForce MX150, Samsung PM961 NVMe MZVLW512HMJP, IPS LED, 1920x1080, 13.3" | Lenovo ThinkPad X1 Carbon 2018-20KGS03900 i5-8550U, UHD Graphics 620, Samsung SSD PM981 MZVLB512HAJQ, IPS, 2560x1440, 14" | Xiaomi Mi Notebook Air 13.3 2018 i5-8250U, GeForce MX150, Samsung PM961 MZVLW256HEHP, IPS, 1920x1080, 13.3" | HP Spectre 13-af033ng i5-8550U, UHD Graphics 620, Samsung PM961 NVMe MZVLW512HMJP, IPS, 1920x1080, 13.3" | |
|---|---|---|---|---|---|---|---|
| Power Consumption | 5% | 26% | 10% | -6% | 9% | 24% | |
| Idle Minimum * (Watt) | 5 | 4.3 14% | 2.2 56% | 3.4 32% | 3.8 24% | 3.9 22% | 2.8 44% |
| Idle Average * (Watt) | 8.3 | 8 4% | 5 40% | 6.1 27% | 8.9 -7% | 7 16% | 6.2 25% |
| Idle Maximum * (Watt) | 8.8 | 8.1 8% | 8 9% | 7.7 12% | 11.9 -35% | 7.5 15% | 9.4 -7% |
| Load Average * (Watt) | 46.4 | 46.6 -0% | 33 29% | 44.2 5% | 47.5 -2% | 44.4 4% | 32.2 31% |
| Load Maximum * (Watt) | 48.6 | 49.8 -2% | 49.4 -2% | 60.3 -24% | 52.5 -8% | 55.1 -13% | 36.6 25% |
| Witcher 3 ultra * (Watt) | 37.6 | 32.8 |
* ... menor é melhor
| Dell XPS 13 9370 i7 UHD i5-8550U, UHD Graphics 620, 52 Wh | Dell XPS 13 9370 i5 UHD i5-8250U, UHD Graphics 620, 52 Wh | Asus ZenBook 13 UX331UN i5-8550U, GeForce MX150, 50 Wh | Lenovo IdeaPad 320S-13IKB i5-8250U, GeForce MX150, 36 Wh | Lenovo ThinkPad X1 Carbon 2018-20KGS03900 i5-8550U, UHD Graphics 620, 57 Wh | Samsung Notebook 9 NP900X3N-K01US i5-7200U, HD Graphics 620, 30 Wh | HP Spectre 13-af033ng i5-8550U, UHD Graphics 620, 43 Wh | Xiaomi Mi Notebook Air 13.3 2018 i5-8250U, GeForce MX150, 39 Wh | |
|---|---|---|---|---|---|---|---|---|
| Duração da bateria | -2% | 22% | -23% | 24% | -33% | -15% | -18% | |
| Reader / Idle (h) | 13.7 | 14.5 6% | 20.7 51% | 12.3 -10% | 22.1 61% | 11.6 -15% | 13 -5% | |
| WiFi v1.3 (h) | 7.8 | 6.8 -13% | 9 15% | 5.7 -27% | 8.7 12% | 4.7 -40% | 5.9 -24% | 6.1 -22% |
| Load (h) | 1.8 | 1.8 0% | 1.8 0% | 1.2 -33% | 1.8 0% | 1 -44% | 1.7 -6% | 1.3 -28% |
| Witcher 3 ultra (h) | 1.4 |
Pro
Contra
Então, o XPS 13 9370 com processador i7 é a melhor opção do que seu irmão mais barato com CPU i5? Neste momento, a resposta só pode ser um retumbante "não". Além da duração da bateria - que surpreendentemente supera a do modelo i5 UHD - o desempenho da nossa unidade de análise XPS 13 é um pouco decepcionante. Isso não quer dizer que o i7-8550U necessariamente se desempenhe muito pior nessa implementação em particular, do que em outros portáteis, mas o fato é que o XPS 13 9370 baseado em i7 não pode realmente se distanciar de nosso modelo de teste anterior com a CPU i5, que custa centenas a menos. É possível que tenhamos uma unidade defeituosa - as telas azuis e o colapso fatal do sistema certamente tornam isso uma explicação plausível. Caso tenhamos a chance de revisar um modelo de substituição posteriormente, atualizaremos esta análise adequadamente.
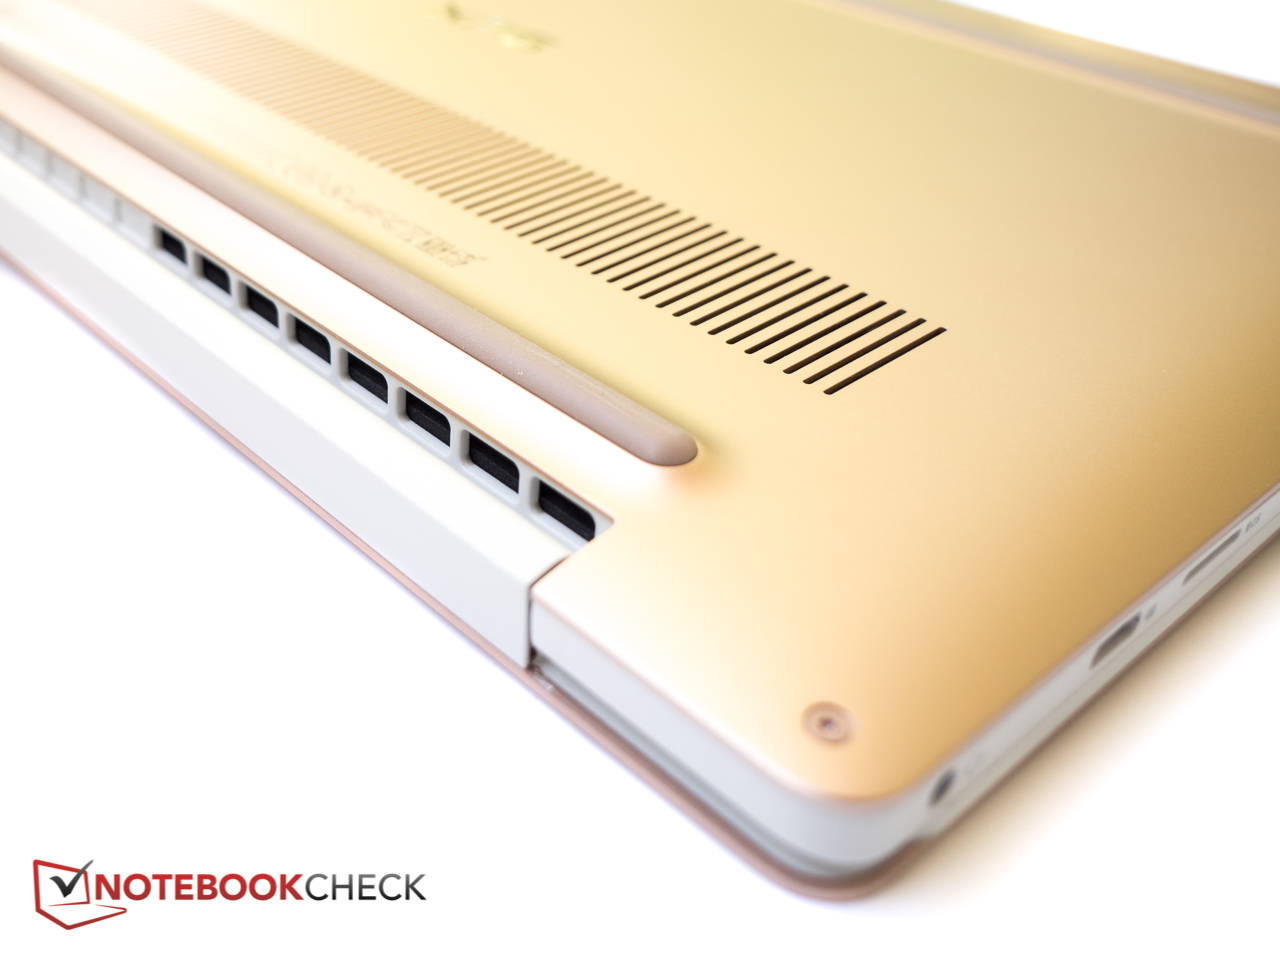
Dito isso, o XPS 13 9370 é certamente um companheiro agradável para o dia-a-dia com uma grande tela - apesar dos tempos de resposta lentos - e boa ergonomia por toda parte. Especialmente o controle do ventilador é executado com perfeição, já que as temperaturas da superfície sob uso normal e as cargas baixas a médias permanecem agradáveis e o ruído do sistema é muito mais constante e menos intrusivo do que o esperado de um aparelho fino e leve.
O XPS 13 9370 com i7-8550U é apenas uma opção atraente se um SSD maior e a quantidade máxima de RAM forem uma das principais preocupações. Um modelo i5 com 16 GB de RAM e SSD de 512 GB receberia nosso voto sempre, mas neste momento a Dell não oferece essa configuração específica.
Dell XPS 13 9370 i7 UHD
- 04/20/2018 v6 (old)
Bernie Pechlaner
Price comparison
