Breve Análise do Portátil MSI GE63VR Raider-075 (i7-7700HQ, GTX 1070, Full HD)


| SD Card Reader | |
| average JPG Copy Test (av. of 3 runs) | |
| MSI GE63VR 7RF Raider (Toshiba Exceria Pro SDXC 64 GB UHS-II) | |
| Acer Predator 15 G9-593-751X (Toshiba Exceria Pro SDXC 64 GB UHS-II) | |
| maximum AS SSD Seq Read Test (1GB) | |
| MSI GE63VR 7RF Raider (Toshiba Exceria Pro SDXC 64 GB UHS-II) | |
| Acer Predator 15 G9-593-751X (Toshiba Exceria Pro SDXC 64 GB UHS-II) | |
| Networking | |
| iperf3 transmit AX12 | |
| Acer Predator 15 G9-593-751X | |
| Alienware 15 R3 | |
| MSI GE63VR 7RF Raider | |
| Asus Zephyrus GX501VS | |
| iperf3 receive AX12 | |
| Acer Predator 15 G9-593-751X | |
| MSI GE63VR 7RF Raider | |
| Alienware 15 R3 | |
| Asus Zephyrus GX501VS | |
| |||||||||||||||||||||||||
iluminação: 84 %
iluminação com acumulador: 285 cd/m²
Contraste: 1239:1 (Preto: 0.23 cd/m²)
ΔE ColorChecker Calman: 3.52 | ∀{0.5-29.43 Ø4.71}
ΔE Greyscale Calman: 3.41 | ∀{0.09-98 Ø4.96}
100% sRGB (Argyll 1.6.3 3D)
77% AdobeRGB 1998 (Argyll 1.6.3 3D)
86.7% AdobeRGB 1998 (Argyll 3D)
100% sRGB (Argyll 3D)
91.3% Display P3 (Argyll 3D)
Gamma: 2.05
CCT: 7077 K
| MSI GE63VR 7RF Raider Chi Mei N156HHE-GA1 (CMN15F4), 1920x1080, 15.6" | Acer Predator 15 G9-593-751X LG Philips LP156WF6-SPP1 (LGD04D5), 1920x1080, 15.6" | Alienware 15 R3 HPJGK_B156HTN (AUO51ED), 1920x1080, 15.6" | Asus Zephyrus GX501VS ID: AUO42ED, Name: AU Optronics B156HAN04.2, 1920x1080, 15.6" | |
|---|---|---|---|---|
| Display | -23% | -20% | -25% | |
| Display P3 Coverage (%) | 91.3 | 65.4 -28% | 66 -28% | 62.1 -32% |
| sRGB Coverage (%) | 100 | 85.5 -14% | 90.5 -9% | 85.6 -14% |
| AdobeRGB 1998 Coverage (%) | 86.7 | 62.5 -28% | 66.2 -24% | 62.4 -28% |
| Response Times | -271% | -114% | -268% | |
| Response Time Grey 50% / Grey 80% * (ms) | 9.6 ? | 36 ? -275% | 25 ? -160% | 33.2 ? -246% |
| Response Time Black / White * (ms) | 7.2 ? | 26.4 ? -267% | 12 ? -67% | 28 ? -289% |
| PWM Frequency (Hz) | 26000 ? | 20830 ? | ||
| Screen | -26% | -66% | -10% | |
| Brightness middle (cd/m²) | 285 | 295 4% | 386 35% | 307.1 8% |
| Brightness (cd/m²) | 273 | 274 0% | 382 40% | 309 13% |
| Brightness Distribution (%) | 84 | 88 5% | 93 11% | 86 2% |
| Black Level * (cd/m²) | 0.23 | 0.32 -39% | 0.39 -70% | 0.35 -52% |
| Contrast (:1) | 1239 | 922 -26% | 990 -20% | 877 -29% |
| Colorchecker dE 2000 * | 3.52 | 4.59 -30% | 10.2 -190% | 3.4 3% |
| Colorchecker dE 2000 max. * | 5.18 | 11 -112% | 15.81 -205% | 8.2 -58% |
| Greyscale dE 2000 * | 3.41 | 4.03 -18% | 11.28 -231% | 1.4 59% |
| Gamma | 2.05 107% | 2.3 96% | 2.23 99% | 2.19 100% |
| CCT | 7077 92% | 7229 90% | 11383 57% | 6558 99% |
| Color Space (Percent of AdobeRGB 1998) (%) | 77 | 56 -27% | 59 -23% | 55.6 -28% |
| Color Space (Percent of sRGB) (%) | 100 | 85 -15% | 90 -10% | 85 -15% |
| Média Total (Programa/Configurações) | -107% /
-58% | -67% /
-63% | -101% /
-47% |
* ... menor é melhor
Exibir tempos de resposta
| ↔ Tempo de resposta preto para branco | ||
|---|---|---|
| 7.2 ms ... ascensão ↗ e queda ↘ combinadas | ↗ 5 ms ascensão | 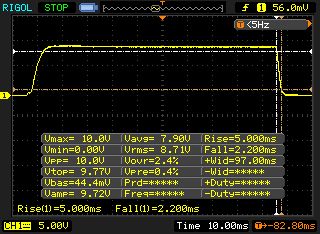 |
| ↘ 2.2 ms queda | ||
| A tela mostra taxas de resposta muito rápidas em nossos testes e deve ser muito adequada para jogos em ritmo acelerado. Em comparação, todos os dispositivos testados variam de 0.1 (mínimo) a 240 (máximo) ms. » 22 % de todos os dispositivos são melhores. Isso significa que o tempo de resposta medido é melhor que a média de todos os dispositivos testados (19.8 ms). | ||
| ↔ Tempo de resposta 50% cinza a 80% cinza | ||
| 9.6 ms ... ascensão ↗ e queda ↘ combinadas | ↗ 5.2 ms ascensão | 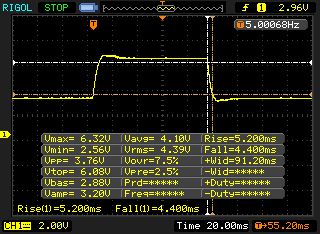 |
| ↘ 4.4 ms queda | ||
| A tela mostra taxas de resposta rápidas em nossos testes e deve ser adequada para jogos. Em comparação, todos os dispositivos testados variam de 0.165 (mínimo) a 636 (máximo) ms. » 23 % de todos os dispositivos são melhores. Isso significa que o tempo de resposta medido é melhor que a média de todos os dispositivos testados (31 ms). | ||
Cintilação da tela / PWM (modulação por largura de pulso)
| Tela tremeluzindo/PWM detectado | 26000 Hz | ≤ 25 % configuração de brilho | 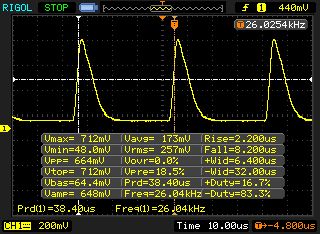 |
A luz de fundo da tela pisca em 26000 Hz (pior caso, por exemplo, utilizando PWM) Cintilação detectada em uma configuração de brilho de 25 % e abaixo. Não deve haver cintilação ou PWM acima desta configuração de brilho. A frequência de 26000 Hz é bastante alta, então a maioria dos usuários sensíveis ao PWM não deve notar nenhuma oscilação. [pwm_comparison] Em comparação: 52 % de todos os dispositivos testados não usam PWM para escurecer a tela. Se PWM foi detectado, uma média de 7754 (mínimo: 5 - máximo: 343500) Hz foi medida. | |||
| Cinebench R15 | |
| CPU Single 64Bit | |
| Alienware 15 R3 | |
| Acer Predator 15 G9-593-751X | |
| MSI GE63VR 7RF Raider | |
| Asus Zephyrus GX501VS | |
| CPU Multi 64Bit | |
| Acer Predator 15 G9-593-751X | |
| Alienware 15 R3 | |
| Asus Zephyrus GX501VS | |
| MSI GE63VR 7RF Raider | |
| PCMark 8 | |
| Home Score Accelerated v2 | |
| Acer Predator 15 G9-593-751X | |
| Asus Zephyrus GX501VS | |
| Alienware 15 R3 | |
| MSI GE63VR 7RF Raider | |
| Work Score Accelerated v2 | |
| Acer Predator 15 G9-593-751X | |
| Asus Zephyrus GX501VS | |
| Alienware 15 R3 | |
| MSI GE63VR 7RF Raider | |
| PCMark 8 Home Score Accelerated v2 | 4406 pontos | |
| PCMark 8 Work Score Accelerated v2 | 5270 pontos | |
Ajuda | ||
| MSI GE63VR 7RF Raider Toshiba HG6 THNSNJ256G8NY | Acer Predator 15 G9-593-751X Samsung SM951 MZVPV256HDGL m.2 PCI-e | Alienware 15 R3 | Asus Zephyrus GX501VS Samsung SM961 MZVPW256HEGL | |
|---|---|---|---|---|
| CrystalDiskMark 3.0 | 146% | 64% | ||
| Read Seq (MB/s) | 507 | 1939 282% | 1123 121% | |
| Write Seq (MB/s) | 441.4 | 1262 186% | 429.2 -3% | |
| Read 512 (MB/s) | 411.9 | 1078 162% | 833 102% | |
| Write 512 (MB/s) | 409.9 | 1192 191% | 428.1 4% | |
| Read 4k (MB/s) | 21.77 | 50.8 133% | 37.8 74% | |
| Write 4k (MB/s) | 88.9 | 141.9 60% | 122.9 38% | |
| Read 4k QD32 (MB/s) | 368.8 | 573 55% | 542 47% | |
| Write 4k QD32 (MB/s) | 190.3 | 375.3 97% | 429.8 126% |

| 3DMark 11 - 1280x720 Performance GPU | |
| MSI GE63VR 7RF Raider | |
| Alienware 15 R3 | |
| Acer Predator 15 G9-593-751X | |
| Asus Zephyrus GX501VS | |
| 3DMark - 1920x1080 Fire Strike Graphics | |
| MSI GE63VR 7RF Raider | |
| Alienware 15 R3 | |
| Acer Predator 15 G9-593-751X | |
| Asus Zephyrus GX501VS | |
| 3DMark 11 Performance | 16625 pontos | |
| 3DMark Cloud Gate Standard Score | 27629 pontos | |
| 3DMark Fire Strike Score | 13917 pontos | |
Ajuda | ||
| The Witcher 3 - 1920x1080 Ultra Graphics & Postprocessing (HBAO+) | |
| MSI GE63VR 7RF Raider | |
| Acer Predator 15 G9-593-751X | |
| Asus Zephyrus GX501VS | |
| Rise of the Tomb Raider | |
| 1920x1080 Very High Preset AA:FX AF:16x | |
| MSI GE63VR 7RF Raider | |
| Asus Zephyrus GX501VS | |
| 1920x1080 High Preset AA:FX AF:4x | |
| MSI GE63VR 7RF Raider | |
| Battlefield 1 | |
| 1920x1080 Ultra Preset AA:T | |
| Acer Predator 15 G9-593-751X | |
| Alienware 15 R3 | |
| MSI GE63VR 7RF Raider | |
| 1920x1080 High Preset AA:T | |
| Acer Predator 15 G9-593-751X | |
| Alienware 15 R3 | |
| MSI GE63VR 7RF Raider | |
| For Honor | |
| 1920x1080 Extreme Preset AA:T AF:16x | |
| MSI GE63VR 7RF Raider | |
| Acer Predator 15 G9-593-751X | |
| 1920x1080 High Preset AA:T AF:8x | |
| MSI GE63VR 7RF Raider | |
| Acer Predator 15 G9-593-751X | |
| Ghost Recon Wildlands | |
| 1920x1080 Ultra Preset AA:T AF:16x | |
| MSI GE63VR 7RF Raider | |
| Acer Predator 15 G9-593-751X | |
| 1920x1080 High Preset AA:T AF:4x | |
| MSI GE63VR 7RF Raider | |
| Acer Predator 15 G9-593-751X | |
| baixo | média | alto | ultra | |
|---|---|---|---|---|
| The Witcher 3 (2015) | 62.2 | |||
| Rise of the Tomb Raider (2016) | 118.8 | 102.5 | ||
| Far Cry Primal (2016) | 76 | 74 | ||
| Deus Ex Mankind Divided (2016) | 83.1 | 45.6 | ||
| Battlefield 1 (2016) | 110.5 | 103.2 | ||
| For Honor (2017) | 144.4 | 113 | ||
| Ghost Recon Wildlands (2017) | 90.8 | 52.2 |
Barulho
| Ocioso |
| 33 / 35 / 40 dB |
| HDD |
| 34 dB |
| Carga |
| 48 / 55 dB |
 | ||
30 dB silencioso 40 dB(A) audível 50 dB(A) ruidosamente alto |
||
min: | ||
(-) A temperatura máxima no lado superior é 48 °C / 118 F, em comparação com a média de 40.4 °C / 105 F , variando de 21.2 a 68.8 °C para a classe Gaming.
(-) A parte inferior aquece até um máximo de 47 °C / 117 F, em comparação com a média de 43.2 °C / 110 F
(+) Em uso inativo, a temperatura média para o lado superior é 28.4 °C / 83 F, em comparação com a média do dispositivo de 33.9 °C / ### class_avg_f### F.
(-) Jogando The Witcher 3, a temperatura média para o lado superior é 42 °C / 108 F, em comparação com a média do dispositivo de 33.9 °C / ## #class_avg_f### F.
(±) Os apoios para as mãos e o touchpad podem ficar muito quentes ao toque, com um máximo de 39 °C / 102.2 F.
(-) A temperatura média da área do apoio para as mãos de dispositivos semelhantes foi 28.8 °C / 83.8 F (-10.2 °C / -18.4 F).
MSI GE63VR 7RF Raider análise de áudio
(+) | os alto-falantes podem tocar relativamente alto (###valor### dB)
Graves 100 - 315Hz
(±) | graves reduzidos - em média 6.6% menor que a mediana
(±) | a linearidade dos graves é média (8.2% delta para a frequência anterior)
Médios 400 - 2.000 Hz
(+) | médios equilibrados - apenas 4.1% longe da mediana
(+) | médios são lineares (4.7% delta para frequência anterior)
Altos 2 - 16 kHz
(+) | agudos equilibrados - apenas 2.6% longe da mediana
(+) | os máximos são lineares (4.6% delta da frequência anterior)
Geral 100 - 16.000 Hz
(+) | o som geral é linear (9.9% diferença em relação à mediana)
Comparado com a mesma classe
» 5% de todos os dispositivos testados nesta classe foram melhores, 2% semelhantes, 94% piores
» O melhor teve um delta de 6%, a média foi 18%, o pior foi 132%
Comparado com todos os dispositivos testados
» 4% de todos os dispositivos testados foram melhores, 1% semelhantes, 95% piores
» O melhor teve um delta de 4%, a média foi 23%, o pior foi 134%
Alienware 15 R3 análise de áudio
(+) | os alto-falantes podem tocar relativamente alto (###valor### dB)
Graves 100 - 315Hz
(-) | quase nenhum baixo - em média 19.1% menor que a mediana
(±) | a linearidade dos graves é média (10.4% delta para a frequência anterior)
Médios 400 - 2.000 Hz
(±) | médios mais altos - em média 6.7% maior que a mediana
(±) | a linearidade dos médios é média (7.5% delta para frequência anterior)
Altos 2 - 16 kHz
(+) | agudos equilibrados - apenas 3.6% longe da mediana
(+) | os máximos são lineares (5.2% delta da frequência anterior)
Geral 100 - 16.000 Hz
(±) | a linearidade do som geral é média (21.6% diferença em relação à mediana)
Comparado com a mesma classe
» 77% de todos os dispositivos testados nesta classe foram melhores, 5% semelhantes, 18% piores
» O melhor teve um delta de 6%, a média foi 18%, o pior foi 132%
Comparado com todos os dispositivos testados
» 61% de todos os dispositivos testados foram melhores, 7% semelhantes, 32% piores
» O melhor teve um delta de 4%, a média foi 23%, o pior foi 134%
Acer Predator 15 G9-593-751X análise de áudio
(+) | os alto-falantes podem tocar relativamente alto (###valor### dB)
Graves 100 - 315Hz
(±) | graves reduzidos - em média 14.1% menor que a mediana
(±) | a linearidade dos graves é média (10.6% delta para a frequência anterior)
Médios 400 - 2.000 Hz
(+) | médios equilibrados - apenas 3.2% longe da mediana
(+) | médios são lineares (4.9% delta para frequência anterior)
Altos 2 - 16 kHz
(+) | agudos equilibrados - apenas 3.7% longe da mediana
(+) | os máximos são lineares (5.3% delta da frequência anterior)
Geral 100 - 16.000 Hz
(+) | o som geral é linear (14.1% diferença em relação à mediana)
Comparado com a mesma classe
» 24% de todos os dispositivos testados nesta classe foram melhores, 8% semelhantes, 68% piores
» O melhor teve um delta de 6%, a média foi 18%, o pior foi 132%
Comparado com todos os dispositivos testados
» 17% de todos os dispositivos testados foram melhores, 4% semelhantes, 79% piores
» O melhor teve um delta de 4%, a média foi 23%, o pior foi 134%
Asus Zephyrus GX501VS análise de áudio
(-) | alto-falantes não muito altos (###valor### dB)
Graves 100 - 315Hz
(-) | quase nenhum baixo - em média 18.8% menor que a mediana
(±) | a linearidade dos graves é média (11.3% delta para a frequência anterior)
Médios 400 - 2.000 Hz
(+) | médios equilibrados - apenas 1.2% longe da mediana
(+) | médios são lineares (6.3% delta para frequência anterior)
Altos 2 - 16 kHz
(±) | máximos mais altos - em média 6.5% maior que a mediana
(+) | os máximos são lineares (6.3% delta da frequência anterior)
Geral 100 - 16.000 Hz
(±) | a linearidade do som geral é média (23.4% diferença em relação à mediana)
Comparado com a mesma classe
» 85% de todos os dispositivos testados nesta classe foram melhores, 5% semelhantes, 11% piores
» O melhor teve um delta de 6%, a média foi 18%, o pior foi 132%
Comparado com todos os dispositivos testados
» 70% de todos os dispositivos testados foram melhores, 6% semelhantes, 24% piores
» O melhor teve um delta de 4%, a média foi 23%, o pior foi 134%
| desligado | |
| Ocioso | |
| Carga |
|
Key:
min: | |
| MSI GE63VR 7RF Raider i7-7700HQ, GeForce GTX 1070 Mobile | Acer Predator 15 G9-593-751X i7-7700HQ, GeForce GTX 1070 Mobile | Alienware 15 R3 i7-7700HQ, GeForce GTX 1070 Mobile | Asus Zephyrus GX501VS i7-7700HQ, GeForce GTX 1070 Max-Q | |
|---|---|---|---|---|
| Power Consumption | -22% | -27% | -6% | |
| Idle Minimum * (Watt) | 11 | 18 -64% | 19 -73% | 19.1 -74% |
| Idle Average * (Watt) | 16 | 23 -44% | 23 -44% | 20.8 -30% |
| Idle Maximum * (Watt) | 21 | 30 -43% | 29 -38% | 21.8 -4% |
| Load Average * (Watt) | 92 | 89 3% | 85 8% | 73.7 20% |
| Witcher 3 ultra * (Watt) | 185 | 168 9% | 130.2 30% | |
| Load Maximum * (Watt) | 224 | 213 5% | 192 14% | 173.1 23% |
* ... menor é melhor
| MSI GE63VR 7RF Raider i7-7700HQ, GeForce GTX 1070 Mobile, 51 Wh | Acer Predator 15 G9-593-751X i7-7700HQ, GeForce GTX 1070 Mobile, 90 Wh | Alienware 15 R3 i7-7700HQ, GeForce GTX 1070 Mobile, 99 Wh | Asus Zephyrus GX501VS i7-7700HQ, GeForce GTX 1070 Max-Q, 50 Wh | |
|---|---|---|---|---|
| Duração da bateria | 101% | 64% | -14% | |
| Reader / Idle (h) | 5.4 | 8.4 56% | 6.4 19% | 3.8 -30% |
| WiFi v1.3 (h) | 3.4 | 5.5 62% | 4.4 29% | 2.5 -26% |
| Load (h) | 0.7 | 2 186% | 1.7 143% | 0.8 14% |
| H.264 (h) | 4.9 | 4.4 |
Pro
Contra
A MSI deu um passo longe da tendência geral do IPS e ousou ser imperfeita. Se você não requer muito espaço livre em seu portátil e pode evitar olhar para a tela desde embaixo, você apreciará este portátil por seus tempos de resposta rápidos, tela com cores precisas, cobertura 100% sRGB e 120 Hz - embora isso teria feito mais sentido se a MSI não tivesse deixado de lado o G-Sync em favor do baixo consumo de energia.
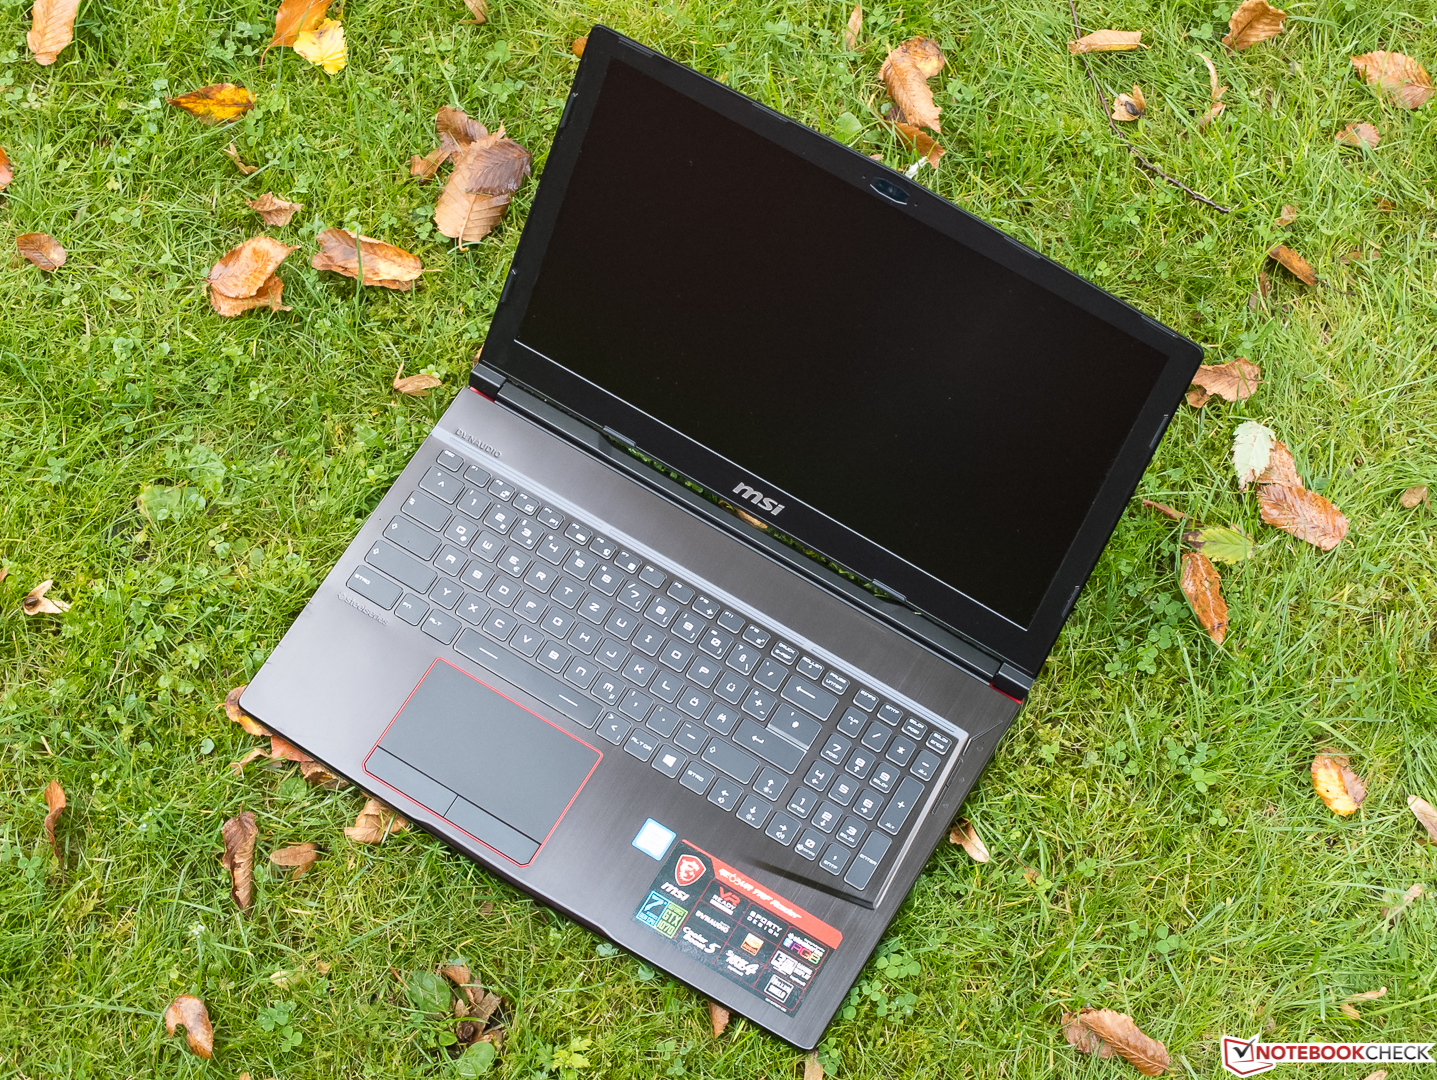
O bem-feito MSI GE63VR Raider-075 nos deu uma ótima impressão durante os testes - apenas a decisão de renunciar ao G-Sync é bastante surpreendente.
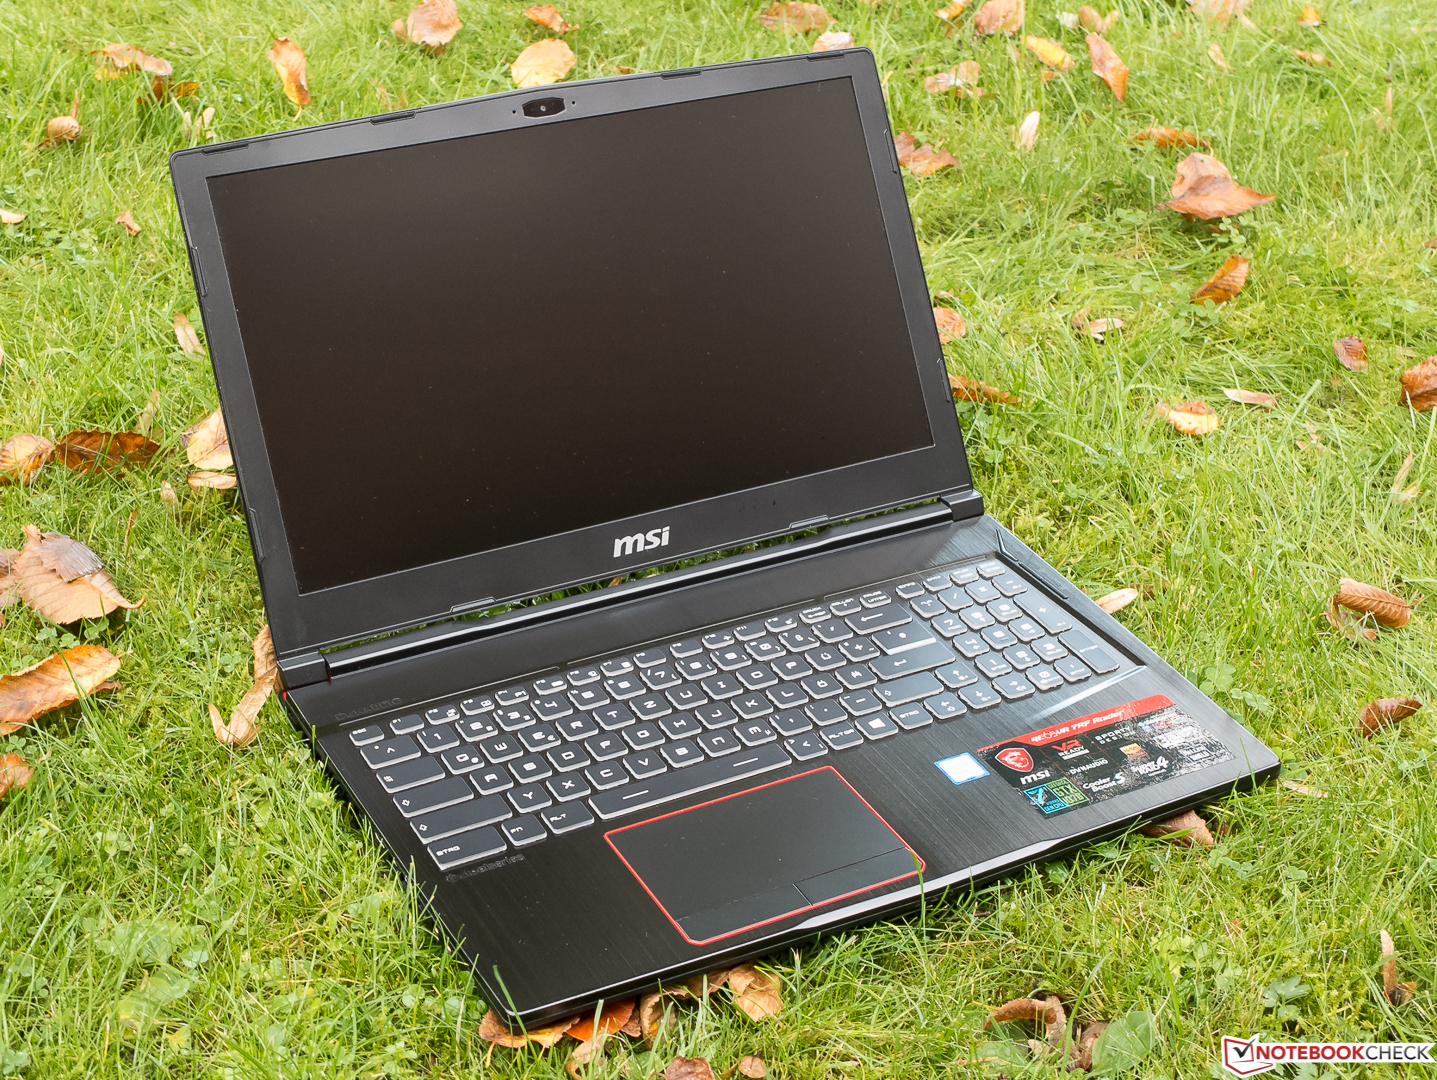
O MSI GE63VR Raider-075 está disponível a partir de $1700 e é um portátil de jogos compacto, leve, bem construído e de alto desempenho com uma tela obstinada cujas poucas desvantagens dificilmente incomodarão jogadores ambiciosos. Podemos recomendar claramente este dispositivo.
MSI GE63VR 7RF Raider
- 10/28/2017 v6 (old)
Sven Kloevekorn