Breve Análise do Portátil MSI GS73VR 7RF (7700HQ, GTX 1060, 4K)
| SD Card Reader | |
| average JPG Copy Test (av. of 3 runs) | |
| Aorus X7 v6 | |
| Gigabyte Aero 15 | |
| Asus Strix GL702VSK | |
| MSI GS73VR 7RF | |
| MSI GS73VR 6RF | |
| Acer Aspire V17 Nitro BE VN7-793G-52XN | |
| maximum AS SSD Seq Read Test (1GB) | |
| Gigabyte Aero 15 | |
| Aorus X7 v6 | |
| Asus Strix GL702VSK | |
| MSI GS73VR 6RF | |
| MSI GS73VR 7RF | |
| Acer Aspire V17 Nitro BE VN7-793G-52XN | |
| Networking | |
| iperf3 transmit AX12 | |
| Acer Aspire V17 Nitro BE VN7-793G-52XN | |
| MSI GS73VR 7RF | |
| Aorus X7 v6 | |
| Asus Strix GL702VSK | |
| Gigabyte Aero 15 | |
| iperf3 receive AX12 | |
| Gigabyte Aero 15 | |
| Asus Strix GL702VSK | |
| MSI GS73VR 7RF | |
| Acer Aspire V17 Nitro BE VN7-793G-52XN | |
| Aorus X7 v6 | |
| |||||||||||||||||||||||||
iluminação: 86 %
iluminação com acumulador: 371.1 cd/m²
Contraste: 884:1 (Preto: 0.42 cd/m²)
ΔE ColorChecker Calman: 4.5 | ∀{0.5-29.43 Ø4.71}
ΔE Greyscale Calman: 3.1 | ∀{0.09-98 Ø4.96}
97% sRGB (Argyll 1.6.3 3D)
61% AdobeRGB 1998 (Argyll 1.6.3 3D)
66.4% AdobeRGB 1998 (Argyll 3D)
96.8% sRGB (Argyll 3D)
64.2% Display P3 (Argyll 3D)
Gamma: 2.17
CCT: 7120 K
| MSI GS73VR 7RF AU Optronics AUO109B, IPS, 17.3", 3840x2160 | MSI GS73VR 6RF TN LED, 17.3", 1920x1080 | Asus Strix GL702VSK AU Optronics AUO119D, IPS, 17.3", 1920x1080 | Acer Aspire V17 Nitro BE VN7-793G-52XN AUO B173HAN01.0, a-Si TFT-LCD, WLED, 17.3", 1920x1080 | Aorus X7 v6 B173QTN01.0 (AUO1096), TN LED, 17.3", 2560x1440 | Gigabyte Aero 15 N156HCA-EA1 (CMN15D7), IPS, 15.6", 1920x1080 | |
|---|---|---|---|---|---|---|
| Display | 23% | -7% | -3% | -9% | -1% | |
| Display P3 Coverage (%) | 64.2 | 90 40% | 61.3 -5% | 64 0% | 60.9 -5% | 65.2 2% |
| sRGB Coverage (%) | 96.8 | 99.9 3% | 86.7 -10% | 90.2 -7% | 84.2 -13% | 92.5 -4% |
| AdobeRGB 1998 Coverage (%) | 66.4 | 83.6 26% | 62.3 -6% | 65.4 -2% | 61.2 -8% | 66.5 0% |
| Response Times | 45% | 22% | 3% | 40% | -18% | |
| Response Time Grey 50% / Grey 80% * (ms) | 38 ? | 28 ? 26% | 21.2 ? 44% | 36 ? 5% | 31 ? 18% | 42.8 ? -13% |
| Response Time Black / White * (ms) | 26 ? | 9.6 ? 63% | 26 ? -0% | 26 ? -0% | 10 ? 62% | 32 ? -23% |
| PWM Frequency (Hz) | 26000 ? | |||||
| Screen | 15% | 9% | -1% | -31% | -11% | |
| Brightness middle (cd/m²) | 371.1 | 337.2 -9% | 316.5 -15% | 346 -7% | 343 -8% | 320 -14% |
| Brightness (cd/m²) | 343 | 315 -8% | 306 -11% | 307 -10% | 312 -9% | 316 -8% |
| Brightness Distribution (%) | 86 | 86 0% | 93 8% | 84 -2% | 80 -7% | 90 5% |
| Black Level * (cd/m²) | 0.42 | 0.308 27% | 0.21 50% | 0.26 38% | 0.5 -19% | 0.36 14% |
| Contrast (:1) | 884 | 1095 24% | 1507 70% | 1331 51% | 686 -22% | 889 1% |
| Colorchecker dE 2000 * | 4.5 | 2.96 34% | 4.2 7% | 4.32 4% | 7.33 -63% | 4.62 -3% |
| Colorchecker dE 2000 max. * | 9.7 | 5.45 44% | 7.1 27% | 8.05 17% | 10.79 -11% | 9.75 -1% |
| Greyscale dE 2000 * | 3.1 | 2.57 17% | 3.9 -26% | 5.76 -86% | 7.6 -145% | 6 -94% |
| Gamma | 2.17 101% | 2.25 98% | 2.19 100% | 2.35 94% | 2.19 100% | 2.46 89% |
| CCT | 7120 91% | 7114 91% | 7242 90% | 6447 101% | 9024 72% | 6761 96% |
| Color Space (Percent of AdobeRGB 1998) (%) | 61 | 74.3 22% | 56 -8% | 59 -3% | 55 -10% | 60 -2% |
| Color Space (Percent of sRGB) (%) | 97 | 100 3% | 86 -11% | 90 -7% | 84 -13% | 92 -5% |
| Média Total (Programa/Configurações) | 28% /
21% | 8% /
8% | -0% /
-1% | 0% /
-17% | -10% /
-10% |
* ... menor é melhor
Exibir tempos de resposta
| ↔ Tempo de resposta preto para branco | ||
|---|---|---|
| 26 ms ... ascensão ↗ e queda ↘ combinadas | ↗ 16 ms ascensão | 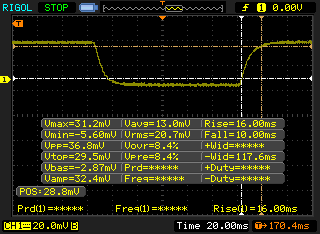 |
| ↘ 10 ms queda | ||
| A tela mostra taxas de resposta relativamente lentas em nossos testes e pode ser muito lenta para os jogadores. Em comparação, todos os dispositivos testados variam de 0.1 (mínimo) a 240 (máximo) ms. » 63 % de todos os dispositivos são melhores. Isso significa que o tempo de resposta medido é pior que a média de todos os dispositivos testados (19.8 ms). | ||
| ↔ Tempo de resposta 50% cinza a 80% cinza | ||
| 38 ms ... ascensão ↗ e queda ↘ combinadas | ↗ 19.6 ms ascensão | 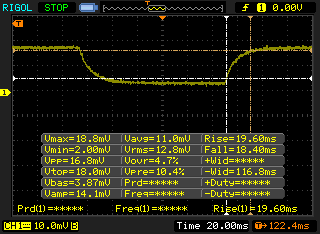 |
| ↘ 18.4 ms queda | ||
| A tela mostra taxas de resposta lentas em nossos testes e será insatisfatória para os jogadores. Em comparação, todos os dispositivos testados variam de 0.165 (mínimo) a 636 (máximo) ms. » 55 % de todos os dispositivos são melhores. Isso significa que o tempo de resposta medido é pior que a média de todos os dispositivos testados (31 ms). | ||
Cintilação da tela / PWM (modulação por largura de pulso)
| Tela tremeluzindo / PWM não detectado | 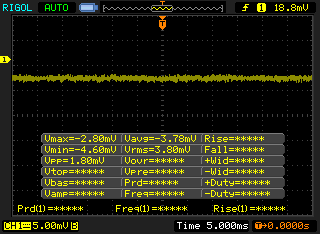 | ||
[pwm_comparison] Em comparação: 52 % de todos os dispositivos testados não usam PWM para escurecer a tela. Se PWM foi detectado, uma média de 7754 (mínimo: 5 - máximo: 343500) Hz foi medida. | |||
| Cinebench R10 | |
| Rendering Multiple CPUs 32Bit | |
| Asus Strix GL702VSK | |
| MSI GS73VR 6RF | |
| Acer Aspire V17 Nitro BE VN7-793G-52XN | |
| Rendering Single 32Bit | |
| Asus Strix GL702VSK | |
| MSI GS73VR 6RF | |
| Acer Aspire V17 Nitro BE VN7-793G-52XN | |
| wPrime 2.10 - 1024m | |
| MSI GS73VR 7RF | |
| MSI GS73VR 6RF | |
| Asus Strix GL702VSK | |
* ... menor é melhor
| PCMark 8 | |
| Home Score Accelerated v2 | |
| Asus Strix GL702VSK | |
| Gigabyte Aero 15 | |
| MSI GS73VR 6RF | |
| Acer Aspire V17 Nitro BE VN7-793G-52XN | |
| MSI GS73VR 7RF | |
| Work Score Accelerated v2 | |
| Gigabyte Aero 15 | |
| Acer Aspire V17 Nitro BE VN7-793G-52XN | |
| Asus Strix GL702VSK | |
| MSI GS73VR 6RF | |
| MSI GS73VR 7RF | |
| Creative Score Accelerated v2 | |
| MSI GS73VR 7RF | |
| MSI GS73VR 6RF | |
| Acer Aspire V17 Nitro BE VN7-793G-52XN | |
| PCMark 8 Home Score Accelerated v2 | 3581 pontos | |
| PCMark 8 Creative Score Accelerated v2 | 5225 pontos | |
| PCMark 8 Work Score Accelerated v2 | 4259 pontos | |
Ajuda | ||
| MSI GS73VR 7RF Samsung SM961 MZVKW512HMJP m.2 PCI-e | MSI GS73VR 6RF SanDisk SD8SN8U1T001122 | Asus Strix GL702VSK HGST Travelstar 7K1000 HTS721010A9E630 | Acer Aspire V17 Nitro BE VN7-793G-52XN SK Hynix HFS256G39TND-N210A | Aorus X7 v6 Toshiba NVMe THNSN5512GPU7 | Gigabyte Aero 15 Lite-On CX2-8B512-Q11 | |
|---|---|---|---|---|---|---|
| CrystalDiskMark 3.0 | -63% | -97% | -48% | 28% | 19% | |
| Read Seq (MB/s) | 2459 | 334.3 -86% | 78.3 -97% | 493.1 -80% | 1499 -39% | 1769 -28% |
| Write Seq (MB/s) | 1609 | 319 -80% | 75.5 -95% | 270.2 -83% | 1411 -12% | 1133 -30% |
| Read 512 (MB/s) | 445.2 | 242.3 -46% | 34 -92% | 325.8 -27% | 966 117% | 891 100% |
| Write 512 (MB/s) | 748 | 254.4 -66% | 43.9 -94% | 267.8 -64% | 1103 47% | 1069 43% |
| Read 4k (MB/s) | 48.5 | 20.3 -58% | 0.5 -99% | 28.4 -41% | 44.33 -9% | 44.7 -8% |
| Write 4k (MB/s) | 131.5 | 42.51 -68% | 1.1 -99% | 76.2 -42% | 155.5 18% | 123.3 -6% |
| Read 4k QD32 (MB/s) | 454.1 | 251.6 -45% | 1.1 -100% | 344.6 -24% | 696 53% | 645 42% |
| Write 4k QD32 (MB/s) | 355.3 | 167.1 -53% | 1.1 -100% | 267 -25% | 531 49% | 490.5 38% |

| 3DMark 11 | |
| 1280x720 Performance GPU | |
| Aorus X7 v6 | |
| Asus Strix GL702VSK | |
| MSI GS73VR 6RF | |
| Acer Aspire V17 Nitro BE VN7-793G-52XN | |
| MSI GS73VR 7RF | |
| Gigabyte Aero 15 | |
| 1280x720 Performance Combined | |
| Aorus X7 v6 | |
| Gigabyte Aero 15 | |
| MSI GS73VR 7RF | |
| MSI GS73VR 6RF | |
| Asus Strix GL702VSK | |
| Acer Aspire V17 Nitro BE VN7-793G-52XN | |
| 3DMark | |
| 1280x720 Cloud Gate Standard Graphics | |
| Aorus X7 v6 | |
| Gigabyte Aero 15 | |
| Asus Strix GL702VSK | |
| MSI GS73VR 6RF | |
| Acer Aspire V17 Nitro BE VN7-793G-52XN | |
| MSI GS73VR 7RF | |
| 1920x1080 Fire Strike Graphics | |
| Asus Strix GL702VSK | |
| Aorus X7 v6 | |
| MSI GS73VR 6RF | |
| MSI GS73VR 7RF | |
| Gigabyte Aero 15 | |
| Acer Aspire V17 Nitro BE VN7-793G-52XN | |
| 1920x1080 Ice Storm Extreme Graphics | |
| Asus Strix GL702VSK | |
| MSI GS73VR 6RF | |
| Acer Aspire V17 Nitro BE VN7-793G-52XN | |
| MSI GS73VR 7RF | |
| 3DMark 11 Performance | 12579 pontos | |
| 3DMark Ice Storm Standard Score | 28688 pontos | |
| 3DMark Cloud Gate Standard Score | 20795 pontos | |
| 3DMark Fire Strike Score | 9675 pontos | |
| 3DMark Fire Strike Extreme Score | 5100 pontos | |
Ajuda | ||
| BioShock Infinite - 1920x1080 Ultra Preset, DX11 (DDOF) (classificar por valor) | |
| MSI GS73VR 7RF | |
| MSI GS73VR 6RF | |
| Asus Strix GL702VSK | |
| Acer Aspire V17 Nitro BE VN7-793G-52XN | |
| Metro: Last Light - 1920x1080 Very High (DX11) AF:16x (classificar por valor) | |
| MSI GS73VR 7RF | |
| MSI GS73VR 6RF | |
| Asus Strix GL702VSK | |
| Thief - 1920x1080 Very High Preset AA:FXAA & High SS AF:8x (classificar por valor) | |
| MSI GS73VR 7RF | |
| MSI GS73VR 6RF | |
| Asus Strix GL702VSK | |
| The Witcher 3 - 1920x1080 Ultra Graphics & Postprocessing (HBAO+) (classificar por valor) | |
| MSI GS73VR 7RF | |
| Asus Strix GL702VSK | |
| Acer Aspire V17 Nitro BE VN7-793G-52XN | |
| Gigabyte Aero 15 | |
| Fallout 4 - 1920x1080 Ultra Preset AA:T AF:16x (classificar por valor) | |
| MSI GS73VR 7RF | |
| MSI GS73VR 6RF | |
| Asus Strix GL702VSK | |
| Rise of the Tomb Raider | |
| 1920x1080 Very High Preset AA:FX AF:16x (classificar por valor) | |
| MSI GS73VR 7RF | |
| MSI GS73VR 6RF | |
| Asus Strix GL702VSK | |
| Acer Aspire V17 Nitro BE VN7-793G-52XN | |
| Aorus X7 v6 | |
| 3840x2160 High Preset AA:FX AF:4x (classificar por valor) | |
| MSI GS73VR 7RF | |
| Hitman 2016 - 1920x1080 Ultra / On AA:SM AF:16x (classificar por valor) | |
| MSI GS73VR 7RF | |
| Ashes of the Singularity | |
| 1920x1080 high (classificar por valor) | |
| MSI GS73VR 7RF | |
| Asus Strix GL702VSK | |
| 3840x2160 crazy (classificar por valor) | |
| MSI GS73VR 7RF | |
| Doom | |
| 1920x1080 Ultra Preset AA:SM (classificar por valor) | |
| MSI GS73VR 7RF | |
| MSI GS73VR 6RF | |
| Asus Strix GL702VSK | |
| Aorus X7 v6 | |
| 3840x2160 High Preset AA:FX (classificar por valor) | |
| MSI GS73VR 7RF | |
| Deus Ex Mankind Divided - 1920x1080 Ultra Preset AA:2xMS AF:8x (classificar por valor) | |
| MSI GS73VR 7RF | |
| Aorus X7 v6 | |
| Mafia 3 - 1920x1080 High Preset (classificar por valor) | |
| MSI GS73VR 7RF | |
| Asus Strix GL702VSK | |
| Civilization 6 | |
| 1920x1080 Ultra Preset AA:4xMS (classificar por valor) | |
| MSI GS73VR 7RF | |
| 3840x2160 High Preset (classificar por valor) | |
| MSI GS73VR 7RF | |
| baixo | média | alto | ultra | 4K | |
|---|---|---|---|---|---|
| BioShock Infinite (2013) | 134 | ||||
| Metro: Last Light (2013) | 76 | ||||
| Thief (2014) | 60 | ||||
| The Witcher 3 (2015) | 41 | ||||
| Fallout 4 (2015) | 71 | ||||
| Rise of the Tomb Raider (2016) | 51 | 16 | |||
| Hitman 2016 (2016) | 57 | ||||
| Ashes of the Singularity (2016) | 54 | 24 | |||
| Doom (2016) | 89 | 30 | |||
| Deus Ex Mankind Divided (2016) | 30 | ||||
| Mafia 3 (2016) | 47 | ||||
| Civilization 6 (2016) | 43 | 37 |
Barulho
| Ocioso |
| 30.8 / 30.8 / 30.9 dB |
| Carga |
| 42.2 / 48.6 dB |
 | ||
30 dB silencioso 40 dB(A) audível 50 dB(A) ruidosamente alto |
||
min: | ||
| MSI GS73VR 7RF GeForce GTX 1060 Mobile, i7-7700HQ, Samsung SM961 MZVKW512HMJP m.2 PCI-e | MSI GS73VR 6RF GeForce GTX 1060 Mobile, 6700HQ, SanDisk SD8SN8U1T001122 | Asus Strix GL702VSK GeForce GTX 1070 Mobile, i7-7700HQ, HGST Travelstar 7K1000 HTS721010A9E630 | Acer Aspire V17 Nitro BE VN7-793G-52XN GeForce GTX 1060 Mobile, i5-7300HQ, SK Hynix HFS256G39TND-N210A | Aorus X7 v6 GeForce GTX 1070 Mobile, 6820HK, Toshiba NVMe THNSN5512GPU7 | Gigabyte Aero 15 GeForce GTX 1060 Mobile, i7-7700HQ, Lite-On CX2-8B512-Q11 | |
|---|---|---|---|---|---|---|
| Noise | -5% | 1% | 4% | -12% | -3% | |
| desligado / ambiente * (dB) | 28.1 | 28.4 -1% | 28.6 -2% | 30.7 -9% | 30 -7% | 31 -10% |
| Idle Minimum * (dB) | 30.8 | 31.9 -4% | 30.6 1% | 30.7 -0% | 33 -7% | 32 -4% |
| Idle Average * (dB) | 30.8 | 32 -4% | 30.6 1% | 30.7 -0% | 35 -14% | 33 -7% |
| Idle Maximum * (dB) | 30.9 | 34 -10% | 30.6 1% | 31.4 -2% | 40 -29% | 34 -10% |
| Load Average * (dB) | 42.2 | 47 -11% | 39.8 6% | 32.1 24% | 43 -2% | 39 8% |
| Witcher 3 ultra * (dB) | 44.4 | 42.8 4% | 43 3% | |||
| Load Maximum * (dB) | 48.6 | 49.4 -2% | 48 1% | 42.8 12% | 54 -11% | 50 -3% |
* ... menor é melhor
(-) A temperatura máxima no lado superior é 50.2 °C / 122 F, em comparação com a média de 40.4 °C / 105 F , variando de 21.2 a 68.8 °C para a classe Gaming.
(-) A parte inferior aquece até um máximo de 55.6 °C / 132 F, em comparação com a média de 43.2 °C / 110 F
(+) Em uso inativo, a temperatura média para o lado superior é 25.2 °C / 77 F, em comparação com a média do dispositivo de 33.9 °C / ### class_avg_f### F.
(+) Jogando The Witcher 3, a temperatura média para o lado superior é 28.2 °C / 83 F, em comparação com a média do dispositivo de 33.9 °C / ## #class_avg_f### F.
(+) Os apoios para as mãos e o touchpad são mais frios que a temperatura da pele, com um máximo de 30.8 °C / 87.4 F e, portanto, são frios ao toque.
(±) A temperatura média da área do apoio para as mãos de dispositivos semelhantes foi 28.8 °C / 83.8 F (-2 °C / -3.6 F).
MSI GS73VR 7RF análise de áudio
(+) | os alto-falantes podem tocar relativamente alto (###valor### dB)
Graves 100 - 315Hz
(-) | quase nenhum baixo - em média 18.1% menor que a mediana
(±) | a linearidade dos graves é média (13.2% delta para a frequência anterior)
Médios 400 - 2.000 Hz
(±) | médios mais altos - em média 5.2% maior que a mediana
(±) | a linearidade dos médios é média (8.3% delta para frequência anterior)
Altos 2 - 16 kHz
(±) | máximos mais altos - em média 7.9% maior que a mediana
(±) | a linearidade dos máximos é média (8.9% delta para frequência anterior)
Geral 100 - 16.000 Hz
(±) | a linearidade do som geral é média (26.2% diferença em relação à mediana)
Comparado com a mesma classe
» 92% de todos os dispositivos testados nesta classe foram melhores, 1% semelhantes, 6% piores
» O melhor teve um delta de 6%, a média foi 18%, o pior foi 132%
Comparado com todos os dispositivos testados
» 81% de todos os dispositivos testados foram melhores, 4% semelhantes, 15% piores
» O melhor teve um delta de 4%, a média foi 23%, o pior foi 134%
Asus Strix GL702VSK análise de áudio
(±) | o volume do alto-falante é médio, mas bom (###valor### dB)
Graves 100 - 315Hz
(±) | graves reduzidos - em média 8.8% menor que a mediana
(±) | a linearidade dos graves é média (14.3% delta para a frequência anterior)
Médios 400 - 2.000 Hz
(+) | médios equilibrados - apenas 1.5% longe da mediana
(+) | médios são lineares (5.9% delta para frequência anterior)
Altos 2 - 16 kHz
(±) | máximos mais altos - em média 8.2% maior que a mediana
(±) | a linearidade dos máximos é média (14.2% delta para frequência anterior)
Geral 100 - 16.000 Hz
(±) | a linearidade do som geral é média (22.3% diferença em relação à mediana)
Comparado com a mesma classe
» 80% de todos os dispositivos testados nesta classe foram melhores, 6% semelhantes, 14% piores
» O melhor teve um delta de 6%, a média foi 18%, o pior foi 132%
Comparado com todos os dispositivos testados
» 65% de todos os dispositivos testados foram melhores, 6% semelhantes, 29% piores
» O melhor teve um delta de 4%, a média foi 23%, o pior foi 134%
| desligado | |
| Ocioso | |
| Carga |
|
Key:
min: | |
| MSI GS73VR 7RF i7-7700HQ, GeForce GTX 1060 Mobile, Samsung SM961 MZVKW512HMJP m.2 PCI-e, IPS, 3840x2160, 17.3" | MSI GS73VR 6RF 6700HQ, GeForce GTX 1060 Mobile, SanDisk SD8SN8U1T001122, TN LED, 1920x1080, 17.3" | Asus Strix GL702VSK i7-7700HQ, GeForce GTX 1070 Mobile, HGST Travelstar 7K1000 HTS721010A9E630, IPS, 1920x1080, 17.3" | Acer Aspire V17 Nitro BE VN7-793G-52XN i5-7300HQ, GeForce GTX 1060 Mobile, SK Hynix HFS256G39TND-N210A, a-Si TFT-LCD, WLED, 1920x1080, 17.3" | Aorus X7 v6 6820HK, GeForce GTX 1070 Mobile, Toshiba NVMe THNSN5512GPU7, TN LED, 2560x1440, 17.3" | Gigabyte Aero 15 i7-7700HQ, GeForce GTX 1060 Mobile, Lite-On CX2-8B512-Q11, IPS, 1920x1080, 15.6" | |
|---|---|---|---|---|---|---|
| Power Consumption | -32% | -23% | 26% | -53% | 15% | |
| Idle Minimum * (Watt) | 14.2 | 22.6 -59% | 20.9 -47% | 7.8 45% | 29 -104% | 12 15% |
| Idle Average * (Watt) | 23.5 | 32.7 -39% | 22.9 3% | 13.3 43% | 31 -32% | 15 36% |
| Idle Maximum * (Watt) | 23.8 | 32.8 -38% | 23.1 3% | 16.6 30% | 38 -60% | 20 16% |
| Load Average * (Watt) | 90.9 | 114.7 -26% | 147.2 -62% | 73 20% | 111 -22% | 82 10% |
| Witcher 3 ultra * (Watt) | 116 | 118 -2% | 111 4% | |||
| Load Maximum * (Watt) | 171.6 | 167.9 2% | 188.1 -10% | 140 18% | 253 -47% | 161 6% |
* ... menor é melhor
| MSI GS73VR 7RF i7-7700HQ, GeForce GTX 1060 Mobile, 65 Wh | MSI GS73VR 6RF 6700HQ, GeForce GTX 1060 Mobile, 65 Wh | Asus Strix GL702VSK i7-7700HQ, GeForce GTX 1070 Mobile, 76 Wh | Acer Aspire V17 Nitro BE VN7-793G-52XN i5-7300HQ, GeForce GTX 1060 Mobile, 69 Wh | Aorus X7 v6 6820HK, GeForce GTX 1070 Mobile, 94 Wh | Gigabyte Aero 15 i7-7700HQ, GeForce GTX 1060 Mobile, 94.24 Wh | |
|---|---|---|---|---|---|---|
| Duração da bateria | 24% | 28% | 127% | 11% | 127% | |
| Reader / Idle (h) | 5 | 5.9 18% | 5.1 2% | 10.3 106% | 10.6 112% | |
| WiFi v1.3 (h) | 2.7 | 3.6 33% | 3.4 26% | 6.2 130% | 3 11% | 7 159% |
| Load (h) | 0.9 | 1.1 22% | 1.4 56% | 2.2 144% | 1.9 111% |
Pro
Contra
O MSI GS73VR 7RF é menos uma atualização e mais um refinamento. Onde o 6RF foi uma revisão da linha fina e leve de 17,3 polegadas da MSI, o 7RF é a conclusão dessa ideia. Como tal, melhora os aspectos positivos do seu antecessor, mas também mantém os contras. Nós ainda celebramos o excelente teclado, o chassi premium e o excelente desempenho dos jogos. No entanto, a capacidade de atualização difícil, as irritantes ventoinhas e o posicionamento apertado das portas continuam a ser desvantagens. Adicione esse comportamento consistentemente errático durante nosso tempo de análise, e ficamos com uma sensação misturada sobre o 7RF.
A tela dá uma impressão confusa. As cores e a qualidade da imagem são excelentes, mas a resolução 4K não é necessária. Embora seja uma ótima opção, equivale em grande parte a um truque de festa. Os componentes internos são mais adequados para a jogabilidade em Full HD e a alta resolução cria mais problemas do que resolve. Criadores de conteúdo e amantes de filmes provavelmente encontrarão grande uso do painel UHD, mas a maioria dos outros usuários provavelmente nunca notará a diferença. A opção do painel Full HD é a escolha que recomendamos para os gamers, pois é menos exigente do sistema, aumenta a duração da bateria e reduz o custo.
O GS73VR 7RF é um portátil competente que faz muitas coisas muito bem. Oferece excelente desempenho em um pacote muito fino. No entanto, o mercado de portáteis finos e leves explodiu nos últimos anos. Outras empresas também oferecem portáteis poderosos e portáveis, ou seja, a Razer, Gigabyte e Asus. Embora ainda não haja um portátil de jogos compacto perfeito, não há escassez de opções fantásticas para escolher.
Enquanto o GS73VR 7RF oferece algumas melhorias tangíveis em relação ao seu antecessor, elas são marginais na melhor das hipóteses. O GS73VR 6RF é quase igual de bom e pode ser encontrado novo ou usado para um preço muito mais econômico. Outras opções, como o Aero 15 da Gigabyte, oferecem desempenho semelhante pelo mesmo ou menos preço, enquanto melhoram aspectos que podem ser mais importantes para os gamers.
O MSI GS73VR 7RF é uma boa máquina, mas é retido por muitos problemas pequenos e alguns importantes. Embora este seja um bom portátil em geral, existem melhores opções disponíveis.
MSI GS73VR 7RF
- 06/13/2017 v6 (old)
Sam Medley
Price comparison
