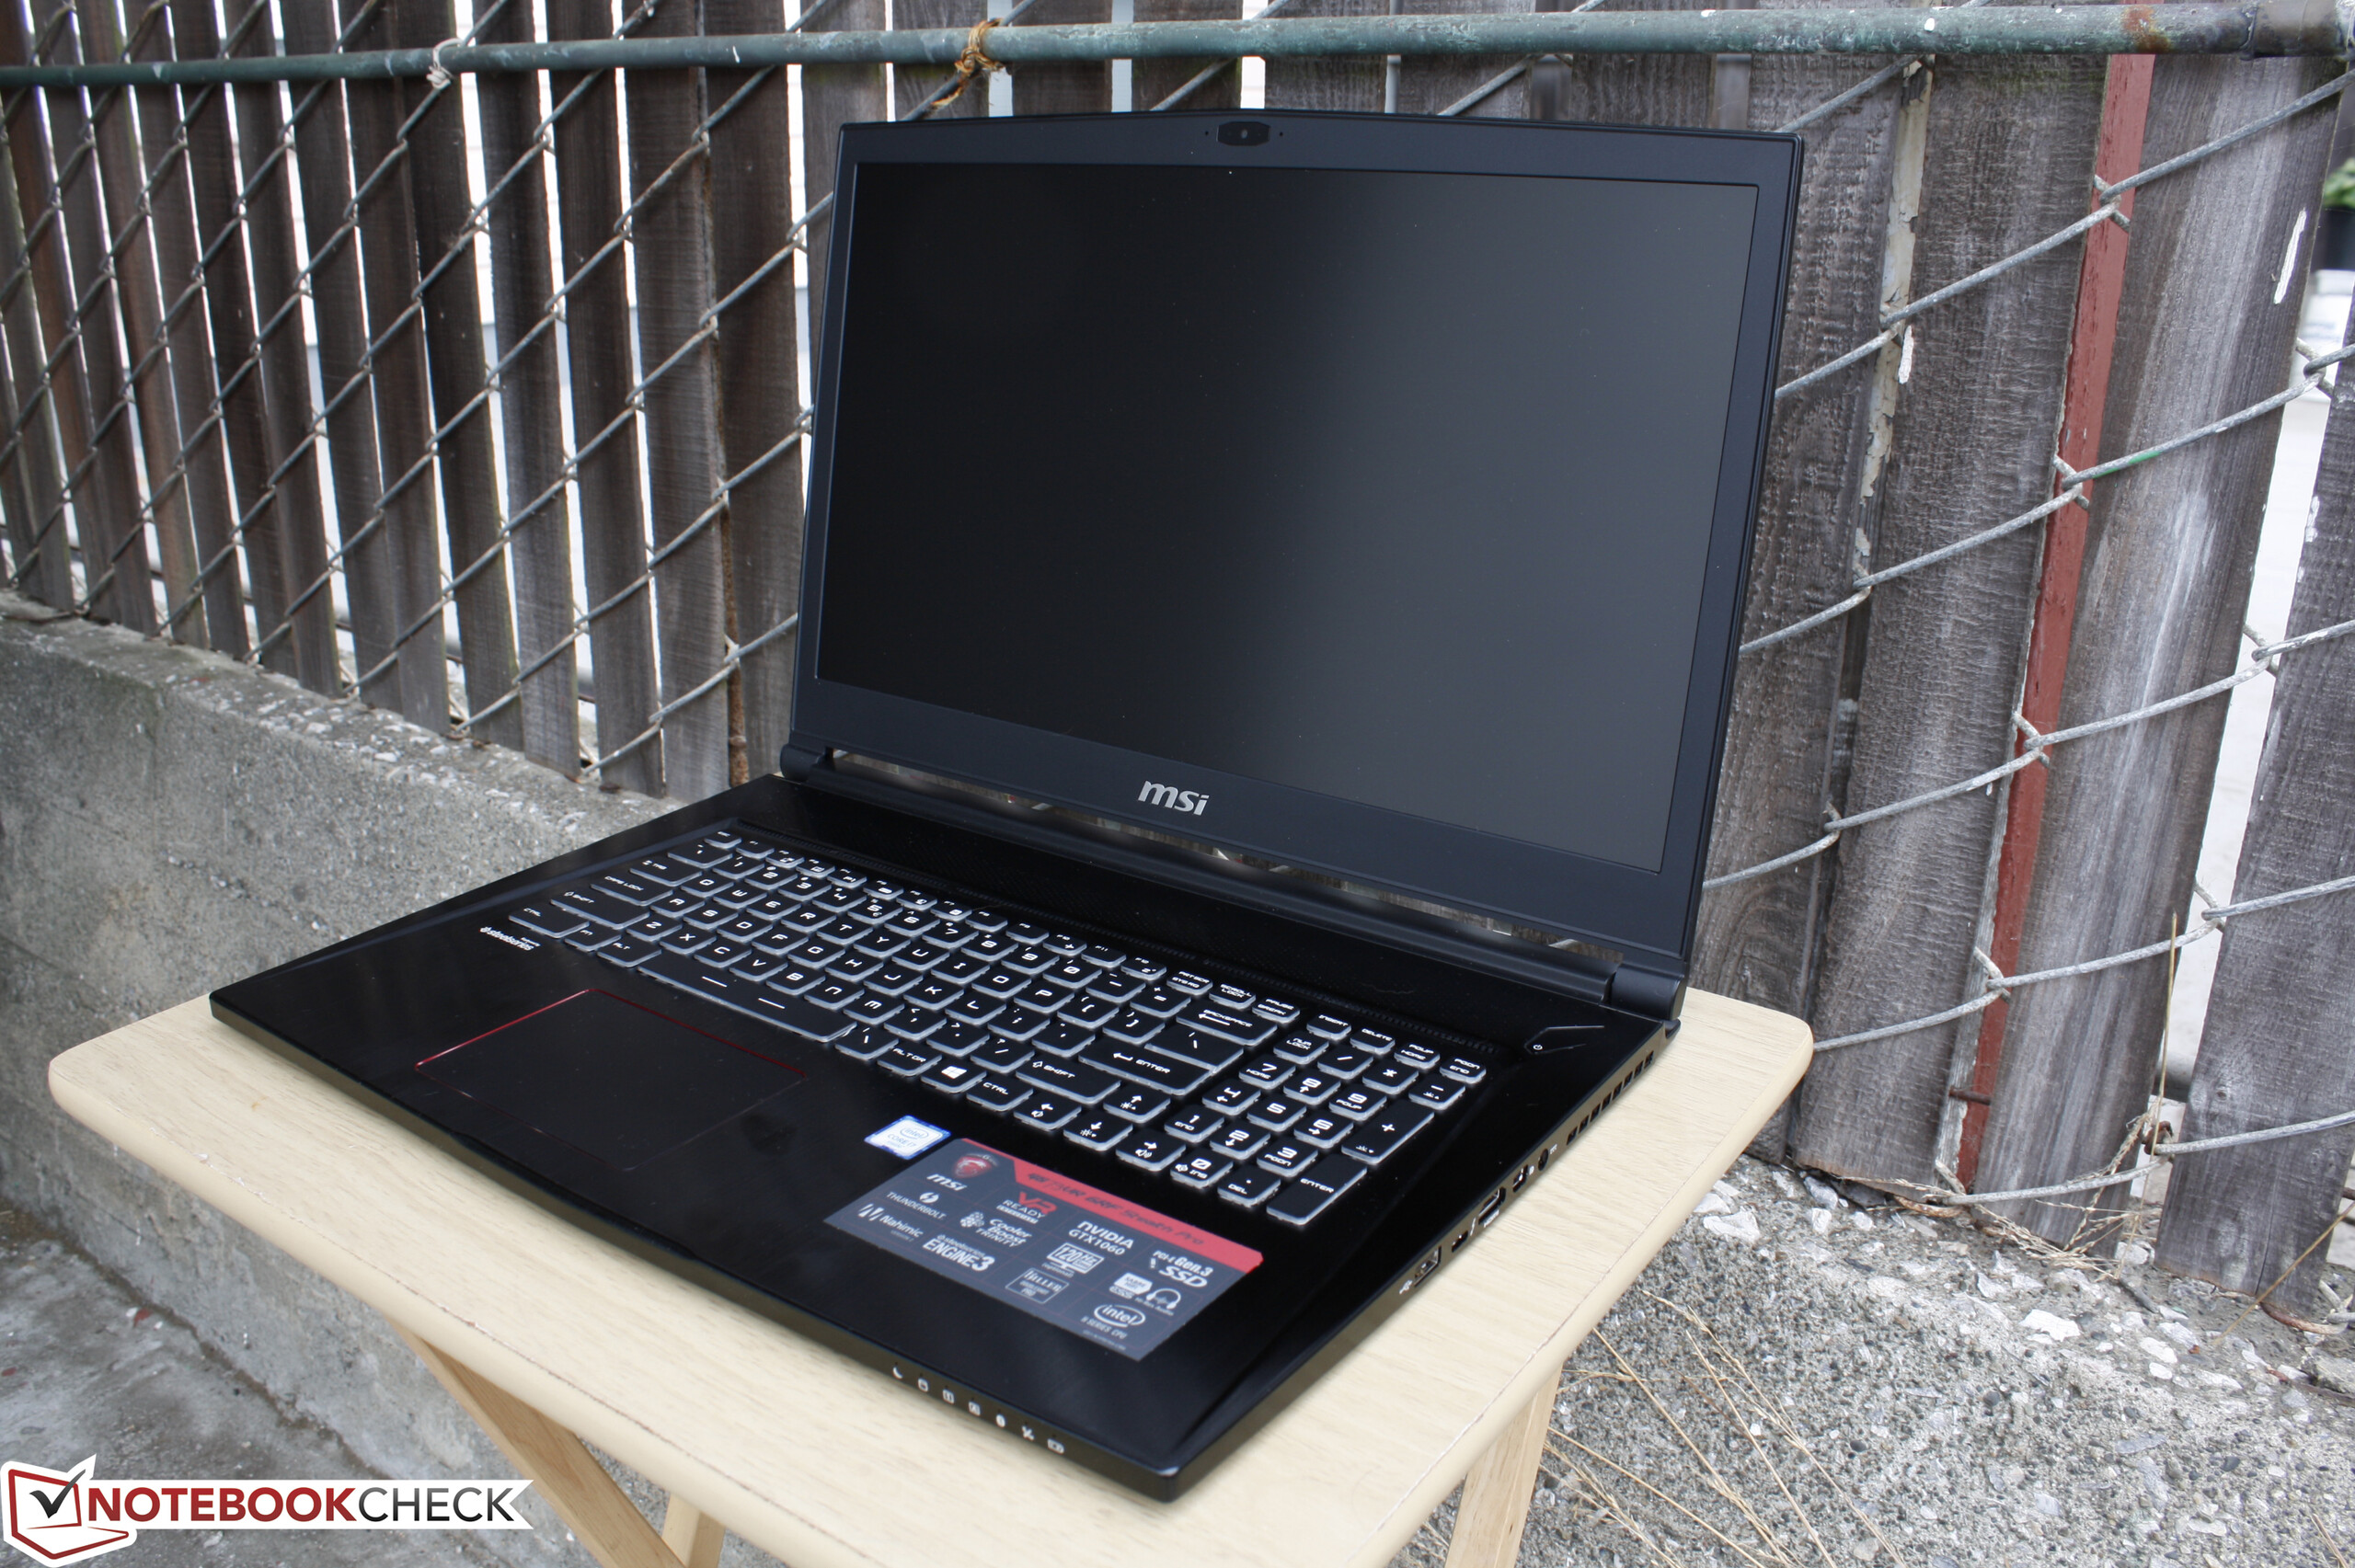
Breve análise do Portátil MSI GS73VR 6RF


| SD Card Reader | |
| average JPG Copy Test (av. of 3 runs) | |
| MSI GT72VR 6RE-015US | |
| Dell XPS 13 2016 9350 (FHD, i7-6560U) | |
| Alienware 17 R3 (A17-9935) | |
| MSI GS73VR 6RF | |
| maximum AS SSD Seq Read Test (1GB) | |
| Dell XPS 13 2016 9350 (FHD, i7-6560U) | |
| MSI GT72VR 6RE-015US | |
| Alienware 17 R3 (A17-9935) | |
| MSI GS73VR 6RF | |
| Networking | |
| iperf Server (receive) TCP 1 m | |
| Dell XPS 13 2016 9350 (FHD, i7-6560U) | |
| MSI GS73VR 6RF | |
| iperf Client (transmit) TCP 1 m | |
| MSI GS73VR 6RF | |
| Dell XPS 13 2016 9350 (FHD, i7-6560U) | |
| |||||||||||||||||||||||||
iluminação: 86 %
iluminação com acumulador: 337.2 cd/m²
Contraste: 1095:1 (Preto: 0.308 cd/m²)
ΔE ColorChecker Calman: 2.96 | ∀{0.5-29.43 Ø4.71}
ΔE Greyscale Calman: 2.57 | ∀{0.09-98 Ø4.96}
100% sRGB (Argyll 1.6.3 3D)
74.3% AdobeRGB 1998 (Argyll 1.6.3 3D)
83.6% AdobeRGB 1998 (Argyll 3D)
99.9% sRGB (Argyll 3D)
90% Display P3 (Argyll 3D)
Gamma: 2.25
CCT: 7114 K
| MSI GS73VR 6RF TN LED, 17.3", 1920x1080 | Aorus X7 Pro v5 LG Philips LP173WF4-SPD1 (LGD046C), IPS, 17.3", 1920x1080 | MSI GS70-6QE16H21 Chi Mei N173HGE-E11 (CMN1735), TN LED, 17.3", 1920x1080 | Asus G752VS-XB78K LG Philips LP173WF4-SPF3 (LGD04E8), IPS, 17.3", 1920x1080 | Alienware 17 R3 (A17-9935) CV69H_173WF4 (LGD0459), IPS, 17.3", 1920x1080 | |
|---|---|---|---|---|---|
| Display | -24% | -16% | -22% | -23% | |
| Display P3 Coverage (%) | 90 | 66 -27% | 67 -26% | 66.9 -26% | 66.9 -26% |
| sRGB Coverage (%) | 99.9 | 83.4 -17% | 97.3 -3% | 85.2 -15% | 83.9 -16% |
| AdobeRGB 1998 Coverage (%) | 83.6 | 61 -27% | 67.6 -19% | 62.3 -25% | 61.4 -27% |
| Response Times | -77% | -83% | -79% | ||
| Response Time Grey 50% / Grey 80% * (ms) | 28 ? | 35 ? -25% | 38 ? -36% | 33 ? -18% | |
| Response Time Black / White * (ms) | 9.6 ? | 22 ? -129% | 22 ? -129% | 23 ? -140% | |
| PWM Frequency (Hz) | |||||
| Screen | -19% | -12% | -13% | -29% | |
| Brightness middle (cd/m²) | 337.2 | 271 -20% | 172 -49% | 328 -3% | 360 7% |
| Brightness (cd/m²) | 315 | 257 -18% | 161 -49% | 317 1% | 336 7% |
| Brightness Distribution (%) | 86 | 91 6% | 85 -1% | 88 2% | 90 5% |
| Black Level * (cd/m²) | 0.308 | 0.23 25% | 0.26 16% | 0.3 3% | 0.44 -43% |
| Contrast (:1) | 1095 | 1178 8% | 662 -40% | 1093 0% | 818 -25% |
| Colorchecker dE 2000 * | 2.96 | 4.14 -40% | 2.06 30% | 3.74 -26% | 4.76 -61% |
| Colorchecker dE 2000 max. * | 5.45 | 8.11 -49% | 8.97 -65% | 10.8 -98% | |
| Greyscale dE 2000 * | 2.57 | 4 -56% | 2.42 6% | 2.67 -4% | 3.69 -44% |
| Gamma | 2.25 98% | 2.43 91% | 2.45 90% | 2.41 91% | 2.24 98% |
| CCT | 7114 91% | 6558 99% | 6855 95% | 6861 95% | 6091 107% |
| Color Space (Percent of AdobeRGB 1998) (%) | 74.3 | 55 -26% | 62 -17% | 56 -25% | 55 -26% |
| Color Space (Percent of sRGB) (%) | 100 | 83 -17% | 97 -3% | 85 -15% | 84 -16% |
| Média Total (Programa/Configurações) | -40% /
-27% | -14% /
-13% | -39% /
-24% | -44% /
-35% |
* ... menor é melhor
Exibir tempos de resposta
| ↔ Tempo de resposta preto para branco | ||
|---|---|---|
| 9.6 ms ... ascensão ↗ e queda ↘ combinadas | ↗ 5.2 ms ascensão | 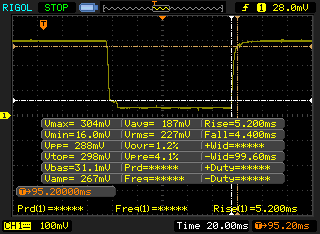 |
| ↘ 4.4 ms queda | ||
| A tela mostra taxas de resposta rápidas em nossos testes e deve ser adequada para jogos. Em comparação, todos os dispositivos testados variam de 0.1 (mínimo) a 240 (máximo) ms. » 26 % de todos os dispositivos são melhores. Isso significa que o tempo de resposta medido é melhor que a média de todos os dispositivos testados (19.8 ms). | ||
| ↔ Tempo de resposta 50% cinza a 80% cinza | ||
| 28 ms ... ascensão ↗ e queda ↘ combinadas | ↗ 13.2 ms ascensão | 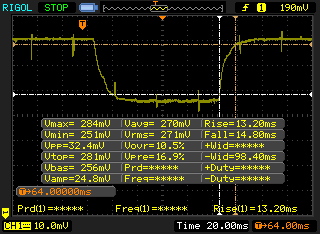 |
| ↘ 14.8 ms queda | ||
| A tela mostra taxas de resposta relativamente lentas em nossos testes e pode ser muito lenta para os jogadores. Em comparação, todos os dispositivos testados variam de 0.165 (mínimo) a 636 (máximo) ms. » 38 % de todos os dispositivos são melhores. Isso significa que o tempo de resposta medido é semelhante à média de todos os dispositivos testados (31 ms). | ||
Cintilação da tela / PWM (modulação por largura de pulso)
| Tela tremeluzindo / PWM não detectado | 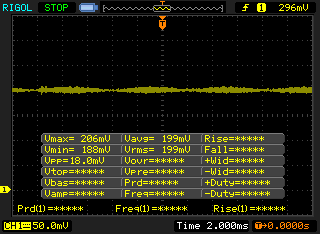 | ||
[pwm_comparison] Em comparação: 52 % de todos os dispositivos testados não usam PWM para escurecer a tela. Se PWM foi detectado, uma média de 7754 (mínimo: 5 - máximo: 343500) Hz foi medida. | |||

| Cinebench R15 | |
| CPU Single 64Bit | |
| Eurocom Sky DLX7 | |
| MSI PX60 QD-034US | |
| Lenovo ThinkPad P40 Yoga 20GQ-000EUS | |
| MSI GS73VR 6RF | |
| Toshiba Satellite S70-B-106 | |
| CPU Multi 64Bit | |
| Eurocom Sky DLX7 | |
| MSI PX60 QD-034US | |
| MSI GS73VR 6RF | |
| Toshiba Satellite S70-B-106 | |
| Lenovo ThinkPad P40 Yoga 20GQ-000EUS | |
| Cinebench R11.5 | |
| CPU Single 64Bit | |
| Eurocom Sky DLX7 | |
| MSI PX60 QD-034US | |
| MSI GS73VR 6RF | |
| Toshiba Satellite S70-B-106 | |
| Lenovo ThinkPad P40 Yoga 20GQ-000EUS | |
| CPU Multi 64Bit | |
| Eurocom Sky DLX7 | |
| MSI PX60 QD-034US | |
| MSI GS73VR 6RF | |
| Toshiba Satellite S70-B-106 | |
| Lenovo ThinkPad P40 Yoga 20GQ-000EUS | |
| Cinebench R10 | |
| Rendering Multiple CPUs 32Bit | |
| Eurocom Sky DLX7 | |
| MSI PX60 QD-034US | |
| MSI GS73VR 6RF | |
| Lenovo ThinkPad P40 Yoga 20GQ-000EUS | |
| Rendering Single 32Bit | |
| Eurocom Sky DLX7 | |
| MSI PX60 QD-034US | |
| Lenovo ThinkPad P40 Yoga 20GQ-000EUS | |
| MSI GS73VR 6RF | |
| wPrime 2.10 - 1024m | |
| Lenovo ThinkPad P40 Yoga 20GQ-000EUS | |
| MSI GS73VR 6RF | |
| MSI PX60 QD-034US | |
| Eurocom Sky DLX7 | |
| Super Pi Mod 1.5 XS 32M - 32M | |
| MSI GS73VR 6RF | |
| Lenovo ThinkPad P40 Yoga 20GQ-000EUS | |
| MSI PX60 QD-034US | |
| Eurocom Sky DLX7 | |
* ... menor é melhor
| PCMark 8 | |
| Home Score Accelerated v2 | |
| Asus G752VY-RH71 | |
| MSI GS73VR 6RF | |
| MSI GS70-6QE16H21 | |
| Razer Blade Pro 17 inch 2015 | |
| Aorus X5S v5 | |
| Work Score Accelerated v2 | |
| Asus G752VY-RH71 | |
| MSI GS70-6QE16H21 | |
| MSI GS73VR 6RF | |
| Razer Blade Pro 17 inch 2015 | |
| Aorus X5S v5 | |
| Creative Score Accelerated v2 | |
| Asus G752VY-RH71 | |
| MSI GS73VR 6RF | |
| MSI GS70-6QE16H21 | |
| Aorus X5S v5 | |
| Razer Blade Pro 17 inch 2015 | |
| PCMark 8 Home Score Accelerated v2 | 4012 pontos | |
| PCMark 8 Creative Score Accelerated v2 | 5062 pontos | |
| PCMark 8 Work Score Accelerated v2 | 4774 pontos | |
Ajuda | ||
| MSI GS73VR 6RF SanDisk SD8SN8U1T001122 | Aorus X5S v5 Samsung SM951 MZVPV256 m.2 | MSI GT72S-6QEG16SR421BW Toshiba NVMe THNSN5256GPU7 | Asus G752VY-RH71 Samsung SSD 950 Pro 512GB m.2 NVMe | Razer Blade Pro 17 inch 2015 Samsung PM851 Series MZMTE256HMHP | |
|---|---|---|---|---|---|
| CrystalDiskMark 3.0 | 263% | 256% | 298% | 62% | |
| Read Seq (MB/s) | 334.3 | 1748 423% | 1602 379% | 2007 500% | 527 58% |
| Write Seq (MB/s) | 319 | 1272 299% | 1062 233% | 1536 382% | 265.9 -17% |
| Read 512 (MB/s) | 242.3 | 993 310% | 1110 358% | 1022 322% | 445.9 84% |
| Write 512 (MB/s) | 254.4 | 1263 396% | 1095 330% | 1510 494% | 265.9 5% |
| Read 4k (MB/s) | 20.3 | 51.9 156% | 44.74 120% | 51.6 154% | 36.83 81% |
| Write 4k (MB/s) | 42.51 | 146.5 245% | 162.3 282% | 150.2 253% | 116 173% |
| Read 4k QD32 (MB/s) | 251.6 | 628 150% | 682 171% | 576 129% | 389 55% |
| Write 4k QD32 (MB/s) | 167.1 | 370.4 122% | 459.5 175% | 413.7 148% | 266.5 59% |

| 3DMark | |
| 1920x1080 Fire Strike Graphics | |
| Asus G752VS-XB78K | |
| Aorus X7 Pro v5 | |
| Asus G701VO-CS74K | |
| MSI GS73VR 6RF | |
| Aorus X5S v5 | |
| HP Pavilion 15 UHD T9Y85AV | |
| Fire Strike Extreme Graphics | |
| Asus G752VS-XB78K | |
| Asus G701VO-CS74K | |
| MSI GS73VR 6RF | |
| Aorus X5S v5 | |
| HP Pavilion 15 UHD T9Y85AV | |
| 3840x2160 Fire Strike Ultra Graphics | |
| Asus G752VS-XB78K | |
| Asus G701VO-CS74K | |
| MSI GS73VR 6RF | |
| Aorus X5S v5 | |
| HP Pavilion 15 UHD T9Y85AV | |
| 3DMark 11 | |
| 1280x720 Performance GPU | |
| Asus G752VS-XB78K | |
| Aorus X7 Pro v5 | |
| Asus G701VO-CS74K | |
| MSI GS73VR 6RF | |
| Aorus X5S v5 | |
| HP Pavilion 15 UHD T9Y85AV | |
| 1280x720 Performance Combined | |
| Asus G752VS-XB78K | |
| Asus G701VO-CS74K | |
| Aorus X7 Pro v5 | |
| MSI GS73VR 6RF | |
| Aorus X5S v5 | |
| HP Pavilion 15 UHD T9Y85AV | |
| 3DMark 11 Performance | 12423 pontos | |
| 3DMark Ice Storm Standard Score | 88271 pontos | |
| 3DMark Cloud Gate Standard Score | 22781 pontos | |
| 3DMark Fire Strike Score | 9609 pontos | |
| 3DMark Fire Strike Extreme Score | 5062 pontos | |
Ajuda | ||
| Batman: Arkham Knight - 1920x1080 High / On AA:SM AF:16x | |
| Asus G752VS-XB78K | |
| Asus G701VO-CS74K | |
| MSI GS73VR 6RF | |
| Aorus X5S v5 | |
| HP Pavilion 15 UHD T9Y85AV | |
| BioShock Infinite - 1920x1080 Ultra Preset, DX11 (DDOF) | |
| Asus G752VS-XB78K | |
| Asus G701VO-CS74K | |
| MSI GS73VR 6RF | |
| Aorus X5S v5 | |
| Aorus X3 Plus v5 | |
| HP Pavilion 15 UHD T9Y85AV | |
| Metro: Last Light - 1920x1080 Very High (DX11) AF:16x | |
| Asus G701VO-CS74K | |
| MSI GS73VR 6RF | |
| Aorus X5S v5 | |
| Aorus X3 Plus v5 | |
| HP Pavilion 15 UHD T9Y85AV | |
| Thief - 1920x1080 Very High Preset AA:FXAA & High SS AF:8x | |
| Asus G752VS-XB78K | |
| Asus G701VO-CS74K | |
| MSI GS73VR 6RF | |
| Aorus X5S v5 | |
| Aorus X3 Plus v5 | |
| HP Pavilion 15 UHD T9Y85AV | |
| Metal Gear Solid V - 1920x1080 Extra High / On | |
| Aorus X5S v5 | |
| Asus G701VO-CS74K | |
| MSI GS73VR 6RF | |
| Aorus X3 Plus v5 | |
| HP Pavilion 15 UHD T9Y85AV | |
| Fallout 4 - 1920x1080 Ultra Preset AA:T AF:16x | |
| Asus G701VO-CS74K | |
| MSI GS73VR 6RF | |
| Aorus X5S v5 | |
| Aorus X3 Plus v5 | |
| HP Pavilion 15 UHD T9Y85AV | |
| Rise of the Tomb Raider - 1920x1080 Very High Preset AA:FX AF:16x | |
| Asus G752VS-XB78K | |
| MSI GS73VR 6RF | |
| Asus G701VO-CS74K | |
| Aorus X5S v5 | |
| HP Pavilion 15 UHD T9Y85AV | |
| Doom - 1920x1080 Ultra Preset AA:SM | |
| Asus G701VO-CS74K | |
| MSI GS73VR 6RF | |
| Overwatch - 1920x1080 Epic (Render Scale 100 %) AA:SM AF:16x | |
| Asus G701VO-CS74K | |
| MSI GS73VR 6RF | |
| HP Pavilion 15 UHD T9Y85AV | |
| baixo | média | alto | ultra | |
|---|---|---|---|---|
| Guild Wars 2 (2012) | 51.4 | |||
| BioShock Infinite (2013) | 156.9 | 100 | ||
| Metro: Last Light (2013) | 116 | 77.4 | ||
| Thief (2014) | 77.5 | 65.7 | ||
| Batman: Arkham Knight (2015) | 78 | 57 | ||
| Metal Gear Solid V (2015) | 60 | |||
| Fallout 4 (2015) | 57.1 | |||
| Rise of the Tomb Raider (2016) | 72.4 | 61.4 | ||
| Doom (2016) | 84.1 | 76.3 | ||
| Overwatch (2016) | 102.1 |
Barulho
| Ocioso |
| 31.9 / 32 / 34 dB |
| Carga |
| 47 / 49.4 dB |
 | ||
30 dB silencioso 40 dB(A) audível 50 dB(A) ruidosamente alto |
||
min: | ||
| MSI GS73VR 6RF GeForce GTX 1060 Mobile, 6700HQ, SanDisk SD8SN8U1T001122 | Aorus X7 Pro v5 GeForce GTX 970M SLI, 6820HK, Samsung SM951 MZVPV512 m.2 PCI-e | MSI GT72S 6QF GeForce GTX 980 (Laptop), 6820HK, 2x Micron M600 MTFDDAV128MBF NVMe (RAID 0) | MSI GS70 6QE-036XPL GeForce GTX 970M, 6700HQ, Toshiba HG6 THNSNJ128G8NU | Razer Blade Pro 17 inch 2015 GeForce GTX 960M, 4720HQ, Samsung PM851 Series MZMTE256HMHP | |
|---|---|---|---|---|---|
| Noise | -5% | -1% | -6% | 7% | |
| desligado / ambiente * (dB) | 28.4 | 30 -6% | |||
| Idle Minimum * (dB) | 31.9 | 34 -7% | 33.1 -4% | 32.5 -2% | 30.6 4% |
| Idle Average * (dB) | 32 | 35 -9% | 33.3 -4% | 34.2 -7% | 30.7 4% |
| Idle Maximum * (dB) | 34 | 39 -15% | 37 -9% | 36.1 -6% | 32.6 4% |
| Load Average * (dB) | 47 | 39 17% | 39 17% | 50.3 -7% | 38.8 17% |
| Load Maximum * (dB) | 49.4 | 54 -9% | 52.2 -6% | 54.5 -10% | 46.2 6% |
* ... menor é melhor
(-) A temperatura máxima no lado superior é 50.8 °C / 123 F, em comparação com a média de 40.4 °C / 105 F , variando de 21.2 a 68.8 °C para a classe Gaming.
(-) A parte inferior aquece até um máximo de 60 °C / 140 F, em comparação com a média de 43.2 °C / 110 F
(+) Em uso inativo, a temperatura média para o lado superior é 26.4 °C / 80 F, em comparação com a média do dispositivo de 33.9 °C / ### class_avg_f### F.
(+) Os apoios para as mãos e o touchpad estão atingindo a temperatura máxima da pele (34.4 °C / 93.9 F) e, portanto, não estão quentes.
(-) A temperatura média da área do apoio para as mãos de dispositivos semelhantes foi 28.8 °C / 83.8 F (-5.6 °C / -10.1 F).
MSI GS73VR 6RF análise de áudio
(-) | alto-falantes não muito altos (###valor### dB)
Graves 100 - 315Hz
(-) | quase nenhum baixo - em média 20.4% menor que a mediana
(±) | a linearidade dos graves é média (11.4% delta para a frequência anterior)
Médios 400 - 2.000 Hz
(+) | médios equilibrados - apenas 3% longe da mediana
(±) | a linearidade dos médios é média (8.2% delta para frequência anterior)
Altos 2 - 16 kHz
(+) | agudos equilibrados - apenas 4% longe da mediana
(+) | os máximos são lineares (5.9% delta da frequência anterior)
Geral 100 - 16.000 Hz
(±) | a linearidade do som geral é média (21% diferença em relação à mediana)
Comparado com a mesma classe
» 76% de todos os dispositivos testados nesta classe foram melhores, 4% semelhantes, 20% piores
» O melhor teve um delta de 6%, a média foi 18%, o pior foi 132%
Comparado com todos os dispositivos testados
» 58% de todos os dispositivos testados foram melhores, 7% semelhantes, 35% piores
» O melhor teve um delta de 4%, a média foi 23%, o pior foi 134%
Apple MacBook 12 (Early 2016) 1.1 GHz análise de áudio
(+) | os alto-falantes podem tocar relativamente alto (###valor### dB)
Graves 100 - 315Hz
(±) | graves reduzidos - em média 11.3% menor que a mediana
(±) | a linearidade dos graves é média (14.2% delta para a frequência anterior)
Médios 400 - 2.000 Hz
(+) | médios equilibrados - apenas 2.4% longe da mediana
(+) | médios são lineares (5.5% delta para frequência anterior)
Altos 2 - 16 kHz
(+) | agudos equilibrados - apenas 2% longe da mediana
(+) | os máximos são lineares (4.5% delta da frequência anterior)
Geral 100 - 16.000 Hz
(+) | o som geral é linear (10.2% diferença em relação à mediana)
Comparado com a mesma classe
» 7% de todos os dispositivos testados nesta classe foram melhores, 2% semelhantes, 90% piores
» O melhor teve um delta de 5%, a média foi 18%, o pior foi 53%
Comparado com todos os dispositivos testados
» 5% de todos os dispositivos testados foram melhores, 1% semelhantes, 94% piores
» O melhor teve um delta de 4%, a média foi 23%, o pior foi 134%
Schenker F516 Flex análise de áudio
(-) | alto-falantes não muito altos (###valor### dB)
Analysis not possible as minimum curve is missing or too high
| desligado | |
| Ocioso | |
| Carga |
|
Key:
min: | |
| MSI GS73VR 6RF 6700HQ, GeForce GTX 1060 Mobile, SanDisk SD8SN8U1T001122, TN LED, 1920x1080, 17.3" | Asus Strix GL502VY-DS71 6700HQ, GeForce GTX 980M, SanDisk SD8SN8U1T001122, IPS, 1920x1080, 15.6" | Asus G701VO-CS74K 6820HK, GeForce GTX 980 (Laptop), 2x Samsung SM951 MZVPV512HDGL (RAID 0), IPS, 1920x1080, 17.3" | MSI GS70 6QE-036XPL 6700HQ, GeForce GTX 970M, Toshiba HG6 THNSNJ128G8NU, , 1920x1080, 17.3" | MSI GT72VR 6RE-015US 6700HQ, GeForce GTX 1070 Mobile, SanDisk SD8SNAT256G1122, IPS, 1920x1080, 17.3" | |
|---|---|---|---|---|---|
| Power Consumption | 10% | -13% | 12% | -6% | |
| Idle Minimum * (Watt) | 22.6 | 20.6 9% | 28.2 -25% | 14.1 38% | 22.3 1% |
| Idle Average * (Watt) | 32.7 | 22.1 32% | 32 2% | 22.6 31% | 27.3 17% |
| Idle Maximum * (Watt) | 32.8 | 22.5 31% | 32.6 1% | 30.5 7% | 30 9% |
| Load Average * (Watt) | 114.7 | 130.6 -14% | 162.2 -41% | 143.1 -25% | 152.2 -33% |
| Load Maximum * (Watt) | 167.9 | 177.2 -6% | 173.5 -3% | 150 11% | 204.2 -22% |
* ... menor é melhor
| MSI GS73VR 6RF 6700HQ, GeForce GTX 1060 Mobile, 65 Wh | Asus Strix GL502VY-DS71 6700HQ, GeForce GTX 980M, 64 Wh | Asus G701VO-CS74K 6820HK, GeForce GTX 980 (Laptop), 93 Wh | MSI GS70-6QE16H21 6700HQ, GeForce GTX 970M, 56 Wh | MSI GT72VR 6RE-015US 6700HQ, GeForce GTX 1070 Mobile, 83 Wh | |
|---|---|---|---|---|---|
| Duração da bateria | -6% | -1% | -16% | 7% | |
| Reader / Idle (h) | 5.9 | 4.6 -22% | 4 -32% | 4 -32% | 5.4 -8% |
| WiFi v1.3 (h) | 3.6 | 3.1 -14% | 3.4 -6% | 3 -17% | 3.7 3% |
| Load (h) | 1.1 | 1.3 18% | 1.5 36% | 1.1 0% | 1.4 27% |
Pro
Contra

O GS73VR é a grande atualização que a série GS Stealth precisava. O GS70 permaneceu quase igual desde a sua origem em 2013 e suas pequenas atualizações desde então, fizeram muito pouco para resolver seus maiores problemas. O GS73VR finalmente é mais fino, melhor construído, mais frio, e muito mais poderoso com pontos quentes mais localizados. A Pascal continua impressionando em todas as frentes, dado que a GTX 1060 oferece um desempenho um pouco melhor que a GTX 980M em um chassi que é de uma fração do tamanho, em comparação com os carros chefe Maxwell como o MSI GT72S, Asus G752VY, Alienware 17, e Acer Predator 17.
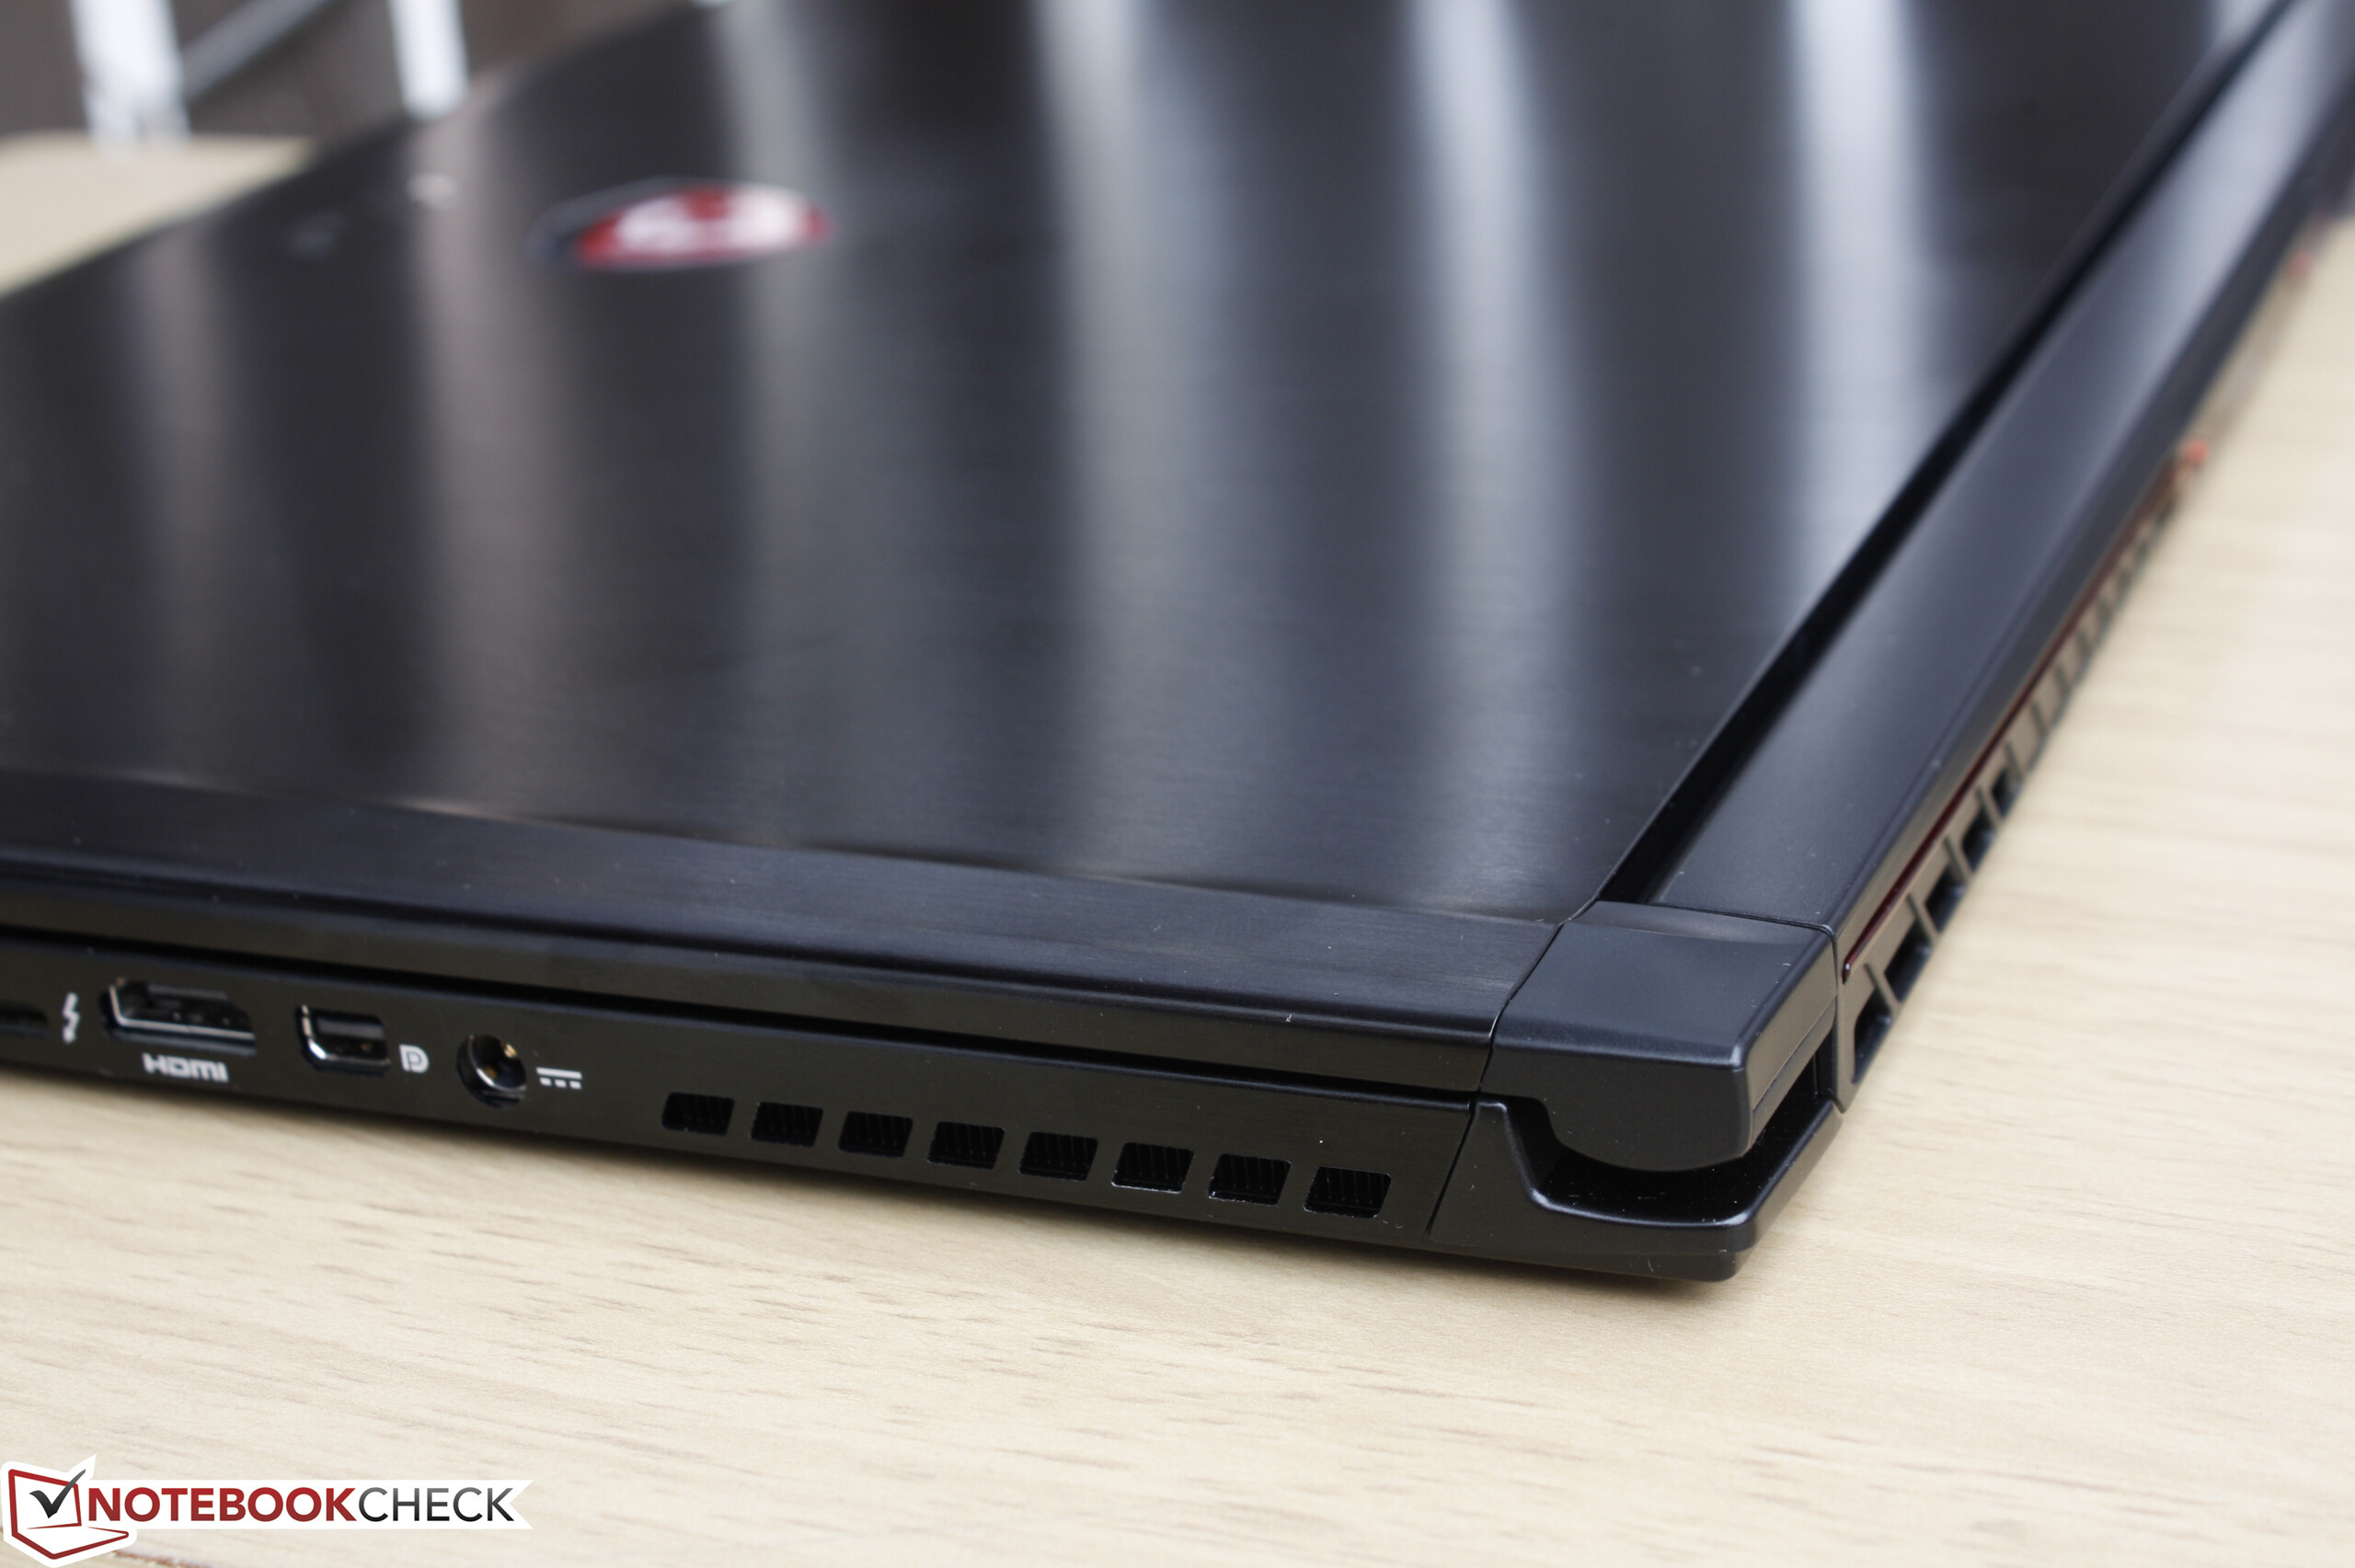
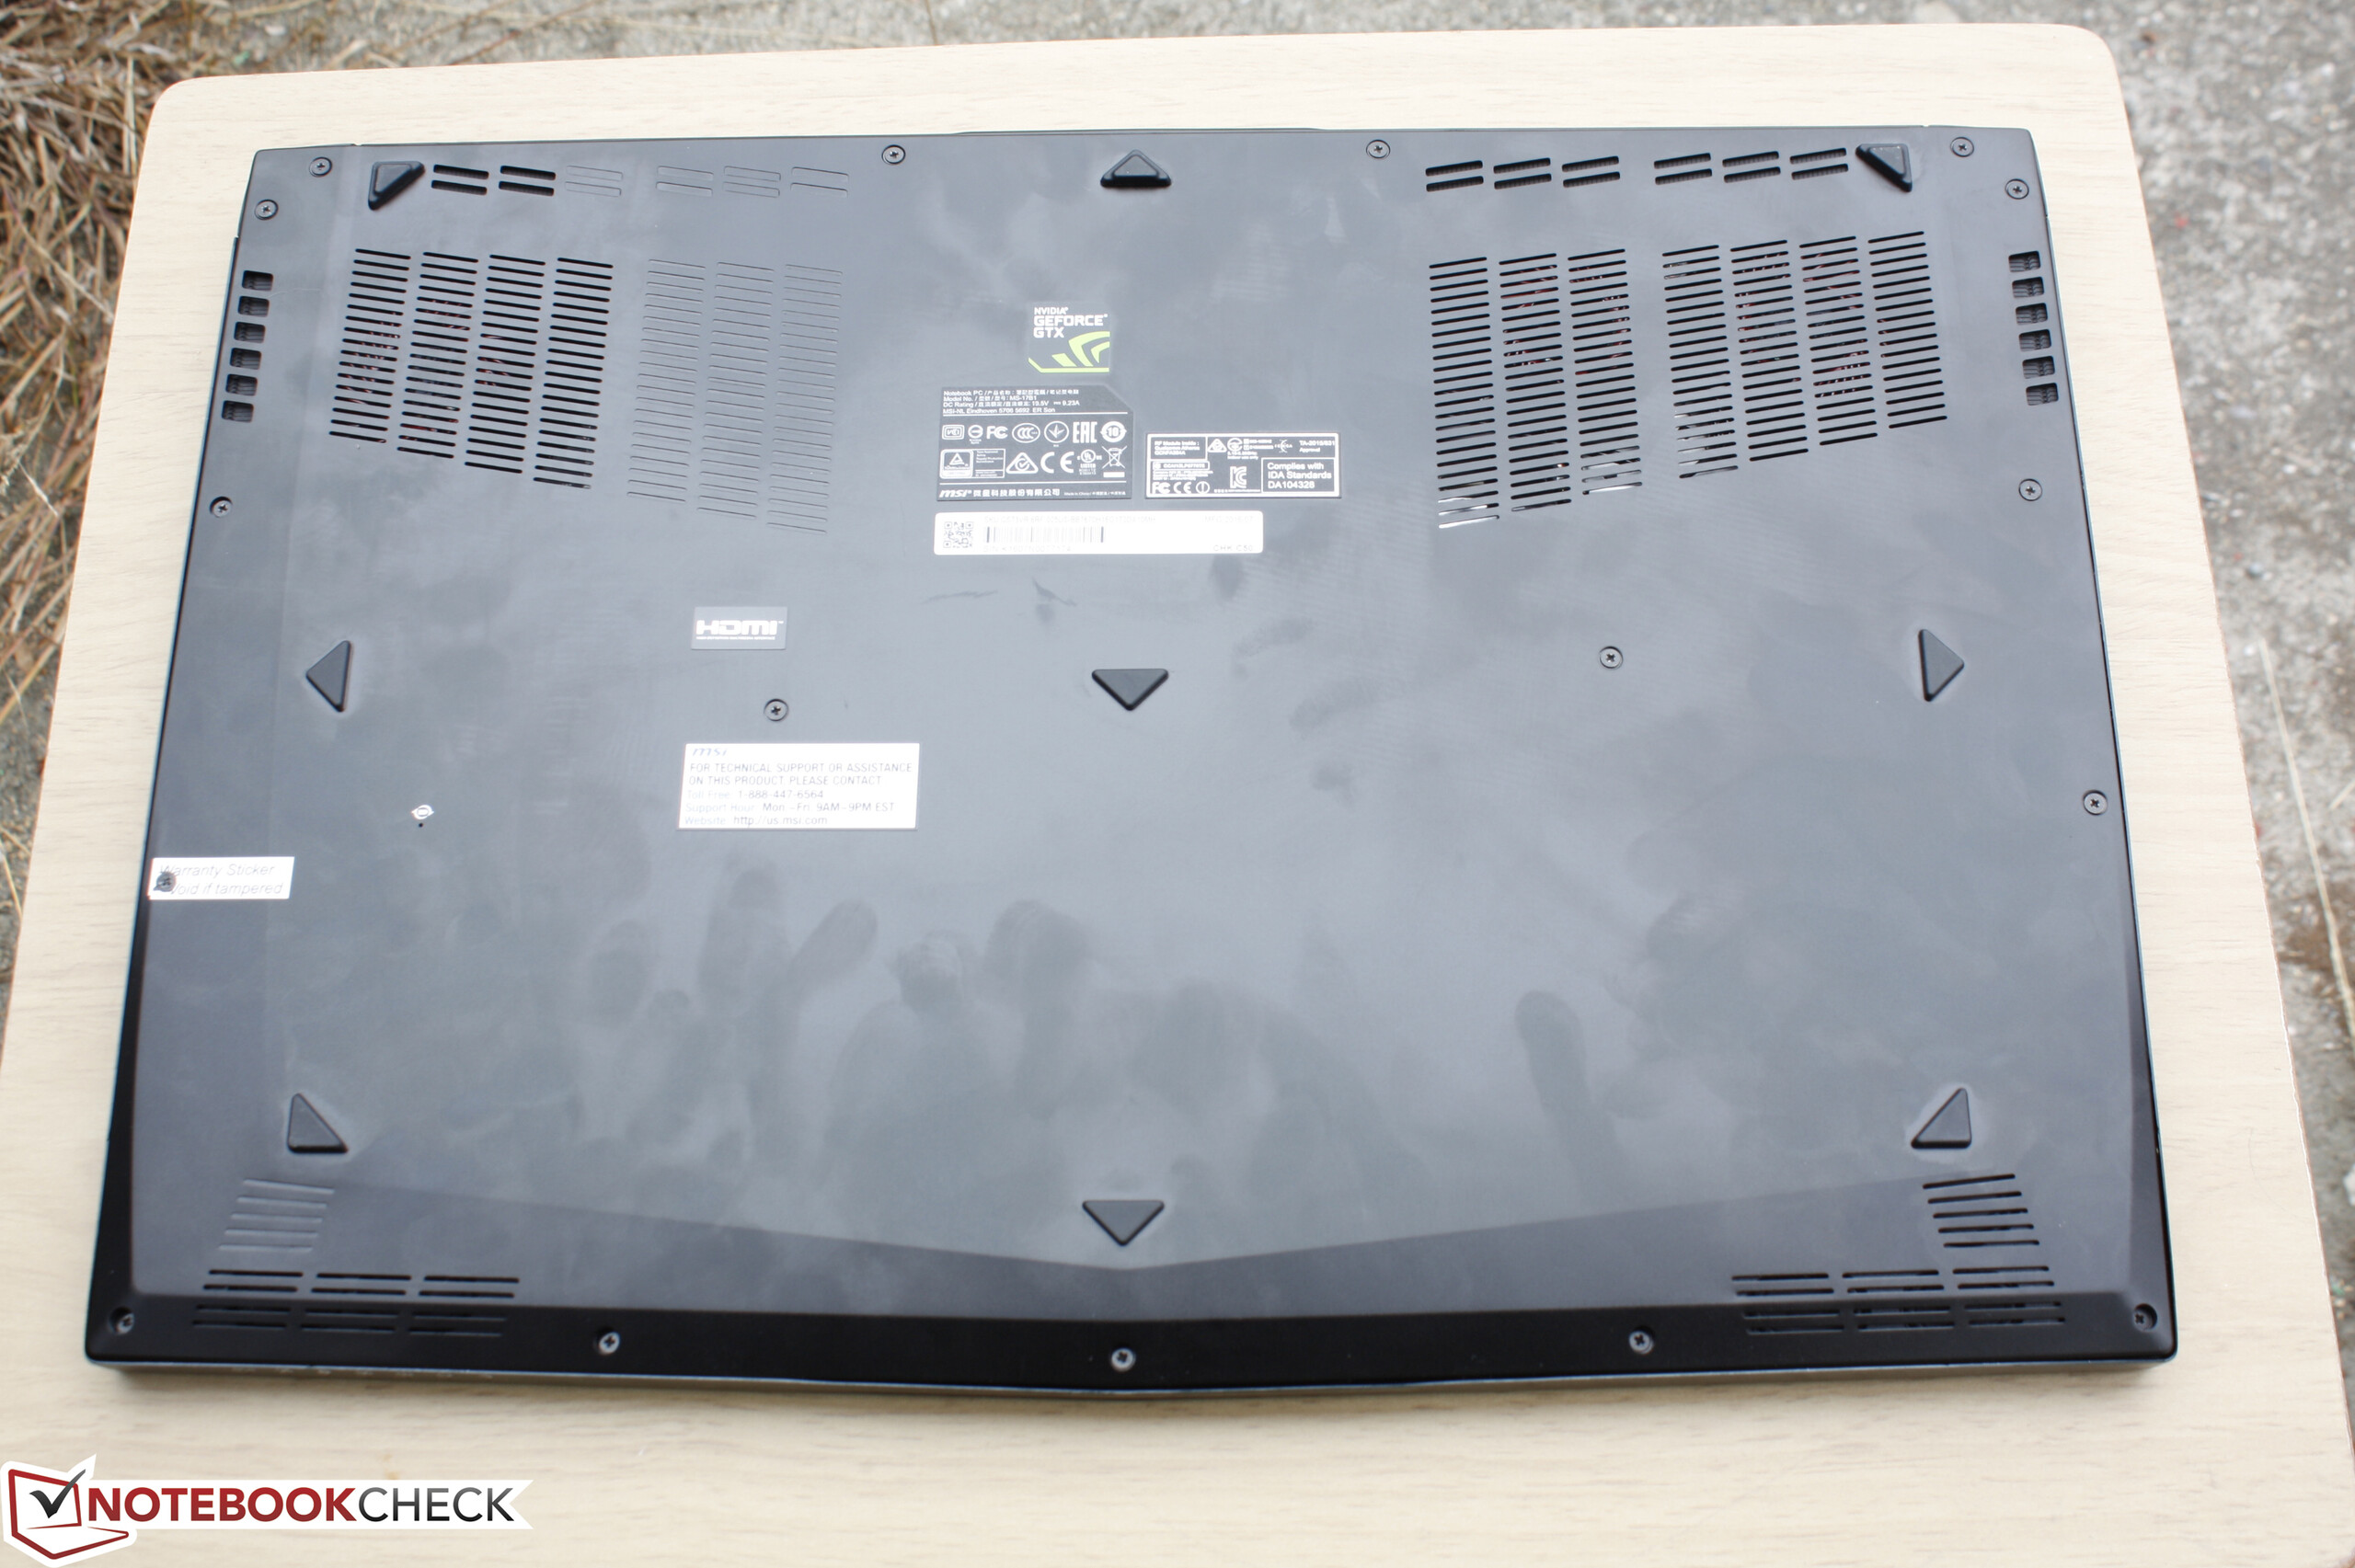
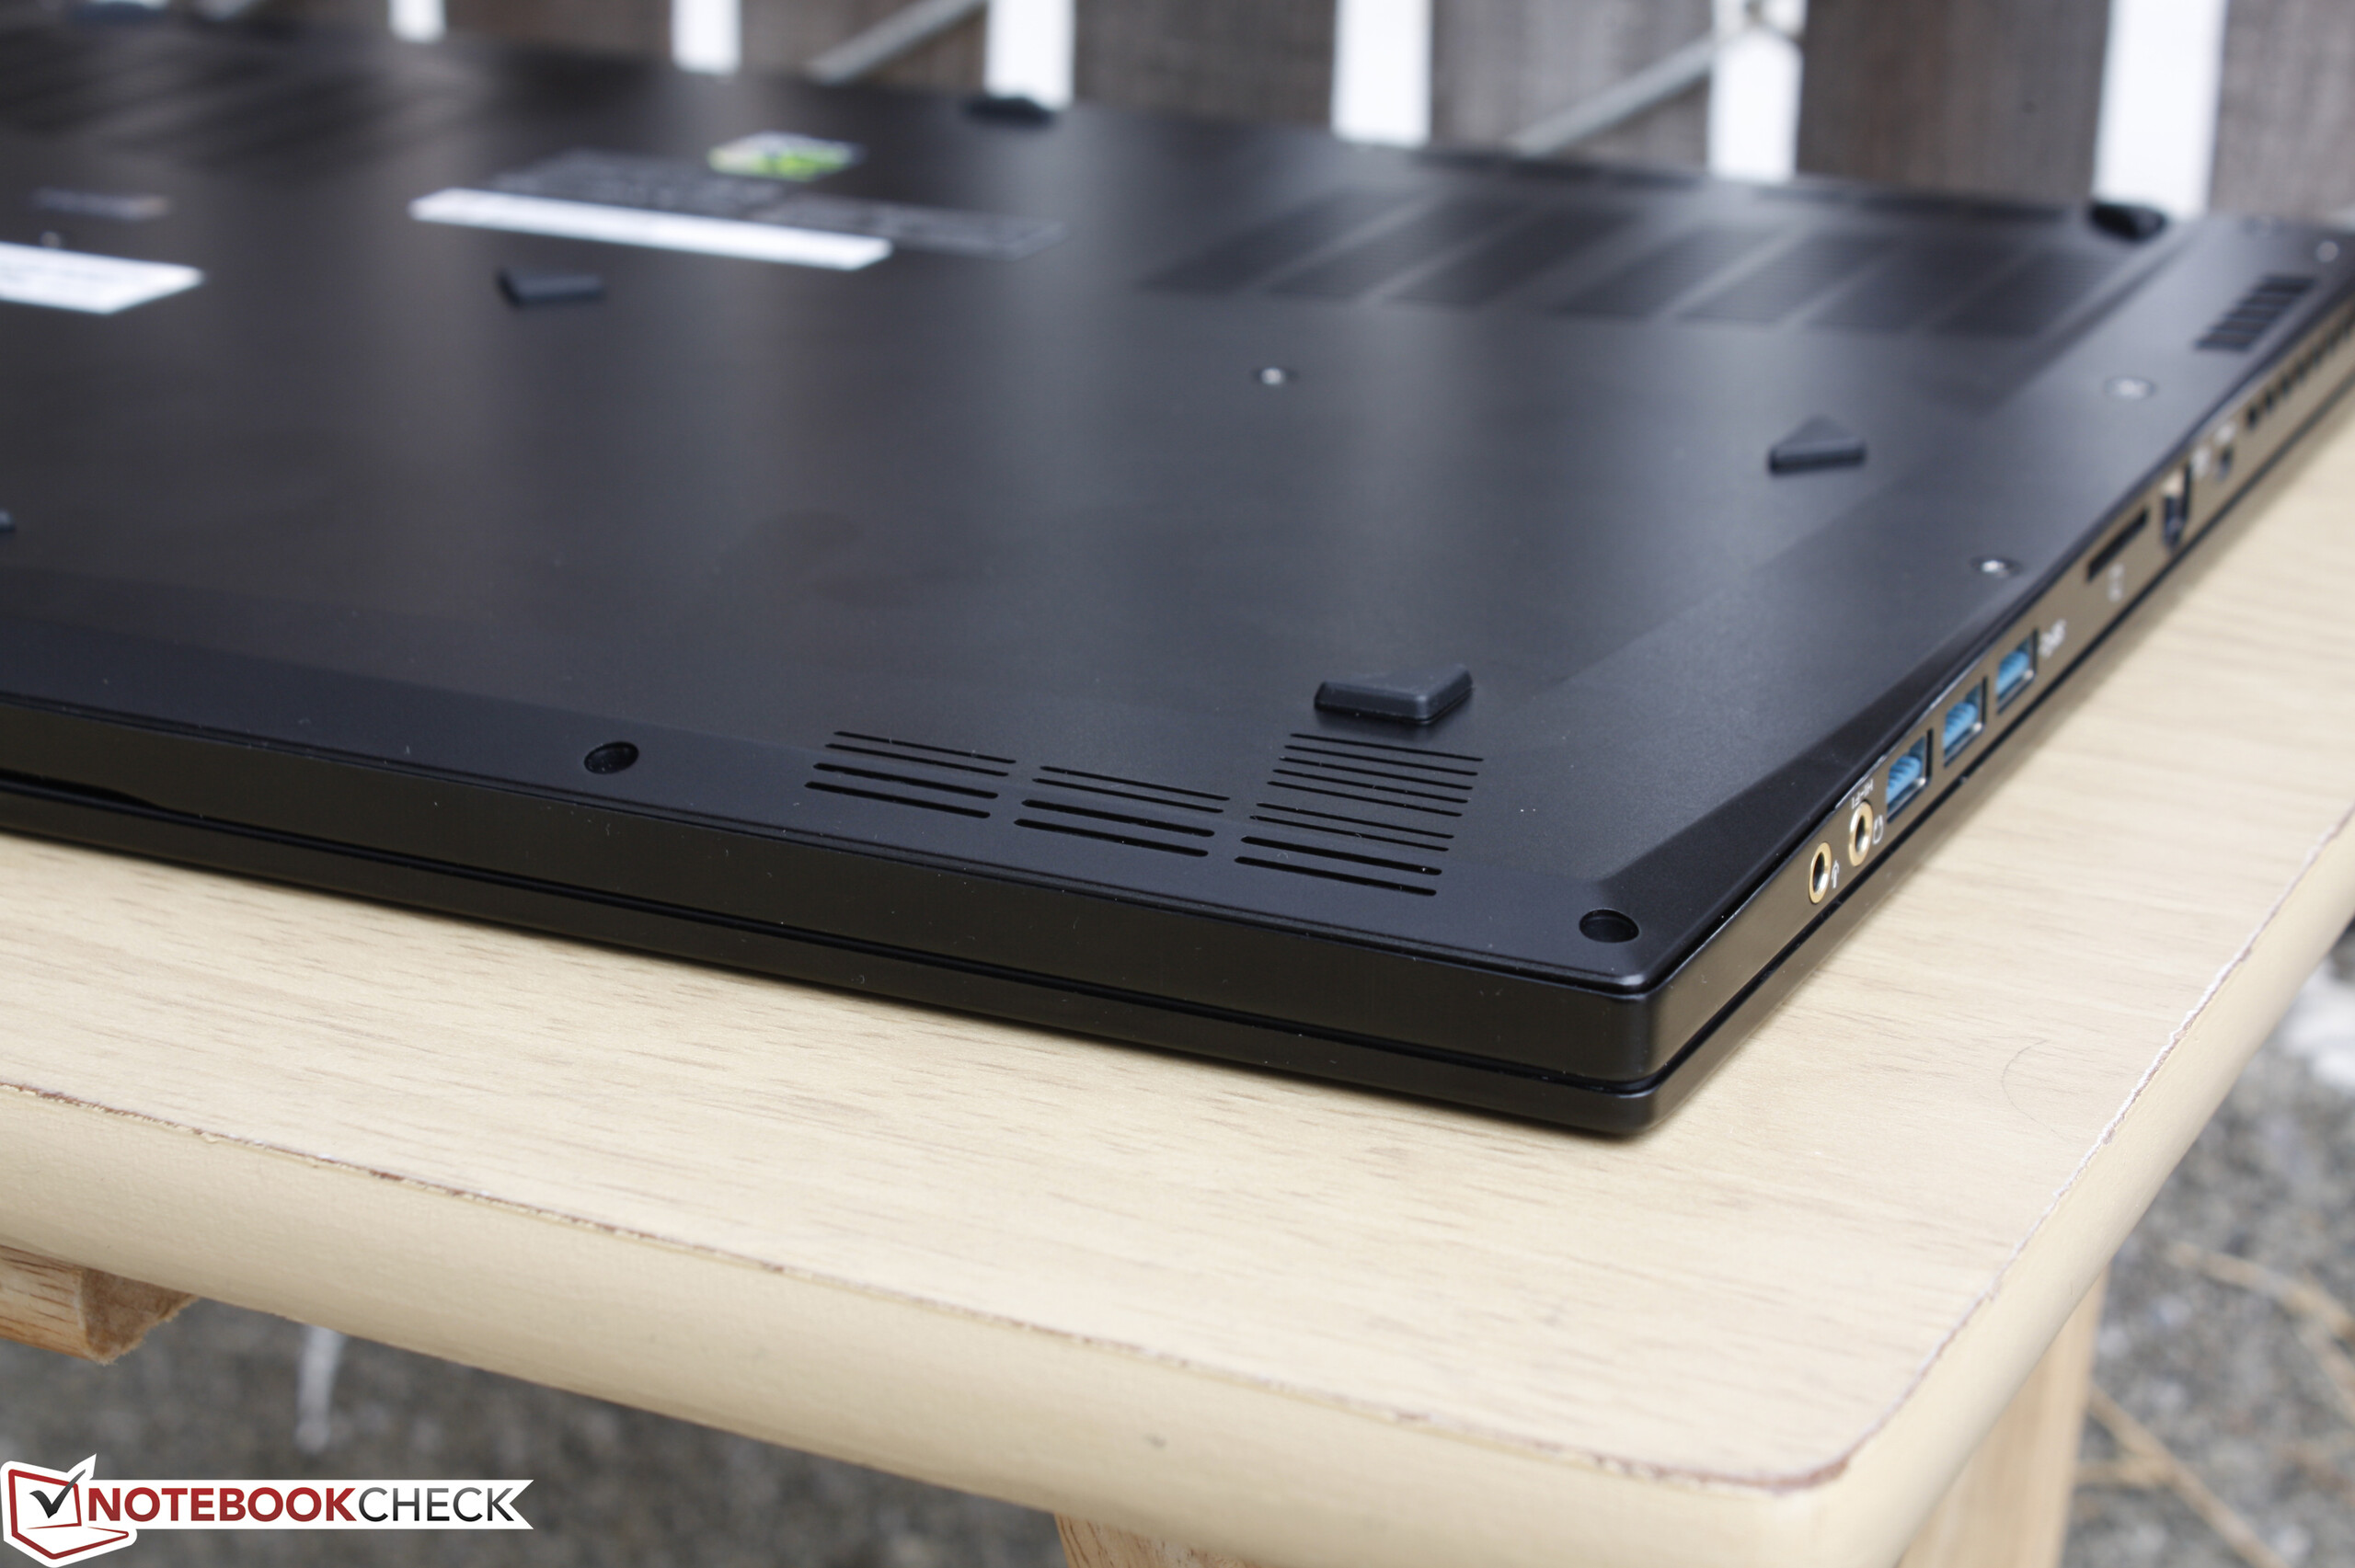
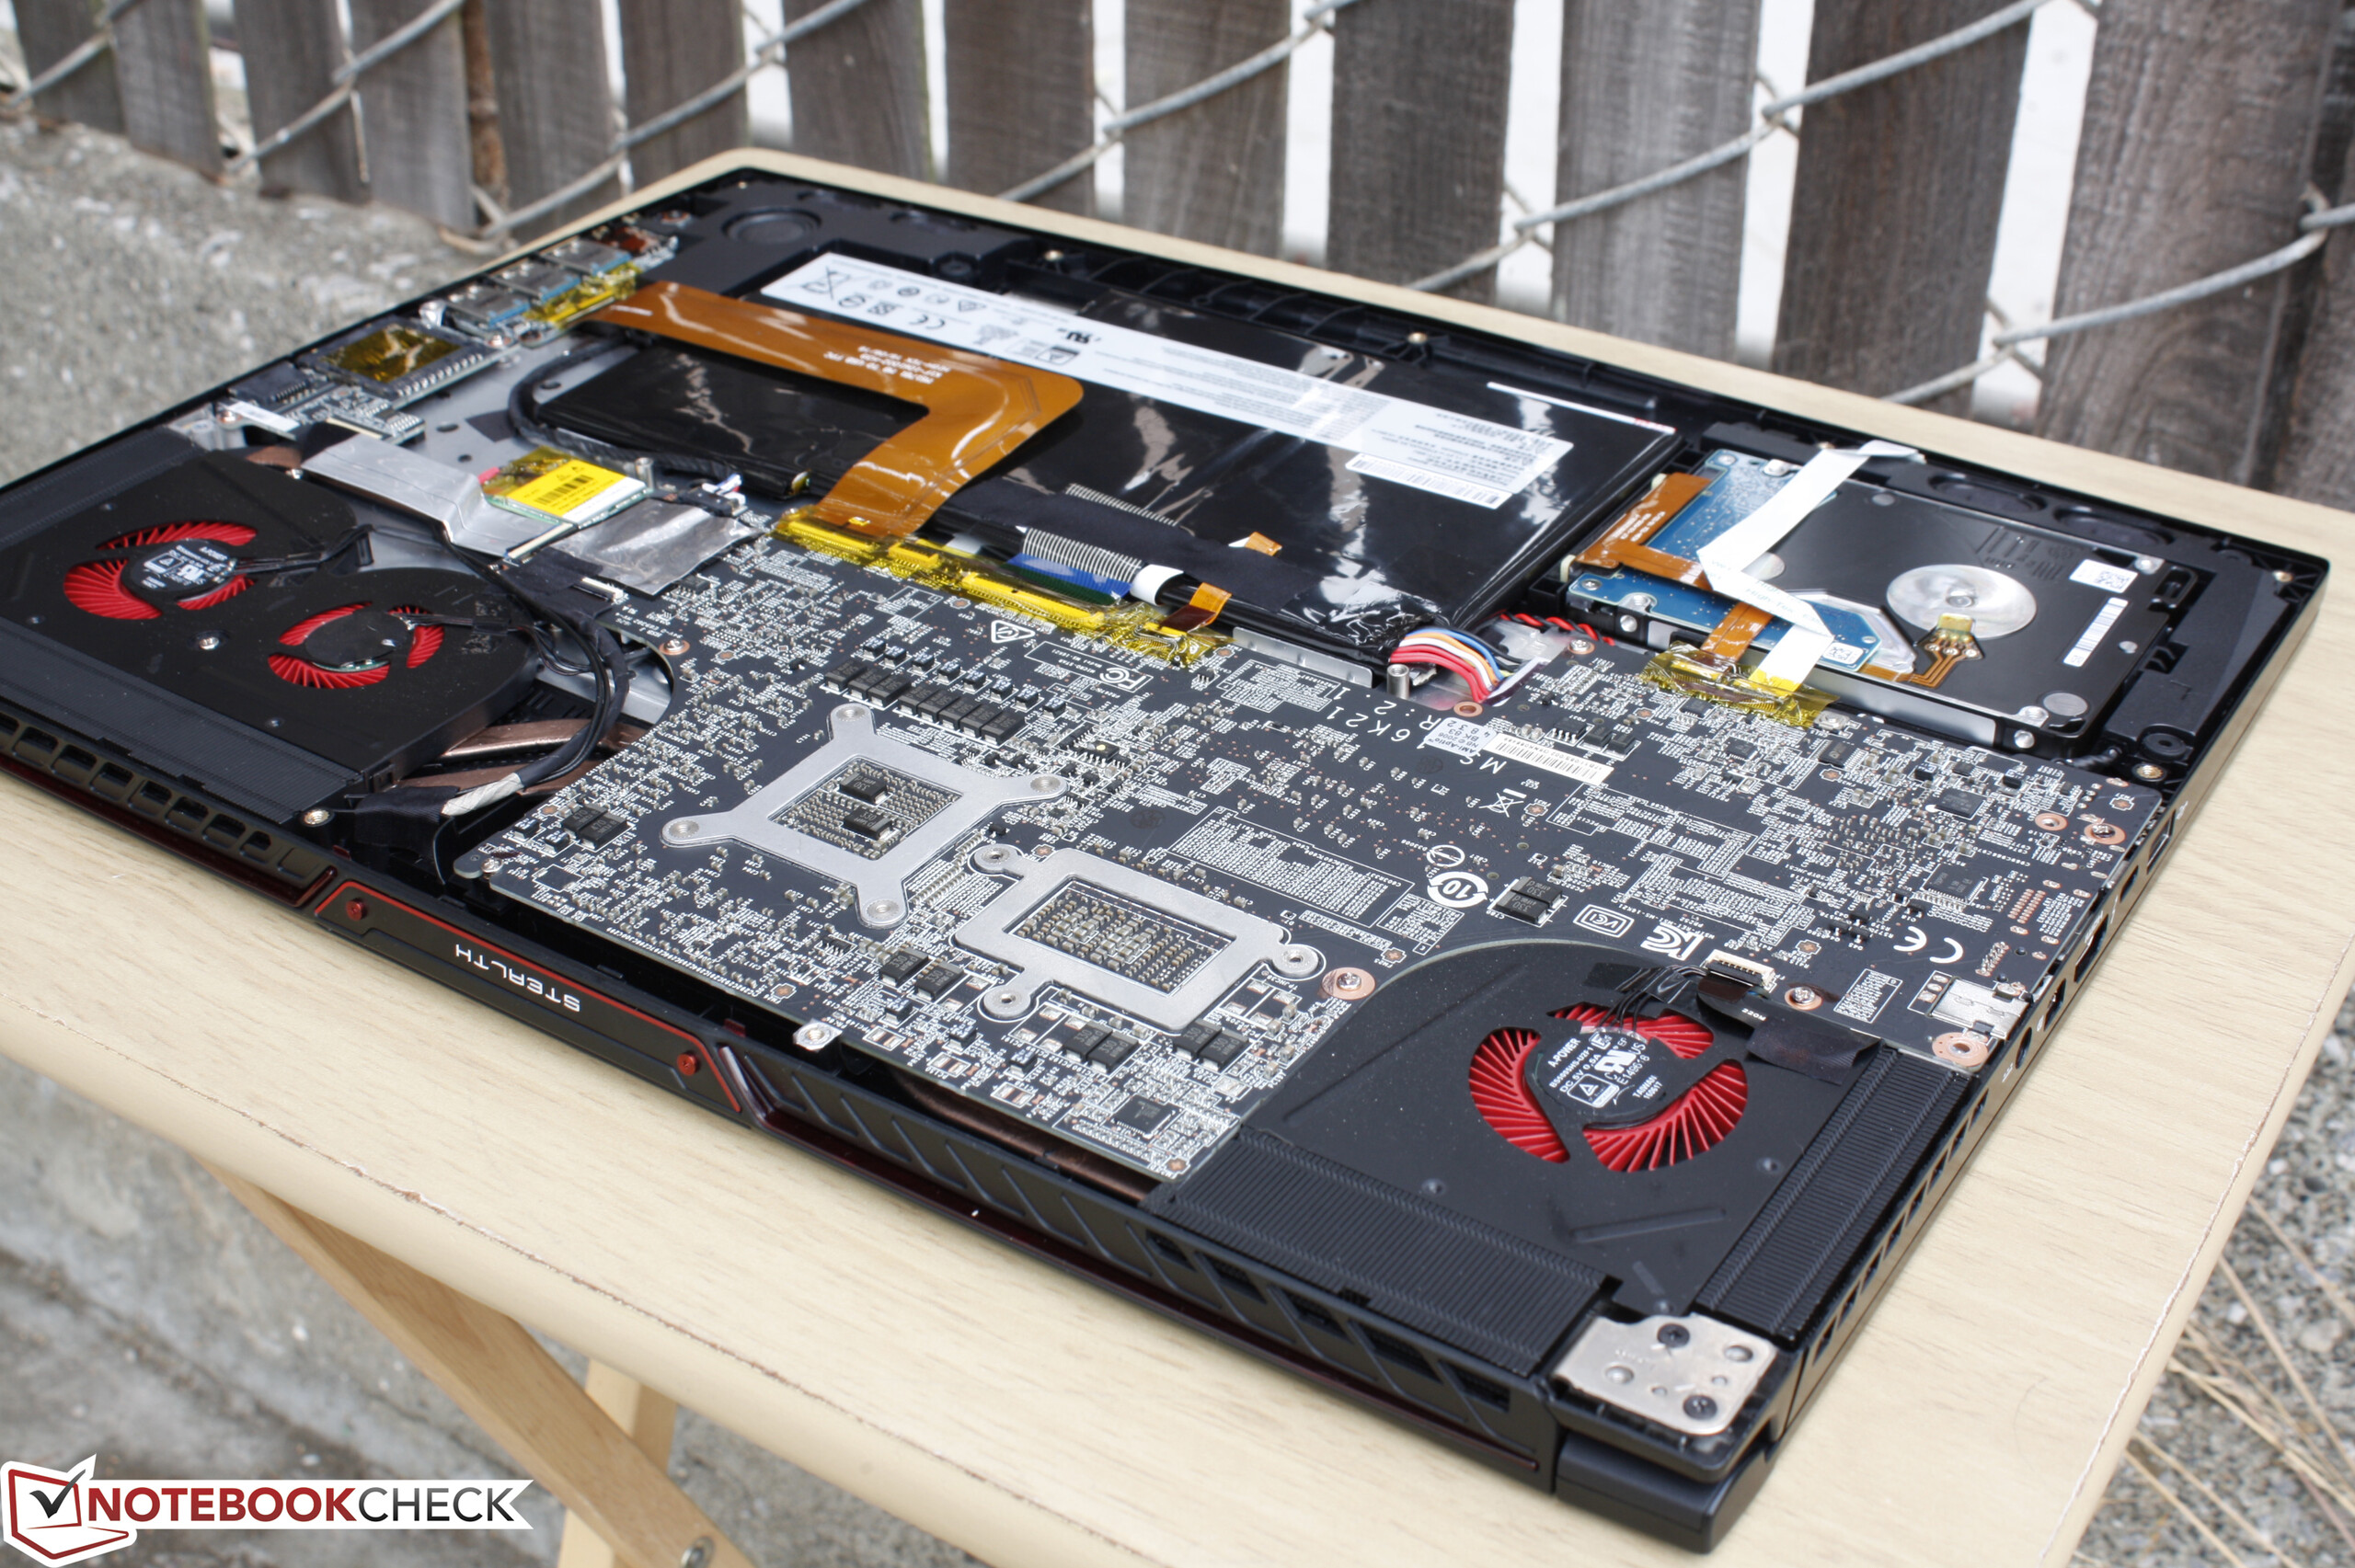
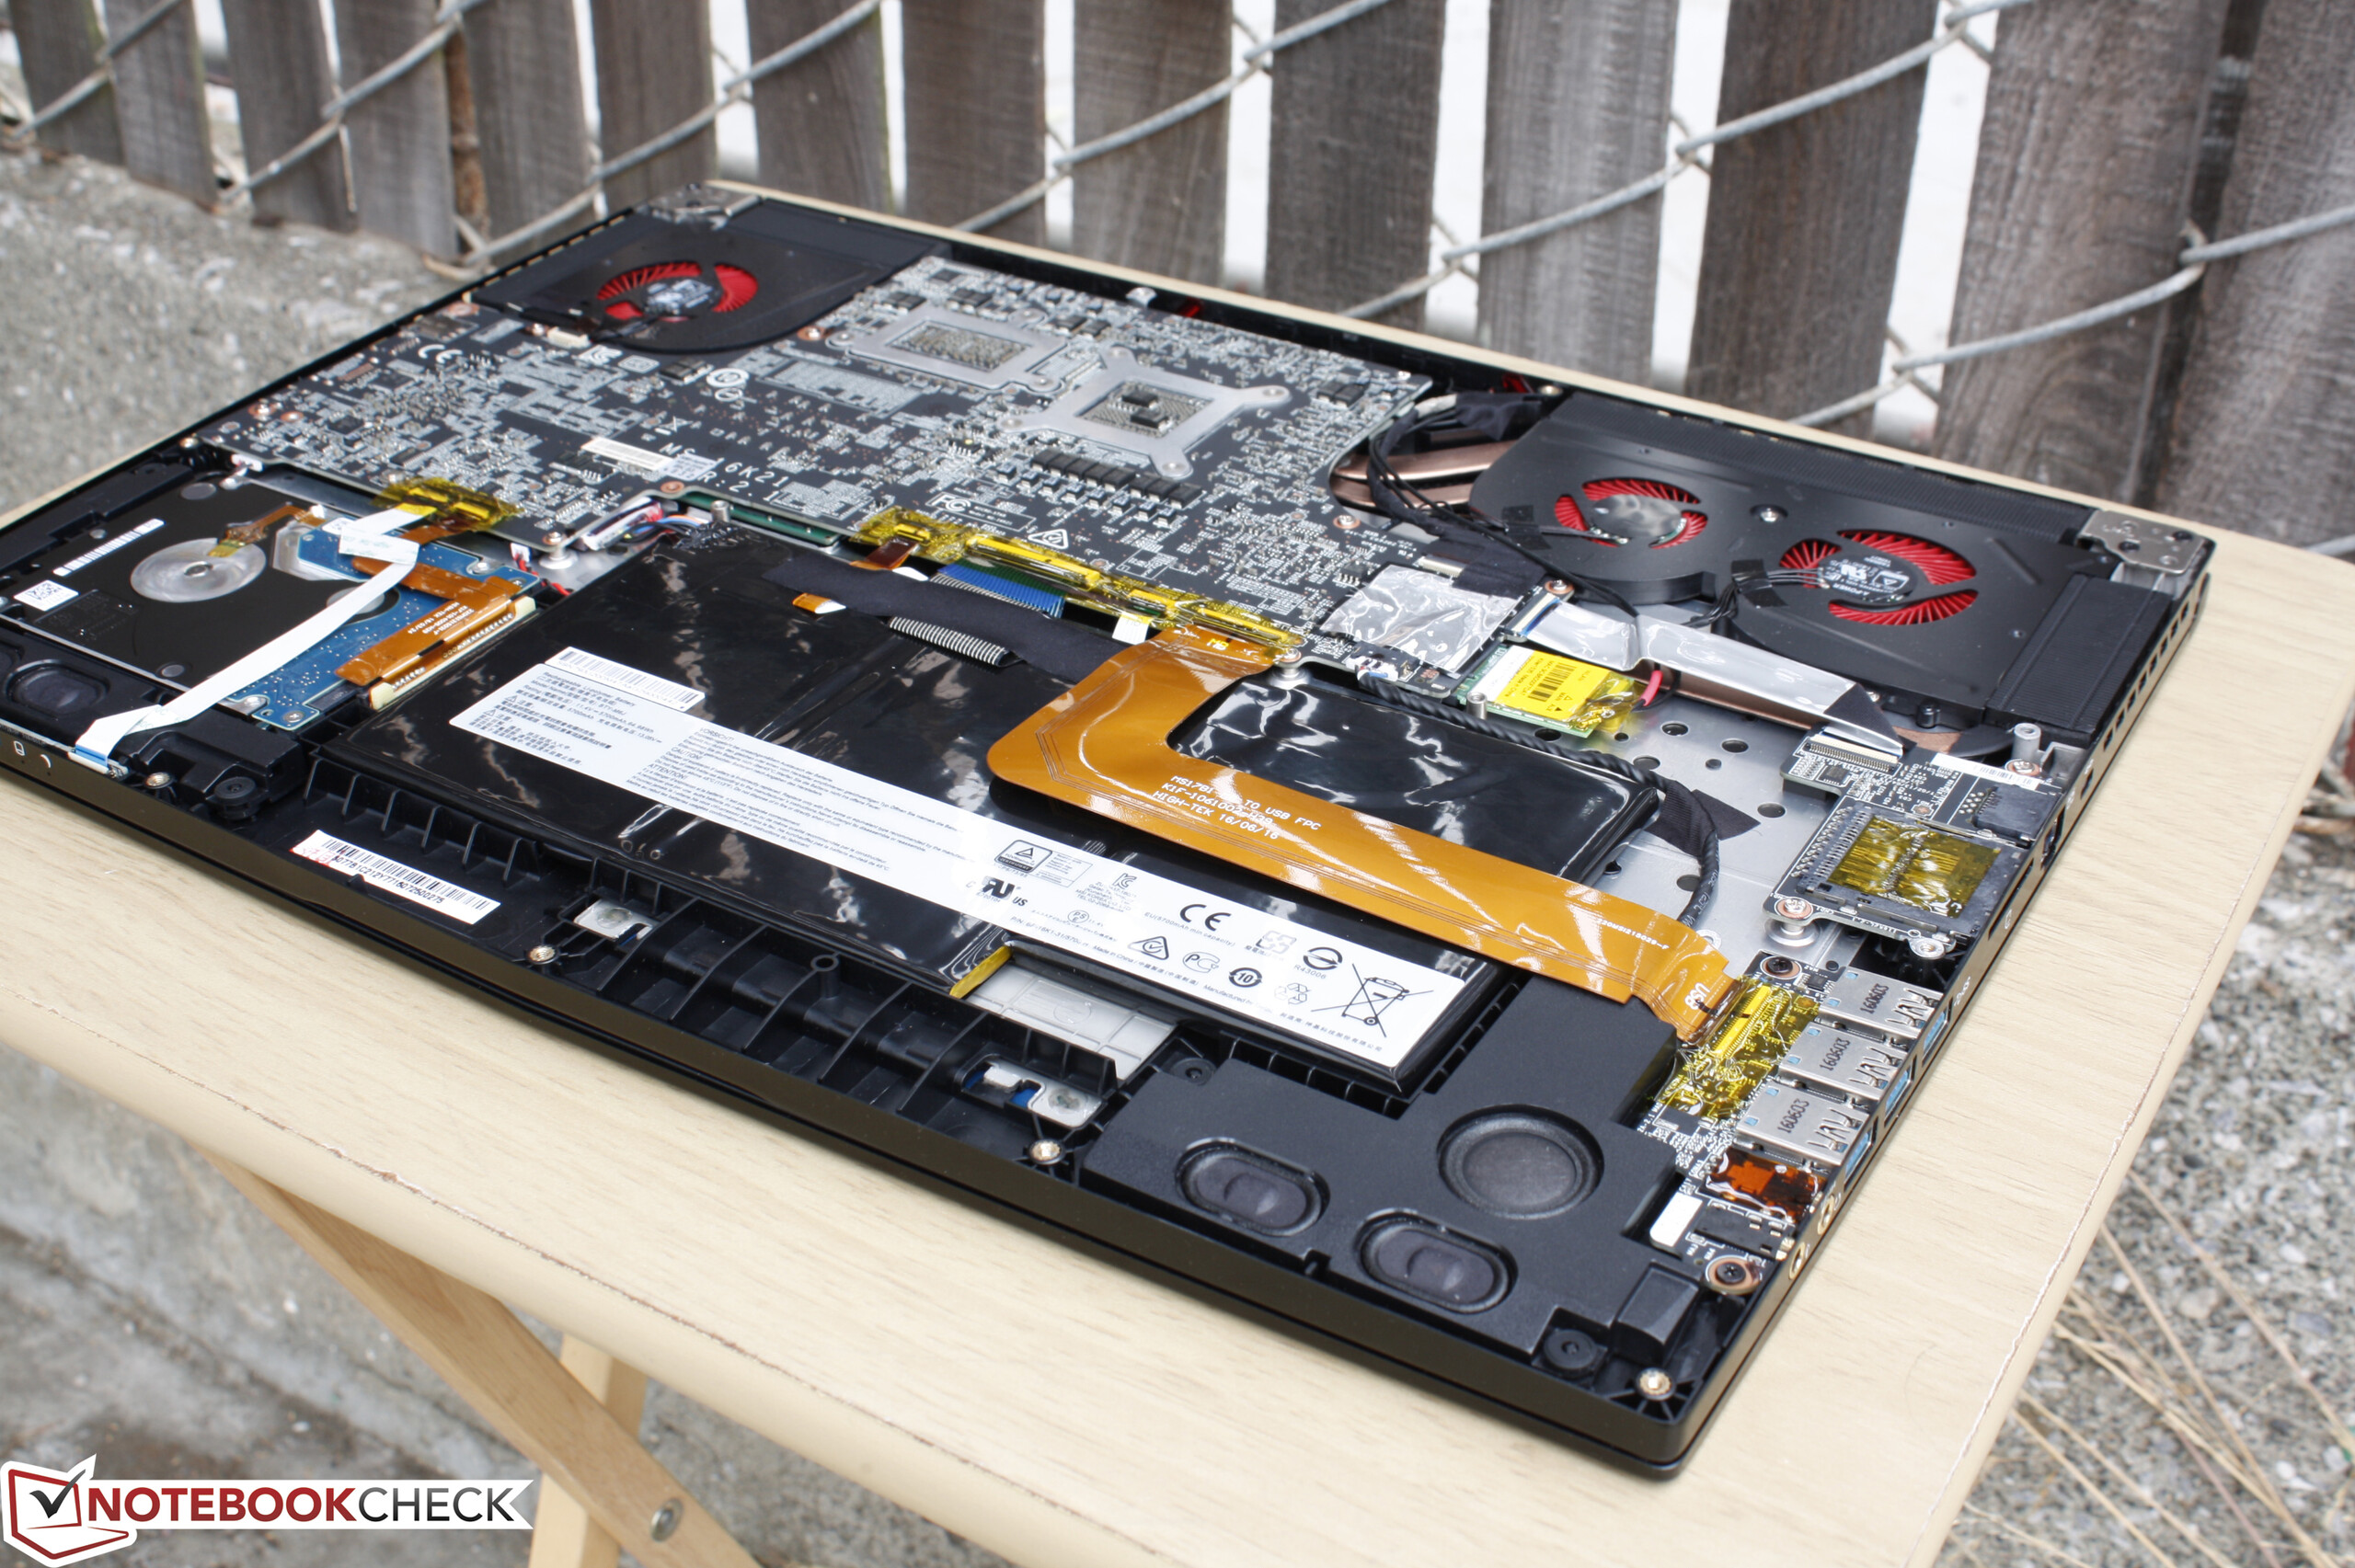
O desempenho claramente não é um problema para a série, mas suas principais desvantagens continuam a ser o ruído de alta frequência e a curta duração de sua bateria. É mais silencioso, sim, mas apenas um pouco mais que o GS70 e a duração da bateria não melhor de forma significativa. Os reclamos menores incluem as portas que estão um pouco perto demais e alguns componentes internos inacessíveis, incluindo o SSD M.2 principal e slots SODIMM. Também é um apenas que a remoção do painel inferior automaticamente anule a garantia, dado que os usuários poderiam trocar a unidade secundária à vontade. O lento leitor de cartões SDXC é outro ponto negativo, com taxas de leitura que são muitas vezes mais lentas que no GT72VR. Algumas teclas Macro dedicadas ou 4K com G-Sync teriam tornado o sistema uma experiência de jogo mais "completa".
O sistema é um passo significante para frente para a série como um todo com Pascal e opções de tela de 120 Hz/5 ms sendo as alternativas na categoria. Os usuários à procura de portáteis Maxwell mais grossos deveriam considerar seriamente a série GS73 dado que não sacrifica desempenho, apesar do que o seu design muito fino e baixo peso poderiam sugerir. Ruído do sistema e opções capacidade de expansibilidade e de manutenção mais limitada ainda são os principais motivos para considerar os portáteis maiores e mais pesados.
MSI GS73VR 6RF
- 09/13/2016 v5.1 (old)
Allen Ngo
Price comparison
