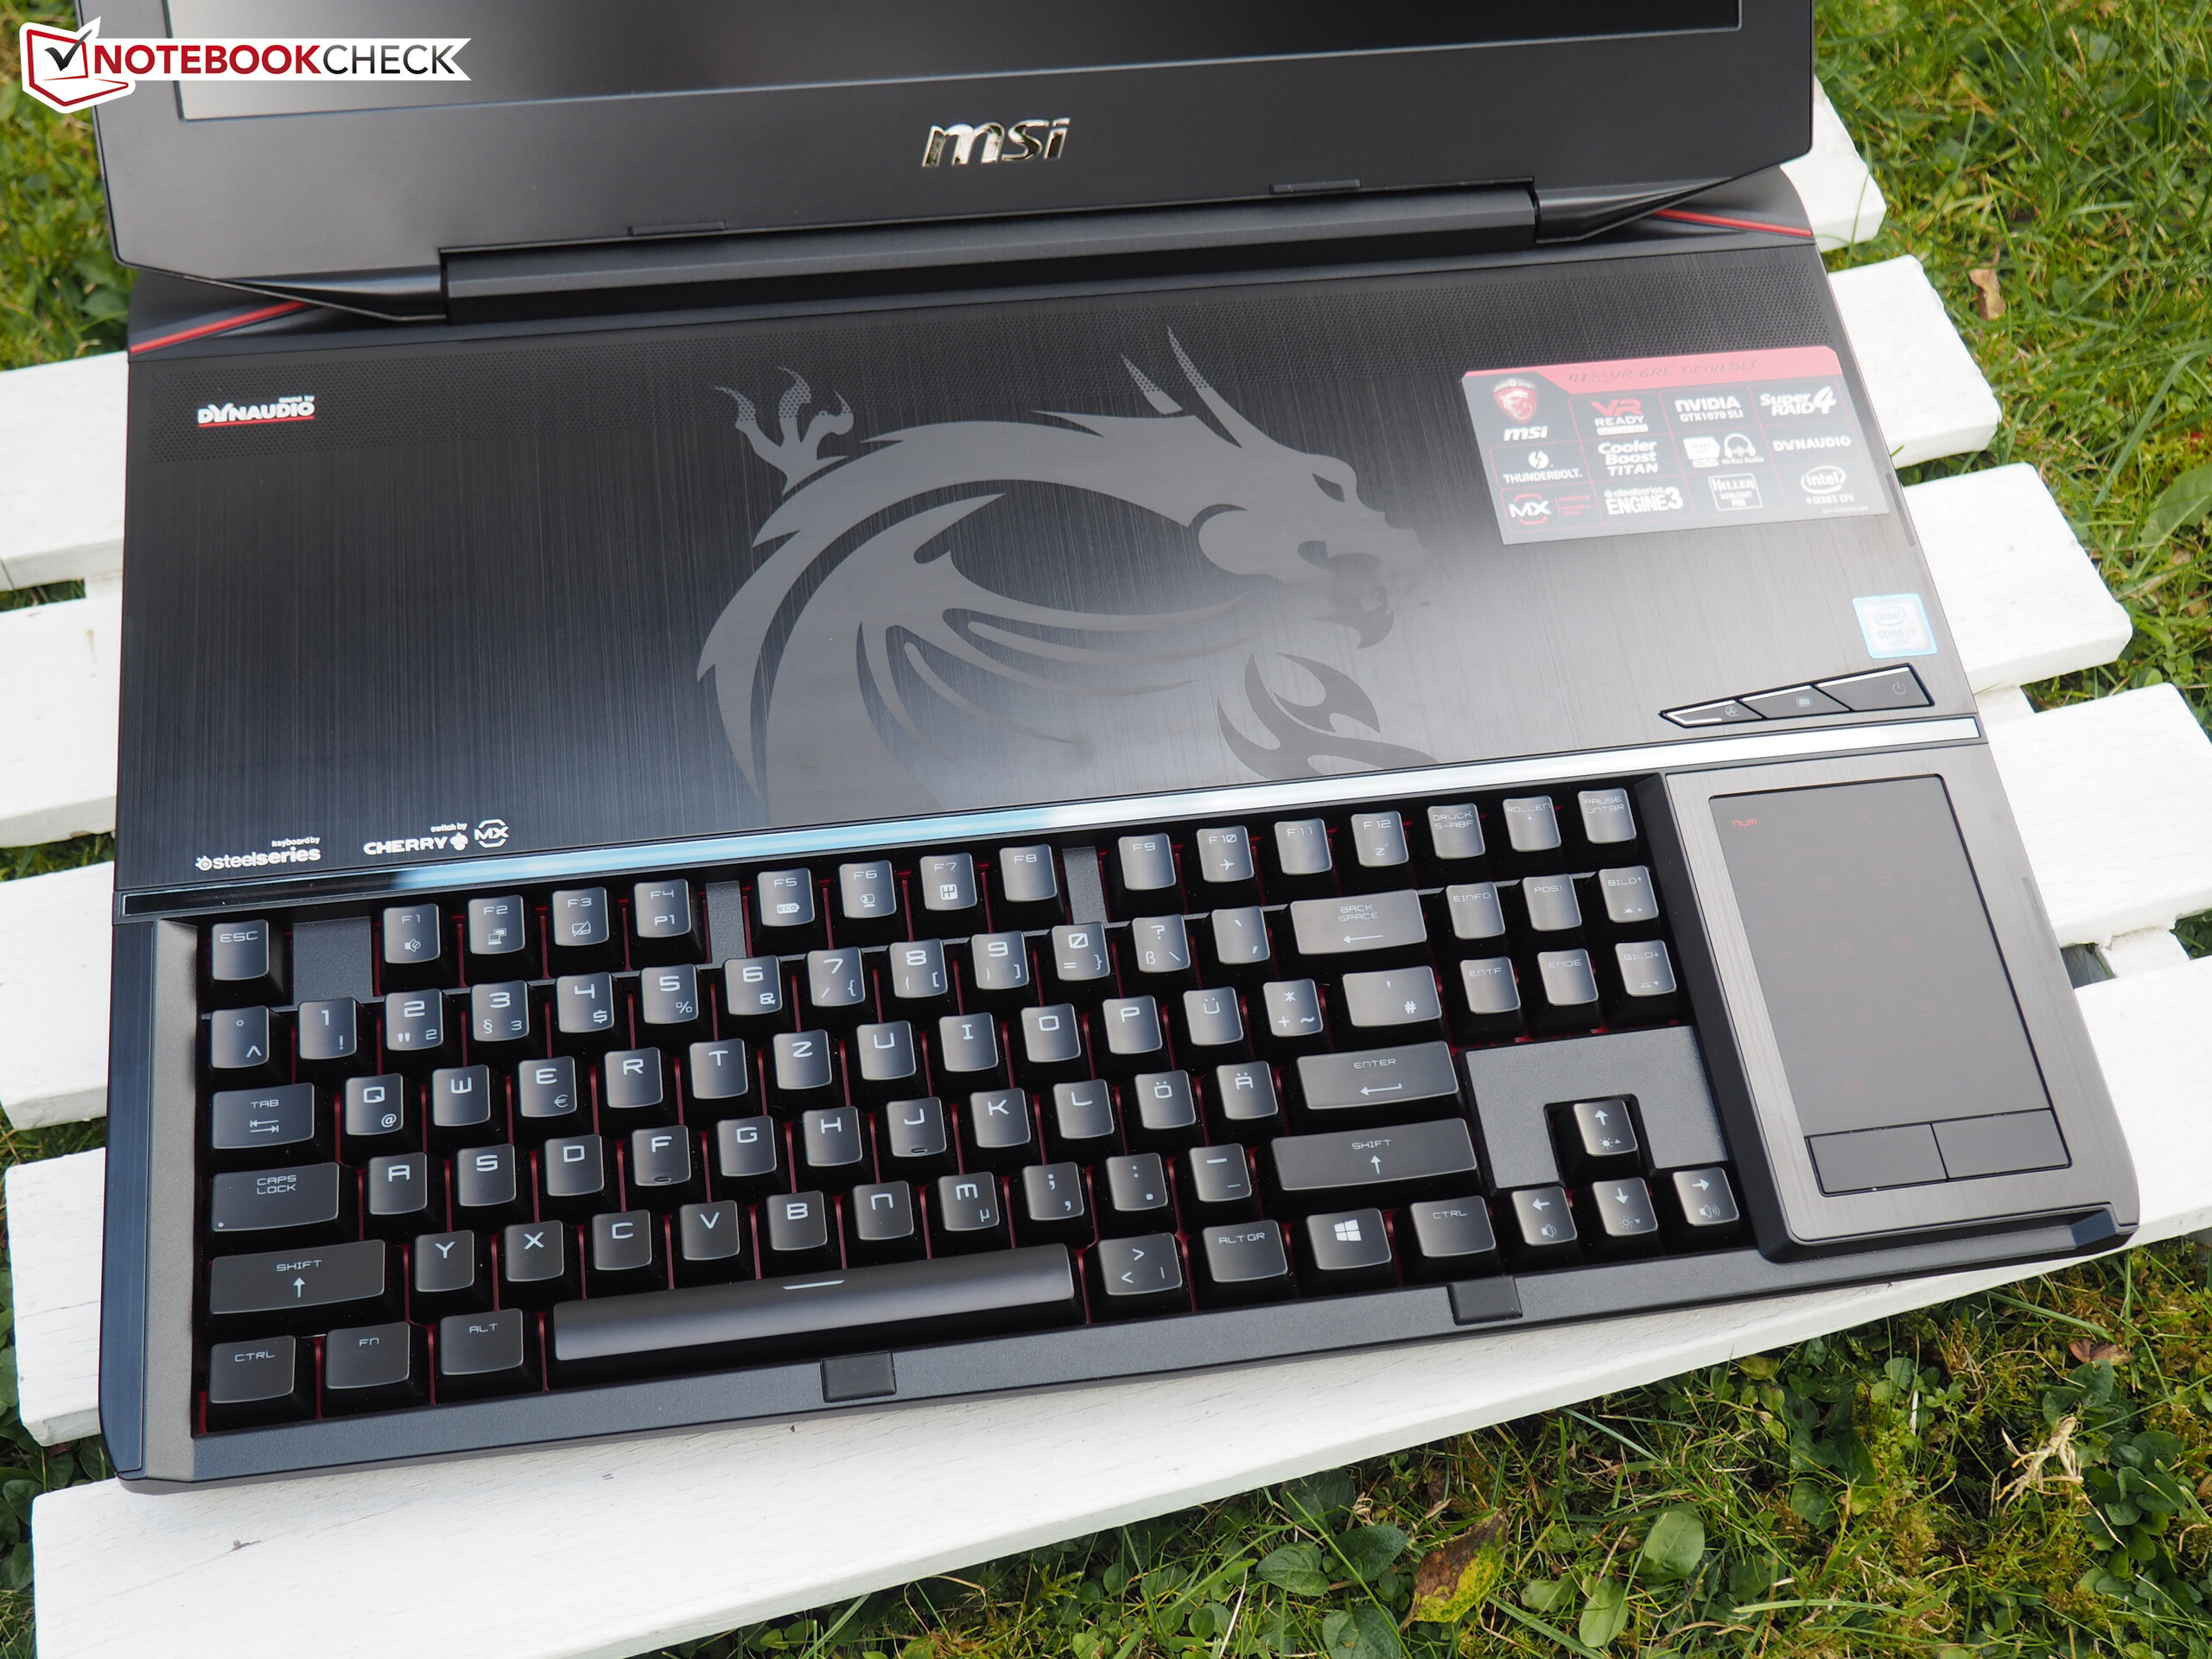
Breve Análise do Portátil MSI GT83VR 7RF (7920HQ, GTX 1080 SLI, Full HD)
| SD Card Reader | |
| average JPG Copy Test (av. of 3 runs) | |
| Asus G701VIK-BA049T | |
| MSI GT73VR 7RF-296 | |
| Schenker XMG U727 2017 | |
| MSI GT83VR-6RE32SR451 | |
| MSI GT83VR 7RF-206 Titan SLI | |
| Acer Predator 17 X GX-792-76DL | |
| maximum AS SSD Seq Read Test (1GB) | |
| Asus G701VIK-BA049T | |
| MSI GT73VR 7RF-296 | |
| Schenker XMG U727 2017 | |
| MSI GT83VR 7RF-206 Titan SLI | |
| MSI GT83VR-6RE32SR451 | |
| Acer Predator 17 X GX-792-76DL | |
| |||||||||||||||||||||||||
iluminação: 83 %
iluminação com acumulador: 266 cd/m²
Contraste: 760:1 (Preto: 0.35 cd/m²)
ΔE ColorChecker Calman: 3.88 | ∀{0.5-29.43 Ø4.71}
ΔE Greyscale Calman: 5.2 | ∀{0.09-98 Ø4.96}
91% sRGB (Argyll 1.6.3 3D)
59% AdobeRGB 1998 (Argyll 1.6.3 3D)
66.4% AdobeRGB 1998 (Argyll 3D)
90.8% sRGB (Argyll 3D)
65.7% Display P3 (Argyll 3D)
Gamma: 2.41
CCT: 7680 K
| MSI GT83VR 7RF-206 Titan SLI Samsung 184HL (SDC4C48), 1920x1080, 18.4" | MSI GT83VR-6RE32SR451 Samsung 184HL (SDC4C48), 1920x1080, 18.4" | Schenker XMG U727 2017 AU Optronics B173ZAN01.0 (AUO109B), 3840x2160, 17.3" | Acer Predator 17 X GX-792-76DL LP173WF4-SPF5 (LGD056D), 1920x1080, 17.3" | Asus G701VIK-BA049T B173HAN01.1 (AUO119D), 1920x1080, 17.3" | MSI GT73VR 7RF-296 N173HHE-G32 (CMN1747), 1920x1080, 17.3" | |
|---|---|---|---|---|---|---|
| Display | -0% | 31% | -5% | -0% | 25% | |
| Display P3 Coverage (%) | 65.7 | 65.8 0% | 86.6 32% | 66 0% | 68.8 5% | 90.6 38% |
| sRGB Coverage (%) | 90.8 | 90.3 -1% | 99.9 10% | 83.7 -8% | 87.7 -3% | 99.9 10% |
| AdobeRGB 1998 Coverage (%) | 66.4 | 66.1 0% | 99.5 50% | 61.2 -8% | 64.1 -3% | 84.7 28% |
| Response Times | 8% | -16% | -17% | 9% | 52% | |
| Response Time Grey 50% / Grey 80% * (ms) | 38.4 ? | 37 ? 4% | 44 ? -15% | 45 ? -17% | 38 ? 1% | 26 ? 32% |
| Response Time Black / White * (ms) | 24 ? | 21 ? 12% | 28 ? -17% | 28 ? -17% | 20 ? 17% | 7 ? 71% |
| PWM Frequency (Hz) | 250 ? | 250 ? | ||||
| Screen | 20% | 31% | 14% | 15% | -18% | |
| Brightness middle (cd/m²) | 266 | 310 17% | 362 36% | 380 43% | 306 15% | 307 15% |
| Brightness (cd/m²) | 243 | 277 14% | 344 42% | 362 49% | 299 23% | 284 17% |
| Brightness Distribution (%) | 83 | 84 1% | 85 2% | 91 10% | 91 10% | 85 2% |
| Black Level * (cd/m²) | 0.35 | 0.4 -14% | 0.35 -0% | 0.37 -6% | 0.27 23% | 0.25 29% |
| Contrast (:1) | 760 | 775 2% | 1034 36% | 1027 35% | 1133 49% | 1228 62% |
| Colorchecker dE 2000 * | 3.88 | 1.83 53% | 2.46 37% | 4.12 -6% | 3.98 -3% | 9.65 -149% |
| Colorchecker dE 2000 max. * | 8.31 | 3.92 53% | 4.26 49% | 8.19 1% | 7.29 12% | 16.36 -97% |
| Greyscale dE 2000 * | 5.2 | 1.38 73% | 2.9 44% | 3.95 24% | 4.15 20% | 10.07 -94% |
| Gamma | 2.41 91% | 2.44 90% | 2.31 95% | 2.47 89% | 2.45 90% | 2.12 104% |
| CCT | 7680 85% | 6723 97% | 6120 106% | 6539 99% | 7386 88% | 12145 54% |
| Color Space (Percent of AdobeRGB 1998) (%) | 59 | 59 0% | 88 49% | 55 -7% | 58 -2% | 75 27% |
| Color Space (Percent of sRGB) (%) | 91 | 90 -1% | 100 10% | 84 -8% | 89 -2% | 100 10% |
| Média Total (Programa/Configurações) | 9% /
14% | 15% /
24% | -3% /
6% | 8% /
11% | 20% /
0% |
* ... menor é melhor
Exibir tempos de resposta
| ↔ Tempo de resposta preto para branco | ||
|---|---|---|
| 24 ms ... ascensão ↗ e queda ↘ combinadas | ↗ 14.8 ms ascensão | 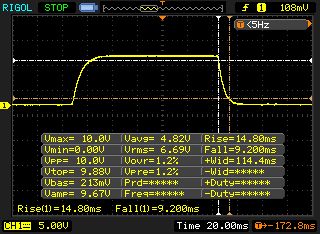 |
| ↘ 9.2 ms queda | ||
| A tela mostra boas taxas de resposta em nossos testes, mas pode ser muito lenta para jogadores competitivos. Em comparação, todos os dispositivos testados variam de 0.1 (mínimo) a 240 (máximo) ms. » 54 % de todos os dispositivos são melhores. Isso significa que o tempo de resposta medido é pior que a média de todos os dispositivos testados (19.8 ms). | ||
| ↔ Tempo de resposta 50% cinza a 80% cinza | ||
| 38.4 ms ... ascensão ↗ e queda ↘ combinadas | ↗ 18.8 ms ascensão | 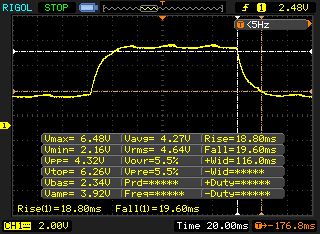 |
| ↘ 19.6 ms queda | ||
| A tela mostra taxas de resposta lentas em nossos testes e será insatisfatória para os jogadores. Em comparação, todos os dispositivos testados variam de 0.165 (mínimo) a 636 (máximo) ms. » 58 % de todos os dispositivos são melhores. Isso significa que o tempo de resposta medido é pior que a média de todos os dispositivos testados (31 ms). | ||
Cintilação da tela / PWM (modulação por largura de pulso)
| Tela tremeluzindo/PWM detectado | 250 Hz | ≤ 90 % configuração de brilho | 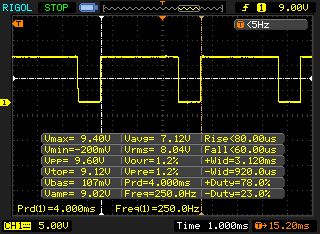 |
A luz de fundo da tela pisca em 250 Hz (pior caso, por exemplo, utilizando PWM) Cintilação detectada em uma configuração de brilho de 90 % e abaixo. Não deve haver cintilação ou PWM acima desta configuração de brilho. A frequência de 250 Hz é relativamente baixa, portanto, usuários sensíveis provavelmente notarão cintilação e sentirão fadiga ocular na configuração de brilho indicada e abaixo. [pwm_comparison] Em comparação: 52 % de todos os dispositivos testados não usam PWM para escurecer a tela. Se PWM foi detectado, uma média de 7754 (mínimo: 5 - máximo: 343500) Hz foi medida. | |||
| PCMark 8 | |
| Home Score Accelerated v2 | |
| Acer Predator 17 X GX-792-76DL | |
| Asus G701VIK-BA049T | |
| MSI GT83VR-6RE32SR451 | |
| MSI GT83VR 7RF-206 Titan SLI | |
| Schenker XMG U727 2017 | |
| Work Score Accelerated v2 | |
| Acer Predator 17 X GX-792-76DL | |
| Asus G701VIK-BA049T | |
| MSI GT83VR-6RE32SR451 | |
| MSI GT83VR 7RF-206 Titan SLI | |
| Schenker XMG U727 2017 | |
| PCMark 8 Home Score Accelerated v2 | 5159 pontos | |
| PCMark 8 Work Score Accelerated v2 | 5487 pontos | |
| PCMark 10 Score | 5489 pontos | |
Ajuda | ||
| MSI GT83VR 7RF-206 Titan SLI 2x Toshiba NVMe THNSN5256GPU7 (RAID 0) | MSI GT83VR-6RE32SR451 2x Samsung SM951 MZVPV256HDGL (RAID 0) | Schenker XMG U727 2017 Samsung SM961 MZVPW256 m.2 PCI-e | Acer Predator 17 X GX-792-76DL Toshiba NVMe THNSN5512GPU7 | Asus G701VIK-BA049T 2x Samsung SM961 MZVPW256HEGL NVMe (RAID 0) | MSI GT73VR 7RF-296 2x Samsung SM951 MZVPV256HDGL (RAID 0) | |
|---|---|---|---|---|---|---|
| CrystalDiskMark 3.0 | 5% | -7% | -16% | 19% | 13% | |
| Read Seq (MB/s) | 3045 | 3284 8% | 1781 -42% | 1494 -51% | 3487 15% | 3219 6% |
| Write Seq (MB/s) | 2149 | 2548 19% | 1515 -30% | 1371 -36% | 2690 25% | 2572 20% |
| Read 512 (MB/s) | 1774 | 1728 -3% | 371.4 -79% | 898 -49% | 1499 -16% | 1776 0% |
| Write 512 (MB/s) | 1788 | 2352 32% | 1073 -40% | 1273 -29% | 2493 39% | 2445 37% |
| Read 4k (MB/s) | 40.84 | 50.1 23% | 61.5 51% | 43.82 7% | 53.7 31% | 51.1 25% |
| Write 4k (MB/s) | 138.9 | 137.6 -1% | 195.6 41% | 161.6 16% | 133.2 -4% | 141.3 2% |
| Read 4k QD32 (MB/s) | 635 | 506 -20% | 755 19% | 669 5% | 795 25% | 658 4% |
| Write 4k QD32 (MB/s) | 512 | 435.4 -15% | 642 25% | 552 8% | 699 37% | 554 8% |

| 3DMark - 1920x1080 Fire Strike Graphics | |
| MSI GT83VR 7RF-206 Titan SLI | |
| MSI GT83VR-6RE32SR451 | |
| Asus G701VIK-BA049T | |
| Acer Predator 17 X GX-792-76DL | |
| Schenker XMG U727 2017 | |
| MSI GT73VR 7RF-296 | |
| 3DMark 11 - 1280x720 Performance GPU | |
| MSI GT83VR 7RF-206 Titan SLI | |
| MSI GT83VR-6RE32SR451 | |
| Asus G701VIK-BA049T | |
| Schenker XMG U727 2017 | |
| MSI GT73VR 7RF-296 | |
| Acer Predator 17 X GX-792-76DL | |
| 3DMark 11 Performance | 25018 pontos | |
| 3DMark Ice Storm Standard Score | 161549 pontos | |
| 3DMark Cloud Gate Standard Score | 32233 pontos | |
| 3DMark Fire Strike Score | 22192 pontos | |
Ajuda | ||
| The Witcher 3 | |
| 3840x2160 High Graphics & Postprocessing (Nvidia HairWorks Off) | |
| MSI GT83VR 7RF-206 Titan SLI | |
| Schenker XMG U727 2017 | |
| 1920x1080 Ultra Graphics & Postprocessing (HBAO+) | |
| MSI GT83VR 7RF-206 Titan SLI | |
| Schenker XMG U727 2017 | |
| Deus Ex Mankind Divided - 1920x1080 Ultra Preset AA:2xMS AF:8x | |
| MSI GT83VR 7RF-206 Titan SLI | |
| Battlefield 1 | |
| 3840x2160 High Preset AA:T | |
| MSI GT83VR 7RF-206 Titan SLI | |
| Schenker XMG U727 2017 | |
| 1920x1080 Ultra Preset AA:T | |
| MSI GT83VR 7RF-206 Titan SLI | |
| Schenker XMG U727 2017 | |
| Titanfall 2 | |
| 3840x2160 High / Enabled AA:TS AF:8x | |
| MSI GT83VR 7RF-206 Titan SLI | |
| Schenker XMG U727 2017 | |
| 1920x1080 Very High (Insane Texture Quality) / Enabled AA:TS AF:16x | |
| MSI GT83VR 7RF-206 Titan SLI | |
| Schenker XMG U727 2017 | |
| Call of Duty Infinite Warfare | |
| 3840x2160 High / On AA:FX | |
| MSI GT83VR 7RF-206 Titan SLI | |
| Schenker XMG U727 2017 | |
| 1920x1080 Ultra / On AA:T2X SM | |
| MSI GT83VR 7RF-206 Titan SLI | |
| Schenker XMG U727 2017 | |
| Dishonored 2 | |
| 3840x2160 High Preset AA:TX | |
| MSI GT83VR 7RF-206 Titan SLI | |
| Schenker XMG U727 2017 | |
| 1920x1080 Ultra Preset AA:TX | |
| Schenker XMG U727 2017 | |
| MSI GT83VR 7RF-206 Titan SLI | |
| Watch Dogs 2 | |
| 3840x2160 High Preset | |
| MSI GT83VR 7RF-206 Titan SLI | |
| Schenker XMG U727 2017 | |
| 1920x1080 Ultra Preset | |
| MSI GT83VR 7RF-206 Titan SLI | |
| Schenker XMG U727 2017 | |
| Resident Evil 7 | |
| 3840x2160 High / On AA:FXAA+T | |
| Desktop PC | |
| MSI GT83VR 7RF-206 Titan SLI | |
| Schenker XMG U727 2017 | |
| 1920x1080 Very High / On AA:FXAA+T | |
| Desktop PC | |
| Schenker XMG U727 2017 | |
| MSI GT83VR 7RF-206 Titan SLI | |
| For Honor | |
| 3840x2160 High Preset AA:T AF:8x | |
| MSI GT83VR 7RF-206 Titan SLI | |
| Desktop PC | |
| Schenker XMG U727 2017 | |
| 1920x1080 Extreme Preset AA:T AF:16x | |
| MSI GT83VR 7RF-206 Titan SLI | |
| Desktop PC | |
| Schenker XMG U727 2017 | |
| Ghost Recon Wildlands | |
| 3840x2160 Very High Preset AA:T AF:8x | |
| MSI GT83VR 7RF-206 Titan SLI | |
| Desktop PC | |
| 1920x1080 Ultra Preset AA:T AF:16x | |
| MSI GT83VR 7RF-206 Titan SLI | |
| Desktop PC | |
| Mass Effect Andromeda | |
| 3840x2160 High Preset (Resolution Scale Mode off) AA:T | |
| MSI GT83VR 7RF-206 Titan SLI | |
| Desktop PC | |
| 1920x1080 Ultra Preset (Resolution Scale Mode off) AA:T | |
| Desktop PC | |
| MSI GT83VR 7RF-206 Titan SLI | |
| Warhammer 40.000: Dawn of War III | |
| 3840x2160 High / On (100 % Gameplay Resolution) AA:High | |
| MSI GT83VR 7RF-206 Titan SLI | |
| Desktop PC | |
| 1920x1080 Maximum / On (100 % Gameplay Resolution) AA:High | |
| MSI GT83VR 7RF-206 Titan SLI | |
| Desktop PC | |
| Prey | |
| 3840x2160 High Preset AA:2TX SM AF:8x | |
| MSI GT83VR 7RF-206 Titan SLI | |
| Desktop PC | |
| 1920x1080 Very High Preset AA:2TX SM AF:16x | |
| Desktop PC | |
| MSI GT83VR 7RF-206 Titan SLI | |
| Rocket League | |
| 3840x2160 High Quality AA:High FX | |
| MSI GT83VR 7RF-206 Titan SLI | |
| Desktop PC | |
| 1920x1080 High Quality AA:High FX | |
| Desktop PC | |
| MSI GT83VR 7RF-206 Titan SLI | |
| Dirt 4 - 1920x1080 Ultra Preset AA:4xMS AF:16x | |
| Desktop PC | |
| MSI GT83VR 7RF-206 Titan SLI | |
| baixo | média | alto | ultra | 4K | |
|---|---|---|---|---|---|
| The Witcher 3 (2015) | 181 | 115 | 89.2 | ||
| Deus Ex Mankind Divided (2016) | 79.7 | 73.3 | |||
| Battlefield 1 (2016) | 157 | 145 | 76.7 | ||
| Titanfall 2 (2016) | 144 | 143 | 74.2 | ||
| Call of Duty Infinite Warfare (2016) | 124 | 124 | 76.1 | ||
| Dishonored 2 (2016) | 88.1 | 77.4 | 71.2 | ||
| Watch Dogs 2 (2016) | 118 | 102 | 75.6 | ||
| Resident Evil 7 (2017) | 192 | 162 | 56.3 | ||
| For Honor (2017) | 194 | 182 | 108 | ||
| Ghost Recon Wildlands (2017) | 122 | 82.7 | 65.4 | ||
| Mass Effect Andromeda (2017) | 89 | 83.6 | 60 | ||
| Warhammer 40.000: Dawn of War III (2017) | 100 | 97.4 | 79.8 | ||
| Prey (2017) | 143 | 141 | 83.9 | ||
| Rocket League (2017) | 232 | 169 | |||
| Dirt 4 (2017) | 134 | 84.1 |
Barulho
| Ocioso |
| 35 / 38 / 41 dB |
| DVD |
| 38 / dB |
| Carga |
| 52 / 59 dB |
 | ||
30 dB silencioso 40 dB(A) audível 50 dB(A) ruidosamente alto |
||
min: | ||
| MSI GT83VR 7RF-206 Titan SLI GeForce GTX 1080 SLI (Laptop), i7-7920HQ | MSI GT83VR-6RE32SR451 GeForce GTX 1070 SLI (Laptop), 6820HK | Schenker XMG U727 2017 GeForce GTX 1080 Mobile, i7-7700K | Acer Predator 17 X GX-792-76DL GeForce GTX 1080 Mobile, i7-7820HK | Asus G701VIK-BA049T GeForce GTX 1080 Mobile, i7-7820HK | MSI GT73VR 7RF-296 GeForce GTX 1080 Mobile, i7-7820HK | |
|---|---|---|---|---|---|---|
| Noise | 8% | 9% | 11% | 10% | 9% | |
| desligado / ambiente * (dB) | 31 | 30 3% | 30 3% | 30 3% | 30 3% | 30 3% |
| Idle Minimum * (dB) | 35 | 33 6% | 31 11% | 33 6% | 30 14% | 34 3% |
| Idle Average * (dB) | 38 | 34 11% | 34 11% | 35 8% | 31 18% | 35 8% |
| Idle Maximum * (dB) | 41 | 35 15% | 37 10% | 37 10% | 36 12% | 37 10% |
| Load Average * (dB) | 52 | 48 8% | 44 15% | 40 23% | 47 10% | 39 25% |
| Witcher 3 ultra * (dB) | 53 | 51 4% | ||||
| Load Maximum * (dB) | 59 | 57 3% | 52 12% | 50 15% | 56 5% | 56 5% |
* ... menor é melhor
(-) A temperatura máxima no lado superior é 46 °C / 115 F, em comparação com a média de 40.4 °C / 105 F , variando de 21.2 a 68.8 °C para a classe Gaming.
(-) A parte inferior aquece até um máximo de 53 °C / 127 F, em comparação com a média de 43.2 °C / 110 F
(+) Em uso inativo, a temperatura média para o lado superior é 29.7 °C / 85 F, em comparação com a média do dispositivo de 33.9 °C / ### class_avg_f### F.
(±) Jogando The Witcher 3, a temperatura média para o lado superior é 35.7 °C / 96 F, em comparação com a média do dispositivo de 33.9 °C / ## #class_avg_f### F.
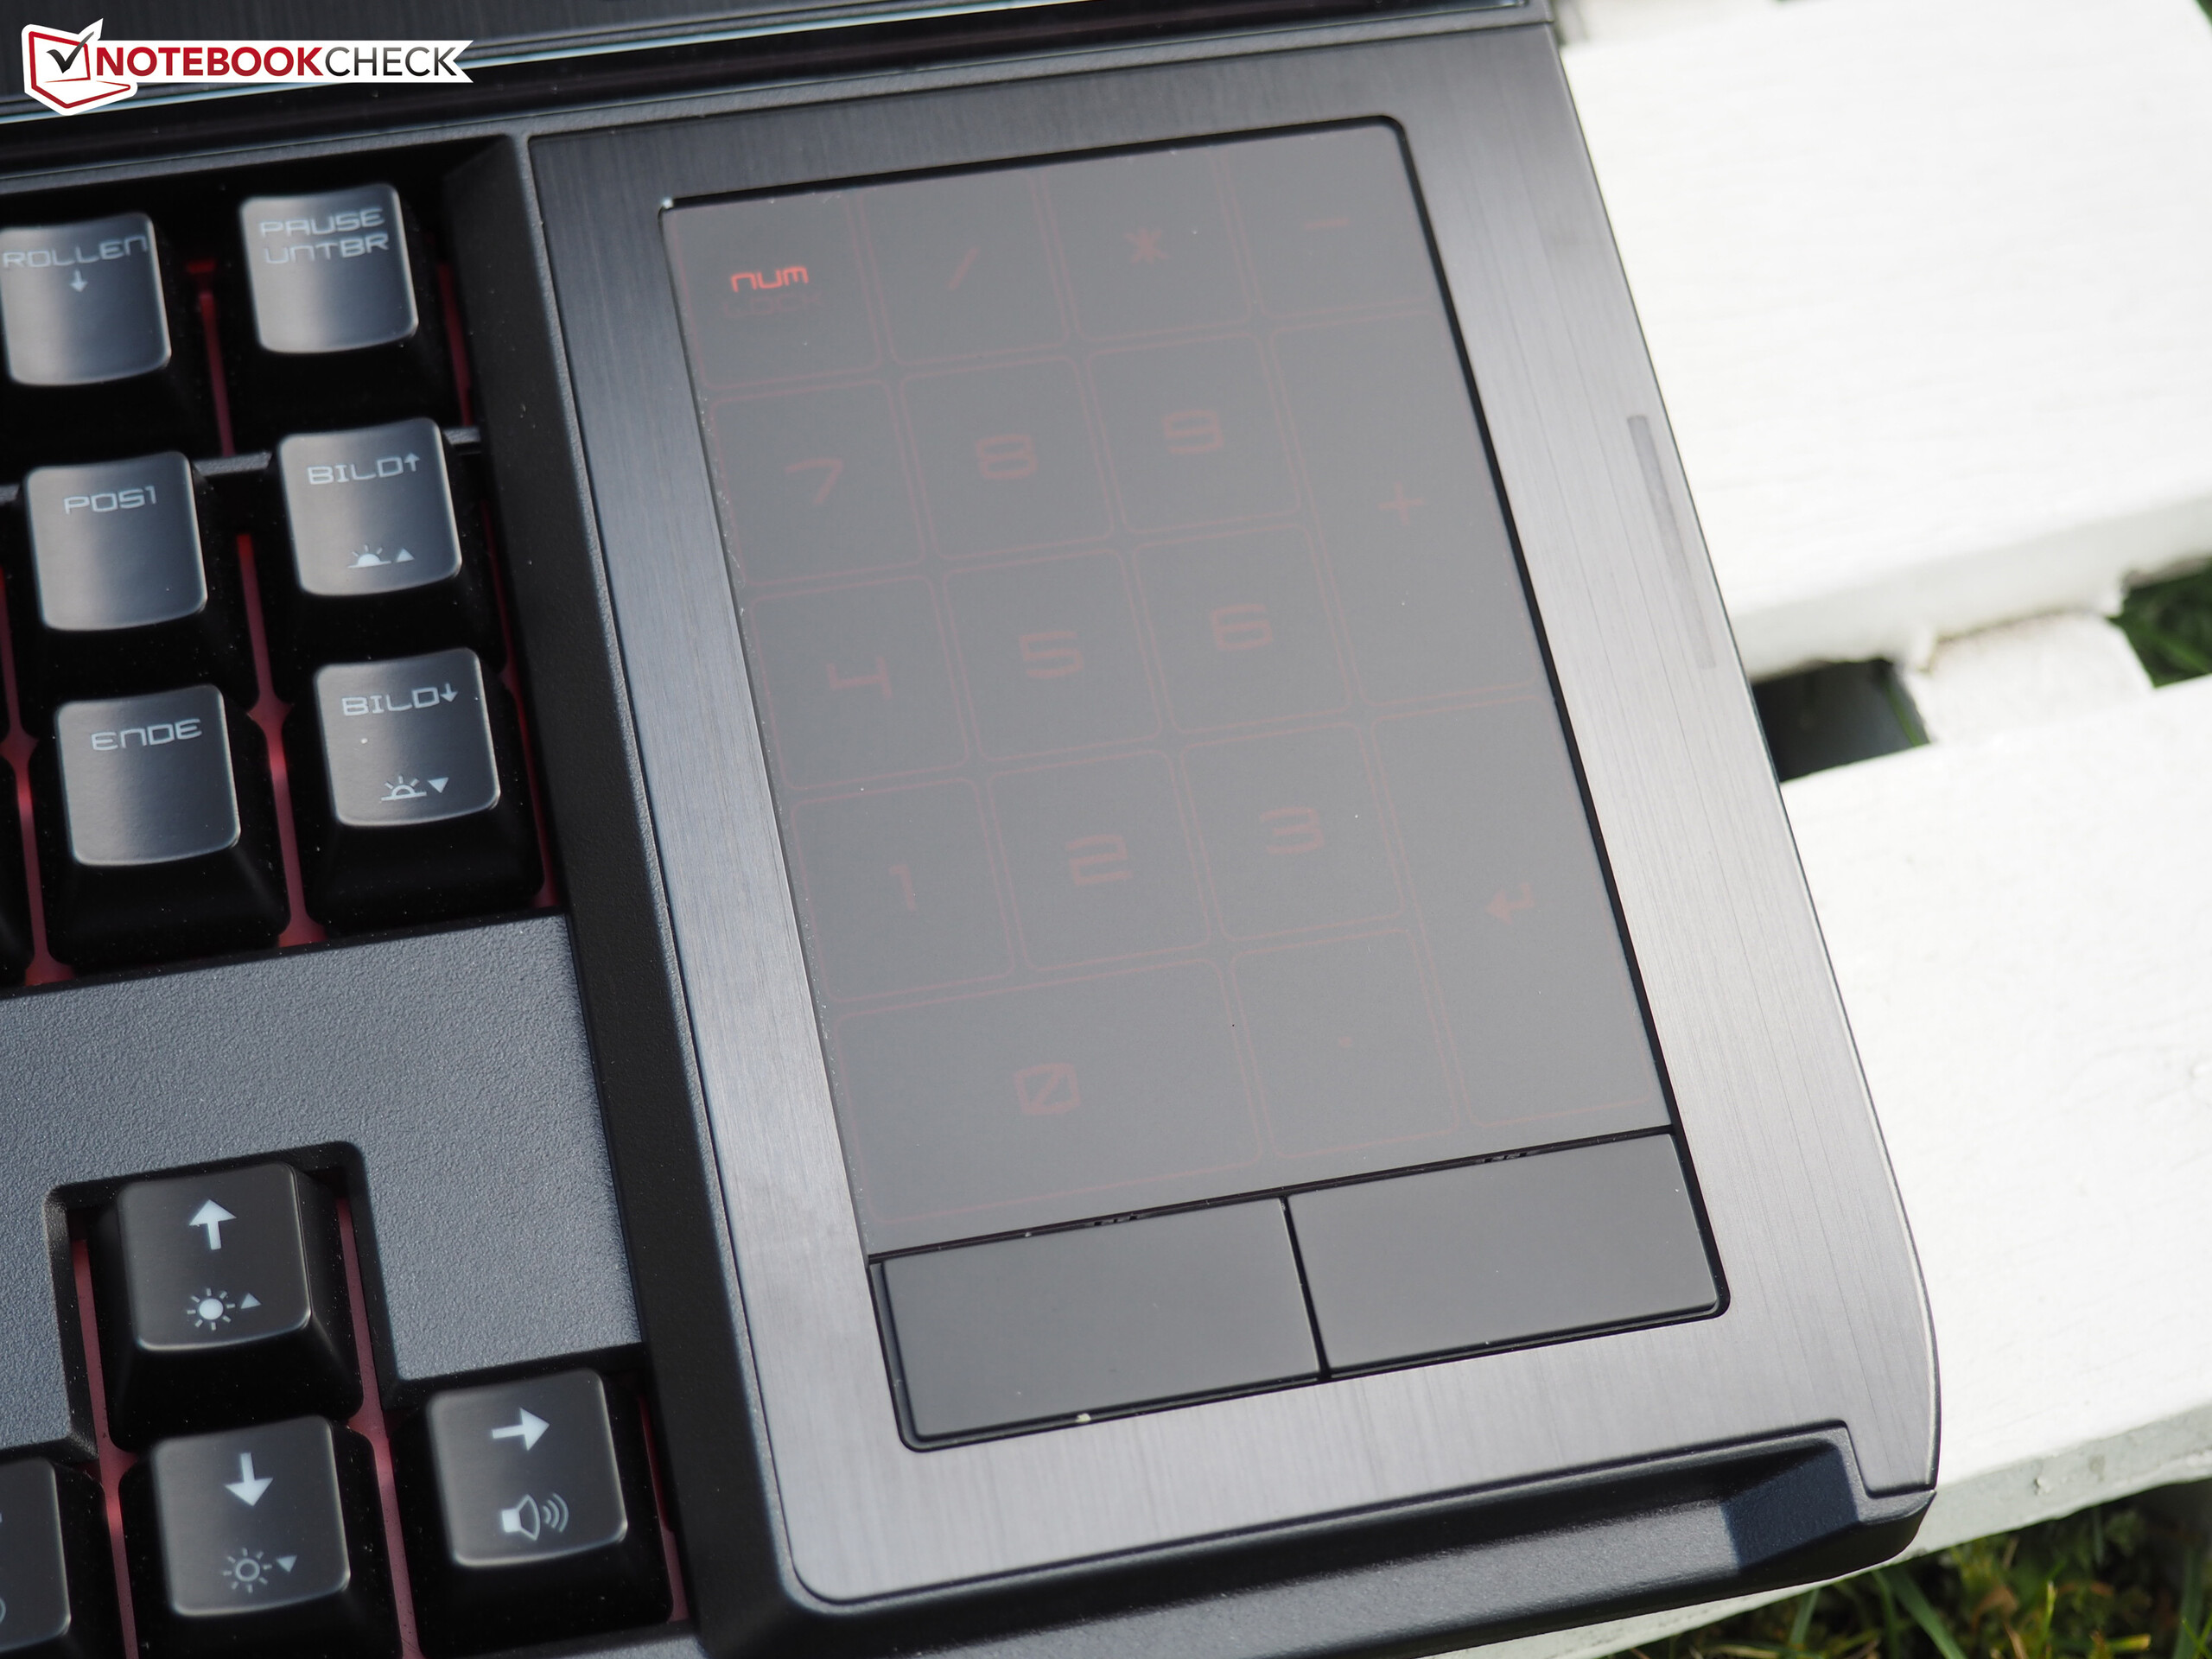
(+) Os apoios para as mãos e o touchpad são mais frios que a temperatura da pele, com um máximo de 26 °C / 78.8 F e, portanto, são frios ao toque.
(+) A temperatura média da área do apoio para as mãos de dispositivos semelhantes foi 28.8 °C / 83.8 F (+2.8 °C / 5 F).
| MSI GT83VR 7RF-206 Titan SLI GeForce GTX 1080 SLI (Laptop), i7-7920HQ | MSI GT83VR-6RE32SR451 GeForce GTX 1070 SLI (Laptop), 6820HK | Schenker XMG U727 2017 GeForce GTX 1080 Mobile, i7-7700K | Acer Predator 17 X GX-792-76DL GeForce GTX 1080 Mobile, i7-7820HK | Asus G701VIK-BA049T GeForce GTX 1080 Mobile, i7-7820HK | MSI GT73VR 7RF-296 GeForce GTX 1080 Mobile, i7-7820HK | |
|---|---|---|---|---|---|---|
| Heat | 22% | -8% | 3% | 4% | 12% | |
| Maximum Upper Side * (°C) | 46 | 35.8 22% | 47.5 -3% | 44.2 4% | 50.9 -11% | 39.8 13% |
| Maximum Bottom * (°C) | 53 | 42.8 19% | 56 -6% | 43 19% | 44.6 16% | 47.8 10% |
| Idle Upper Side * (°C) | 33 | 24.7 25% | 34.5 -5% | 32.4 2% | 29.9 9% | 27.1 18% |
| Idle Bottom * (°C) | 29 | 22.8 21% | 33.6 -16% | 32.8 -13% | 28.8 1% | 27.4 6% |
* ... menor é melhor
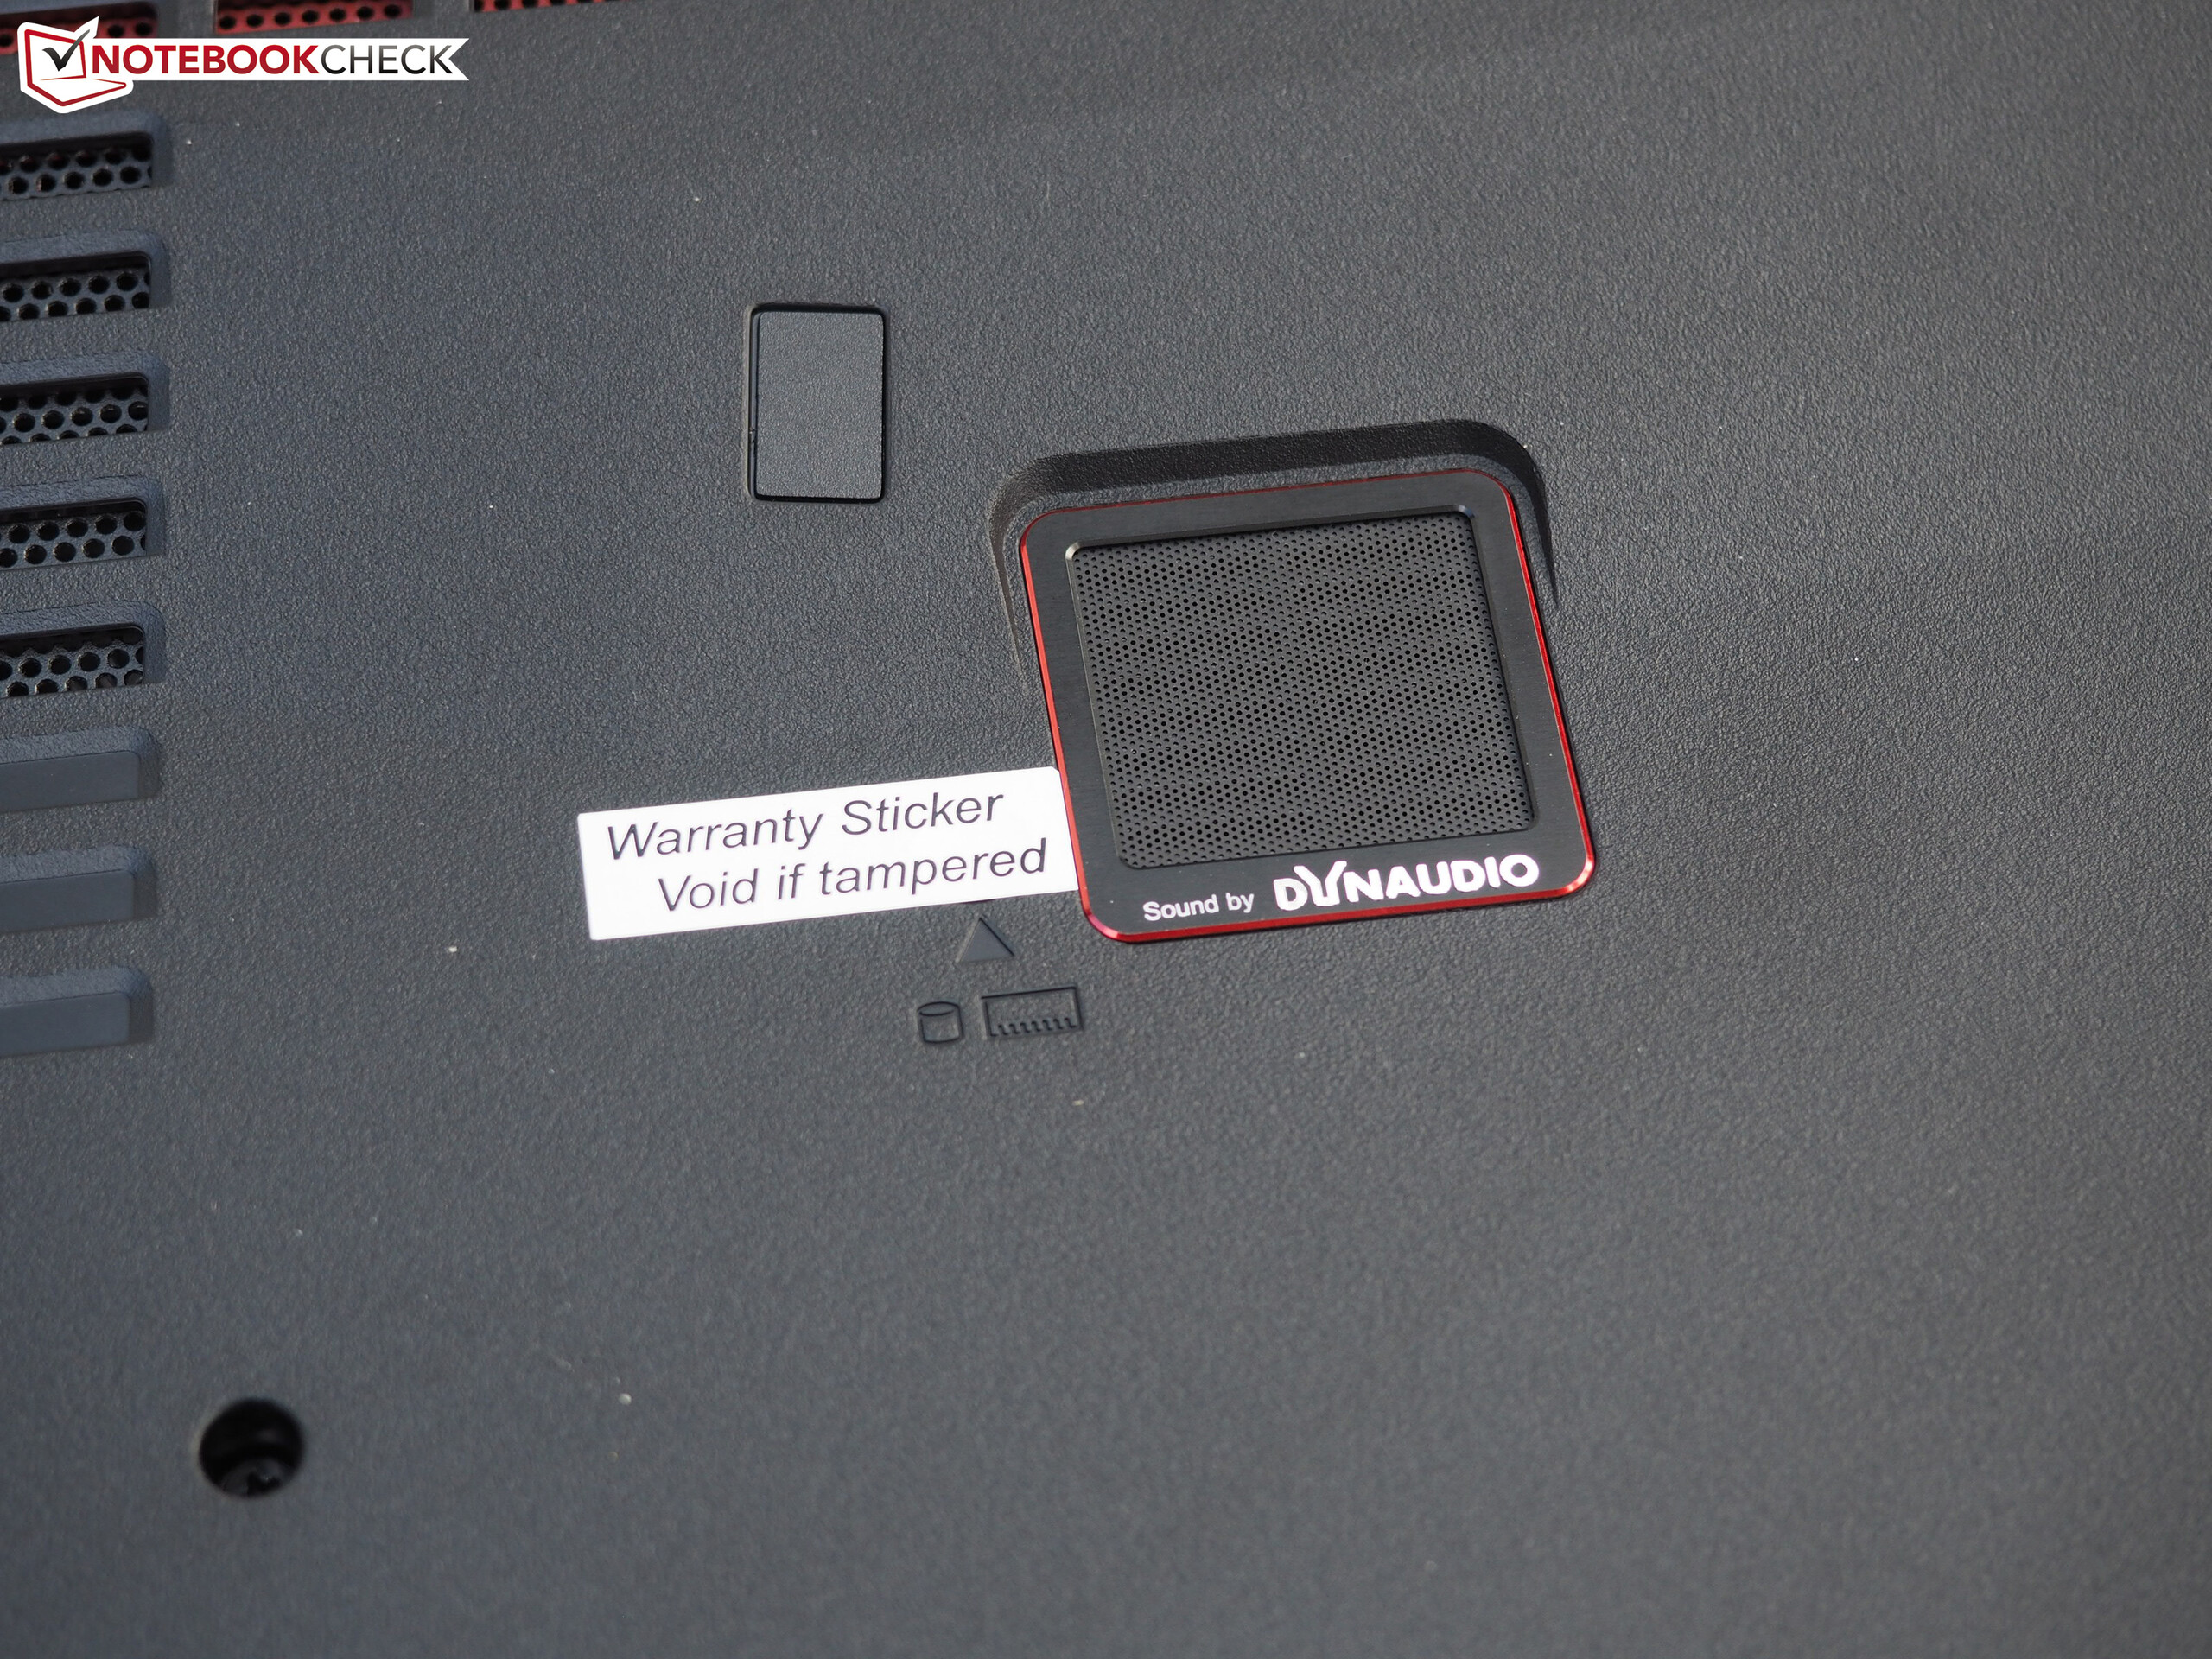
MSI GT83VR 7RF-206 Titan SLI análise de áudio
(+) | os alto-falantes podem tocar relativamente alto (###valor### dB)
Graves 100 - 315Hz
(±) | graves reduzidos - em média 14.3% menor que a mediana
(±) | a linearidade dos graves é média (9% delta para a frequência anterior)
Médios 400 - 2.000 Hz
(+) | médios equilibrados - apenas 4.8% longe da mediana
(+) | médios são lineares (2.6% delta para frequência anterior)
Altos 2 - 16 kHz
(+) | agudos equilibrados - apenas 3.6% longe da mediana
(+) | os máximos são lineares (3.2% delta da frequência anterior)
Geral 100 - 16.000 Hz
(+) | o som geral é linear (13.7% diferença em relação à mediana)
Comparado com a mesma classe
» 21% de todos os dispositivos testados nesta classe foram melhores, 7% semelhantes, 72% piores
» O melhor teve um delta de 6%, a média foi 18%, o pior foi 132%
Comparado com todos os dispositivos testados
» 15% de todos os dispositivos testados foram melhores, 4% semelhantes, 81% piores
» O melhor teve um delta de 4%, a média foi 23%, o pior foi 134%
Schenker XMG U727 2017 análise de áudio
(+) | os alto-falantes podem tocar relativamente alto (###valor### dB)
Graves 100 - 315Hz
(±) | graves reduzidos - em média 7.9% menor que a mediana
(±) | a linearidade dos graves é média (10.7% delta para a frequência anterior)
Médios 400 - 2.000 Hz
(+) | médios equilibrados - apenas 4.3% longe da mediana
(+) | médios são lineares (4.4% delta para frequência anterior)
Altos 2 - 16 kHz
(+) | agudos equilibrados - apenas 2.3% longe da mediana
(+) | os máximos são lineares (4.6% delta da frequência anterior)
Geral 100 - 16.000 Hz
(+) | o som geral é linear (11.4% diferença em relação à mediana)
Comparado com a mesma classe
» 9% de todos os dispositivos testados nesta classe foram melhores, 3% semelhantes, 88% piores
» O melhor teve um delta de 6%, a média foi 18%, o pior foi 132%
Comparado com todos os dispositivos testados
» 7% de todos os dispositivos testados foram melhores, 2% semelhantes, 90% piores
» O melhor teve um delta de 4%, a média foi 23%, o pior foi 134%
| desligado | |
| Ocioso | |
| Carga |
|
Key:
min: | |
| MSI GT83VR 7RF-206 Titan SLI GeForce GTX 1080 SLI (Laptop), i7-7920HQ | MSI GT83VR-6RE32SR451 GeForce GTX 1070 SLI (Laptop), 6820HK | Schenker XMG U727 2017 GeForce GTX 1080 Mobile, i7-7700K | Acer Predator 17 X GX-792-76DL GeForce GTX 1080 Mobile, i7-7820HK | Asus G701VIK-BA049T GeForce GTX 1080 Mobile, i7-7820HK | MSI GT73VR 7RF-296 GeForce GTX 1080 Mobile, i7-7820HK | |
|---|---|---|---|---|---|---|
| Power Consumption | 22% | 26% | 43% | 44% | 40% | |
| Idle Minimum * (Watt) | 45 | 32 29% | 32 29% | 27 40% | 24 47% | 29 36% |
| Idle Average * (Watt) | 54 | 47 13% | 43 20% | 32 41% | 31 43% | 35 35% |
| Idle Maximum * (Watt) | 62 | 52 16% | 51 18% | 41 34% | 38 39% | 40 35% |
| Load Average * (Watt) | 178 | 152 15% | 138 22% | 102 43% | 98 45% | 94 47% |
| Witcher 3 ultra * (Watt) | 380 | 279 27% | ||||
| Load Maximum * (Watt) | 586 | 366 38% | 350 40% | 248 58% | 320 45% | 315 46% |
* ... menor é melhor
| MSI GT83VR 7RF-206 Titan SLI GeForce GTX 1080 SLI (Laptop), i7-7920HQ, 75.24 Wh | MSI GT83VR-6RE32SR451 GeForce GTX 1070 SLI (Laptop), 6820HK, 75 Wh | Schenker XMG U727 2017 GeForce GTX 1080 Mobile, i7-7700K, 89 Wh | Acer Predator 17 X GX-792-76DL GeForce GTX 1080 Mobile, i7-7820HK, 88.8 Wh | Asus G701VIK-BA049T GeForce GTX 1080 Mobile, i7-7820HK, 93 Wh | MSI GT73VR 7RF-296 GeForce GTX 1080 Mobile, i7-7820HK, 75.2 Wh | |
|---|---|---|---|---|---|---|
| Duração da bateria | -2% | 51% | 92% | 93% | 35% | |
| Reader / Idle (h) | 2.4 | 2.5 4% | 3.7 54% | 5.2 117% | 5.7 138% | |
| WiFi v1.3 (h) | 2 | 2 0% | 2.8 40% | 4.2 110% | 4 100% | 2.7 35% |
| Load (h) | 1 | 0.9 -10% | 1.6 60% | 1.5 50% | 1.4 40% | |
| H.264 (h) | 3.4 | 2.4 |
Pro
Contra
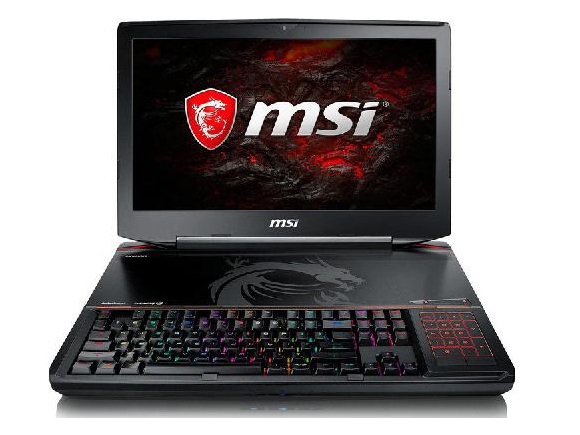
Se for apenas sobre o desempenho, o que o MSI GT83VR oferece é excelente.
Não existe quase nenhum portátil de gama alta que tenha tantas reservas para jogos modernos - seja em termos CPU, GPU ou RAM. No entanto, o preço deste desempenho quase imbatível não frá apenas um enorme buraco no bolso (o modelo de teste custa mais de 5000 Euros, ~$5600), mas também tem uma carcaça bastante pesada e massiva que somente pode ser movida com um pouco de esforço.
Nossas principais queixas são o ruído e a tela. Com 1920x1080 pixels e 60 Hz, inclusive uma GTX-1080 individual calcula muito rapidamente, de tal maneira que o cargo extra por um sistema SLI não tem relação com o beneficio nos FPS. Para o qual o GT83VR precisaria oferecer um painel 4K. O desconfortável ruído na operação 3D e o irritante barulho de bobina no modo inativo impedem sua entrada no Top 10 dos aparelhos para jogos.
Para o sucessor, desejaríamos uma carcaça de 17 polegadas (existem suficientes painel UHD e de 120 Hz neste tamanho) com – chips Max-Q-Graphics - esperamos que mais silenciosos - e suporte para G-Sync. Um portátil fino de 18 polegadas com apenas uma GPU também seria uma solução interessante para os usuários que preferem suas telas sejam tão grandes quanto possível.
MSI GT83VR 7RF-206 Titan SLI
- 06/17/2017 v6 (old)
Florian Glaser
Price comparison