Breve Análise do Portátil Monster Tulpar T5 (Tongfang GK5CN6Z, i7-8750H, GTX 1060, FHD)
| SD Card Reader | |
| average JPG Copy Test (av. of 3 runs) | |
| Gigabyte Aero 15X v8 (Toshiba Exceria Pro SDXC 64 GB UHS-II) | |
| Média da turma Gaming (20.9 - 210, n=54, últimos 2 anos) | |
| Monster Tulpar T5 V18.1.1 (Toshiba Exceria Pro SDXC 64 GB UHS-II) | |
| maximum AS SSD Seq Read Test (1GB) | |
| Gigabyte Aero 15X v8 (Toshiba Exceria Pro SDXC 64 GB UHS-II) | |
| Média da turma Gaming (25.5 - 261, n=51, últimos 2 anos) | |
| Monster Tulpar T5 V18.1.1 (Toshiba Exceria Pro SDXC 64 GB UHS-II) | |
| |||||||||||||||||||||||||
iluminação: 89 %
iluminação com acumulador: 335 cd/m²
Contraste: 1015:1 (Preto: 0.33 cd/m²)
ΔE ColorChecker Calman: 3.66 | ∀{0.5-29.43 Ø4.71}
calibrated: 1.37
ΔE Greyscale Calman: 4.26 | ∀{0.09-98 Ø4.96}
94% sRGB (Argyll 1.6.3 3D)
61% AdobeRGB 1998 (Argyll 1.6.3 3D)
66.3% AdobeRGB 1998 (Argyll 3D)
94.3% sRGB (Argyll 3D)
64.8% Display P3 (Argyll 3D)
Gamma: 2.35
CCT: 6461 K
| Monster Tulpar T5 V18.1.1 LGD05C0, IPS, 1920x1080 | Asus ROG GU501GM-BI7N8 AU Optronics AUO45ED, IPS, 1920x1080 | Razer Blade 15 GTX 1060 LGD05C0, IPS, 1920x1080 | MSI GS65 8RF-019DE Stealth Thin AU Optronics B156HAN08.0 (AUO80ED), IPS, 1920x1080 | Gigabyte Aero 15X v8 LGD05C0, IPS, 1920x1080 | |
|---|---|---|---|---|---|
| Display | -5% | -1% | 0% | -2% | |
| Display P3 Coverage (%) | 64.8 | 63.4 -2% | 64.4 -1% | 66.2 2% | 63.6 -2% |
| sRGB Coverage (%) | 94.3 | 87.7 -7% | 93.4 -1% | 92.1 -2% | 93.8 -1% |
| AdobeRGB 1998 Coverage (%) | 66.3 | 65.5 -1% | 67.2 1% | 64.9 -2% | |
| Response Times | -112% | 8% | -9% | 1% | |
| Response Time Grey 50% / Grey 80% * (ms) | 16 ? | 30.8 ? -93% | 13.6 ? 15% | 17.6 ? -10% | 16.8 ? -5% |
| Response Time Black / White * (ms) | 12 ? | 27.6 ? -130% | 12 ? -0% | 12.8 ? -7% | 11.2 ? 7% |
| PWM Frequency (Hz) | |||||
| Screen | -7% | 10% | 9% | 19% | |
| Brightness middle (cd/m²) | 335 | 286.7 -14% | 304.3 -9% | 254 -24% | 313 -7% |
| Brightness (cd/m²) | 315 | 281 -11% | 293 -7% | 262 -17% | 300 -5% |
| Brightness Distribution (%) | 89 | 92 3% | 80 -10% | 89 0% | 78 -12% |
| Black Level * (cd/m²) | 0.33 | 0.39 -18% | 0.38 -15% | 0.22 33% | 0.33 -0% |
| Contrast (:1) | 1015 | 735 -28% | 801 -21% | 1155 14% | 948 -7% |
| Colorchecker dE 2000 * | 3.66 | 4.17 -14% | 1.79 51% | 2.37 35% | 1.29 65% |
| Colorchecker dE 2000 max. * | 6.56 | 7.22 -10% | 3.69 44% | 4.71 28% | 2.04 69% |
| Colorchecker dE 2000 calibrated * | 1.37 | 1.84 -34% | |||
| Greyscale dE 2000 * | 4.26 | 2.5 41% | 1.1 74% | 1.58 63% | 0.69 84% |
| Gamma | 2.35 94% | 2.274 97% | 2.27 97% | 2.48 89% | 2.43 91% |
| CCT | 6461 101% | 6885 94% | 6665 98% | 6785 96% | 6550 99% |
| Color Space (Percent of AdobeRGB 1998) (%) | 61 | 57 -7% | 59.8 -2% | 60 -2% | 60 -2% |
| Color Space (Percent of sRGB) (%) | 94 | 87 -7% | 92.8 -1% | 92 -2% | 94 0% |
| Média Total (Programa/Configurações) | -41% /
-21% | 6% /
8% | 0% /
5% | 6% /
12% |
* ... menor é melhor
Exibir tempos de resposta
| ↔ Tempo de resposta preto para branco | ||
|---|---|---|
| 12 ms ... ascensão ↗ e queda ↘ combinadas | ↗ 6.8 ms ascensão | 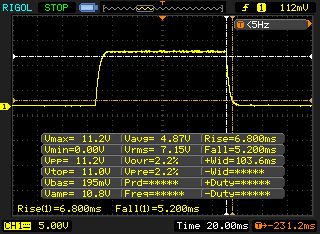 |
| ↘ 5.2 ms queda | ||
| A tela mostra boas taxas de resposta em nossos testes, mas pode ser muito lenta para jogadores competitivos. Em comparação, todos os dispositivos testados variam de 0.1 (mínimo) a 240 (máximo) ms. » 32 % de todos os dispositivos são melhores. Isso significa que o tempo de resposta medido é melhor que a média de todos os dispositivos testados (19.8 ms). | ||
| ↔ Tempo de resposta 50% cinza a 80% cinza | ||
| 16 ms ... ascensão ↗ e queda ↘ combinadas | ↗ 8.4 ms ascensão | 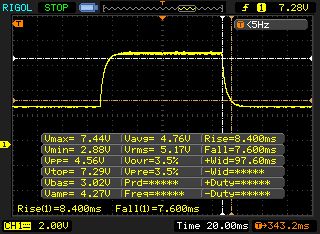 |
| ↘ 7.6 ms queda | ||
| A tela mostra boas taxas de resposta em nossos testes, mas pode ser muito lenta para jogadores competitivos. Em comparação, todos os dispositivos testados variam de 0.165 (mínimo) a 636 (máximo) ms. » 30 % de todos os dispositivos são melhores. Isso significa que o tempo de resposta medido é melhor que a média de todos os dispositivos testados (30.9 ms). | ||
Cintilação da tela / PWM (modulação por largura de pulso)
| Tela tremeluzindo / PWM não detectado | 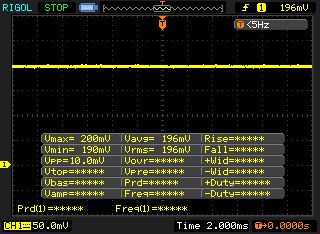 | ||
[pwm_comparison] Em comparação: 52 % de todos os dispositivos testados não usam PWM para escurecer a tela. Se PWM foi detectado, uma média de 7744 (mínimo: 5 - máximo: 343500) Hz foi medida. | |||
| PCMark 10 - Score | |
| Média da turma Gaming (5828 - 12414, n=93, últimos 2 anos) | |
| Razer Blade 15 GTX 1060 | |
| MSI GS65 8RF-019DE Stealth Thin | |
| Asus ROG GU501GM-BI7N8 | |
| Gigabyte Aero 15X v8 | |
| Monster Tulpar T5 V18.1.1 | |
| PCMark 8 Home Score Accelerated v2 | 4565 pontos | |
| PCMark 8 Work Score Accelerated v2 | 5486 pontos | |
| PCMark 10 Score | 4931 pontos | |
Ajuda | ||
| Monster Tulpar T5 V18.1.1 ADATA XPG Gammix S11 480GB | Asus ROG GU501GM-BI7N8 Kingston RBUSNS8154P3128GJ | Razer Blade 15 GTX 1060 Samsung SSD PM981 MZVLB512HAJQ | MSI GS65 8RF-019DE Stealth Thin Samsung SSD PM981 MZVLB512HAJQ | Gigabyte Aero 15X v8 Toshiba NVMe THNSN5512GPU7 | |
|---|---|---|---|---|---|
| AS SSD | -59% | 28% | 24% | -12% | |
| Seq Read (MB/s) | 1571 | 841 -46% | 1820 16% | 1266 -19% | 2213 41% |
| Seq Write (MB/s) | 1215 | 404.7 -67% | 1917 58% | 1834 51% | 1163 -4% |
| 4K Read (MB/s) | 52.9 | 22.62 -57% | 48.56 -8% | 48.94 -7% | 23.36 -56% |
| 4K Write (MB/s) | 101.3 | 67.1 -34% | 99.2 -2% | 107.2 6% | 80.4 -21% |
| Score Read (Points) | 1397 | 377 -73% | 1407 1% | 1346 -4% | 1092 -22% |
| Score Write (Points) | 996 | 345 -65% | 1955 96% | 2051 106% | 939 -6% |
| Score Total (Points) | 3101 | 900 -71% | 4095 32% | 4122 33% | 2536 -18% |

| 3DMark 11 Performance | 13166 pontos | |
| 3DMark Cloud Gate Standard Score | 31561 pontos | |
| 3DMark Fire Strike Score | 10195 pontos | |
Ajuda | ||
| The Witcher 3 | |
| 1920x1080 Ultra Graphics & Postprocessing (HBAO+) | |
| Média da turma Gaming (104.7 - 240, n=7, últimos 2 anos) | |
| MSI GS65 8RF-019DE Stealth Thin | |
| Gigabyte Aero 15X v8 | |
| Asus ROG GU501GM-BI7N8 | |
| Monster Tulpar T5 V18.1.1 | |
| Razer Blade 15 GTX 1060 | |
| 1920x1080 High Graphics & Postprocessing (Nvidia HairWorks Off) | |
| Média da turma Gaming (341 - 404, n=2, últimos 2 anos) | |
| MSI GS65 8RF-019DE Stealth Thin | |
| Gigabyte Aero 15X v8 | |
| Razer Blade 15 GTX 1060 | |
| Monster Tulpar T5 V18.1.1 | |
| Asus ROG GU501GM-BI7N8 | |
| baixo | média | alto | ultra | |
|---|---|---|---|---|
| The Witcher 3 (2015) | 70.4 | 38.9 | ||
| FIFA 18 (2017) | 217 | 213 | ||
| Destiny 2 (2017) | 94.2 | 78.4 | ||
| Assassin´s Creed Origins (2017) | 65 | 54 | ||
| Need for Speed Payback (2017) | 82.1 | 77.1 | ||
| Star Wars Battlefront 2 (2017) | 74.8 | 62.3 | ||
| The Crew 2 (2018) | 59.4 | 58 | ||
| F1 2018 (2018) | 84 | 60 |
Barulho
| Ocioso |
| 29 / 33 / 39 dB |
| HDD |
| 33 dB |
| Carga |
| 49 / 58 dB |
 | ||
30 dB silencioso 40 dB(A) audível 50 dB(A) ruidosamente alto |
||
min: | ||
| Monster Tulpar T5 V18.1.1 GeForce GTX 1060 Mobile, i7-8750H | Asus ROG GU501GM-BI7N8 GeForce GTX 1060 Mobile, i7-8750H | Razer Blade 15 GTX 1060 GeForce GTX 1060 Max-Q, i7-8750H | MSI GS65 8RF-019DE Stealth Thin GeForce GTX 1070 Max-Q, i7-8750H | Gigabyte Aero 15X v8 GeForce GTX 1070 Max-Q, i7-8750H | Média da turma Gaming | |
|---|---|---|---|---|---|---|
| Noise | 5% | 10% | 10% | 3% | 14% | |
| desligado / ambiente * (dB) | 29 | 28.6 1% | 28.1 3% | 30 -3% | 29 -0% | 24.1 ? 17% |
| Idle Minimum * (dB) | 29 | 31.4 -8% | 28.1 3% | 30 -3% | 30 -3% | 25.9 ? 11% |
| Idle Average * (dB) | 33 | 31.4 5% | 33 -0% | 31 6% | 31 6% | 27.4 ? 17% |
| Idle Maximum * (dB) | 39 | 34.2 12% | 33.5 14% | 34 13% | 35 10% | 30.1 ? 23% |
| Load Average * (dB) | 49 | 42.8 13% | 42.2 14% | 43 12% | 49 -0% | 43.7 ? 11% |
| Witcher 3 ultra * (dB) | 52 | 50.9 2% | 45.3 13% | 42 19% | 51 2% | |
| Load Maximum * (dB) | 58 | 50.9 12% | 45.7 21% | 44 24% | 54 7% | 54.3 ? 6% |
* ... menor é melhor
(-) A temperatura máxima no lado superior é 52 °C / 126 F, em comparação com a média de 40.4 °C / 105 F , variando de 21.2 a 68.8 °C para a classe Gaming.
(-) A parte inferior aquece até um máximo de 65 °C / 149 F, em comparação com a média de 43.2 °C / 110 F
(+) Em uso inativo, a temperatura média para o lado superior é 28.4 °C / 83 F, em comparação com a média do dispositivo de 33.9 °C / ### class_avg_f### F.
(-) Jogando The Witcher 3, a temperatura média para o lado superior é 41.4 °C / 107 F, em comparação com a média do dispositivo de 33.9 °C / ## #class_avg_f### F.
(-) Os apoios para as mãos e o touchpad podem ficar muito quentes ao toque, com um máximo de 41 °C / 105.8 F.
(-) A temperatura média da área do apoio para as mãos de dispositivos semelhantes foi 28.8 °C / 83.8 F (-12.2 °C / -22 F).
| Monster Tulpar T5 V18.1.1 GeForce GTX 1060 Mobile, i7-8750H | Asus ROG GU501GM-BI7N8 GeForce GTX 1060 Mobile, i7-8750H | Razer Blade 15 GTX 1060 GeForce GTX 1060 Max-Q, i7-8750H | MSI GS65 8RF-019DE Stealth Thin GeForce GTX 1070 Max-Q, i7-8750H | Gigabyte Aero 15X v8 GeForce GTX 1070 Max-Q, i7-8750H | Média da turma Gaming | |
|---|---|---|---|---|---|---|
| Heat | 9% | -1% | 12% | 3% | 6% | |
| Maximum Upper Side * (°C) | 52 | 43 17% | 51.2 2% | 49 6% | 53 -2% | 45.1 ? 13% |
| Maximum Bottom * (°C) | 65 | 46.6 28% | 55.2 15% | 63 3% | 65 -0% | 48.1 ? 26% |
| Idle Upper Side * (°C) | 30 | 29.2 3% | 31 -3% | 24 20% | 26 13% | 31 ? -3% |
| Idle Bottom * (°C) | 30 | 34 -13% | 35.6 -19% | 25 17% | 30 -0% | 34.2 ? -14% |
* ... menor é melhor
Monster Tulpar T5 V18.1.1 análise de áudio
(±) | o volume do alto-falante é médio, mas bom (###valor### dB)
Graves 100 - 315Hz
(-) | quase nenhum baixo - em média 20.2% menor que a mediana
(-) | graves não são lineares (24.7% delta para frequência anterior)
Médios 400 - 2.000 Hz
(±) | médios mais altos - em média 5.8% maior que a mediana
(±) | a linearidade dos médios é média (7.6% delta para frequência anterior)
Altos 2 - 16 kHz
(+) | agudos equilibrados - apenas 3.8% longe da mediana
(±) | a linearidade dos máximos é média (12.2% delta para frequência anterior)
Geral 100 - 16.000 Hz
(±) | a linearidade do som geral é média (24.3% diferença em relação à mediana)
Comparado com a mesma classe
» 88% de todos os dispositivos testados nesta classe foram melhores, 4% semelhantes, 9% piores
» O melhor teve um delta de 6%, a média foi 18%, o pior foi 132%
Comparado com todos os dispositivos testados
» 74% de todos os dispositivos testados foram melhores, 6% semelhantes, 21% piores
» O melhor teve um delta de 4%, a média foi 23%, o pior foi 134%
Asus ROG GU501GM-BI7N8 análise de áudio
(±) | o volume do alto-falante é médio, mas bom (###valor### dB)
Graves 100 - 315Hz
(+) | bons graves - apenas 3.8% longe da mediana
(±) | a linearidade dos graves é média (10.3% delta para a frequência anterior)
Médios 400 - 2.000 Hz
(+) | médios equilibrados - apenas 2.3% longe da mediana
(+) | médios são lineares (5.1% delta para frequência anterior)
Altos 2 - 16 kHz
(+) | agudos equilibrados - apenas 4.6% longe da mediana
(+) | os máximos são lineares (6.8% delta da frequência anterior)
Geral 100 - 16.000 Hz
(+) | o som geral é linear (12.6% diferença em relação à mediana)
Comparado com a mesma classe
» 16% de todos os dispositivos testados nesta classe foram melhores, 4% semelhantes, 81% piores
» O melhor teve um delta de 6%, a média foi 18%, o pior foi 132%
Comparado com todos os dispositivos testados
» 11% de todos os dispositivos testados foram melhores, 3% semelhantes, 86% piores
» O melhor teve um delta de 4%, a média foi 23%, o pior foi 134%
| desligado | |
| Ocioso | |
| Carga |
|
Key:
min: | |
| Monster Tulpar T5 V18.1.1 GeForce GTX 1060 Mobile, i7-8750H | Asus ROG GU501GM-BI7N8 GeForce GTX 1060 Mobile, i7-8750H | Razer Blade 15 GTX 1060 GeForce GTX 1060 Max-Q, i7-8750H | MSI GS65 8RF-019DE Stealth Thin GeForce GTX 1070 Max-Q, i7-8750H | Gigabyte Aero 15X v8 GeForce GTX 1070 Max-Q, i7-8750H | Média da turma Gaming | |
|---|---|---|---|---|---|---|
| Power Consumption | -24% | -19% | -3% | -26% | -43% | |
| Idle Minimum * (Watt) | 10 | 12.35 -23% | 14.9 -49% | 7 30% | 14 -40% | 13.1 ? -31% |
| Idle Average * (Watt) | 12 | 19.98 -67% | 17.5 -46% | 11 8% | 18 -50% | 19 ? -58% |
| Idle Maximum * (Watt) | 18 | 25.44 -41% | 19.2 -7% | 20 -11% | 22 -22% | 24.6 ? -37% |
| Load Average * (Watt) | 93 | 94.28 -1% | 103.2 -11% | 98 -5% | 91 2% | 111.3 ? -20% |
| Witcher 3 ultra * (Watt) | 110 | 132.9 -21% | 123.1 -12% | 132 -20% | 142 -29% | |
| Load Maximum * (Watt) | 152 | 140.63 7% | 132.7 13% | 182 -20% | 173 -14% | 260 ? -71% |
* ... menor é melhor
| Monster Tulpar T5 V18.1.1 GeForce GTX 1060 Mobile, i7-8750H, 46.74 Wh | Asus ROG GU501GM-BI7N8 GeForce GTX 1060 Mobile, i7-8750H, 55 Wh | Razer Blade 15 GTX 1060 GeForce GTX 1060 Max-Q, i7-8750H, 80 Wh | MSI GS65 8RF-019DE Stealth Thin GeForce GTX 1070 Max-Q, i7-8750H, 82 Wh | Gigabyte Aero 15X v8 GeForce GTX 1070 Max-Q, i7-8750H, 94.24 Wh | Média da turma Gaming | |
|---|---|---|---|---|---|---|
| Duração da bateria | -22% | 63% | 32% | 104% | 38% | |
| Reader / Idle (h) | 5.1 | 4.5 -12% | 8.5 67% | 12.7 149% | 7.84 ? 54% | |
| WiFi v1.3 (h) | 4.1 | 4 -2% | 6.7 63% | 6 46% | 8.6 110% | 7.08 ? 73% |
| Load (h) | 1.7 | 0.8 -53% | 1.4 -18% | 2.6 53% | 1.496 ? -12% | |
| H.264 (h) | 5.9 | 8.4 | 8.27 ? |
Pro
Contra
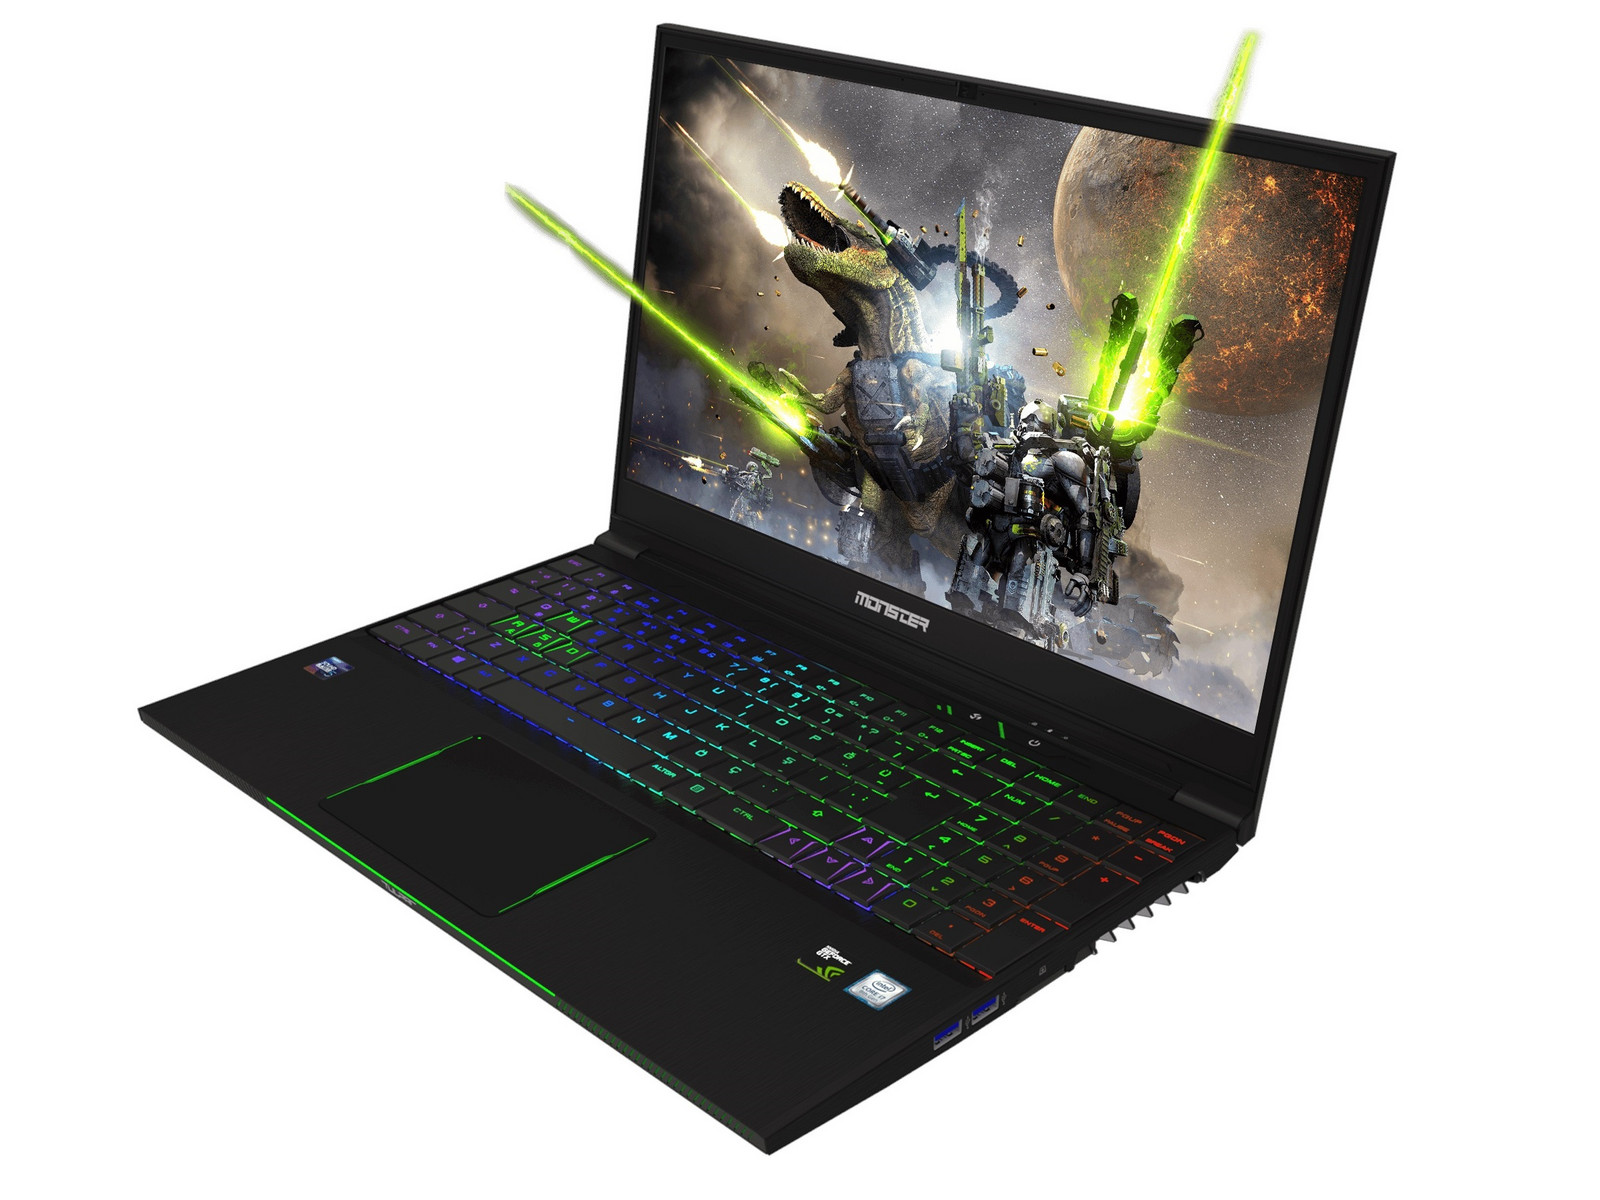
No final desta análise, nosso veredicto para o Tulpar T5 V18.1 é idêntico ao do Schenker XMG Neo 15 que se baseia no mesmo barebone Tongfang GK5CN6Z.
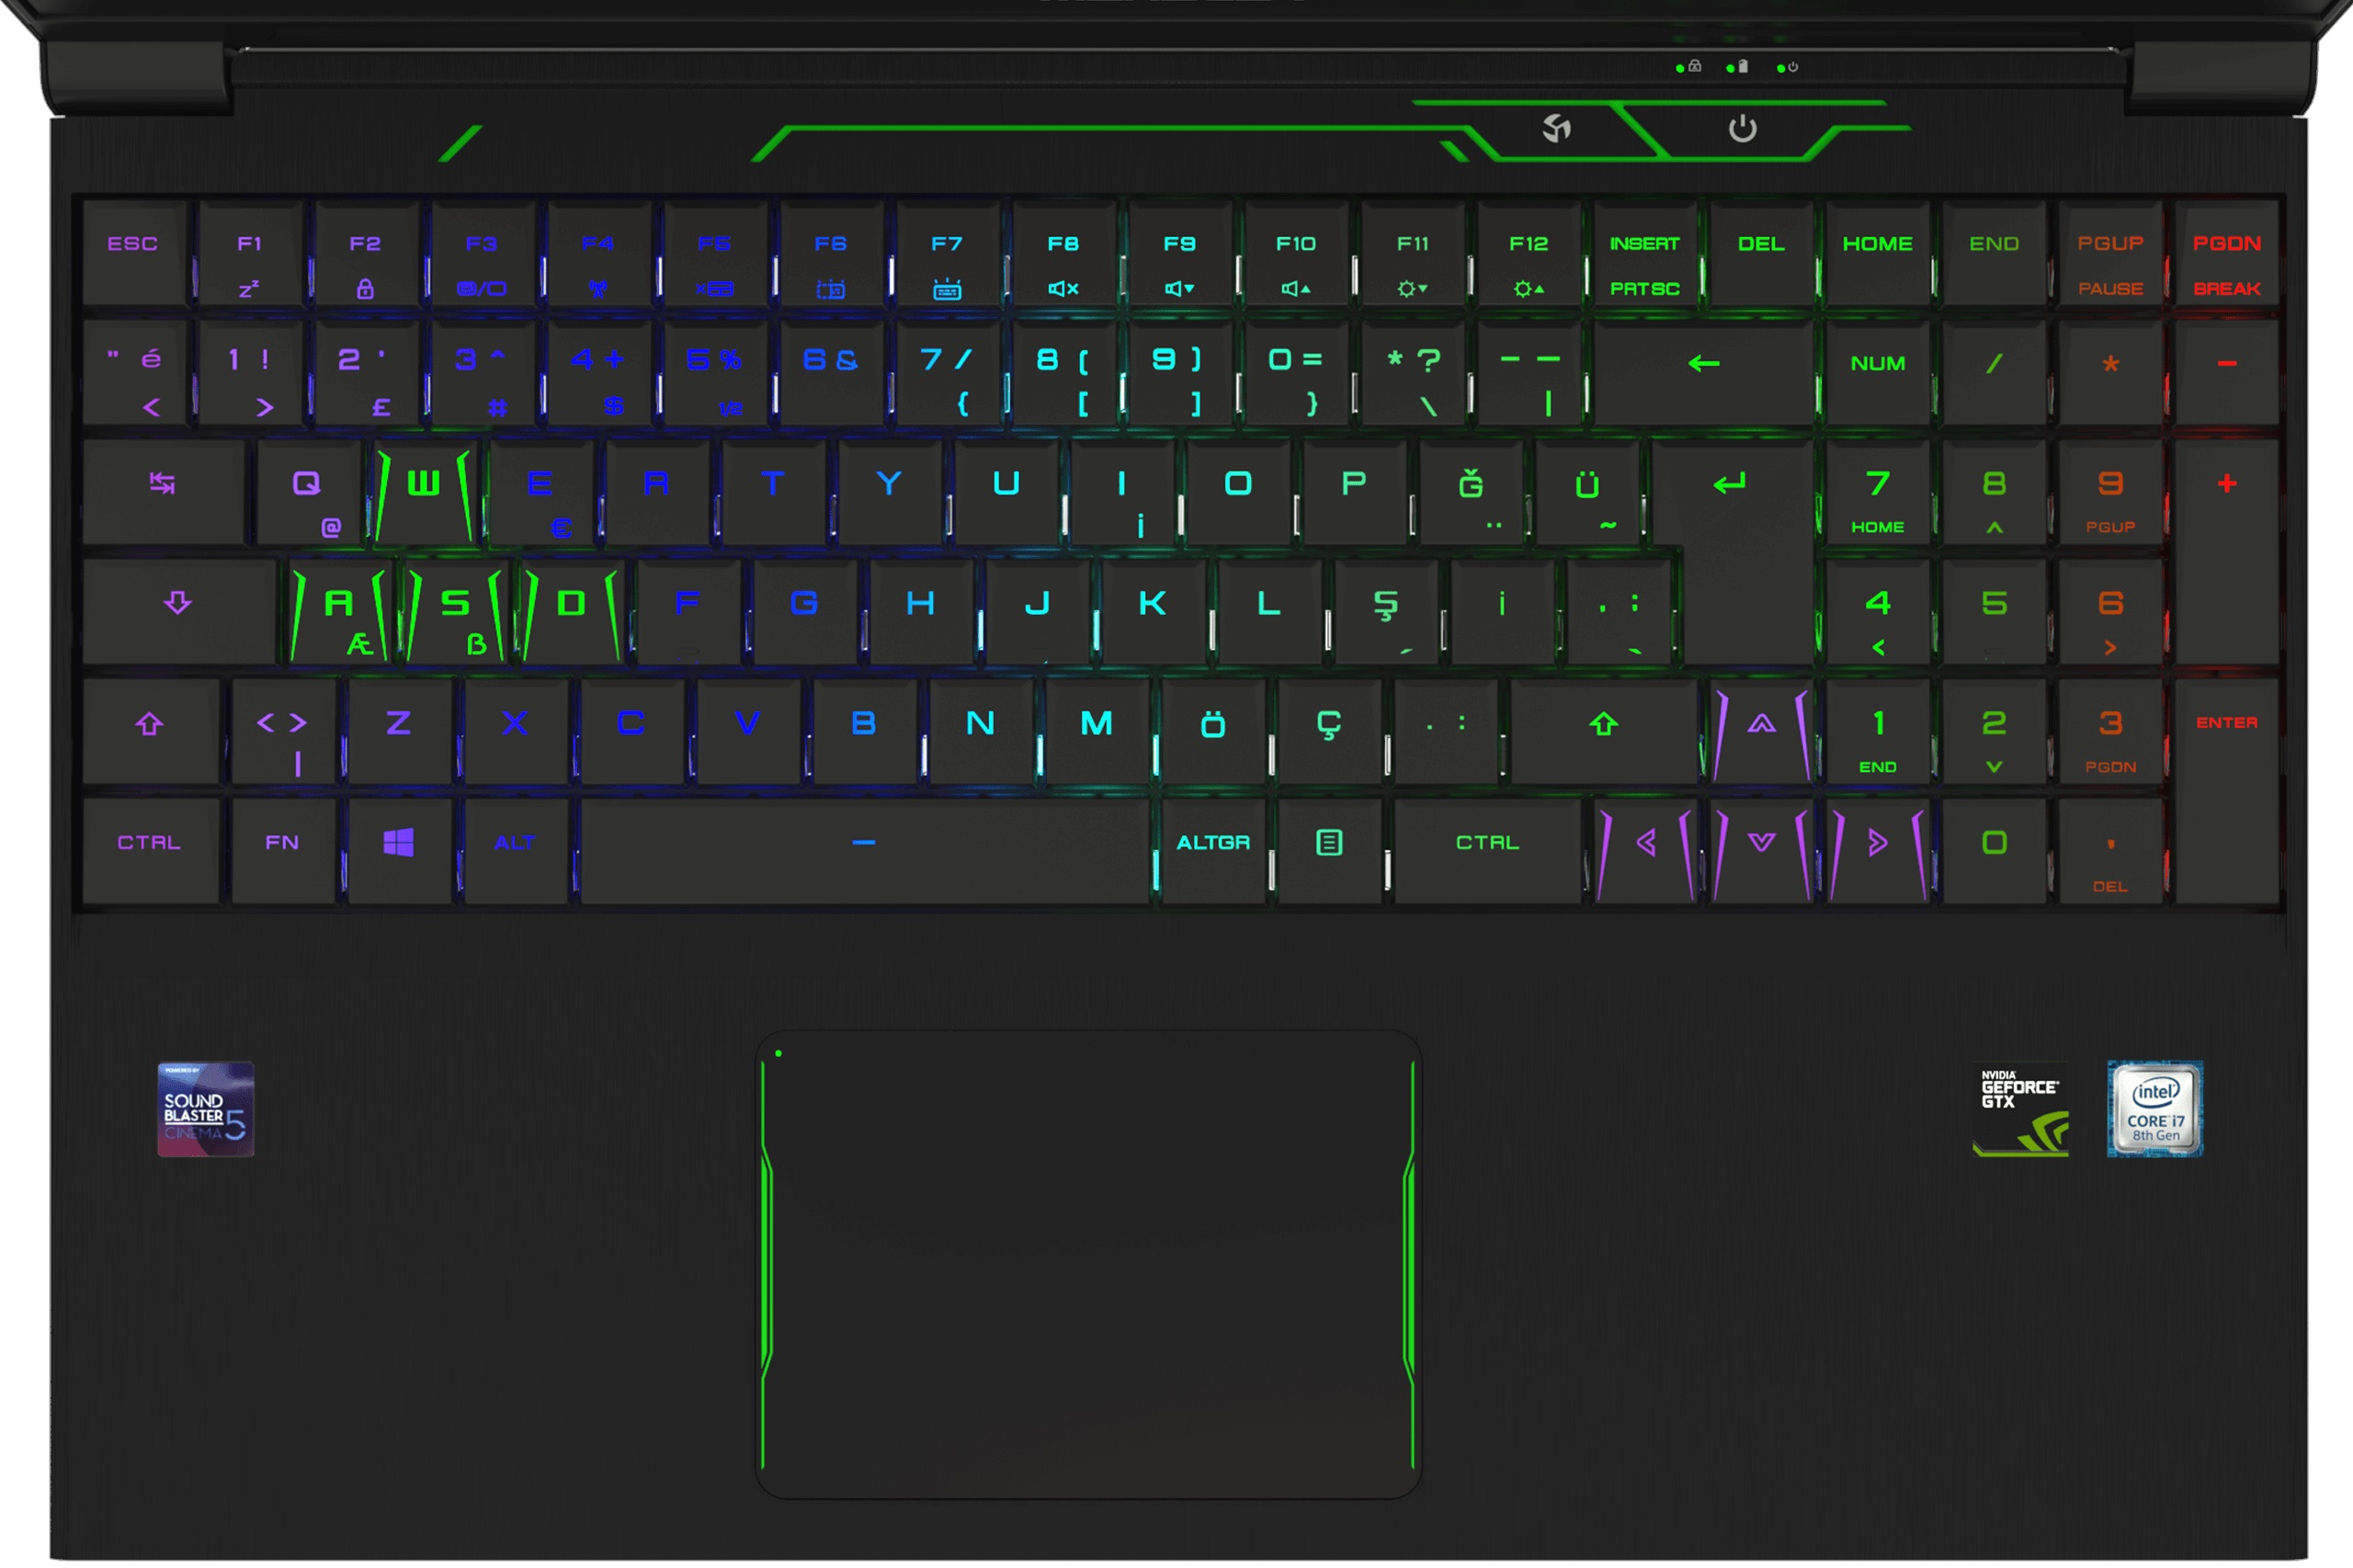
O muito bem feito painel IPS de 144 Hz, com marcos de tela consideravelmente estreitos e o teclado mecânico retro iluminado RGB certamente merecem elogios. Outros pontos fortes incluem seu baixo peso e baixo perfil, o que torna este portátil de jogos de 15 polegadas perfeito para viagens longas.
No entanto, o baixo desempenho de som, a bateria pequena e o controle muito ruim do ventilador impediram efetivamente uma melhor pontuação geral. O dispositivo foi extraordinariamente barulhento ao rodar aplicativos 3D, o que certamente vai assustar uma quantidade significativa de compradores em potencial.
O portátil da Monster dificilmente chegaria à nossa lista Top 1º dos Finos e Leves.
.
Monster Tulpar T5 V18.1.1
- 05/14/2020 v7 (old)
Florian Glaser
Price comparison