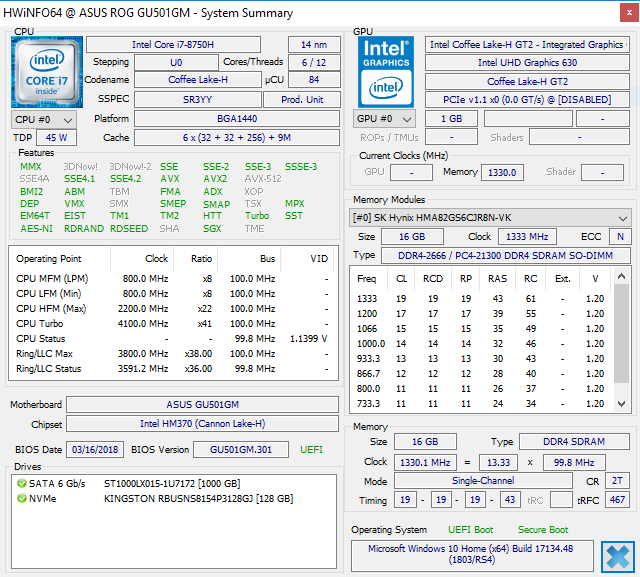
Breve Análise do Portátil Asus ROG GU501GM (i7-8750H, GTX 1060)


| |||||||||||||||||||||||||
iluminação: 92 %
iluminação com acumulador: 286.7 cd/m²
Contraste: 735:1 (Preto: 0.39 cd/m²)
ΔE ColorChecker Calman: 4.17 | ∀{0.5-29.43 Ø4.73}
ΔE Greyscale Calman: 2.5 | ∀{0.09-98 Ø4.97}
87% sRGB (Argyll 1.6.3 3D)
57% AdobeRGB 1998 (Argyll 1.6.3 3D)
87.7% sRGB (Argyll 3D)
63.4% Display P3 (Argyll 3D)
Gamma: 2.274
CCT: 6885 K
| Asus ROG GU501GM-BI7N8 AU Optronics AUO45ED, IPS, 15.6", 1920x1080 | MSI GS65 8RF-019DE Stealth Thin AU Optronics B156HAN08.0 (AUO80ED), IPS, 15.6", 1920x1080 | Asus Zephyrus M GM501 AUO B156HAN07.1 (AUO71ED), IPS, 15.6", 1920x1080 | Gigabyte Aero 15X v8 LGD05C0, IPS, 15.6", 1920x1080 | Aorus X5 v8 AU Optronics B156HAN07.0 (AUO70ED), IPS, 15.6", 1920x1080 | Acer Predator Triton 700 AUO B156HAN04.2 (AUO42ED), IPS, 15.6", 1920x1080 | |
|---|---|---|---|---|---|---|
| Display | 5% | 5% | 4% | 6% | 0% | |
| Display P3 Coverage (%) | 63.4 | 66.2 4% | 66.1 4% | 63.6 0% | 67.1 6% | 62.5 -1% |
| sRGB Coverage (%) | 87.7 | 92.1 5% | 92.7 6% | 93.8 7% | 93.4 6% | 88.7 1% |
| AdobeRGB 1998 Coverage (%) | 67.2 | 67.2 | 64.9 | 68.1 | 63.5 | |
| Response Times | 49% | 71% | 52% | 48% | -26% | |
| Response Time Grey 50% / Grey 80% * (ms) | 30.8 ? | 17.6 ? 43% | 6.6 ? 79% | 16.8 ? 45% | 18.8 ? 39% | 44.8 ? -45% |
| Response Time Black / White * (ms) | 27.6 ? | 12.8 ? 54% | 10.4 ? 62% | 11.2 ? 59% | 12 ? 57% | 29.6 ? -7% |
| PWM Frequency (Hz) | ||||||
| Screen | 21% | -13% | 27% | 23% | -13% | |
| Brightness middle (cd/m²) | 286.7 | 254 -11% | 307 7% | 313 9% | 271 -5% | 291 1% |
| Brightness (cd/m²) | 281 | 262 -7% | 296 5% | 300 7% | 259 -8% | 277 -1% |
| Brightness Distribution (%) | 92 | 89 -3% | 89 -3% | 78 -15% | 87 -5% | 84 -9% |
| Black Level * (cd/m²) | 0.39 | 0.22 44% | 0.25 36% | 0.33 15% | 0.27 31% | 0.22 44% |
| Contrast (:1) | 735 | 1155 57% | 1228 67% | 948 29% | 1004 37% | 1323 80% |
| Colorchecker dE 2000 * | 4.17 | 2.37 43% | 5.74 -38% | 1.29 69% | 1.81 57% | 5.52 -32% |
| Colorchecker dE 2000 max. * | 7.22 | 4.71 35% | 11.32 -57% | 2.04 72% | 3.33 54% | 10.72 -48% |
| Greyscale dE 2000 * | 2.5 | 1.58 37% | 6.44 -158% | 0.69 72% | 1.09 56% | 6.59 -164% |
| Gamma | 2.274 97% | 2.48 89% | 2.48 89% | 2.43 91% | 2.45 90% | 2.44 90% |
| CCT | 6885 94% | 6785 96% | 8395 77% | 6550 99% | 6435 101% | 7816 83% |
| Color Space (Percent of AdobeRGB 1998) (%) | 57 | 60 5% | 60 5% | 60 5% | 61 7% | 58 2% |
| Color Space (Percent of sRGB) (%) | 87 | 92 6% | 93 7% | 94 8% | 93 7% | 89 2% |
| Colorchecker dE 2000 calibrated * | 1.84 | 1.94 | ||||
| Média Total (Programa/Configurações) | 25% /
22% | 21% /
2% | 28% /
27% | 26% /
24% | -13% /
-13% |
* ... menor é melhor
Exibir tempos de resposta
| ↔ Tempo de resposta preto para branco | ||
|---|---|---|
| 27.6 ms ... ascensão ↗ e queda ↘ combinadas | ↗ 16 ms ascensão | 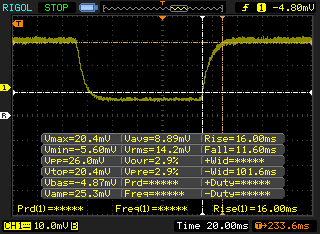 |
| ↘ 11.6 ms queda | ||
| A tela mostra taxas de resposta relativamente lentas em nossos testes e pode ser muito lenta para os jogadores. Em comparação, todos os dispositivos testados variam de 0.1 (mínimo) a 240 (máximo) ms. » 70 % de todos os dispositivos são melhores. Isso significa que o tempo de resposta medido é pior que a média de todos os dispositivos testados (19.9 ms). | ||
| ↔ Tempo de resposta 50% cinza a 80% cinza | ||
| 30.8 ms ... ascensão ↗ e queda ↘ combinadas | ↗ 13.6 ms ascensão | 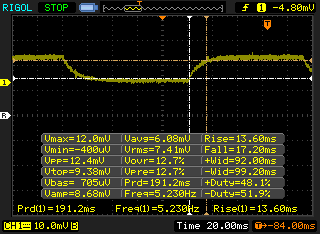 |
| ↘ 17.2 ms queda | ||
| A tela mostra taxas de resposta lentas em nossos testes e será insatisfatória para os jogadores. Em comparação, todos os dispositivos testados variam de 0.165 (mínimo) a 636 (máximo) ms. » 41 % de todos os dispositivos são melhores. Isso significa que o tempo de resposta medido é semelhante à média de todos os dispositivos testados (31.1 ms). | ||
Cintilação da tela / PWM (modulação por largura de pulso)
| Tela tremeluzindo / PWM não detectado | 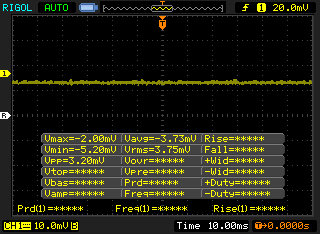 | ||
[pwm_comparison] Em comparação: 52 % de todos os dispositivos testados não usam PWM para escurecer a tela. Se PWM foi detectado, uma média de 7794 (mínimo: 5 - máximo: 343500) Hz foi medida. | |||
* ... menor é melhor
| PCMark 8 Home Score Accelerated v2 | 4119 pontos | |
| PCMark 8 Creative Score Accelerated v2 | 5454 pontos | |
| PCMark 8 Work Score Accelerated v2 | 5111 pontos | |
| PCMark 10 Score | 5092 pontos | |
Ajuda | ||
| Asus ROG GU501GM-BI7N8 Kingston RBUSNS8154P3128GJ | MSI GS65 8RF-019DE Stealth Thin Samsung SSD PM981 MZVLB512HAJQ | Asus Zephyrus M GM501 Samsung SM961 MZVKW512HMJP m.2 PCI-e | Gigabyte Aero 15X v8 Toshiba NVMe THNSN5512GPU7 | Aorus X5 v8 Toshiba NVMe THNSN5512GPU7 | Acer Predator Triton 700 2x SK Hynix Canvas SC300 512GB M.2 (HFS512G39MND) (RAID 0) | Média Kingston RBUSNS8154P3128GJ | |
|---|---|---|---|---|---|---|---|
| AS SSD | 253% | 213% | 129% | 121% | 207% | 3% | |
| Copy Game MB/s (MB/s) | 419.3 | 369 ? -12% | |||||
| Copy Program MB/s (MB/s) | 269.2 | 209 ? -22% | |||||
| Copy ISO MB/s (MB/s) | 773 | 549 ? -29% | |||||
| Score Total (Points) | 900 | 4122 358% | 3649 305% | 2536 182% | 2515 179% | 3282 265% | 1014 ? 13% |
| Score Write (Points) | 345 | 2051 494% | 1446 319% | 939 172% | 954 177% | 1243 260% | 365 ? 6% |
| Score Read (Points) | 377 | 1346 257% | 1471 290% | 1092 190% | 1061 181% | 1350 258% | 443 ? 18% |
| Access Time Write * (ms) | 0.058 | 0.035 40% | 0.041 29% | 0.046 21% | 0.044 24% | 0.041 29% | 0.06829 ? -18% |
| Access Time Read * (ms) | 0.278 | 0.073 74% | 0.046 83% | 0.119 57% | 0.166 40% | 0.062 78% | 0.2317 ? 17% |
| 4K-64 Write (MB/s) | 237 | 1760 643% | 1198 405% | 742 213% | 773 226% | 913 285% | 259 ? 9% |
| 4K-64 Read (MB/s) | 270.3 | 1170 333% | 1218 351% | 847 213% | 856 217% | 1057 291% | 317 ? 17% |
| 4K Write (MB/s) | 67.1 | 107.2 60% | 90.2 34% | 80.4 20% | 84.5 26% | 93 39% | 65.5 ? -2% |
| 4K Read (MB/s) | 22.62 | 48.94 116% | 43.42 92% | 23.36 3% | 23.21 3% | 41.47 83% | 28.2 ? 25% |
| Seq Write (MB/s) | 404.7 | 1834 353% | 1580 290% | 1163 187% | 966 139% | 2372 486% | 404 ? 0% |
| Seq Read (MB/s) | 841 | 1266 51% | 2091 149% | 2213 163% | 1813 116% | 2517 199% | 973 ? 16% |
* ... menor é melhor

| 3DMark | |
| 1280x720 Cloud Gate Standard Graphics | |
| Média da turma Gaming (86886 - 223650, n=61, últimos 2 anos) | |
| Aorus X5 v8 | |
| Acer Predator Triton 700 | |
| MSI GS65 8RF-019DE Stealth Thin | |
| Asus ROG GU501GM-BI7N8 | |
| Média NVIDIA GeForce GTX 1060 Mobile (26770 - 86193, n=68) | |
| Asus ROG Strix GL702ZC-GC204T | |
| Acer Predator Helios 300 PH317-52-51M6 | |
| Dell XPS 15 9575 i5-8305G | |
| Asus FX504GD | |
| Lenovo Legion Y520-15IKBA-80WY001VGE | |
| 1920x1080 Fire Strike Graphics | |
| Média da turma Gaming (12242 - 62849, n=120, últimos 2 anos) | |
| Acer Predator Triton 700 | |
| Aorus X5 v8 | |
| MSI GS65 8RF-019DE Stealth Thin | |
| Asus ROG GU501GM-BI7N8 | |
| Média NVIDIA GeForce GTX 1060 Mobile (10708 - 12298, n=77) | |
| Asus ROG Strix GL702ZC-GC204T | |
| Acer Predator Helios 300 PH317-52-51M6 | |
| Dell XPS 15 9575 i5-8305G | |
| Asus FX504GD | |
| Lenovo Legion Y520-15IKBA-80WY001VGE | |
| 1920x1080 Ice Storm Extreme Graphics | |
| Média da turma Gaming (187534 - 659227, n=5, últimos 2 anos) | |
| Asus FX504GD | |
| Dell XPS 15 9575 i5-8305G | |
| Média NVIDIA GeForce GTX 1060 Mobile (33205 - 257260, n=33) | |
| 3DMark 06 Standard Score | 33570 pontos | |
| 3DMark 11 Performance | 13082 pontos | |
| 3DMark Cloud Gate Standard Score | 30938 pontos | |
| 3DMark Fire Strike Score | 10370 pontos | |
Ajuda | ||
| Rise of the Tomb Raider - 1920x1080 Very High Preset AA:FX AF:16x (classificar por valor) | |
| Asus ROG GU501GM-BI7N8 | |
| Média NVIDIA GeForce GTX 1060 Mobile (51 - 68.8, n=37) | |
| The Witcher 3 - 1920x1080 Ultra Graphics & Postprocessing (HBAO+) (classificar por valor) | |
| Asus ROG GU501GM-BI7N8 | |
| MSI GS65 8RF-019DE Stealth Thin | |
| Asus Zephyrus M GM501 | |
| Gigabyte Aero 15X v8 | |
| Aorus X5 v8 | |
| Acer Predator Triton 700 | |
| Média NVIDIA GeForce GTX 1060 Mobile (24 - 42.3, n=60) | |
| Média da turma Gaming (95 - 240, n=8, últimos 2 anos) | |
| baixo | média | alto | ultra | |
|---|---|---|---|---|
| BioShock Infinite (2013) | 194 | 173 | 162 | 99 |
| The Witcher 3 (2015) | 166 | 120 | 66 | 39 |
| Rise of the Tomb Raider (2016) | 163 | 120 | 71 | 57 |
| Hitman 2016 (2016) | 71 | 70 | 59 | 46 |
Barulho
| Ocioso |
| 31.4 / 31.4 / 34.2 dB |
| Carga |
| 42.8 / 50.9 dB |
 | ||
30 dB silencioso 40 dB(A) audível 50 dB(A) ruidosamente alto |
||
min: | ||
| Asus ROG GU501GM-BI7N8 GeForce GTX 1060 Mobile, i7-8750H, Kingston RBUSNS8154P3128GJ | MSI GS65 8RF-019DE Stealth Thin GeForce GTX 1070 Max-Q, i7-8750H, Samsung SSD PM981 MZVLB512HAJQ | Asus Zephyrus M GM501 GeForce GTX 1070 Mobile, i7-8750H, Samsung SM961 MZVKW512HMJP m.2 PCI-e | Gigabyte Aero 15X v8 GeForce GTX 1070 Max-Q, i7-8750H, Toshiba NVMe THNSN5512GPU7 | Aorus X5 v8 GeForce GTX 1070 Mobile, i7-8850H, Toshiba NVMe THNSN5512GPU7 | Acer Predator Triton 700 GeForce GTX 1080 Max-Q, i7-7700HQ, 2x SK Hynix Canvas SC300 512GB M.2 (HFS512G39MND) (RAID 0) | |
|---|---|---|---|---|---|---|
| Noise | 5% | -1% | -3% | -7% | -2% | |
| desligado / ambiente * (dB) | 28.6 | 30 -5% | 29 -1% | 29 -1% | 30 -5% | 31 -8% |
| Idle Minimum * (dB) | 31.4 | 30 4% | 30 4% | 30 4% | 33 -5% | 33 -5% |
| Idle Average * (dB) | 31.4 | 31 1% | 31 1% | 31 1% | 35 -11% | 34 -8% |
| Idle Maximum * (dB) | 34.2 | 34 1% | 33 4% | 35 -2% | 40 -17% | 40 -17% |
| Load Average * (dB) | 42.8 | 43 -0% | 49 -14% | 49 -14% | 45 -5% | 41 4% |
| Witcher 3 ultra * (dB) | 50.9 | 42 17% | 50 2% | 51 -0% | 50 2% | 43 16% |
| Load Maximum * (dB) | 50.9 | 44 14% | 52 -2% | 54 -6% | 55 -8% | 48 6% |
* ... menor é melhor
(±) A temperatura máxima no lado superior é 43 °C / 109 F, em comparação com a média de 40.4 °C / 105 F , variando de 21.2 a 68.8 °C para a classe Gaming.
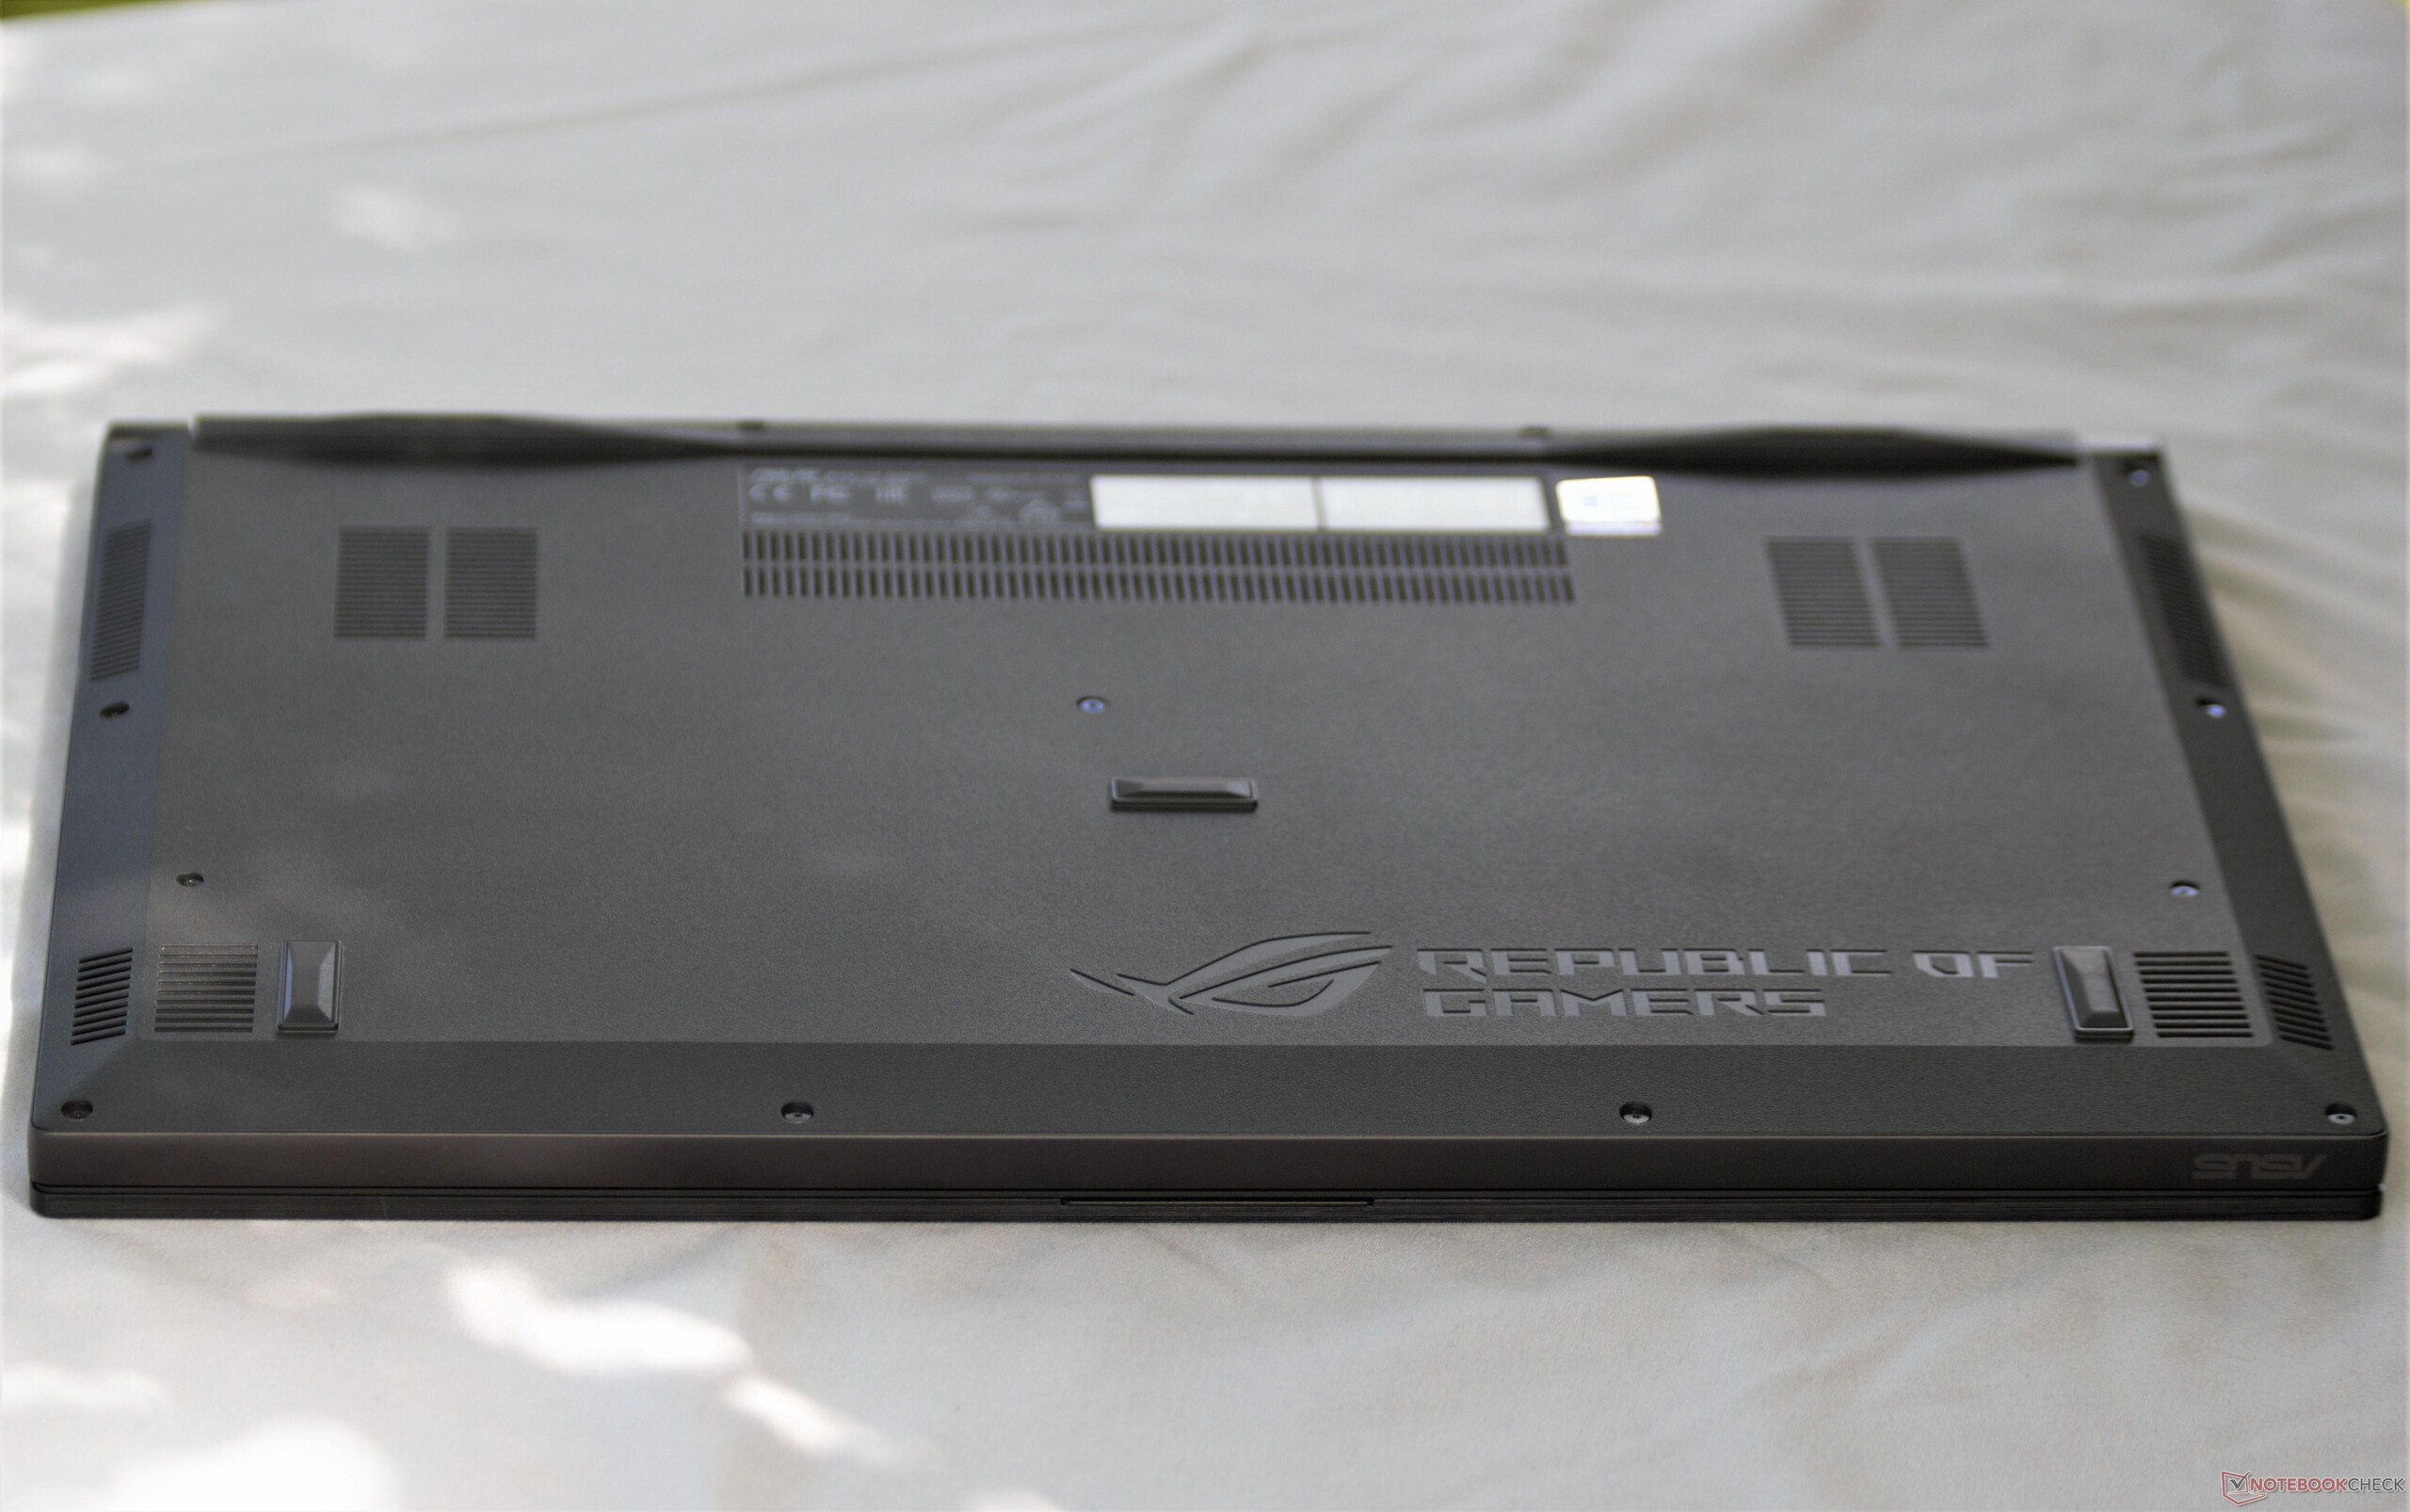
(-) A parte inferior aquece até um máximo de 46.6 °C / 116 F, em comparação com a média de 43.2 °C / 110 F
(+) Em uso inativo, a temperatura média para o lado superior é 26.3 °C / 79 F, em comparação com a média do dispositivo de 33.9 °C / ### class_avg_f### F.
(±) Jogando The Witcher 3, a temperatura média para o lado superior é 34.6 °C / 94 F, em comparação com a média do dispositivo de 33.9 °C / ## #class_avg_f### F.
(+) Os apoios para as mãos e o touchpad são mais frios que a temperatura da pele, com um máximo de 30.2 °C / 86.4 F e, portanto, são frios ao toque.
(±) A temperatura média da área do apoio para as mãos de dispositivos semelhantes foi 28.8 °C / 83.8 F (-1.4 °C / -2.6 F).
| Asus ROG GU501GM-BI7N8 GeForce GTX 1060 Mobile, i7-8750H, Kingston RBUSNS8154P3128GJ | MSI GS65 8RF-019DE Stealth Thin GeForce GTX 1070 Max-Q, i7-8750H, Samsung SSD PM981 MZVLB512HAJQ | Asus Zephyrus M GM501 GeForce GTX 1070 Mobile, i7-8750H, Samsung SM961 MZVKW512HMJP m.2 PCI-e | Gigabyte Aero 15X v8 GeForce GTX 1070 Max-Q, i7-8750H, Toshiba NVMe THNSN5512GPU7 | Aorus X5 v8 GeForce GTX 1070 Mobile, i7-8850H, Toshiba NVMe THNSN5512GPU7 | Acer Predator Triton 700 GeForce GTX 1080 Max-Q, i7-7700HQ, 2x SK Hynix Canvas SC300 512GB M.2 (HFS512G39MND) (RAID 0) | |
|---|---|---|---|---|---|---|
| Heat | -1% | -6% | -10% | -7% | -21% | |
| Maximum Upper Side * (°C) | 43 | 49 -14% | 52 -21% | 53 -23% | 50 -16% | 61 -42% |
| Maximum Bottom * (°C) | 46.6 | 63 -35% | 49 -5% | 65 -39% | 62 -33% | 69 -48% |
| Idle Upper Side * (°C) | 29.2 | 24 18% | 31 -6% | 26 11% | 27 8% | 29 1% |
| Idle Bottom * (°C) | 34 | 25 26% | 31 9% | 30 12% | 29 15% | 32 6% |
* ... menor é melhor
Asus ROG GU501GM-BI7N8 análise de áudio
(±) | o volume do alto-falante é médio, mas bom (###valor### dB)
Graves 100 - 315Hz
(+) | bons graves - apenas 3.8% longe da mediana
(±) | a linearidade dos graves é média (10.3% delta para a frequência anterior)
Médios 400 - 2.000 Hz
(+) | médios equilibrados - apenas 2.3% longe da mediana
(+) | médios são lineares (5.1% delta para frequência anterior)
Altos 2 - 16 kHz
(+) | agudos equilibrados - apenas 4.6% longe da mediana
(+) | os máximos são lineares (6.8% delta da frequência anterior)
Geral 100 - 16.000 Hz
(+) | o som geral é linear (12.6% diferença em relação à mediana)
Comparado com a mesma classe
» 16% de todos os dispositivos testados nesta classe foram melhores, 3% semelhantes, 81% piores
» O melhor teve um delta de 6%, a média foi 18%, o pior foi 132%
Comparado com todos os dispositivos testados
» 11% de todos os dispositivos testados foram melhores, 2% semelhantes, 86% piores
» O melhor teve um delta de 4%, a média foi 24%, o pior foi 134%
MSI GS65 8RF-019DE Stealth Thin análise de áudio
(±) | o volume do alto-falante é médio, mas bom (###valor### dB)
Graves 100 - 315Hz
(-) | quase nenhum baixo - em média 16.4% menor que a mediana
(±) | a linearidade dos graves é média (9.7% delta para a frequência anterior)
Médios 400 - 2.000 Hz
(+) | médios equilibrados - apenas 4.9% longe da mediana
(+) | médios são lineares (5.6% delta para frequência anterior)
Altos 2 - 16 kHz
(+) | agudos equilibrados - apenas 2.5% longe da mediana
(±) | a linearidade dos máximos é média (7.1% delta para frequência anterior)
Geral 100 - 16.000 Hz
(±) | a linearidade do som geral é média (18.5% diferença em relação à mediana)
Comparado com a mesma classe
» 60% de todos os dispositivos testados nesta classe foram melhores, 8% semelhantes, 32% piores
» O melhor teve um delta de 6%, a média foi 18%, o pior foi 132%
Comparado com todos os dispositivos testados
» 41% de todos os dispositivos testados foram melhores, 8% semelhantes, 51% piores
» O melhor teve um delta de 4%, a média foi 24%, o pior foi 134%
| desligado | |
| Ocioso | |
| Carga |
|
Key:
min: | |
| Asus ROG GU501GM-BI7N8 i7-8750H, GeForce GTX 1060 Mobile, Kingston RBUSNS8154P3128GJ, IPS, 1920x1080, 15.6" | Asus FX503VM-EH73 i7-7700HQ, GeForce GTX 1060 Mobile, SanDisk SD8SN8U128G1002, IPS, 1920x1080, 15.6" | MSI GS65 8RF-019DE Stealth Thin i7-8750H, GeForce GTX 1070 Max-Q, Samsung SSD PM981 MZVLB512HAJQ, IPS, 1920x1080, 15.6" | Asus Zephyrus M GM501 i7-8750H, GeForce GTX 1070 Mobile, Samsung SM961 MZVKW512HMJP m.2 PCI-e, IPS, 1920x1080, 15.6" | Gigabyte Aero 15X v8 i7-8750H, GeForce GTX 1070 Max-Q, Toshiba NVMe THNSN5512GPU7, IPS, 1920x1080, 15.6" | Aorus X5 v8 i7-8850H, GeForce GTX 1070 Mobile, Toshiba NVMe THNSN5512GPU7, IPS, 1920x1080, 15.6" | Acer Predator Triton 700 i7-7700HQ, GeForce GTX 1080 Max-Q, 2x SK Hynix Canvas SC300 512GB M.2 (HFS512G39MND) (RAID 0), IPS, 1920x1080, 15.6" | |
|---|---|---|---|---|---|---|---|
| Power Consumption | 15% | 13% | -20% | -3% | -52% | -55% | |
| Idle Minimum * (Watt) | 12.35 | 12.8 -4% | 7 43% | 16 -30% | 14 -13% | 25 -102% | 28 -127% |
| Idle Average * (Watt) | 19.98 | 15.4 23% | 11 45% | 19 5% | 18 10% | 31 -55% | 33 -65% |
| Idle Maximum * (Watt) | 25.44 | 15.9 37% | 20 21% | 26 -2% | 22 14% | 33 -30% | 41 -61% |
| Load Average * (Watt) | 94.28 | 78 17% | 98 -4% | 103 -9% | 91 3% | 102 -8% | 94 -0% |
| Witcher 3 ultra * (Watt) | 132.9 | 107.3 19% | 132 1% | 164 -23% | 142 -7% | 194 -46% | 160 -20% |
| Load Maximum * (Watt) | 140.63 | 143.4 -2% | 182 -29% | 223 -59% | 173 -23% | 239 -70% | 222 -58% |
* ... menor é melhor
| Asus ROG GU501GM-BI7N8 i7-8750H, GeForce GTX 1060 Mobile, 55 Wh | MSI GS65 8RF-019DE Stealth Thin i7-8750H, GeForce GTX 1070 Max-Q, 82 Wh | Asus Zephyrus M GM501 i7-8750H, GeForce GTX 1070 Mobile, 55 Wh | Gigabyte Aero 15X v8 i7-8750H, GeForce GTX 1070 Max-Q, 94.24 Wh | Aorus X5 v8 i7-8850H, GeForce GTX 1070 Mobile, 92.24 Wh | Acer Predator Triton 700 i7-7700HQ, GeForce GTX 1080 Max-Q, 54 Wh | |
|---|---|---|---|---|---|---|
| Duração da bateria | 71% | 2% | 174% | 49% | -11% | |
| Reader / Idle (h) | 4.5 | 8.5 89% | 4 -11% | 12.7 182% | 4.9 9% | 2.5 -44% |
| WiFi v1.3 (h) | 4 | 6 50% | 2.7 -32% | 8.6 115% | 2.4 -40% | |
| Load (h) | 0.8 | 1.4 75% | 1.2 50% | 2.6 225% | 1.5 88% | 1.2 50% |
Pro
Contra
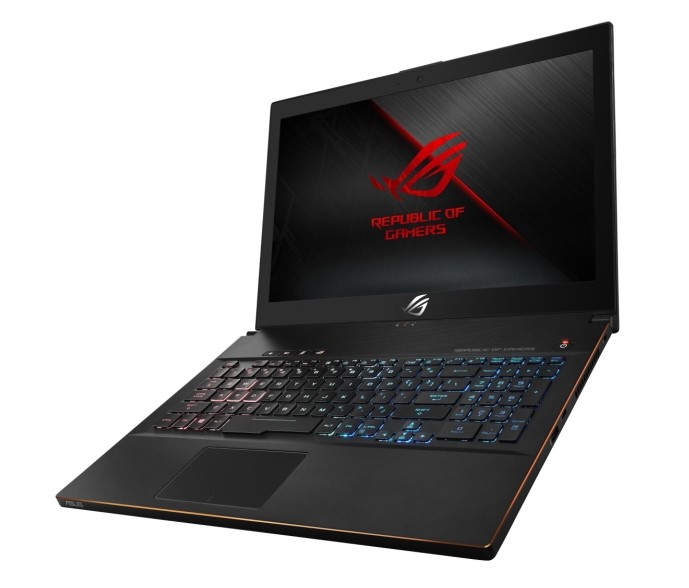
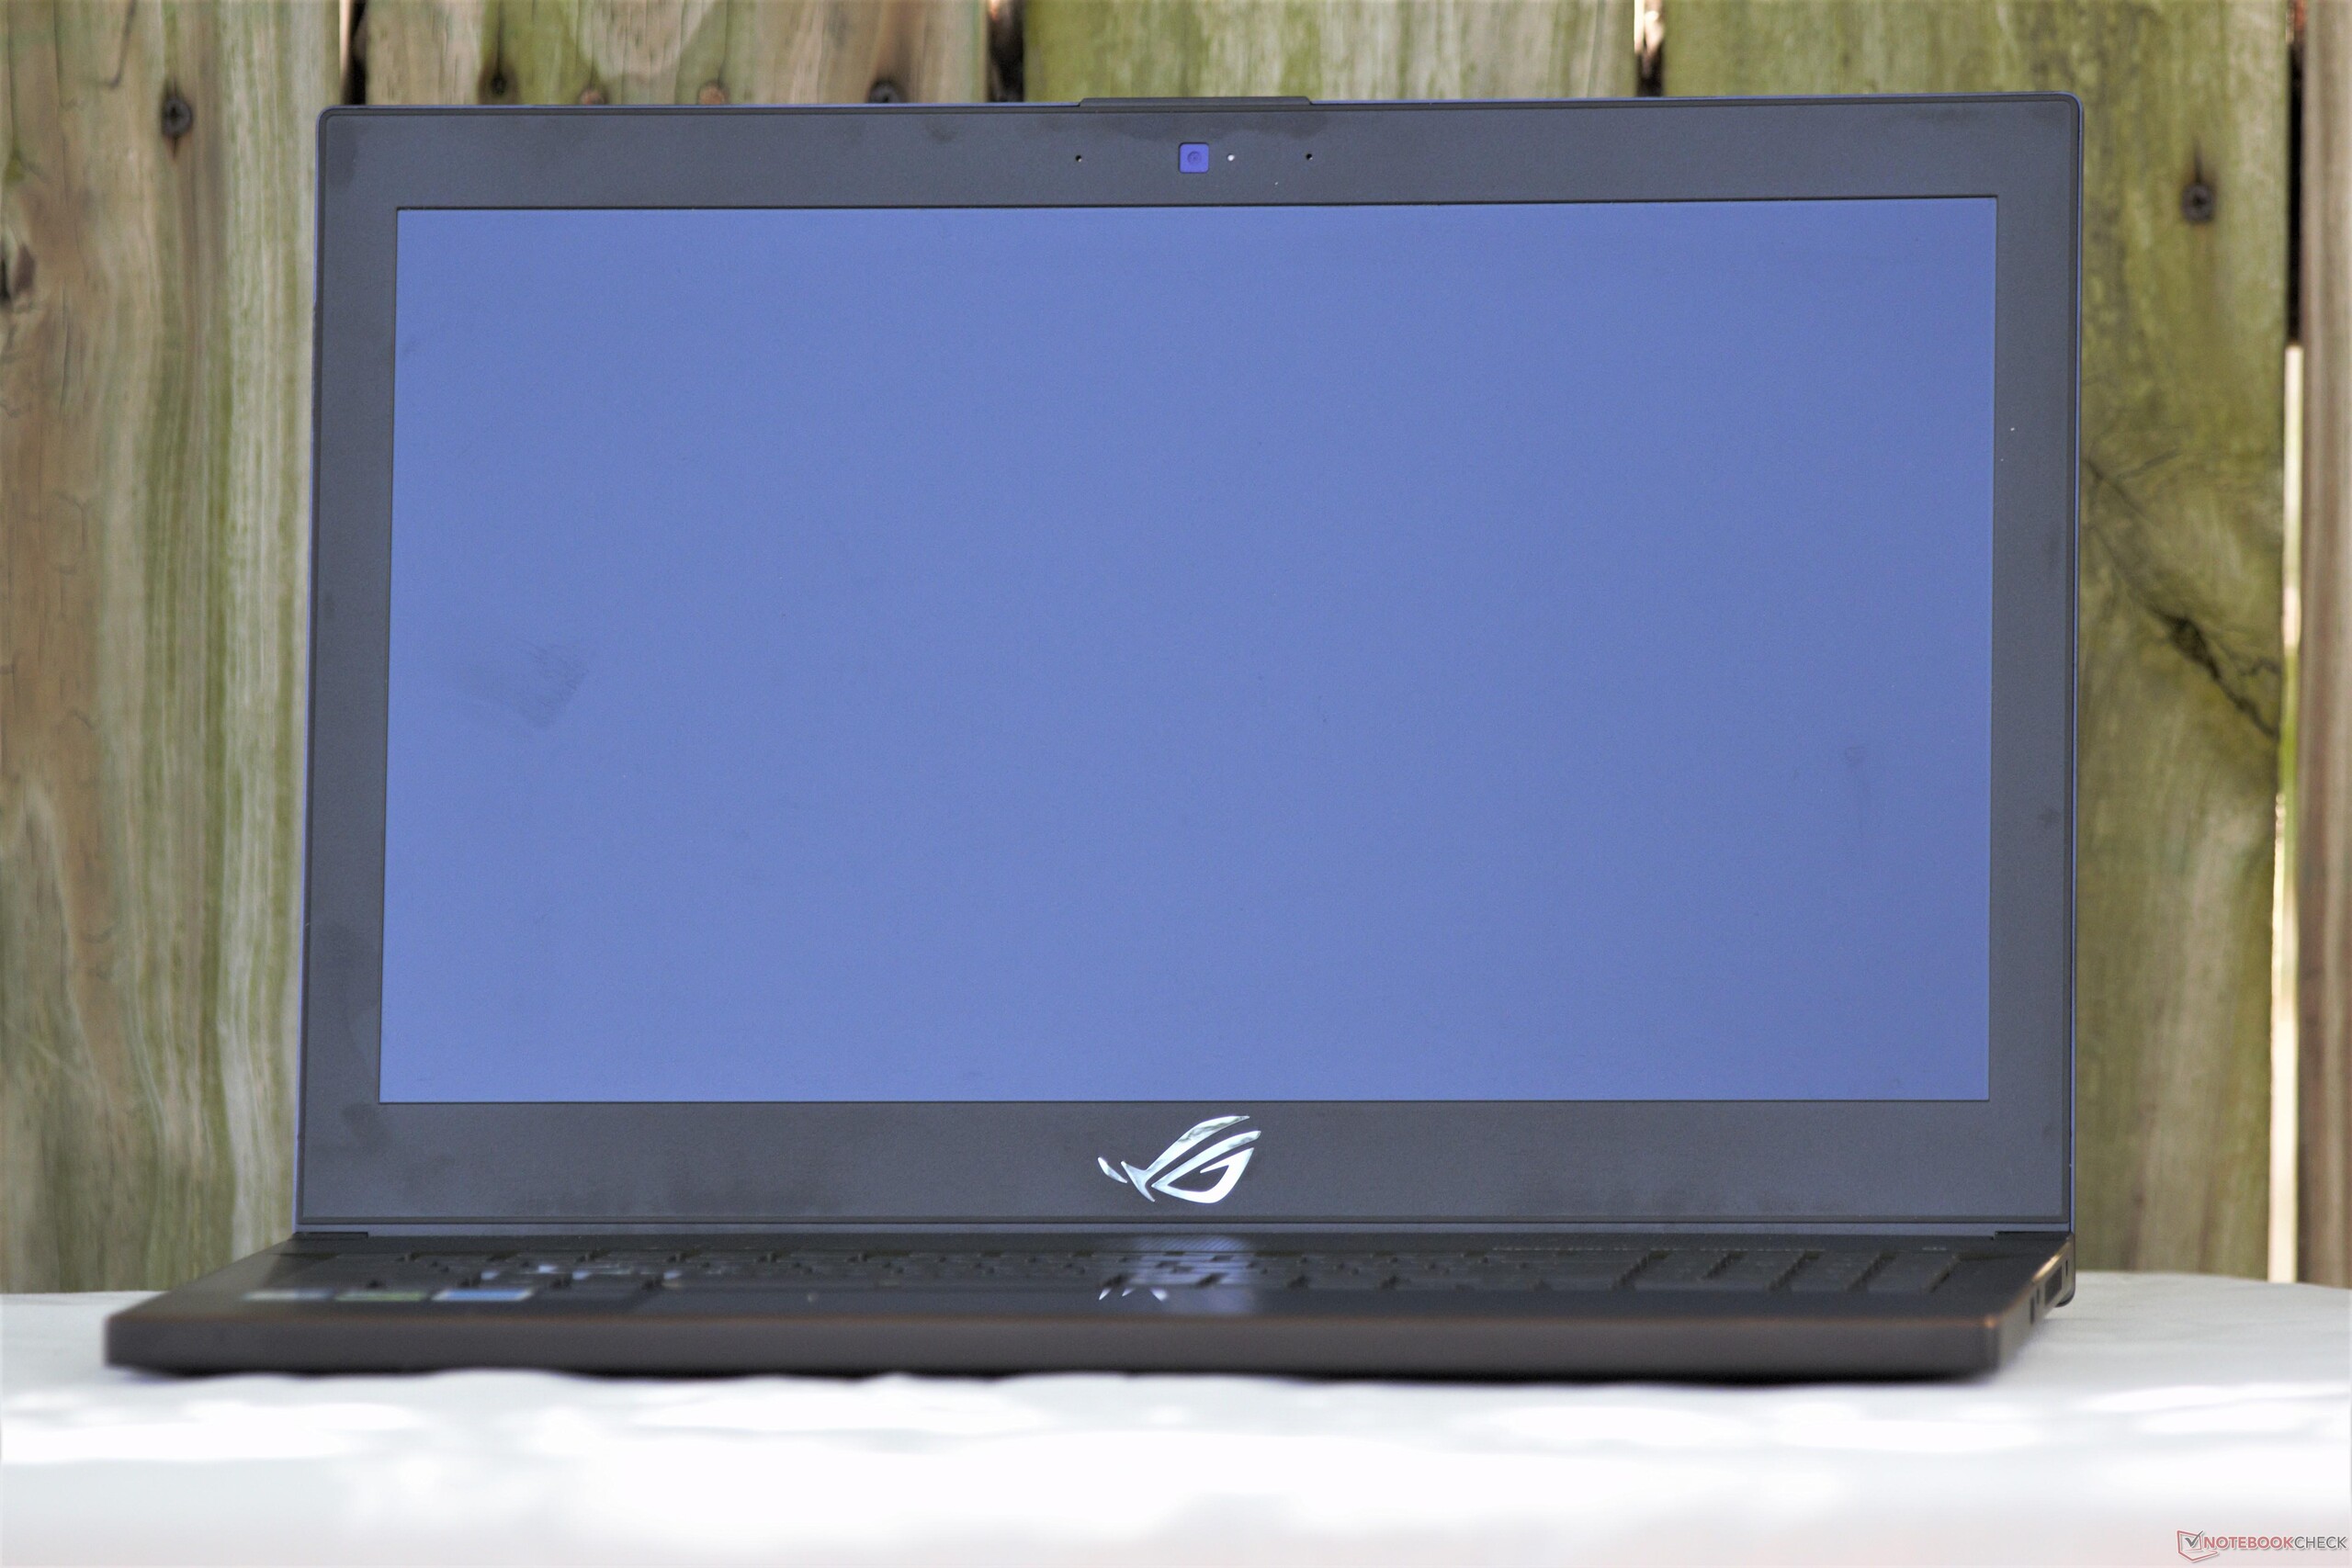
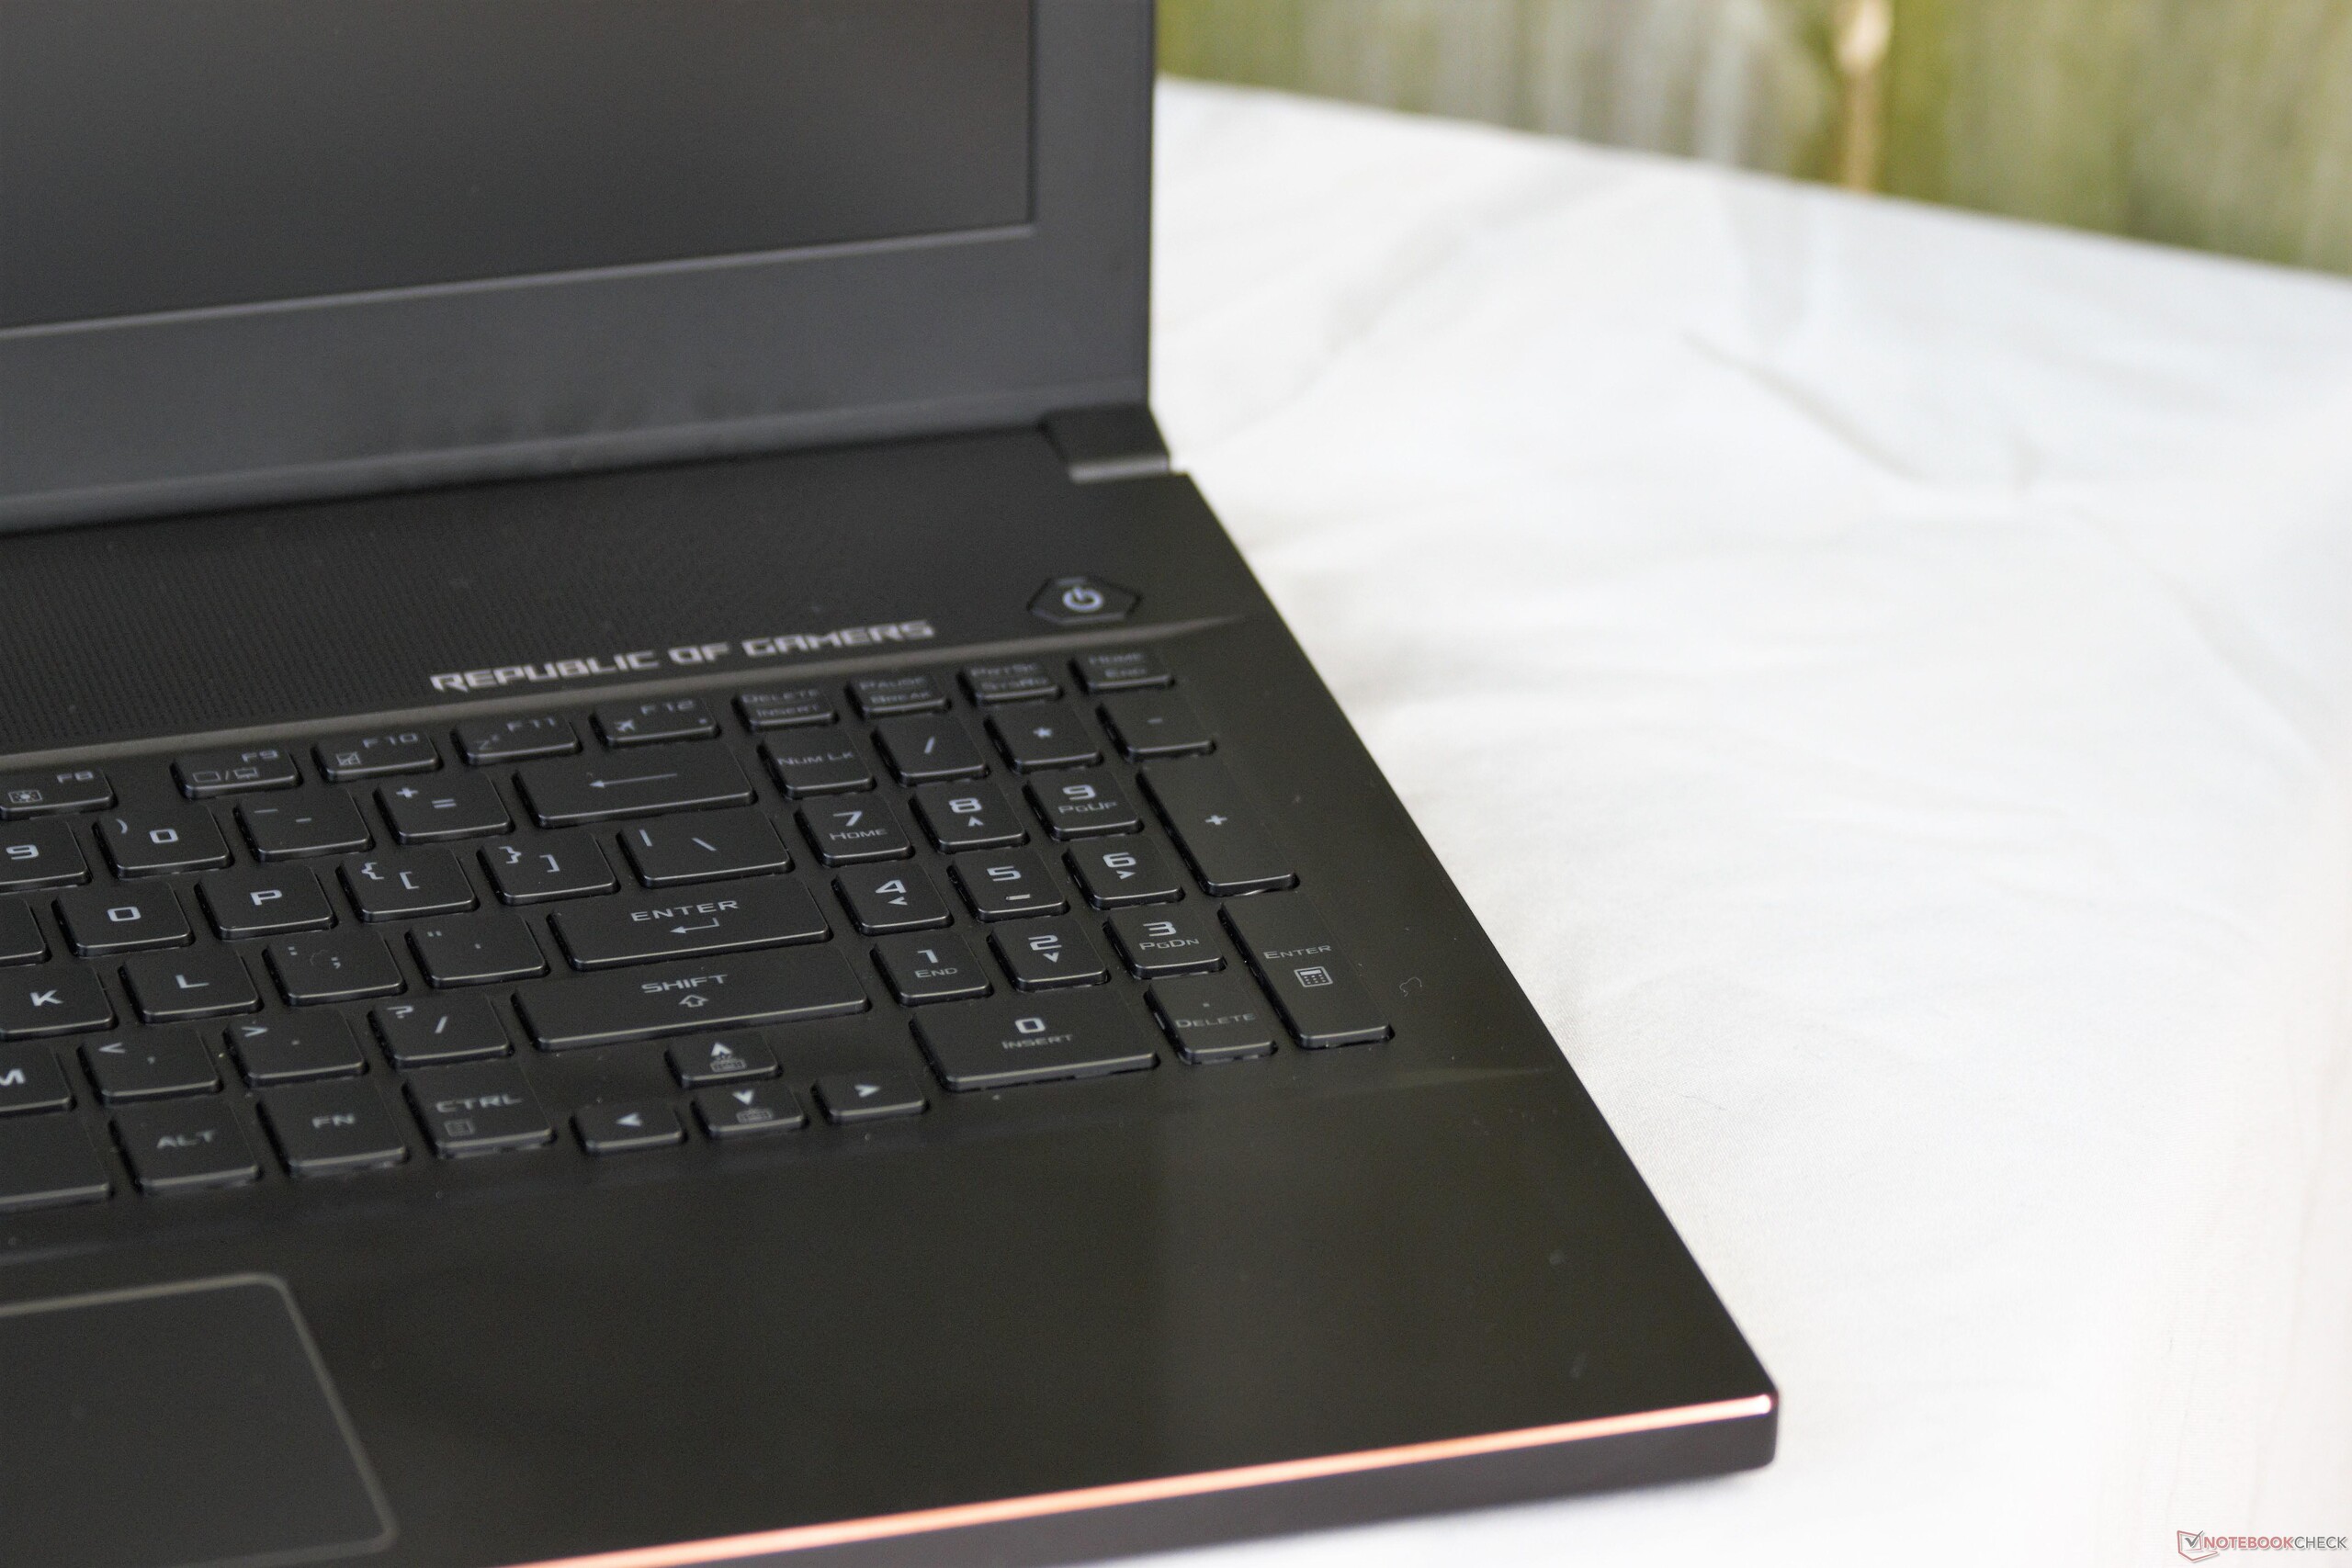
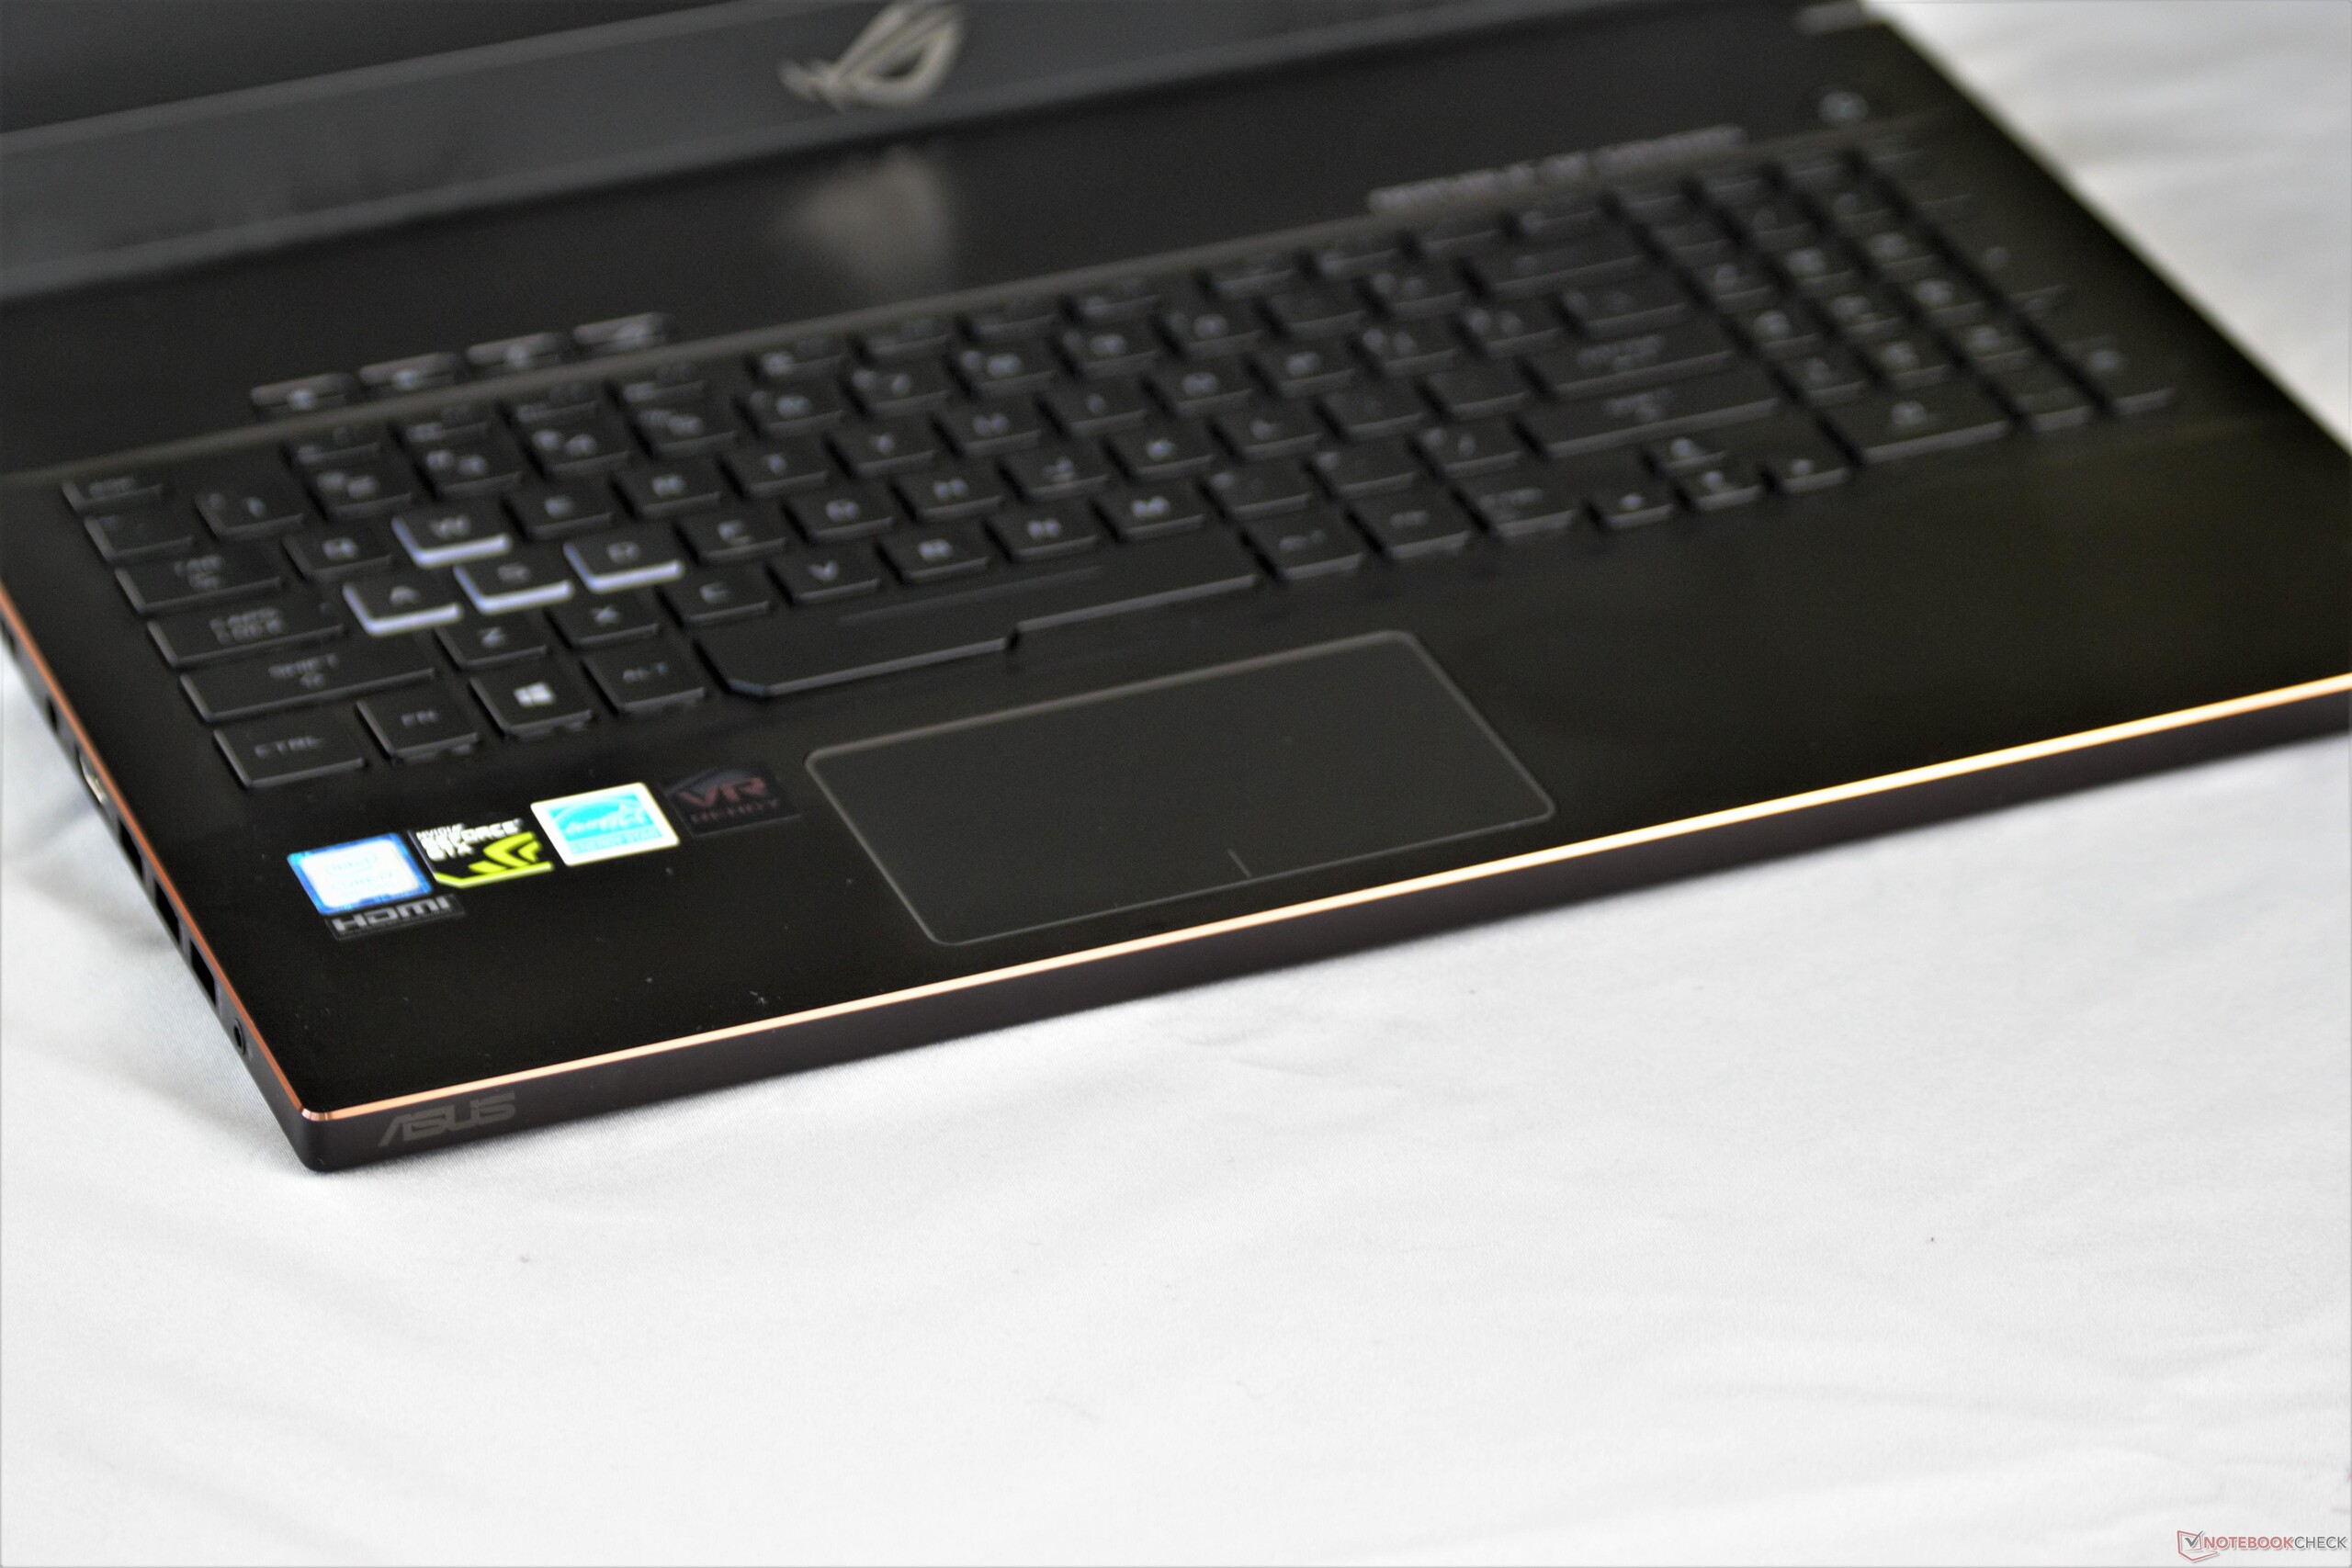
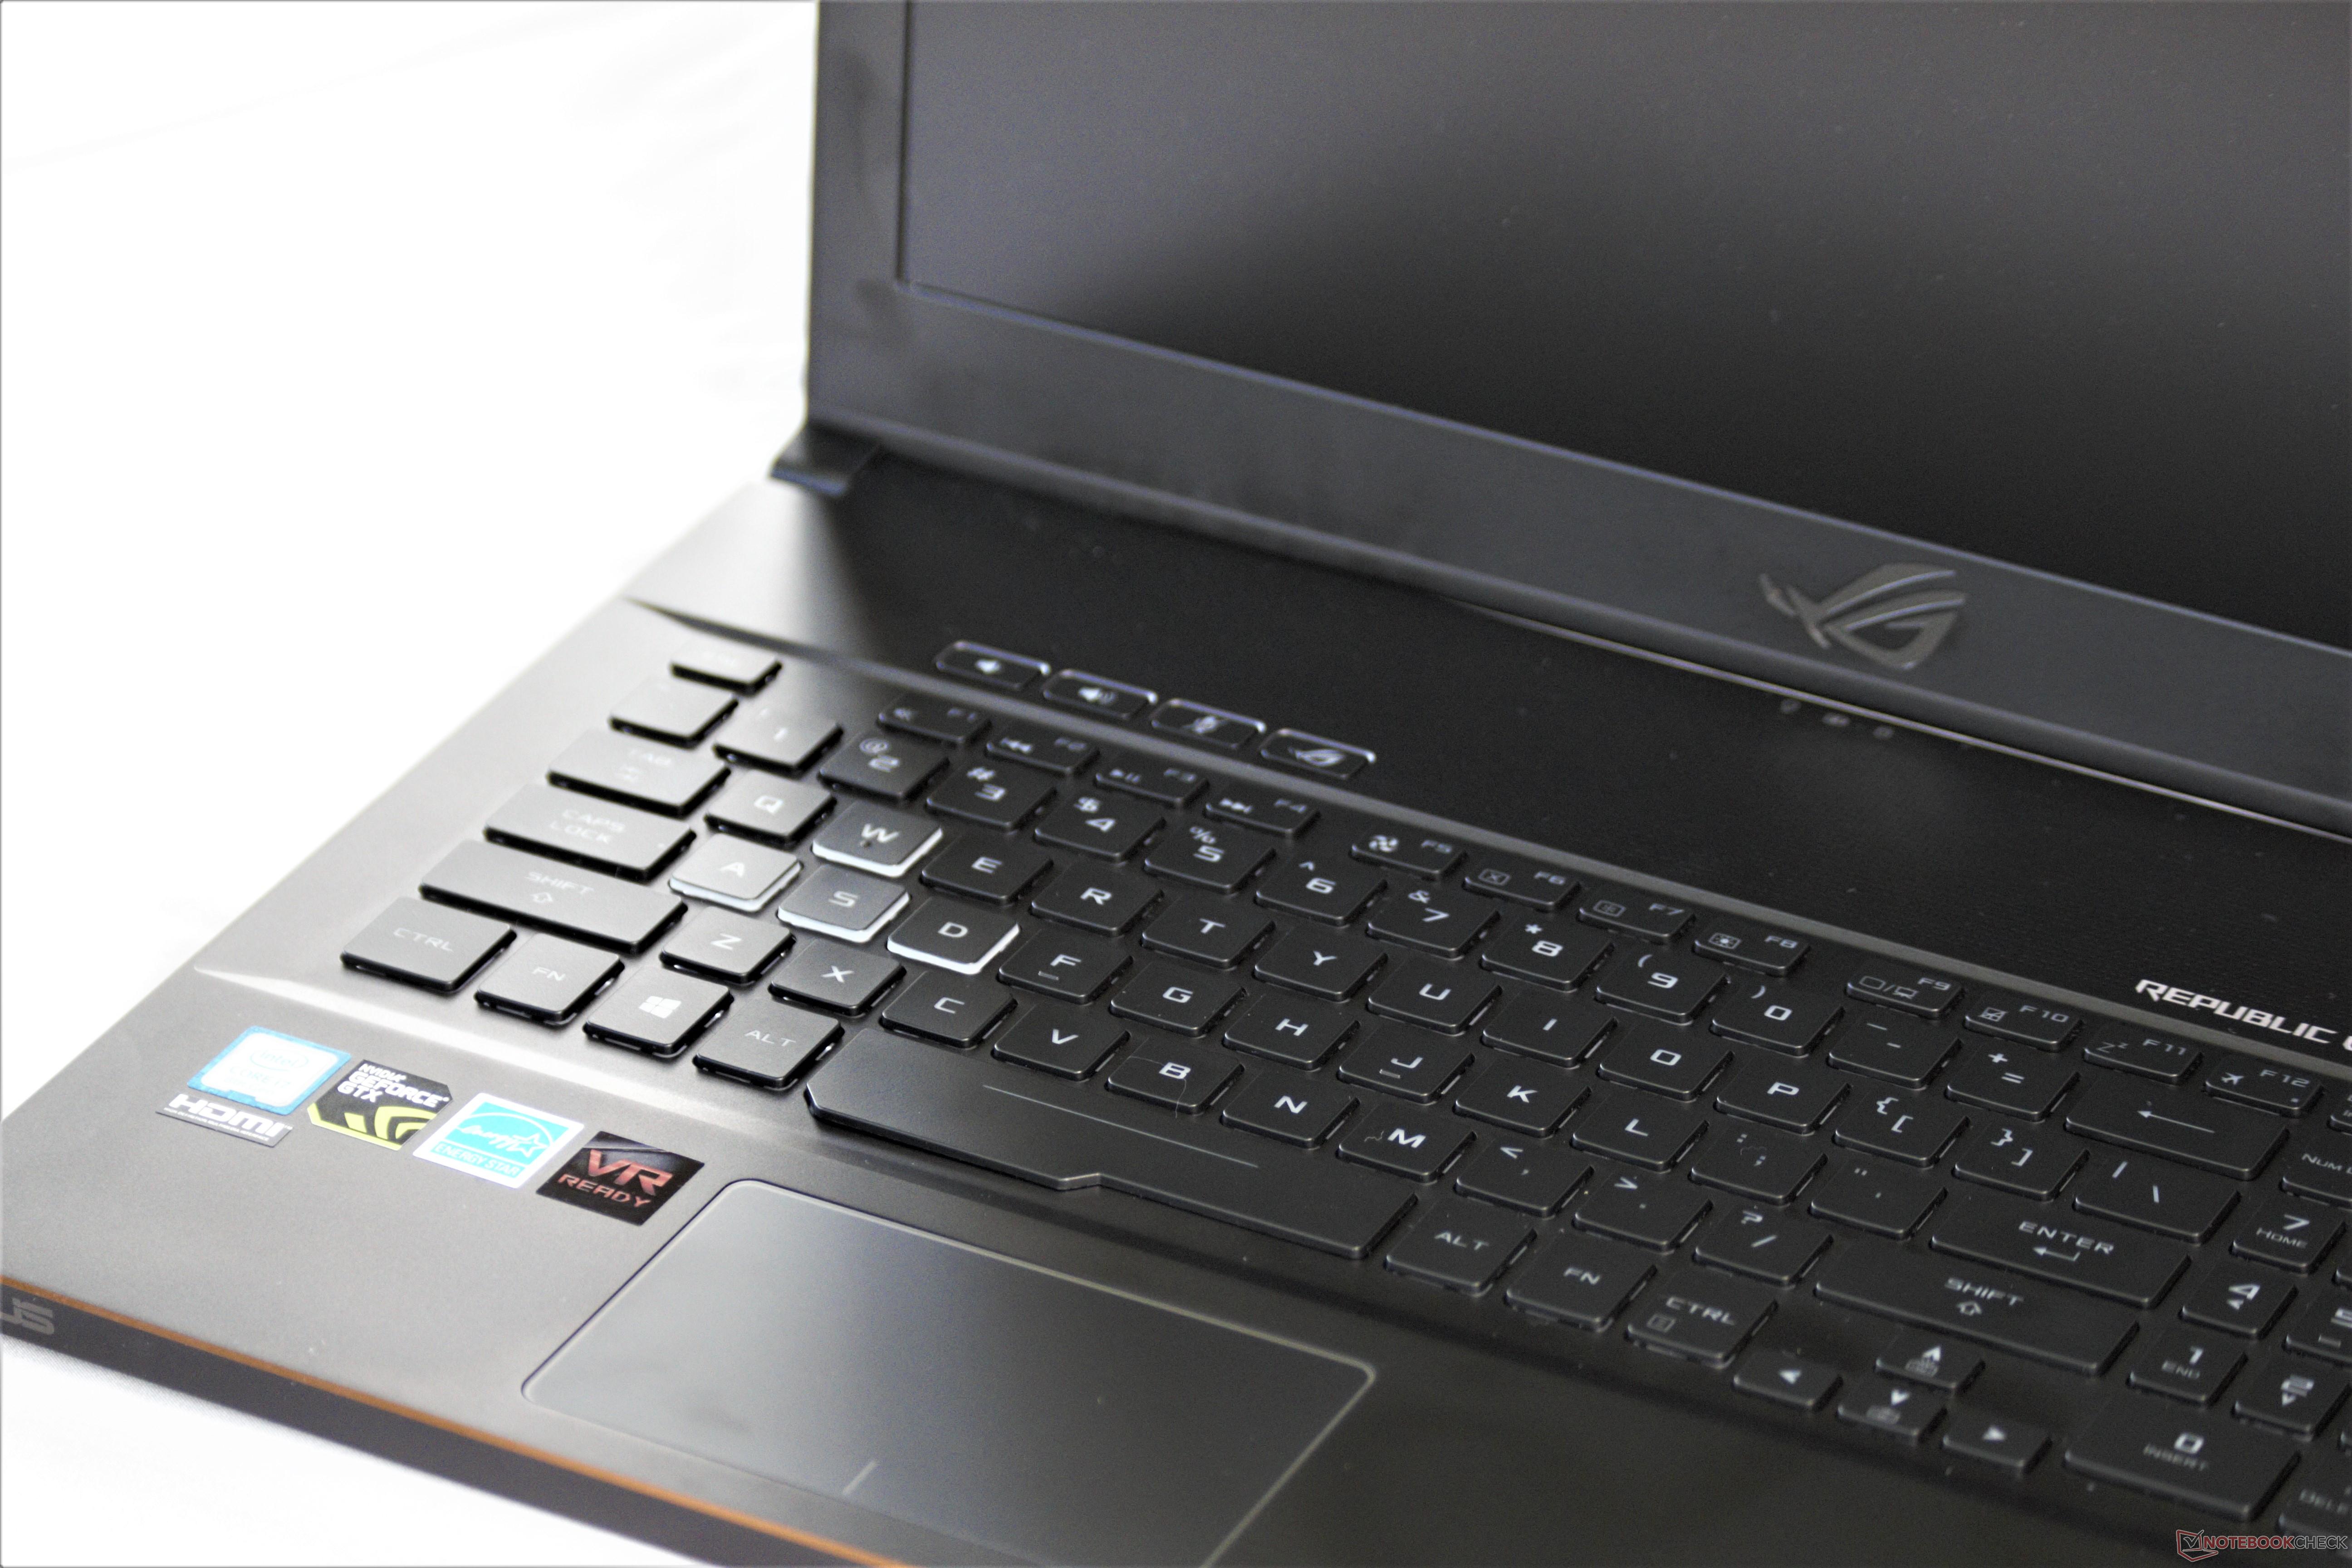
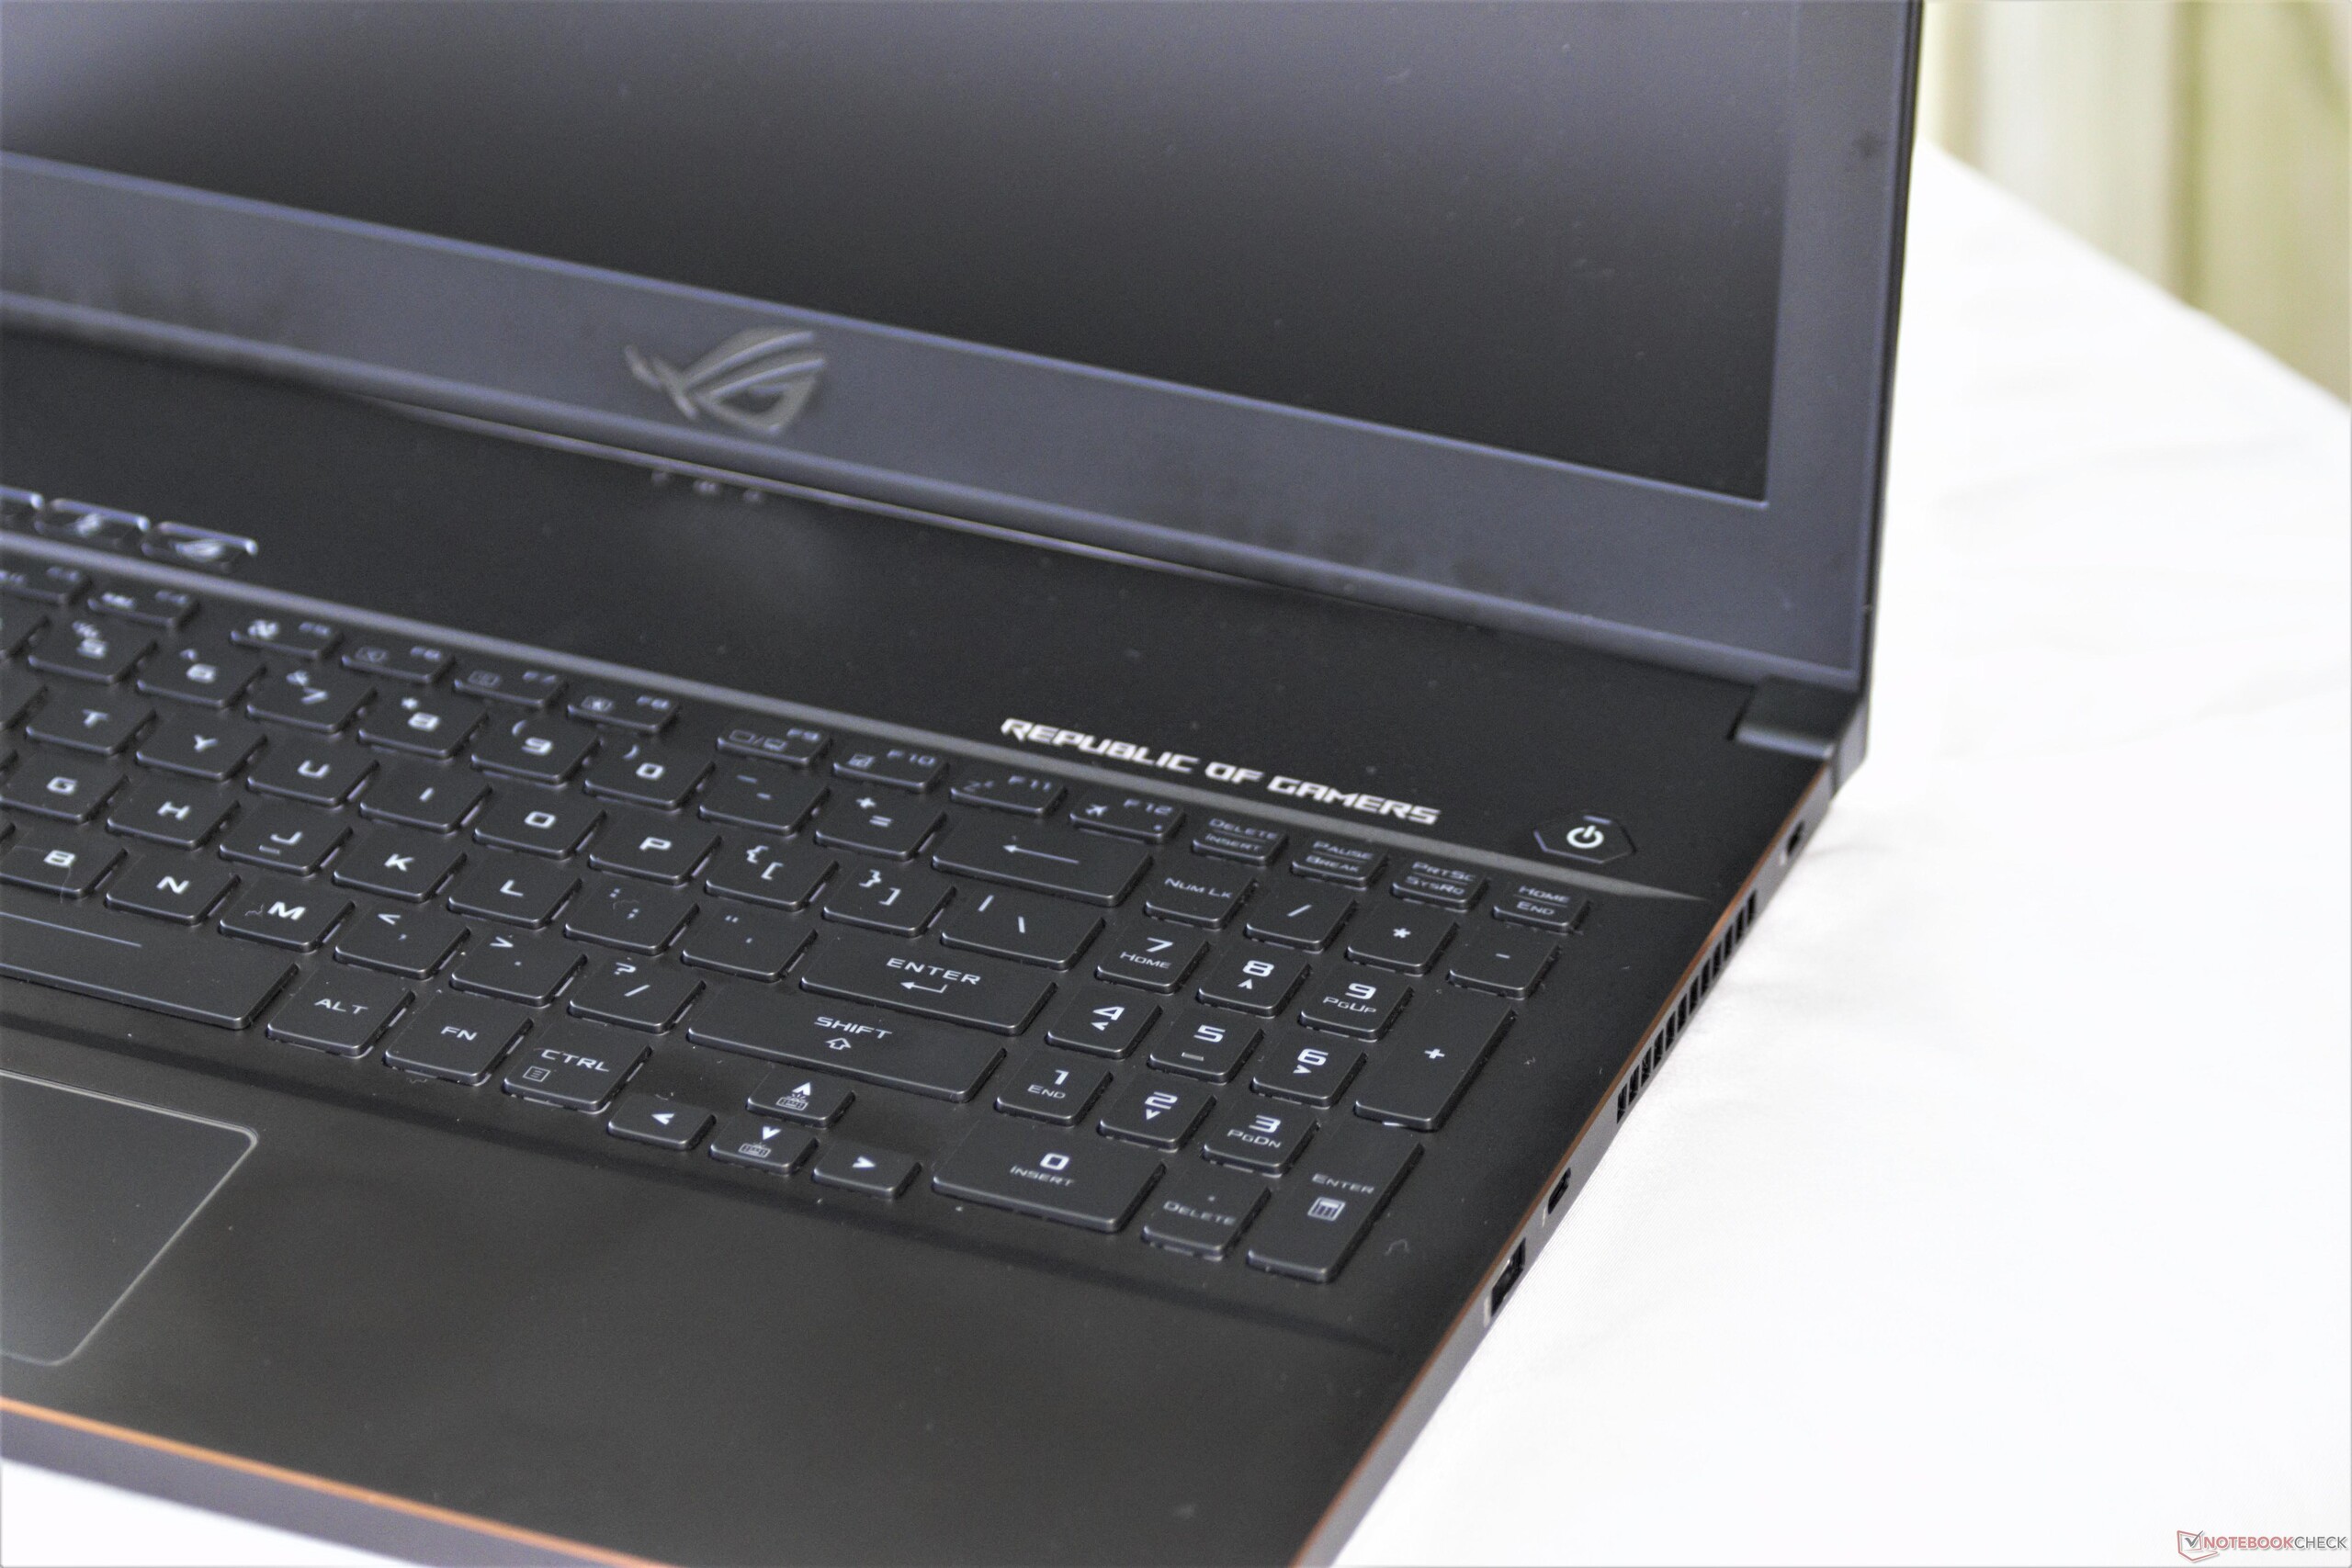
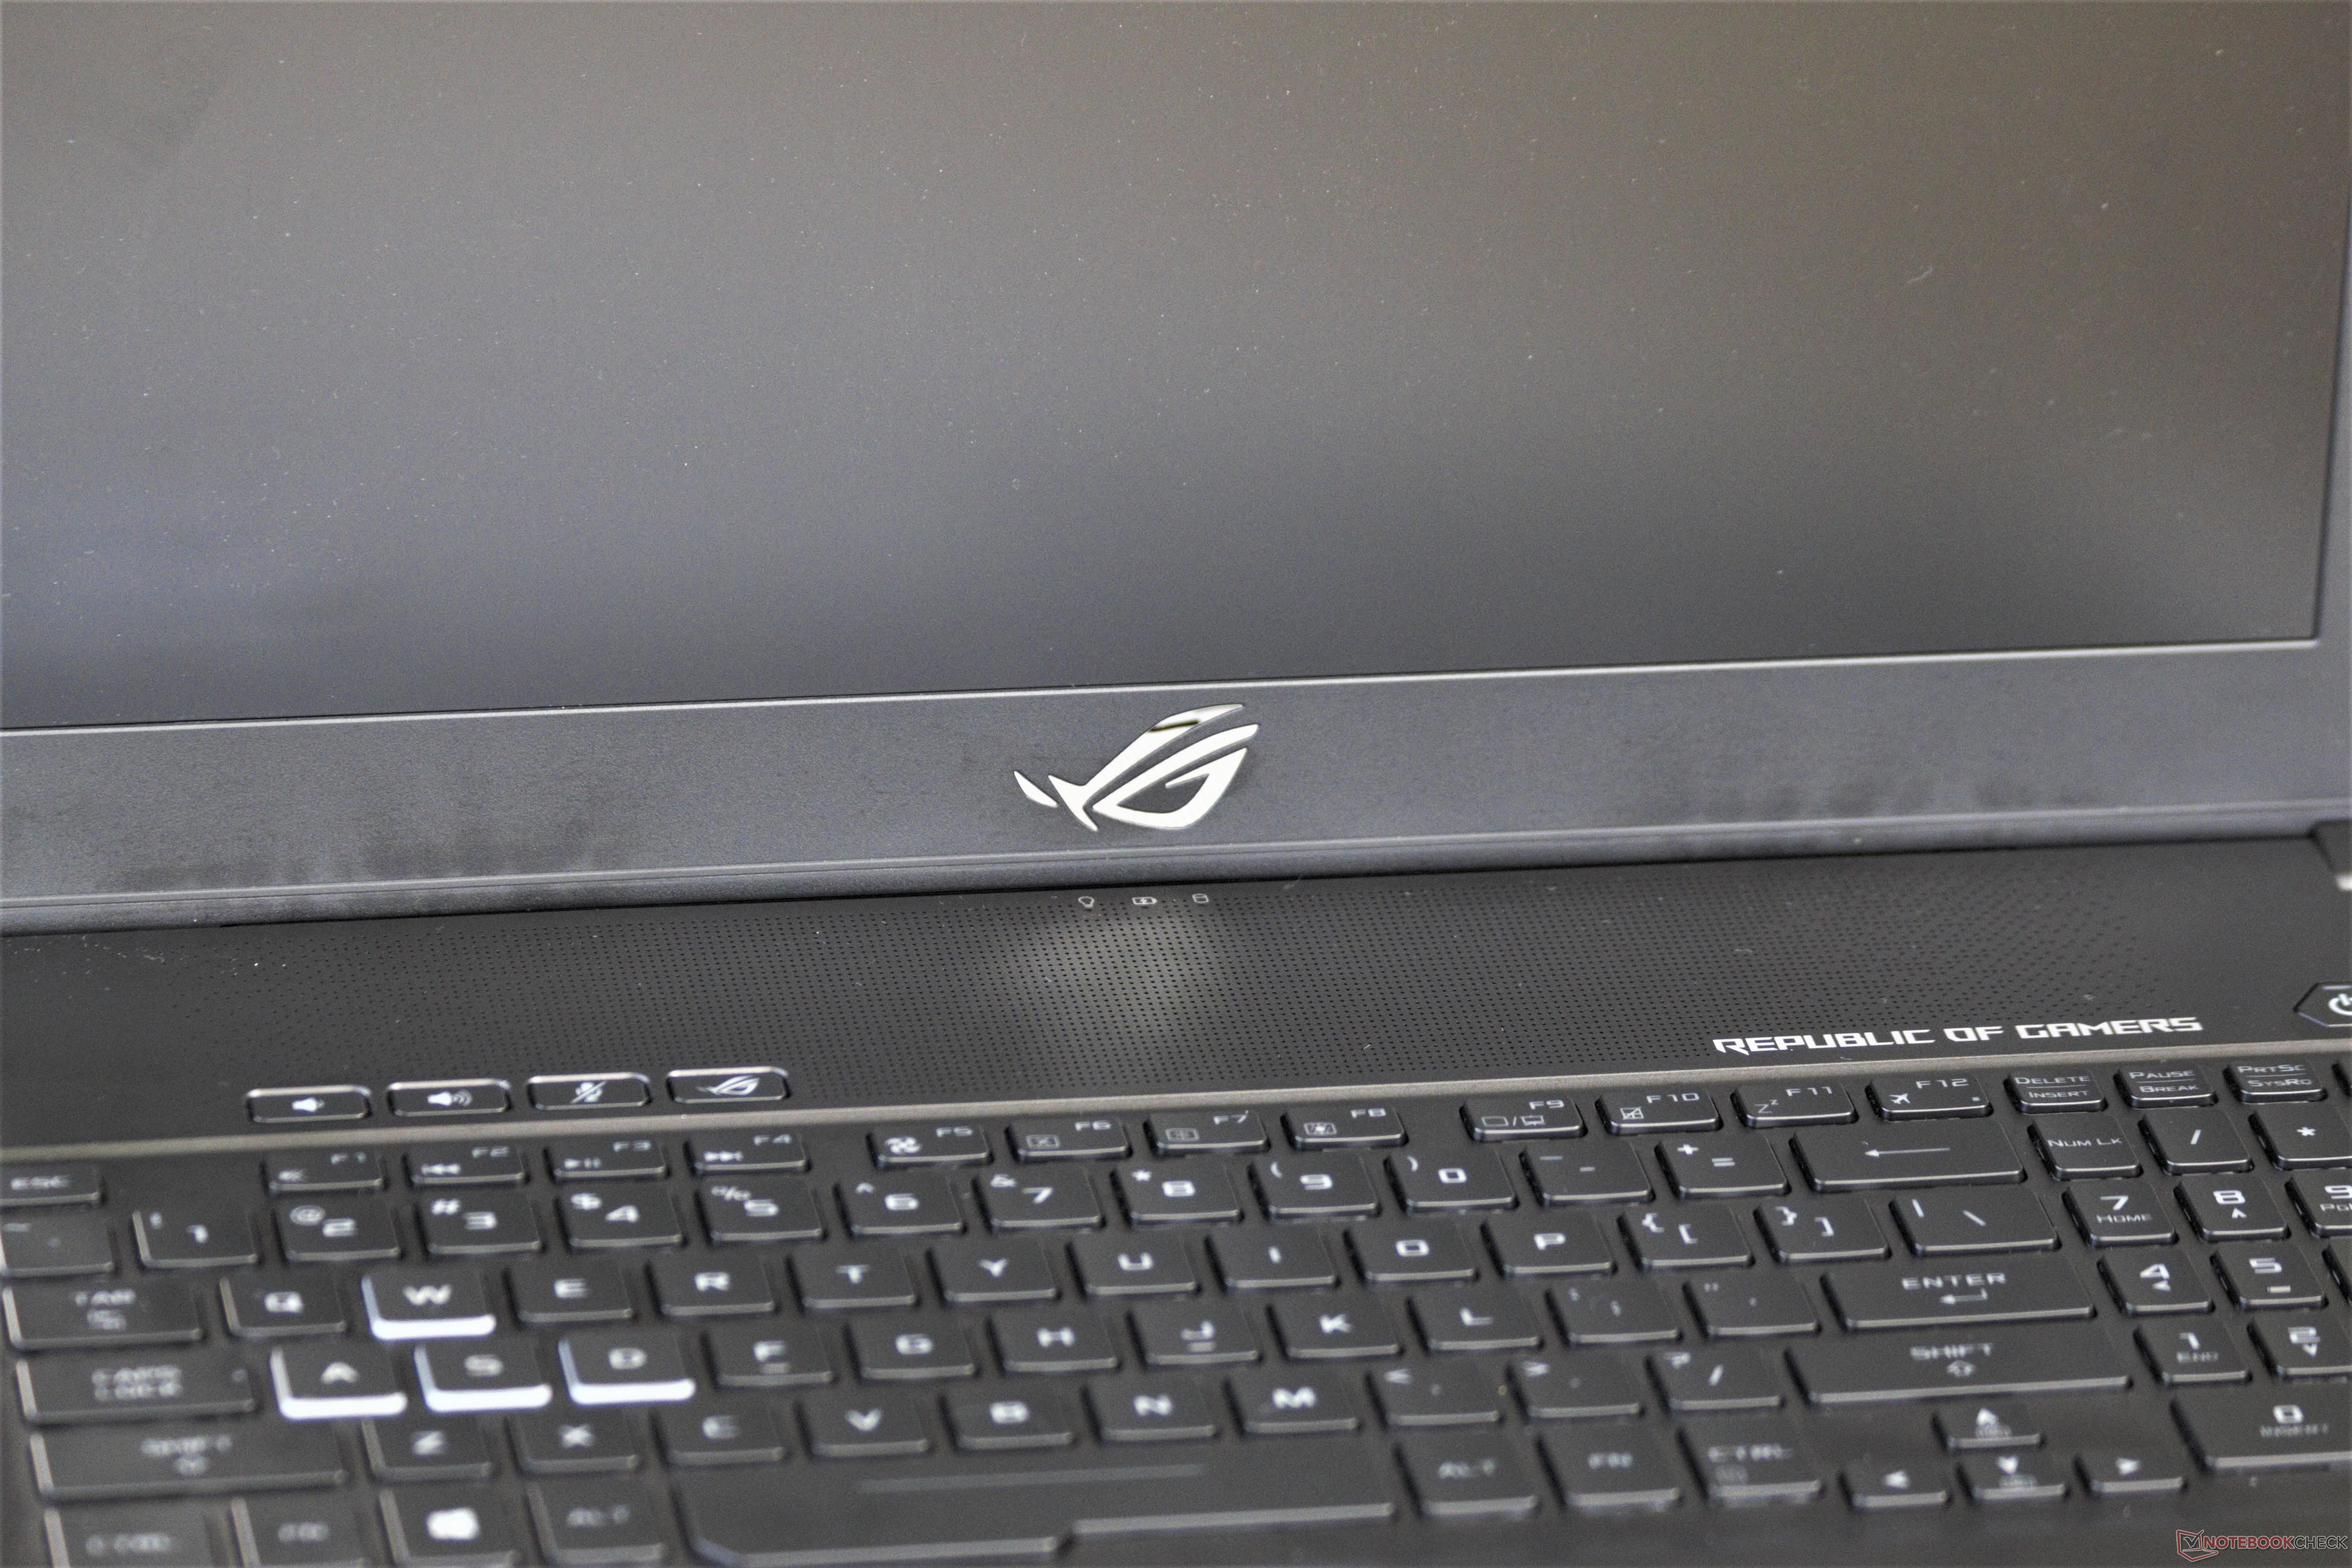
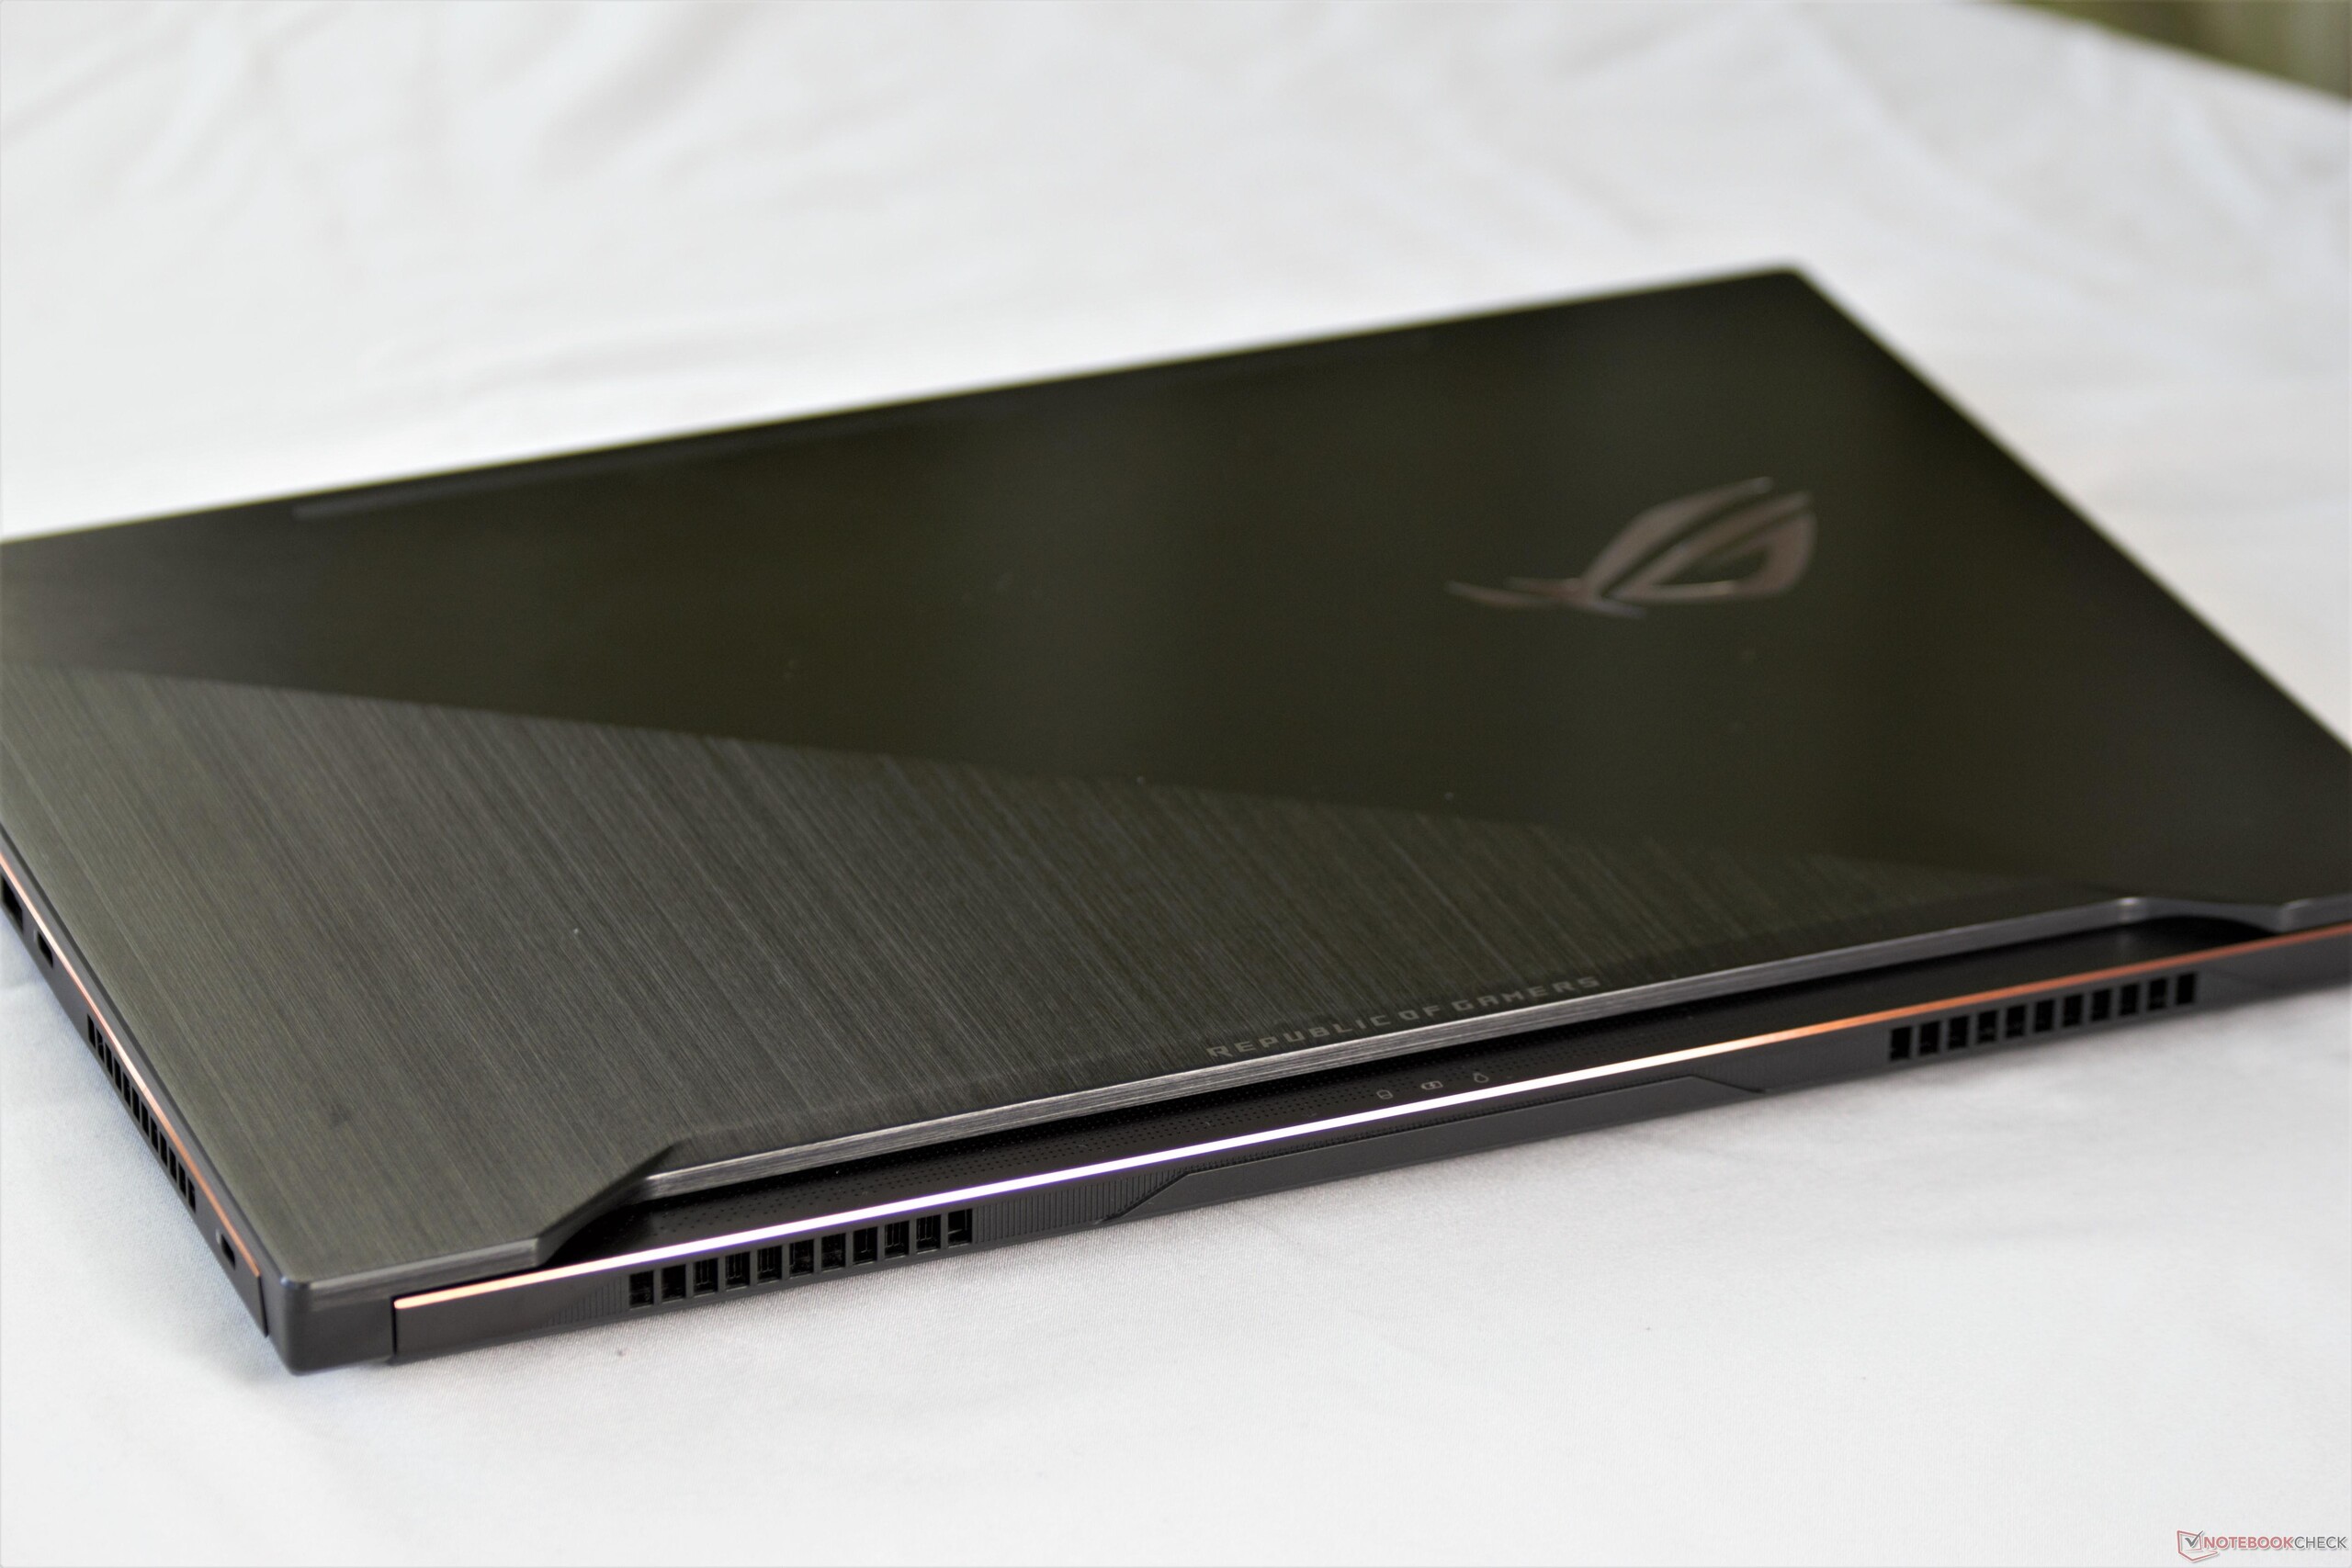
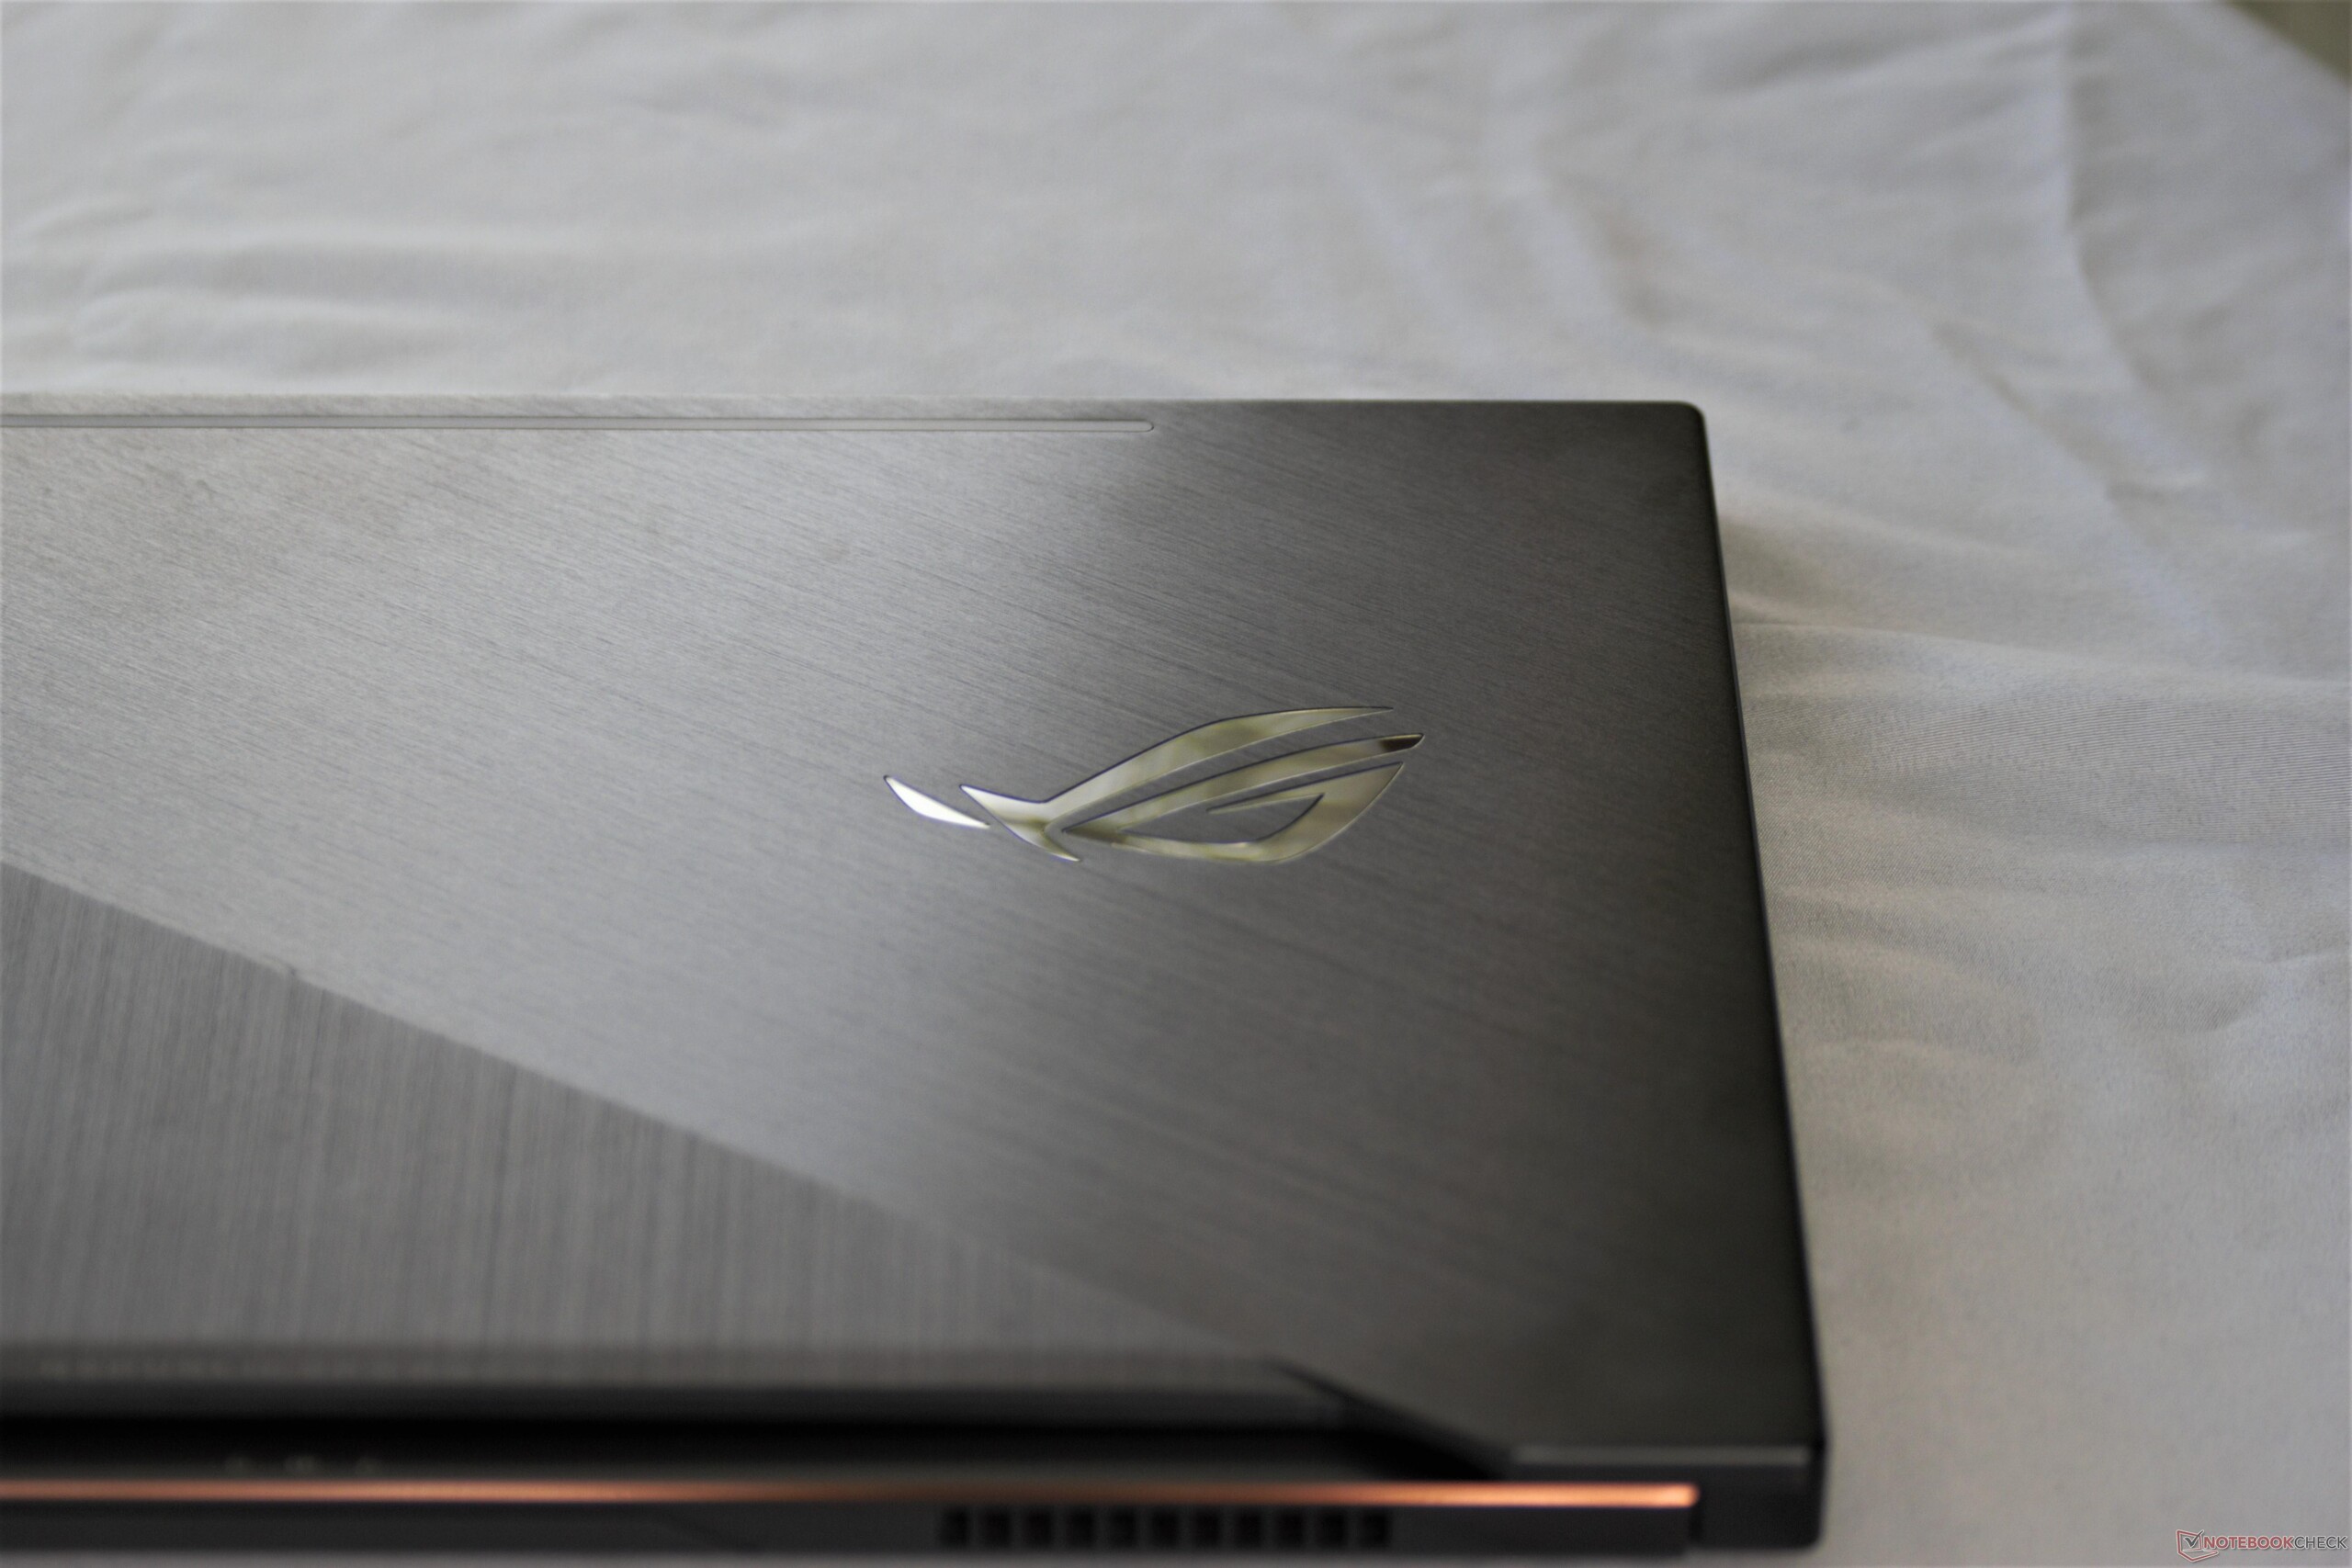
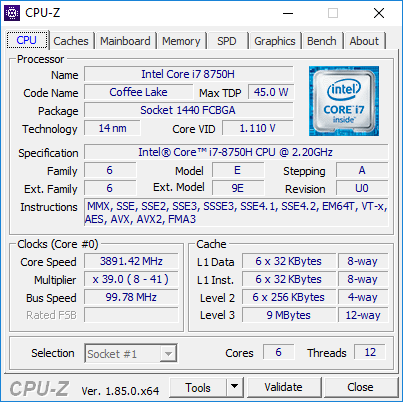
O GU501GM visa trazer o melhor do Zephyrus M para uma faixa de preço mais baixa. Na maior parte, consegue fazer isso com sucesso. A mesmo carcaça elegante e premium (sem o elegante mecanismo de dobradiça no painel inferior) faz a transição, assim como o teclado, os alto-falantes e o Corei7-8750H topo de linha.
Infelizmente, esta CPU prova ser um pouco confusa. O desempenho aprimorado é muito apreciado na maioria das tarefas, embora a CPU não pareça se manter estável sob estresse computacional. Os ventiladores são outro ponto de aborrecimento; seu ruído de alta frequência range nos ouvidos e se tornará o foco de atenção em uma cafeteria. No lado positivo, há atenuações para esses problemas. Embora o sistema trave sob estresse da CPU, todas as outras cargas de trabalho são bem geridas. Os diferentes modos do ventilador ajudam a controlar o ruído do ventilador ao custo de maior calor e menor desempenho.
Tudo dito, há pouco a não gostar sobre o GU501GM, mas considerando o preço, há poucos motivos além da estética para considerar uma compra. Em seu preço de rua recomendado de $1900, o GU501GM é simplesmente muito caro para ser viável; há outros dispositivos belamente criados com especificações similares, que sutam menos (a linha Strix da Asus vem à mente). Pelo mesmo preço ou um pouco mais, os usuários poderiam atualizar para um hardware mais potente e um pacote geral melhor, como os oferecidos pelo Aero 15x da Gigabyte ou pelo MSI GS65 Stealth Thin. Mesmo com o preço de venda atual de $1.500, é difícil recomendar o GU501GM sobre outras máquinas semelhantes.
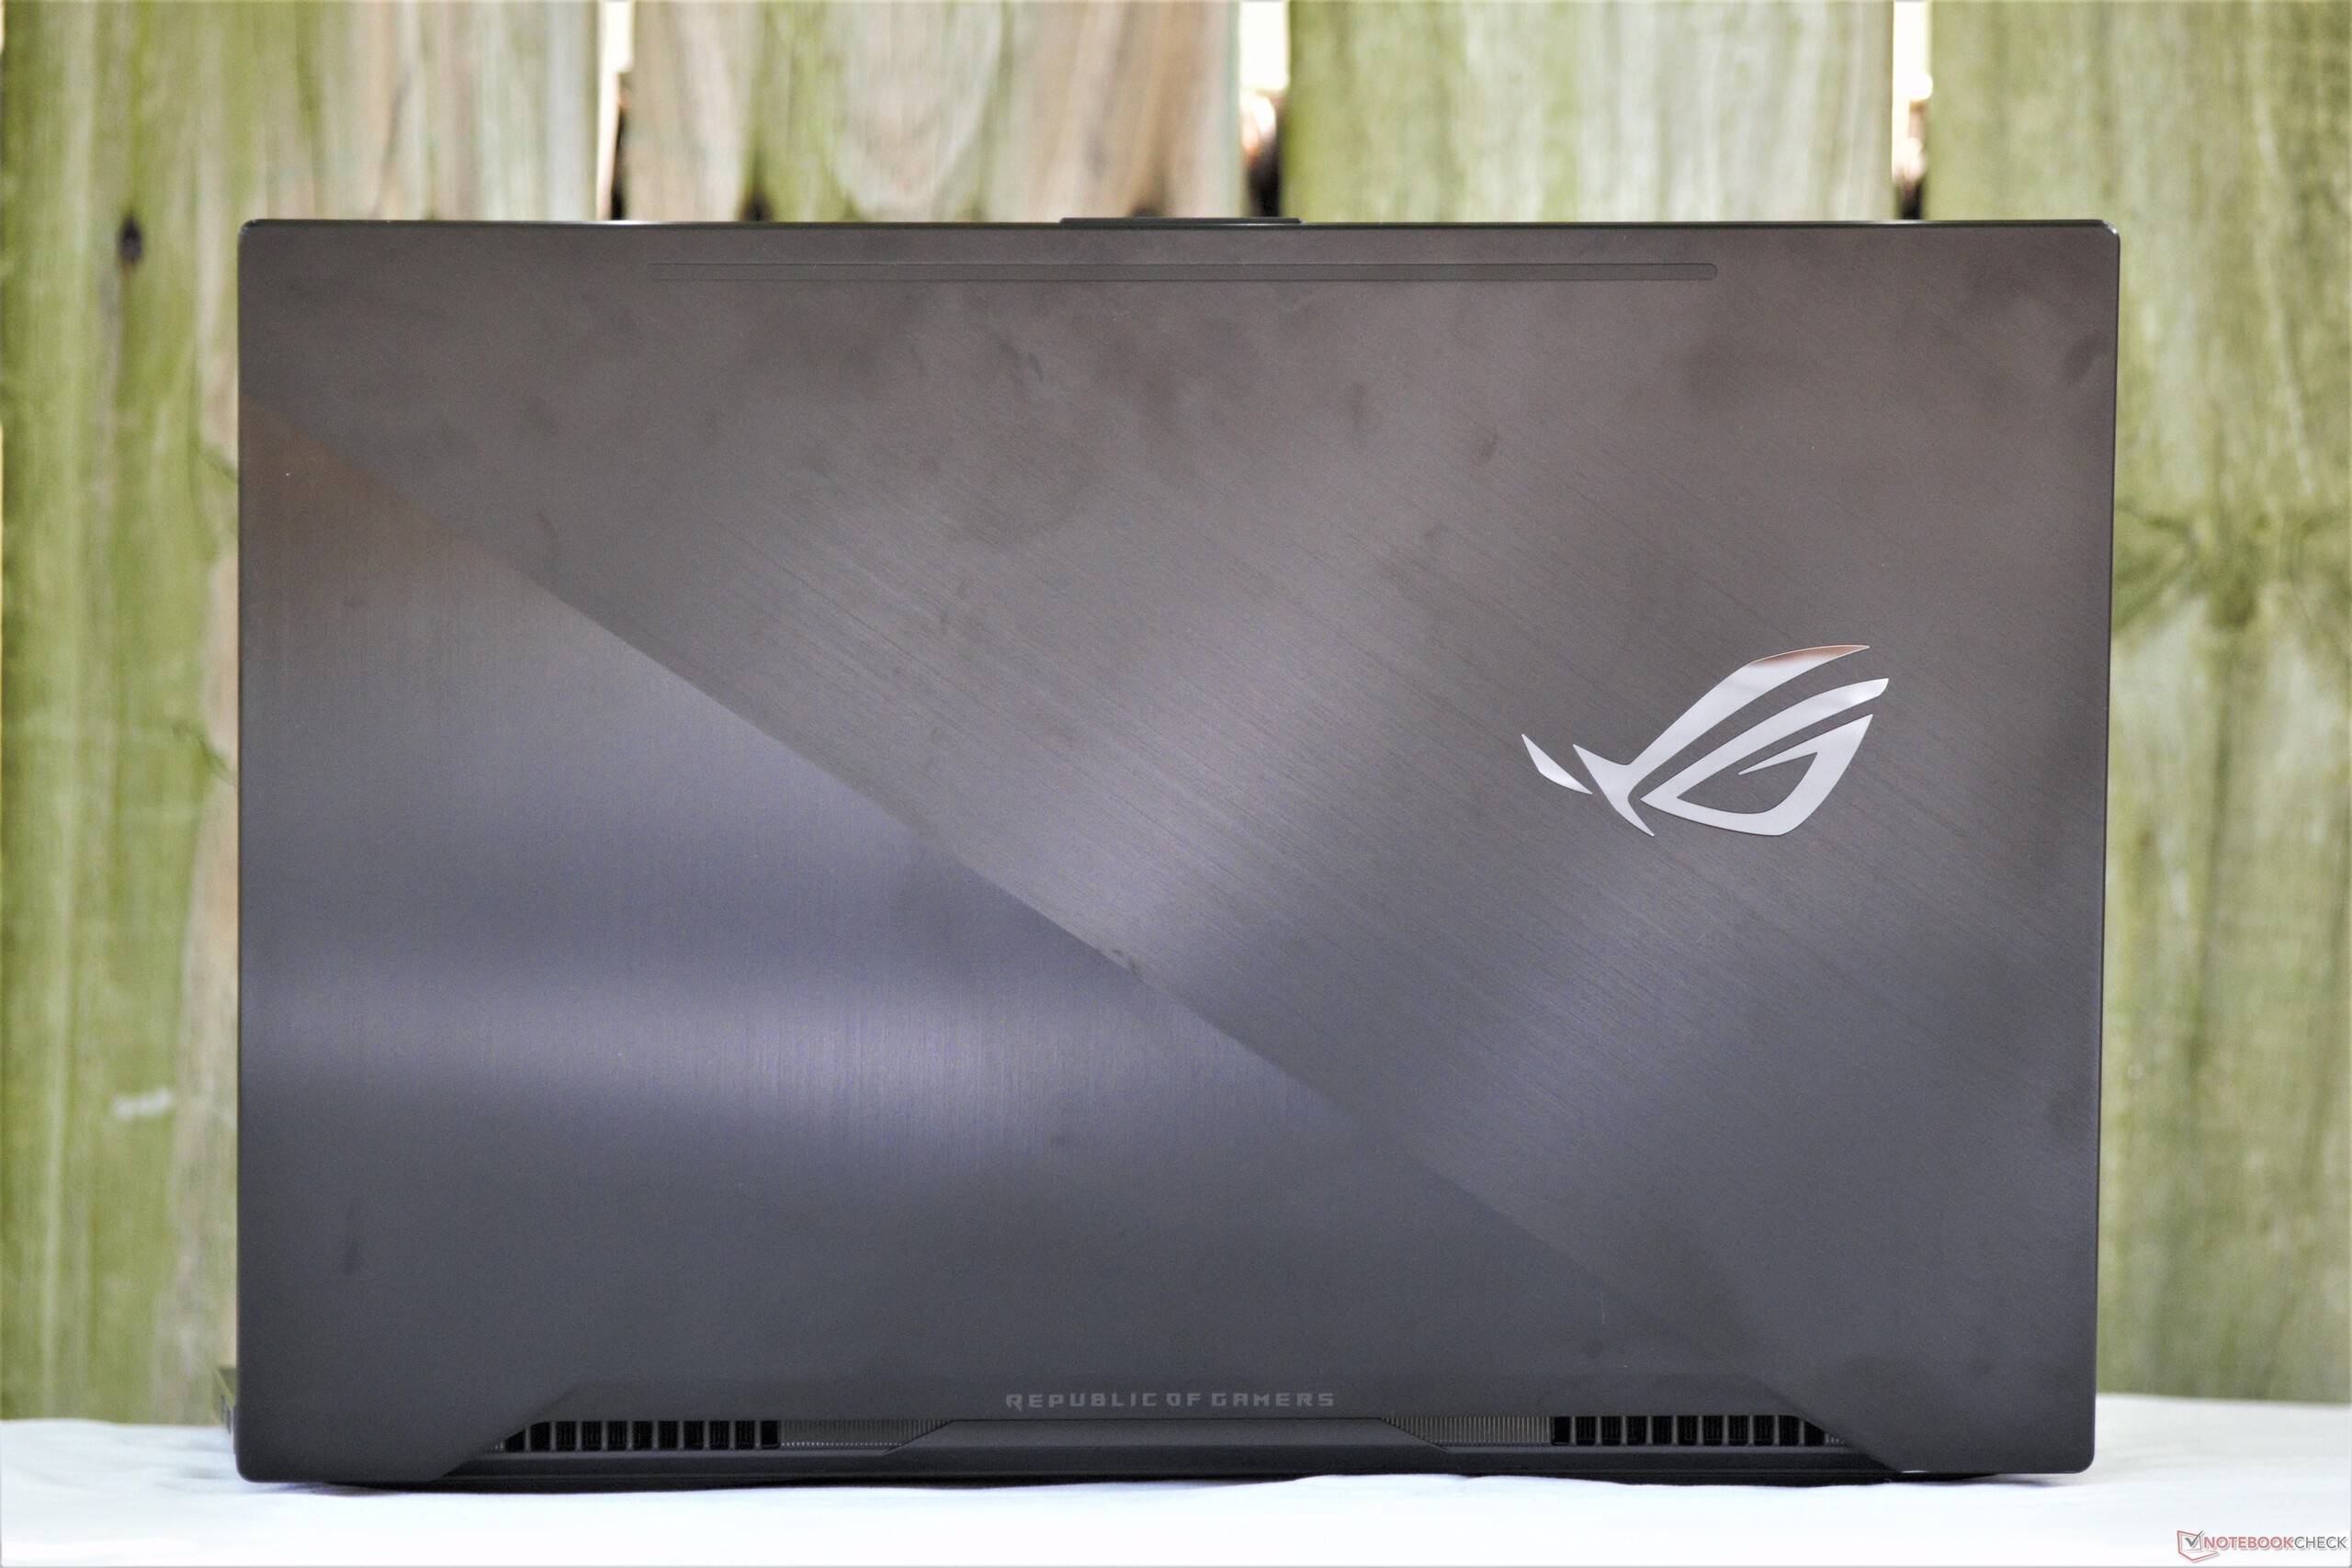
O GU501GM é simplesmente um item de luxo. Enquanto a carcaça é bonita e a máquina é um portátil de jogos de gama média competente, é muito cara. Somente aqueles que colocam o design acima de todos os outros fatores devem considerar a compra do GU501GM; mesmo assim, existem melhores opções por aí.
Asus ROG GU501GM-BI7N8
- 07/07/2018 v6 (old)
Sam Medley
Price comparison
