Breve Análise do Smartphone Nokia 3
| Networking | |
| iperf3 transmit AX12 | |
| Asus Zenfone Go ZB500KL (AVM FritzBox 6490) | |
| Sony Xperia E5 (Linksys EA8500, 5.0 GHz) | |
| Nokia 3 (Linksys EA8500, 5 GHz) | |
| LG K8 2017 (Linksys EA8500, 2.4 GHz) | |
| Gigaset GS160 (Linksys EA8500, 2.4 GHz) | |
| iperf3 receive AX12 | |
| Asus Zenfone Go ZB500KL (AVM FritzBox 6490) | |
| Nokia 3 (Linksys EA8500, 5 GHz) | |
| Sony Xperia E5 (Linksys EA8500, 5.0 GHz) | |
| LG K8 2017 (Linksys EA8500, 2.4 GHz) | |
| Gigaset GS160 (Linksys EA8500, 2.4 GHz) | |


| |||||||||||||||||||||||||
iluminação: 84 %
iluminação com acumulador: 481 cd/m²
Contraste: 2186:1 (Preto: 0.22 cd/m²)
ΔE ColorChecker Calman: 8.1 | ∀{0.5-29.43 Ø4.71}
ΔE Greyscale Calman: 8.5 | ∀{0.09-98 Ø4.96}
95.3% sRGB (Calman 2D)
Gamma: 2.16
CCT: 9014 K
| Nokia 3 IPS, 1280x720, 5" | Asus Zenfone Go ZB500KL IPS, 1280x720, 5" | Gigaset GS160 IPS, 1280x720, 5" | LG K8 2017 IPS, 1280x720, 5" | Sony Xperia E5 IPS, 1280x720, 5" | |
|---|---|---|---|---|---|
| Screen | -6% | -24% | -24% | 9% | |
| Brightness middle (cd/m²) | 481 | 459 -5% | 489 2% | 358 -26% | 538 12% |
| Brightness (cd/m²) | 469 | 452 -4% | 479 2% | 351 -25% | 534 14% |
| Brightness Distribution (%) | 84 | 84 0% | 95 13% | 93 11% | 96 14% |
| Black Level * (cd/m²) | 0.22 | 0.42 -91% | 0.55 -150% | 0.49 -123% | 0.33 -50% |
| Contrast (:1) | 2186 | 1093 -50% | 889 -59% | 731 -67% | 1630 -25% |
| Colorchecker dE 2000 * | 8.1 | 4.5 44% | 8.3 -2% | 7.1 12% | 5.7 30% |
| Colorchecker dE 2000 max. * | 15.4 | 10.6 31% | 14.4 6% | 14.9 3% | 11 29% |
| Greyscale dE 2000 * | 8.5 | 6.5 24% | 8.7 -2% | 6.5 24% | 4.7 45% |
| Gamma | 2.16 102% | 2.22 99% | 2.08 106% | 2.12 104% | 2.51 88% |
| CCT | 9014 72% | 7791 83% | 9034 72% | 8166 80% | 7264 89% |
* ... menor é melhor
Cintilação da tela / PWM (modulação por largura de pulso)
| Tela tremeluzindo / PWM não detectado | 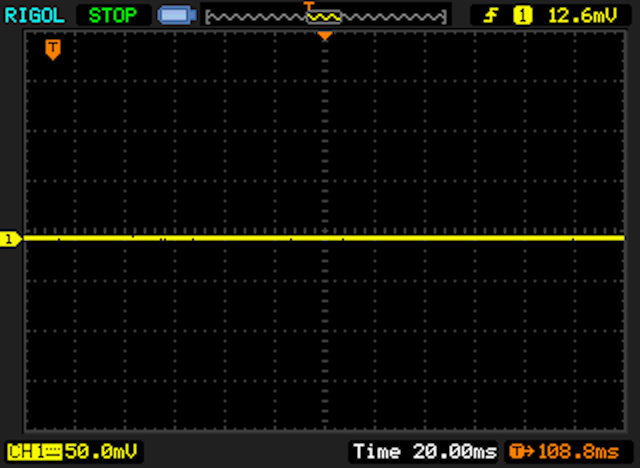 | ||
[pwm_comparison] Em comparação: 52 % de todos os dispositivos testados não usam PWM para escurecer a tela. Se PWM foi detectado, uma média de 7747 (mínimo: 5 - máximo: 343500) Hz foi medida. | |||
Exibir tempos de resposta
| ↔ Tempo de resposta preto para branco | ||
|---|---|---|
| 22.8 ms ... ascensão ↗ e queda ↘ combinadas | ↗ 11.2 ms ascensão | 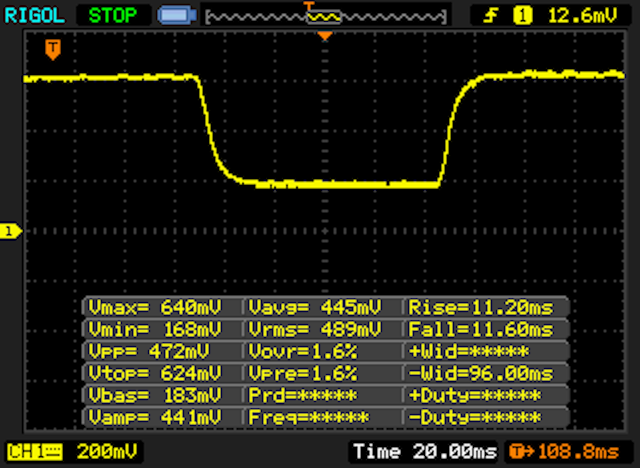 |
| ↘ 11.6 ms queda | ||
| A tela mostra boas taxas de resposta em nossos testes, mas pode ser muito lenta para jogadores competitivos. Em comparação, todos os dispositivos testados variam de 0.1 (mínimo) a 240 (máximo) ms. » 51 % de todos os dispositivos são melhores. Isso significa que o tempo de resposta medido é pior que a média de todos os dispositivos testados (19.8 ms). | ||
| ↔ Tempo de resposta 50% cinza a 80% cinza | ||
| 33 ms ... ascensão ↗ e queda ↘ combinadas | ↗ 15 ms ascensão | 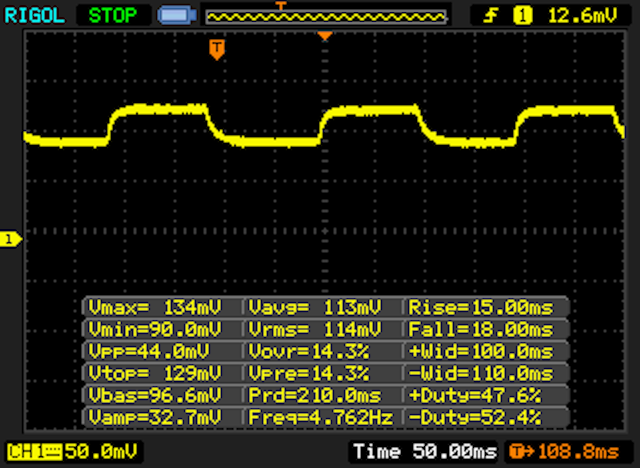 |
| ↘ 18 ms queda | ||
| A tela mostra taxas de resposta lentas em nossos testes e será insatisfatória para os jogadores. Em comparação, todos os dispositivos testados variam de 0.165 (mínimo) a 636 (máximo) ms. » 45 % de todos os dispositivos são melhores. Isso significa que o tempo de resposta medido é semelhante à média de todos os dispositivos testados (31 ms). | ||
| AnTuTu v6 - Total Score (classificar por valor) | |
| Nokia 3 | |
| Asus Zenfone Go ZB500KL | |
| Gigaset GS160 | |
| LG K8 2017 | |
| Sony Xperia E5 | |
| PCMark for Android | |
| Work performance score (classificar por valor) | |
| Nokia 3 | |
| Asus Zenfone Go ZB500KL | |
| Gigaset GS160 | |
| LG K8 2017 | |
| Sony Xperia E5 | |
| Work 2.0 performance score (classificar por valor) | |
| Nokia 3 | |
| Asus Zenfone Go ZB500KL | |
| LG K8 2017 | |
| Sony Xperia E5 | |
| Geekbench 4.4 | |
| 64 Bit Single-Core Score (classificar por valor) | |
| Nokia 3 | |
| LG K8 2017 | |
| Sony Xperia E5 | |
| 64 Bit Multi-Core Score (classificar por valor) | |
| Nokia 3 | |
| LG K8 2017 | |
| Sony Xperia E5 | |
| Compute RenderScript Score (classificar por valor) | |
| Nokia 3 | |
| LG K8 2017 | |
| GFXBench (DX / GLBenchmark) 2.7 | |
| T-Rex Onscreen (classificar por valor) | |
| Nokia 3 | |
| Asus Zenfone Go ZB500KL | |
| Gigaset GS160 | |
| LG K8 2017 | |
| Sony Xperia E5 | |
| 1920x1080 T-Rex Offscreen (classificar por valor) | |
| Nokia 3 | |
| Asus Zenfone Go ZB500KL | |
| Gigaset GS160 | |
| LG K8 2017 | |
| Sony Xperia E5 | |
| GFXBench 3.0 | |
| on screen Manhattan Onscreen OGL (classificar por valor) | |
| Nokia 3 | |
| Asus Zenfone Go ZB500KL | |
| Gigaset GS160 | |
| LG K8 2017 | |
| Sony Xperia E5 | |
| 1920x1080 1080p Manhattan Offscreen (classificar por valor) | |
| Nokia 3 | |
| Asus Zenfone Go ZB500KL | |
| Gigaset GS160 | |
| LG K8 2017 | |
| Sony Xperia E5 | |
| GFXBench 3.1 | |
| on screen Manhattan ES 3.1 Onscreen (classificar por valor) | |
| Nokia 3 | |
| Asus Zenfone Go ZB500KL | |
| Gigaset GS160 | |
| LG K8 2017 | |
| Sony Xperia E5 | |
| 1920x1080 Manhattan ES 3.1 Offscreen (classificar por valor) | |
| Nokia 3 | |
| Asus Zenfone Go ZB500KL | |
| Gigaset GS160 | |
| LG K8 2017 | |
| Sony Xperia E5 | |
| JetStream 1.1 - 1.1 Total | |
| Sony Xperia E5 | |
| LG K8 2017 | |
| Gigaset GS160 | |
| Asus Zenfone Go ZB500KL | |
| Nokia 3 | |
| Octane V2 - Total Score | |
| LG K8 2017 | |
| Sony Xperia E5 | |
| Gigaset GS160 | |
| Nokia 3 | |
| Asus Zenfone Go ZB500KL | |
| Mozilla Kraken 1.1 - Total | |
| Nokia 3 | |
| Asus Zenfone Go ZB500KL | |
| Gigaset GS160 | |
| Sony Xperia E5 | |
| LG K8 2017 | |
| WebXPRT 2015 - Overall | |
| Nokia 3 | |
| Gigaset GS160 | |
* ... menor é melhor
| Nokia 3 | Asus Zenfone Go ZB500KL | Gigaset GS160 | LG K8 2017 | Sony Xperia E5 | |
|---|---|---|---|---|---|
| AndroBench 3-5 | -18% | -7% | 78% | 43% | |
| Sequential Read 256KB (MB/s) | 181 | 143 -21% | 200.5 11% | 270.8 50% | 209.7 16% |
| Sequential Write 256KB (MB/s) | 34 | 42.4 25% | 46.6 37% | 84.6 149% | 83.1 144% |
| Random Read 4KB (MB/s) | 17.7 | 19.7 11% | 18.5 5% | 41.6 135% | 26.04 47% |
| Random Write 4KB (MB/s) | 5.5 | 6.9 25% | 6.8 24% | 12.5 127% | 9.84 79% |
| Sequential Read 256KB SDCard (MB/s) | 64.3 | 17.7 -72% | 30.71 -52% | 78.6 22% | 65 1% |
| Sequential Write 256KB SDCard (MB/s) | 62.9 | 14.4 -77% | 19.19 -69% | 52.2 -17% | 45.56 -28% |
| Asphalt 8: Airborne | |||
| Configurações | Valor | ||
| high | 13 fps | ||
| very low | 28 fps | ||
| Dead Trigger 2 | |||
| Configurações | Valor | ||
| high | 29 fps | ||
(+) A temperatura máxima no lado superior é 32.5 °C / 91 F, em comparação com a média de 35.3 °C / 96 F , variando de 21.9 a 247 °C para a classe Smartphone.
(+) A parte inferior aquece até um máximo de 34.2 °C / 94 F, em comparação com a média de 34 °C / 93 F
(+) Em uso inativo, a temperatura média para o lado superior é 30 °C / 86 F, em comparação com a média do dispositivo de 33 °C / ### class_avg_f### F.
Nokia 3 análise de áudio
(+) | os alto-falantes podem tocar relativamente alto (###valor### dB)
Graves 100 - 315Hz
(-) | quase nenhum baixo - em média 39.4% menor que a mediana
(±) | a linearidade dos graves é média (11.6% delta para a frequência anterior)
Médios 400 - 2.000 Hz
(+) | médios equilibrados - apenas 4.8% longe da mediana
(±) | a linearidade dos médios é média (8% delta para frequência anterior)
Altos 2 - 16 kHz
(±) | máximos mais altos - em média 5% maior que a mediana
(+) | os máximos são lineares (5.8% delta da frequência anterior)
Geral 100 - 16.000 Hz
(±) | a linearidade do som geral é média (29% diferença em relação à mediana)
Comparado com a mesma classe
» 76% de todos os dispositivos testados nesta classe foram melhores, 3% semelhantes, 20% piores
» O melhor teve um delta de 11%, a média foi 34%, o pior foi 134%
Comparado com todos os dispositivos testados
» 87% de todos os dispositivos testados foram melhores, 2% semelhantes, 11% piores
» O melhor teve um delta de 4%, a média foi 23%, o pior foi 134%
Asus Zenfone Go ZB500KL análise de áudio
(±) | o volume do alto-falante é médio, mas bom (###valor### dB)
Graves 100 - 315Hz
(-) | quase nenhum baixo - em média 28.6% menor que a mediana
(±) | a linearidade dos graves é média (10.2% delta para a frequência anterior)
Médios 400 - 2.000 Hz
(+) | médios equilibrados - apenas 4.8% longe da mediana
(+) | médios são lineares (6.1% delta para frequência anterior)
Altos 2 - 16 kHz
(+) | agudos equilibrados - apenas 3.1% longe da mediana
(+) | os máximos são lineares (4.5% delta da frequência anterior)
Geral 100 - 16.000 Hz
(±) | a linearidade do som geral é média (25.8% diferença em relação à mediana)
Comparado com a mesma classe
» 65% de todos os dispositivos testados nesta classe foram melhores, 6% semelhantes, 29% piores
» O melhor teve um delta de 11%, a média foi 34%, o pior foi 134%
Comparado com todos os dispositivos testados
» 79% de todos os dispositivos testados foram melhores, 4% semelhantes, 17% piores
» O melhor teve um delta de 4%, a média foi 23%, o pior foi 134%
| desligado | |
| Ocioso | |
| Carga |
|
Key:
min: | |
| Nokia 3 2630 mAh | Asus Zenfone Go ZB500KL 2600 mAh | Gigaset GS160 2500 mAh | LG K8 2017 2500 mAh | Sony Xperia E5 2300 mAh | |
|---|---|---|---|---|---|
| Power Consumption | -23% | -19% | -7% | -49% | |
| Idle Minimum * (Watt) | 0.67 | 0.92 -37% | 0.56 16% | 0.65 3% | 1.03 -54% |
| Idle Average * (Watt) | 1.35 | 1.76 -30% | 1.7 -26% | 1.6 -19% | 2.06 -53% |
| Idle Maximum * (Watt) | 1.39 | 1.85 -33% | 1.75 -26% | 1.62 -17% | 2.12 -53% |
| Load Average * (Watt) | 3.1 | 3.47 -12% | 4.17 -35% | 2.97 4% | 5.01 -62% |
| Load Maximum * (Watt) | 4.02 | 4.22 -5% | 5.07 -26% | 4.34 -8% | 5.04 -25% |
* ... menor é melhor
| Nokia 3 2630 mAh | Asus Zenfone Go ZB500KL 2600 mAh | Gigaset GS160 2500 mAh | LG K8 2017 2500 mAh | Sony Xperia E5 2300 mAh | |
|---|---|---|---|---|---|
| Duração da bateria | -1% | 4% | 4% | -24% | |
| Reader / Idle (h) | 21 | 20.4 -3% | 22.1 5% | ||
| H.264 (h) | 10.5 | 10.3 -2% | 11.7 11% | ||
| WiFi v1.3 (h) | 9.2 | 9.5 3% | 10.3 12% | 9.9 8% | 7 -24% |
| Load (h) | 4.7 | 4.6 -2% | 4.1 -13% | 4.7 0% |
Pro
Contra
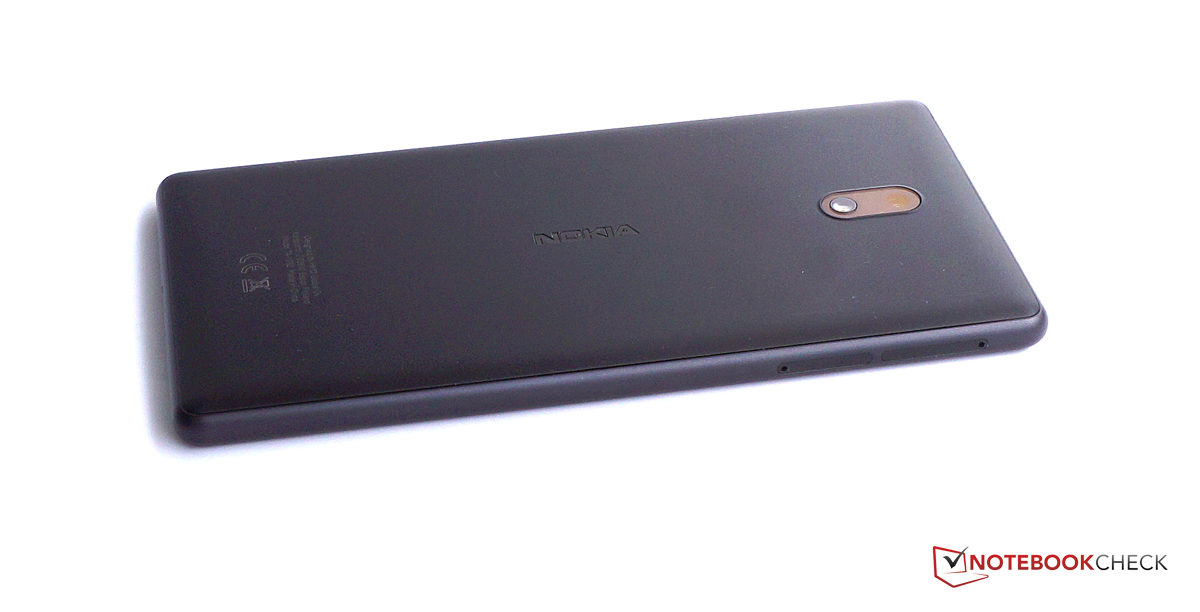
O Nokia 3 é quase um smartphone de nível básico de entrada, o que provavelmente seria suficiente para um início bem sucedido do mercado nesta categoria. No entanto, o dispositivo também nos surpreende com taxas realmente boas em algumas áreas, como brilho da tela, contraste, consumo de energia ou muitas bandas LTE.
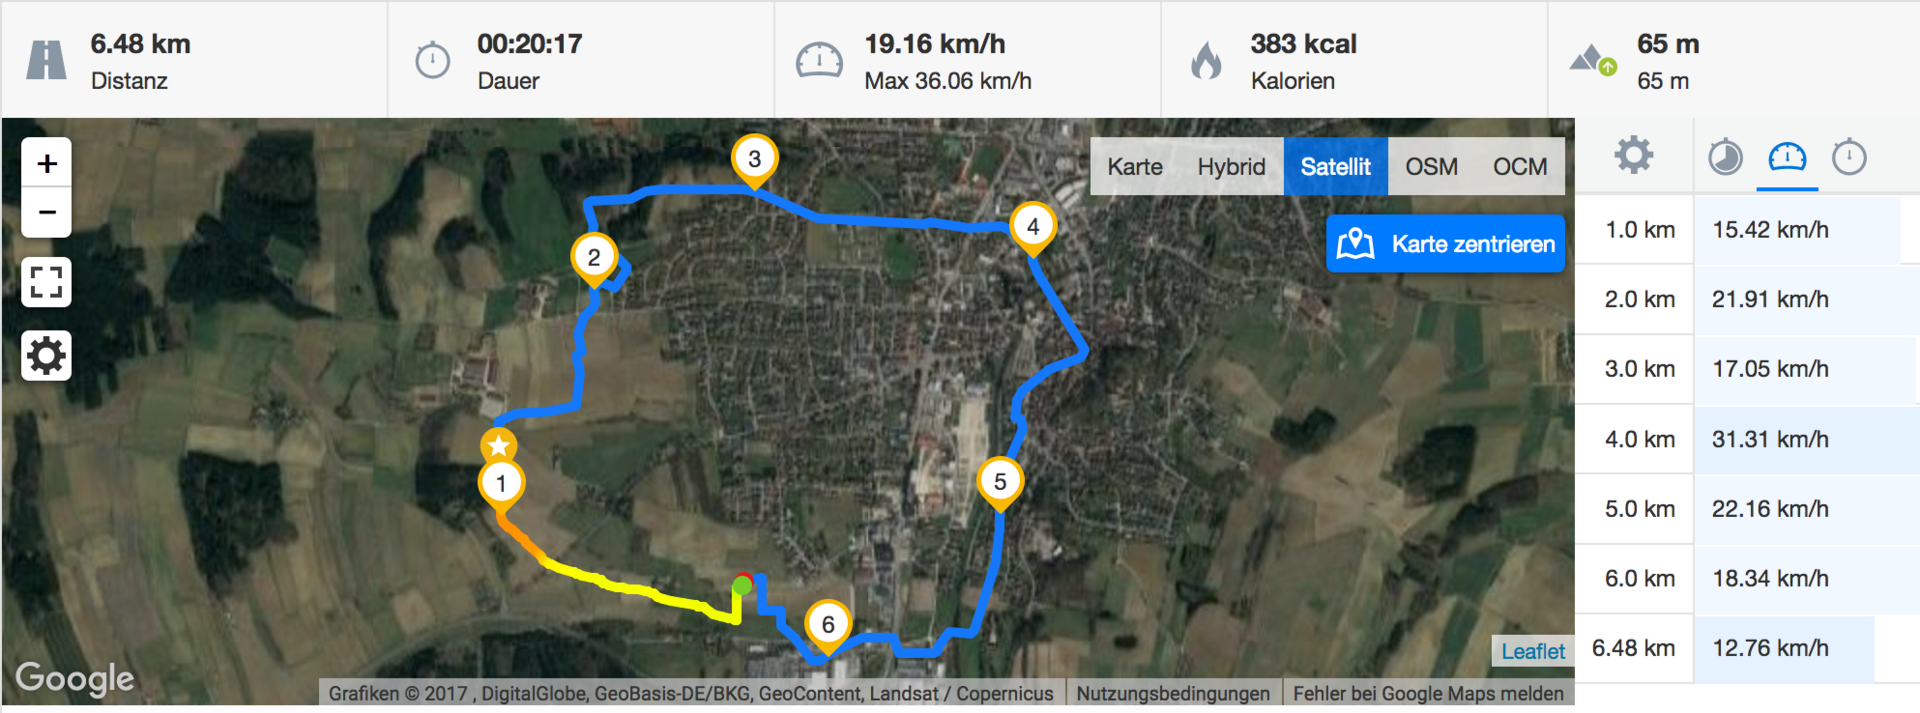
Isso permite que se destaque na categoria, mas também há algumas deficiências que devem ser mantidas em mente. Existem câmeras consideravelmente melhores nesta faixa de preços e, em termos de desempenho, existe um dispositivo mais forte no mercado - oXperia E5. Além disso, o som do alto-falante e a precisão do GPS não são estelares, mas isso não pode ser esperado desta faixa de preços.
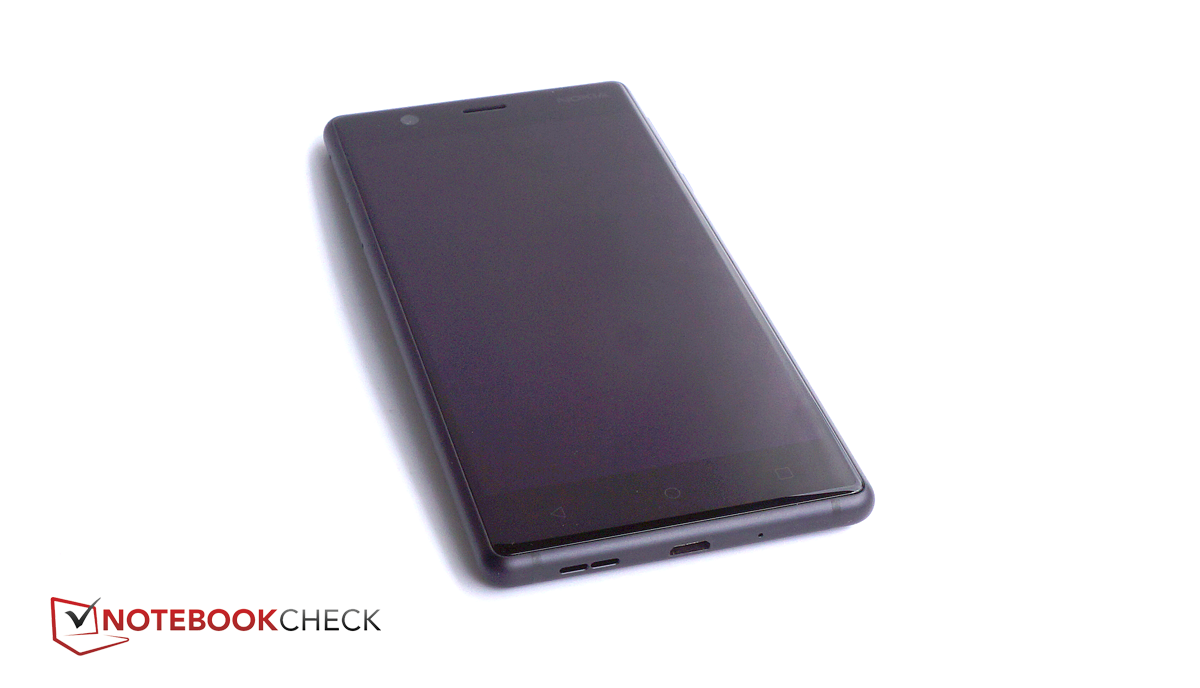
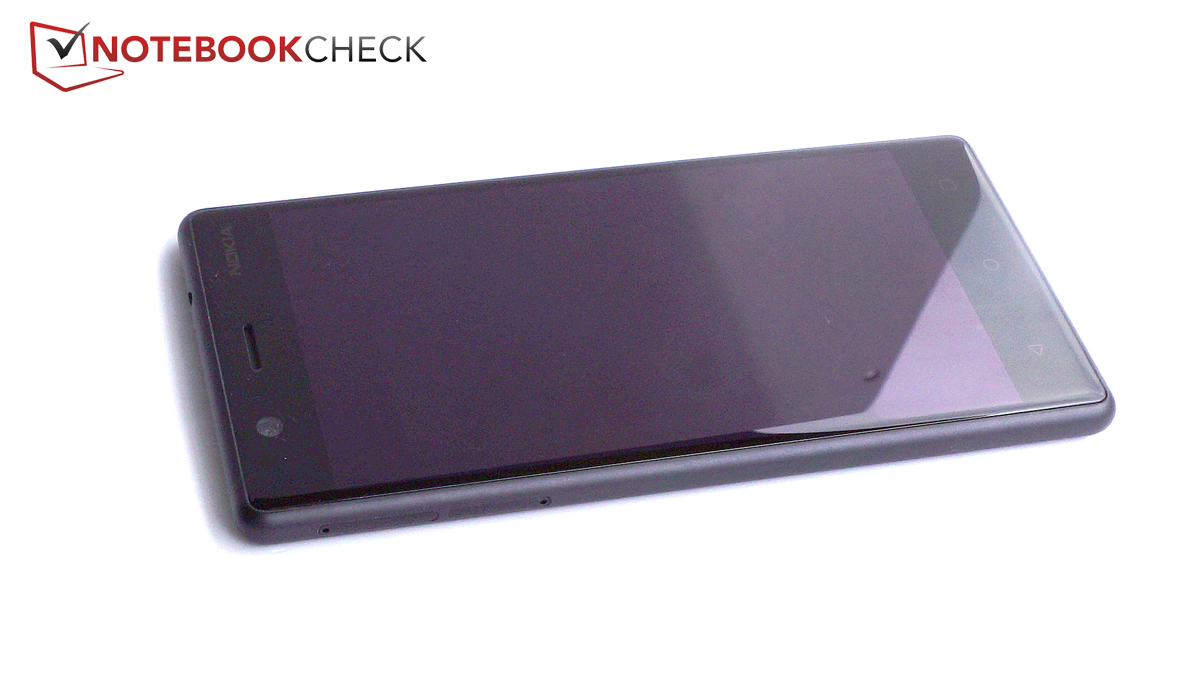
Tela brilhante e de alto contraste, baixo consumo de energia, carcaça elegante - o Nokia 3 tem uma boa posição na categoria de nível de entrada. No entanto, não deve haver muito valor em uma boa câmera, pois o smartphone só pode oferecer isso de forma condicional.
A elegante carcaça e os resultados de teste decentes em muitas áreas conferem ao Nokia 3 um bom início de mercado no setor de nível de entrada. Agora, estamos antecipando os testes de seu irmão maior, porque a Nokia precisa vir com mais para convencer os compradores na gama média.
Nokia 3
- 07/28/2017 v6 (old)
Florian Wimmer