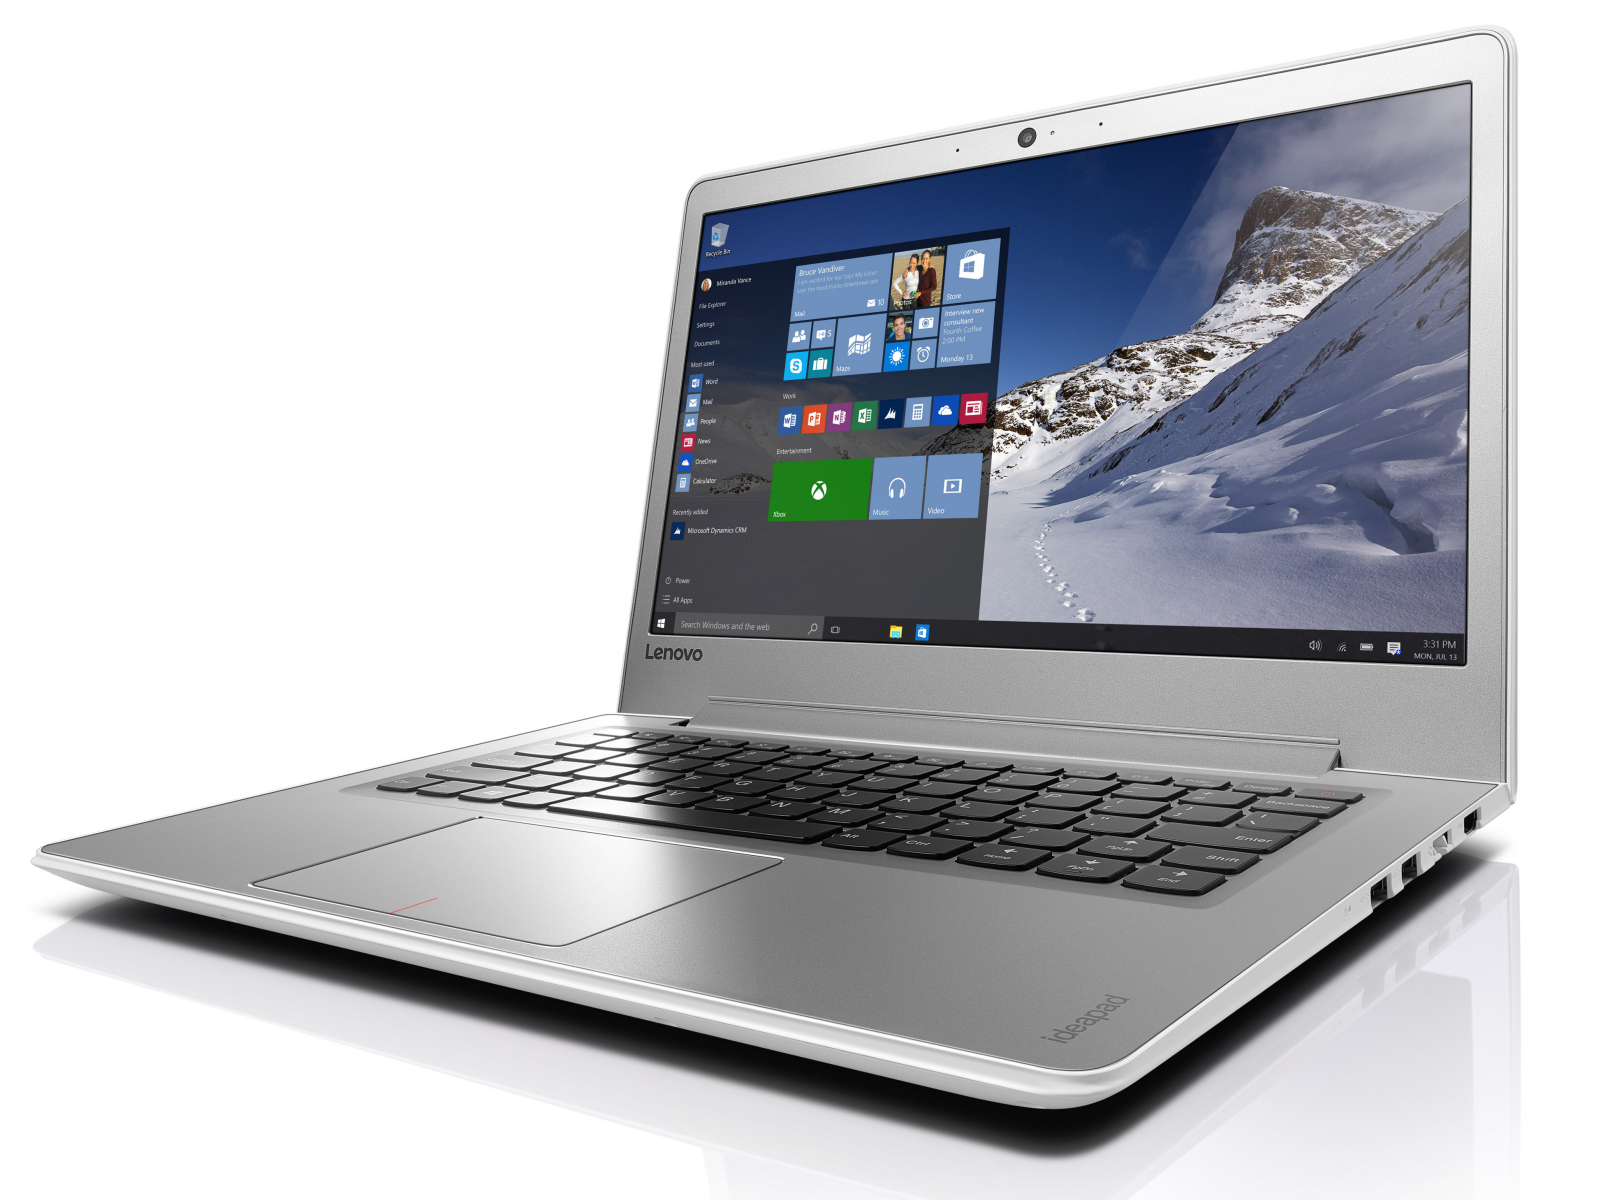
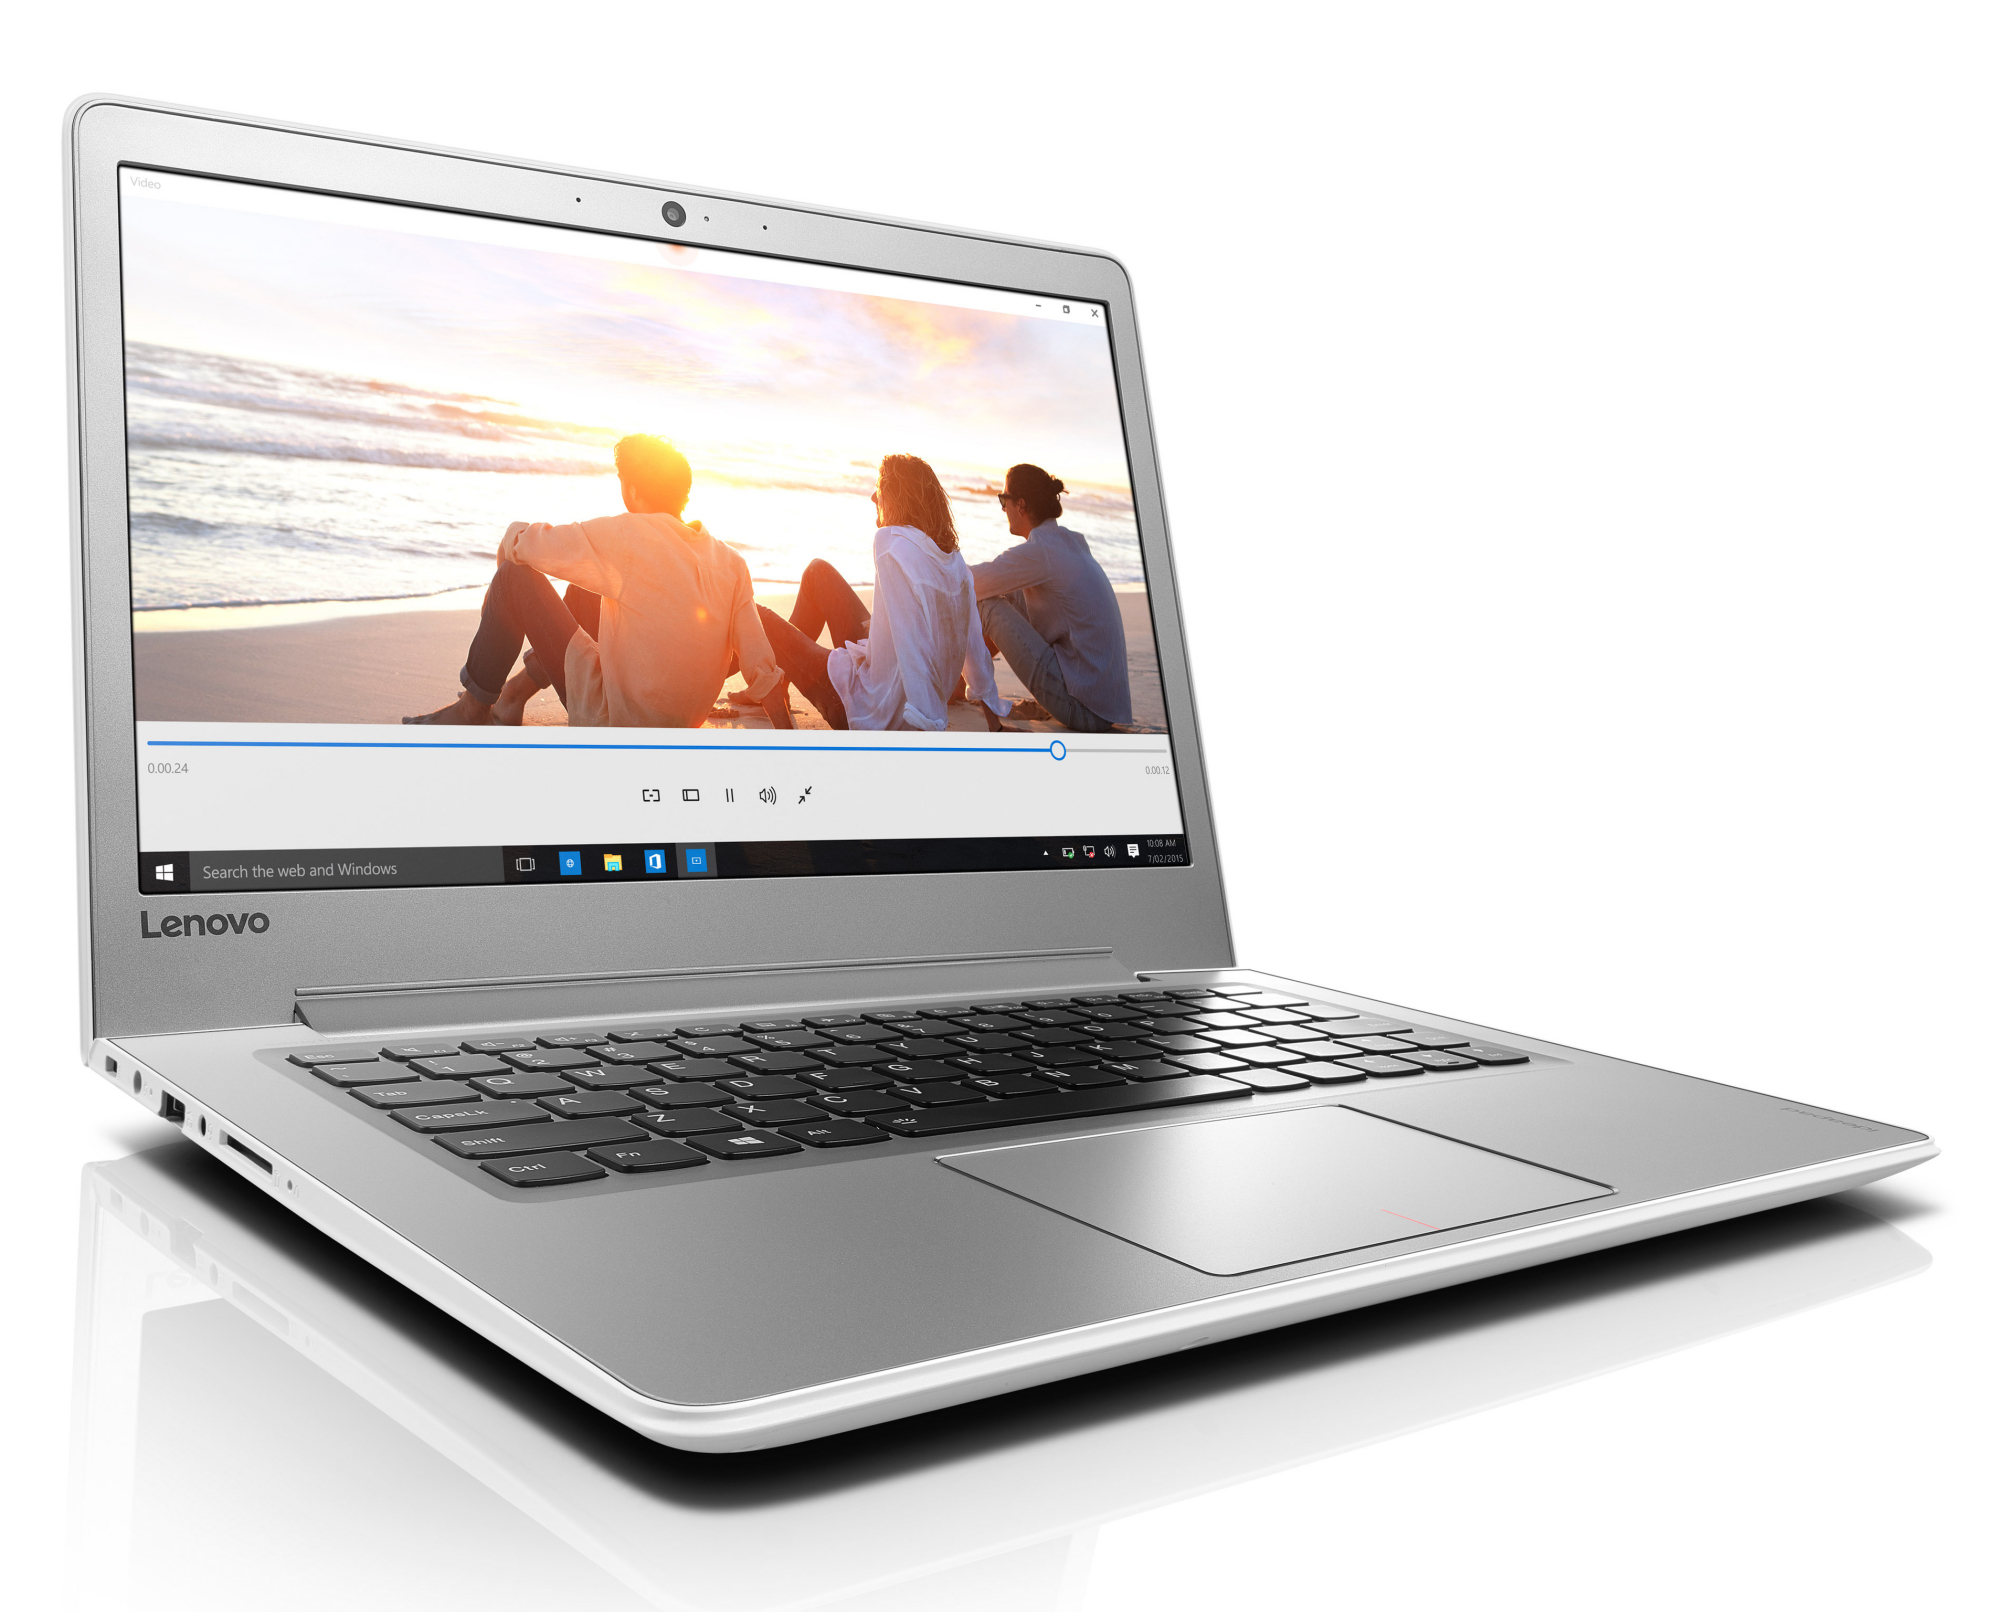
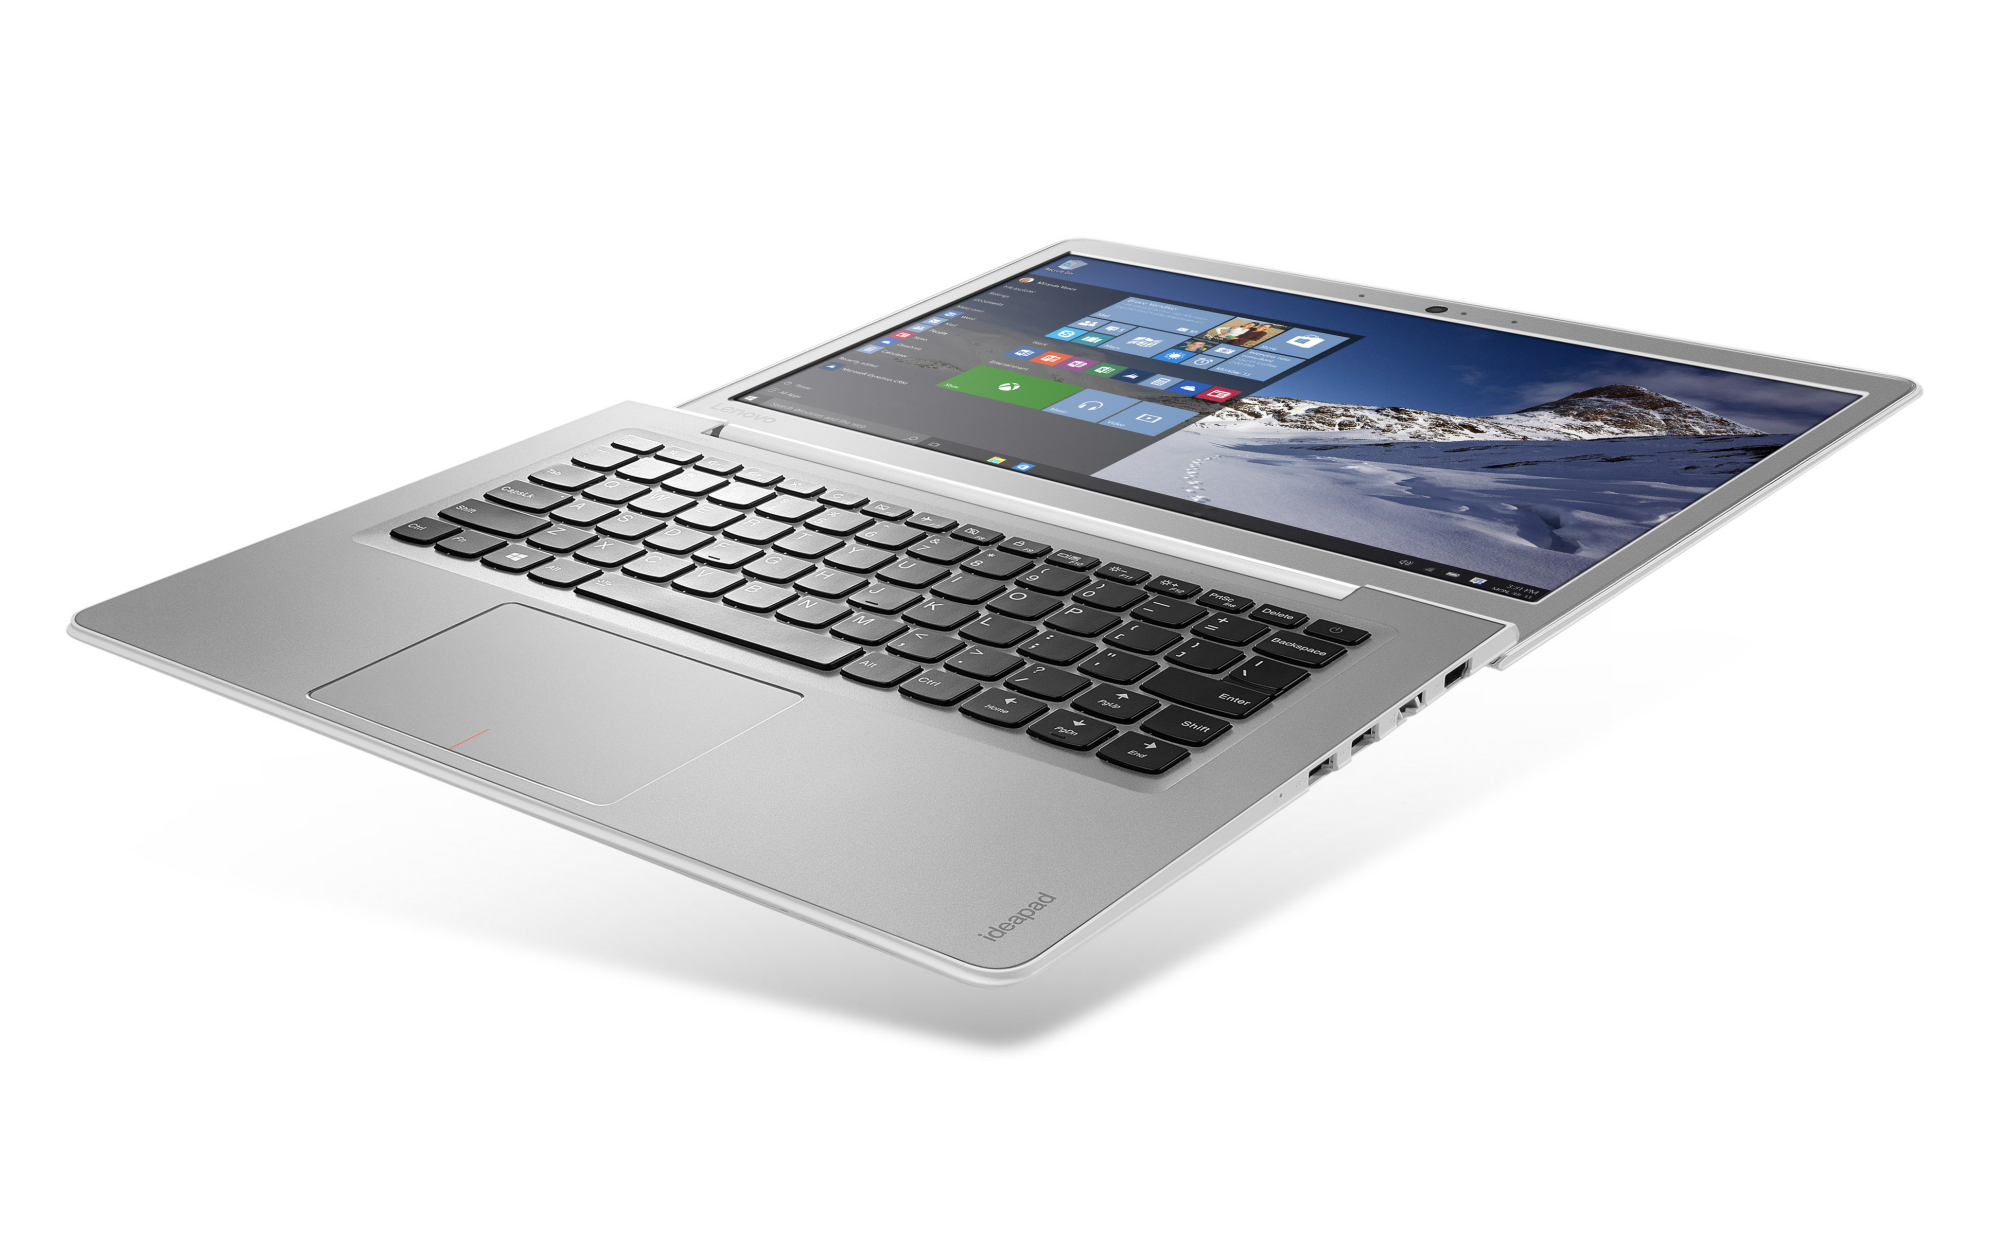
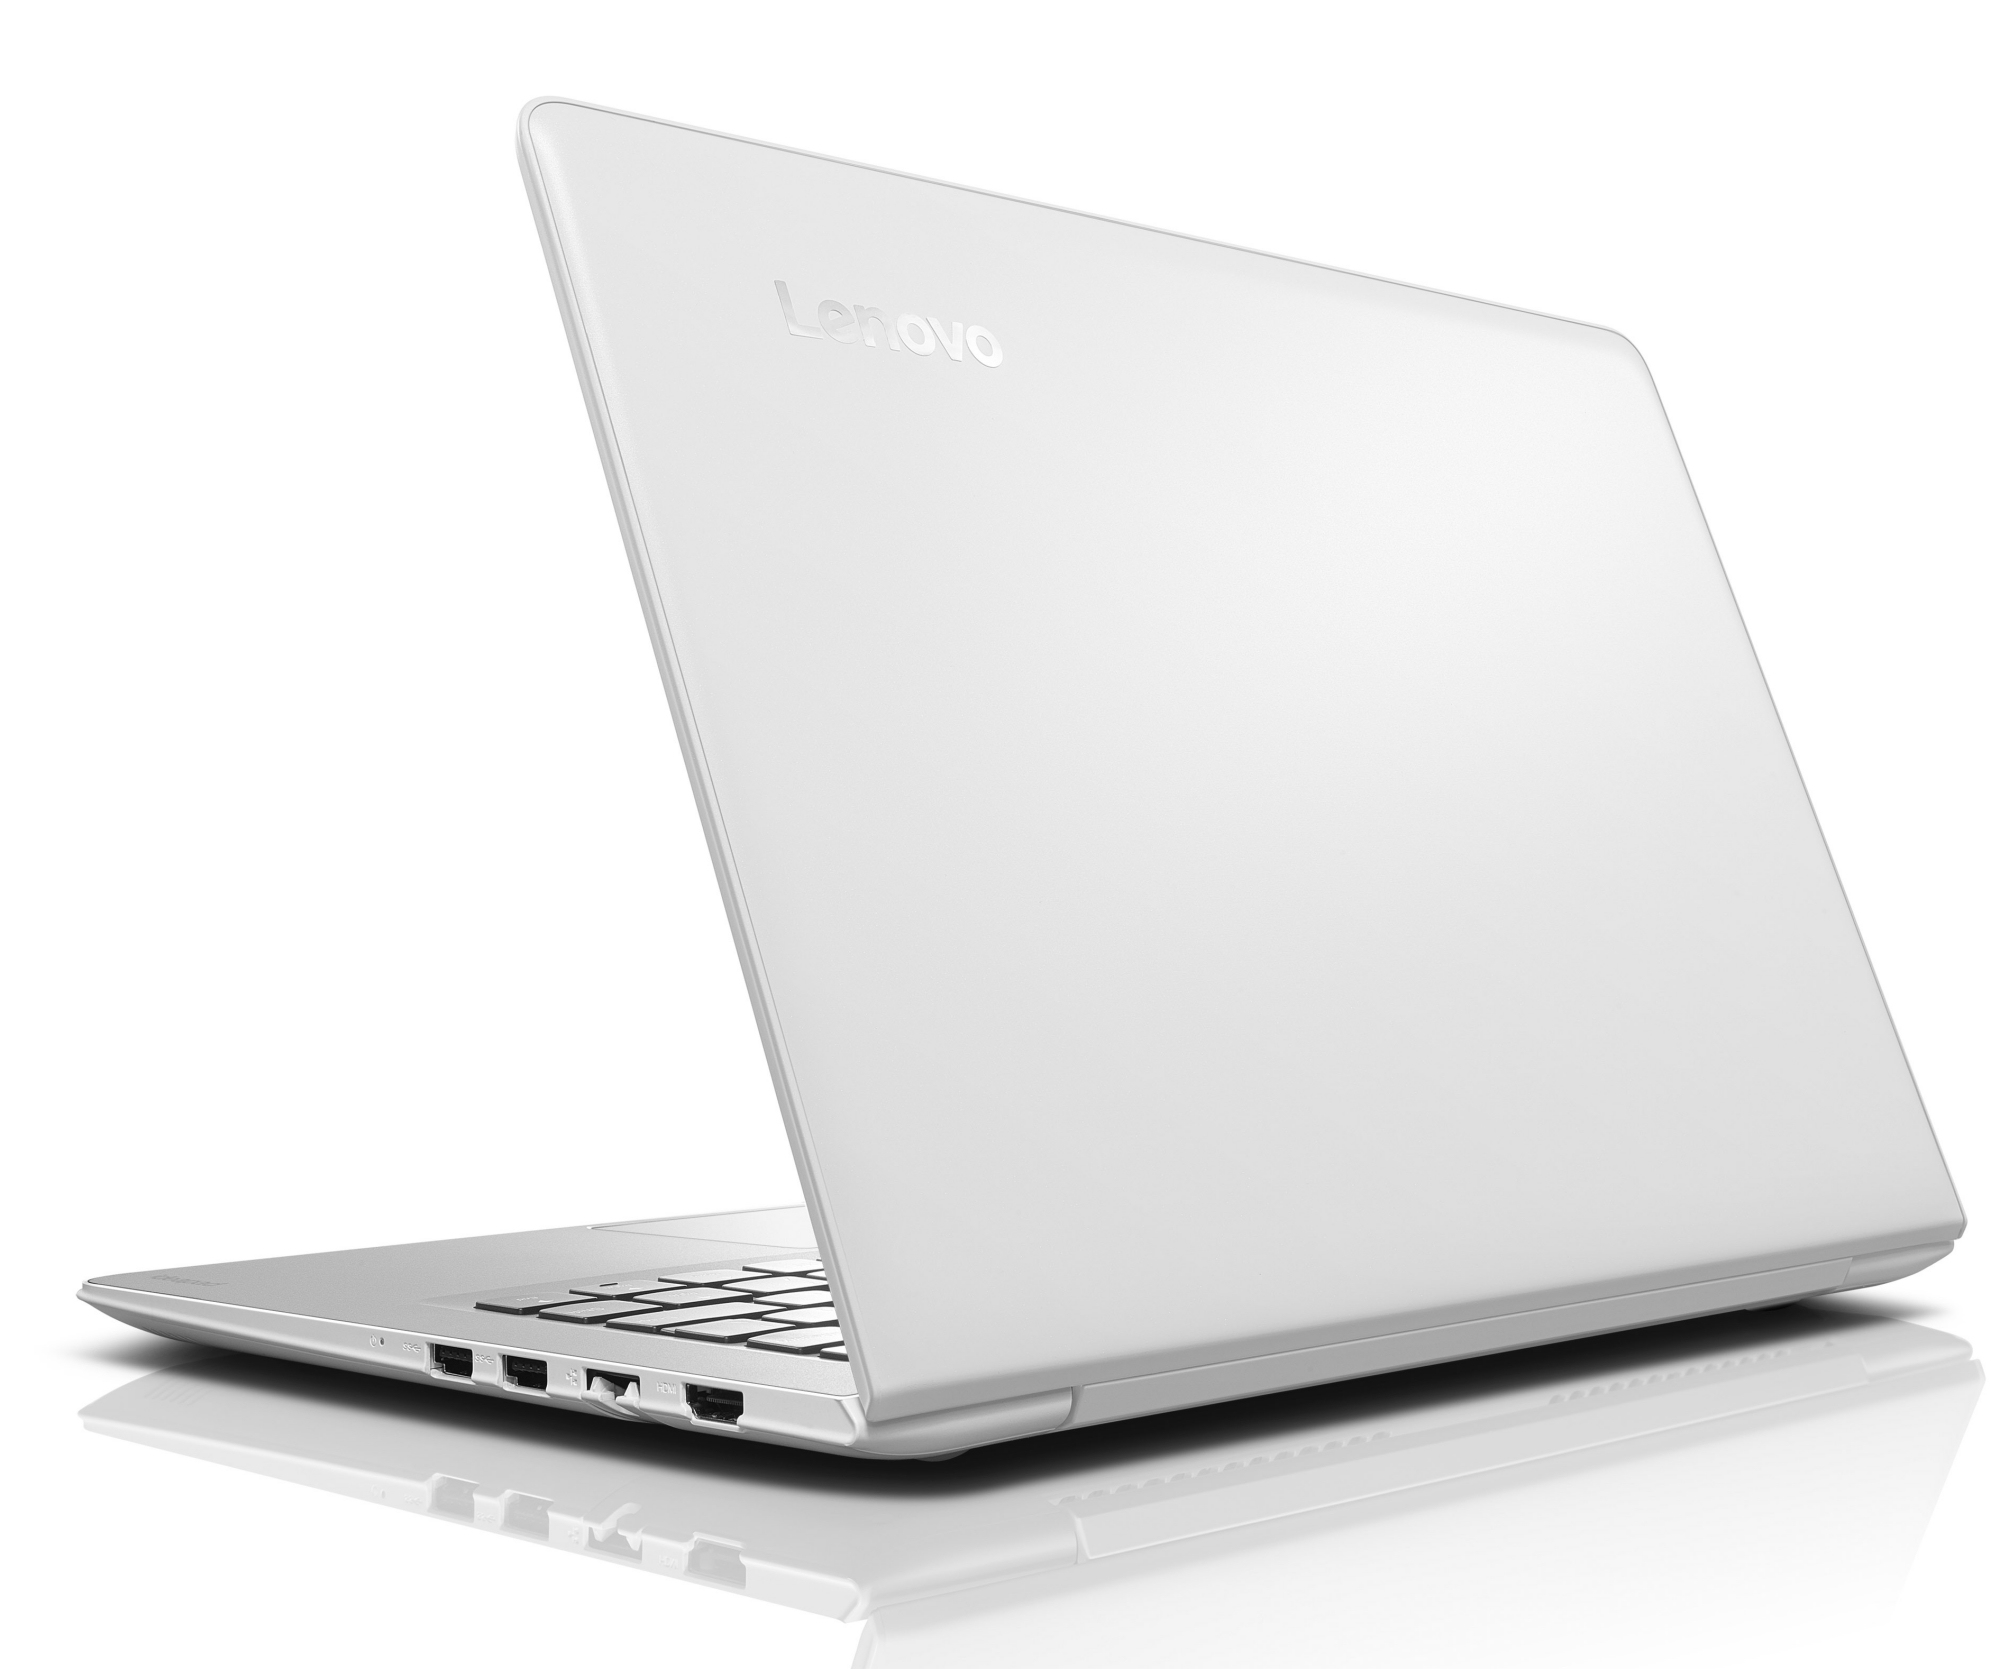
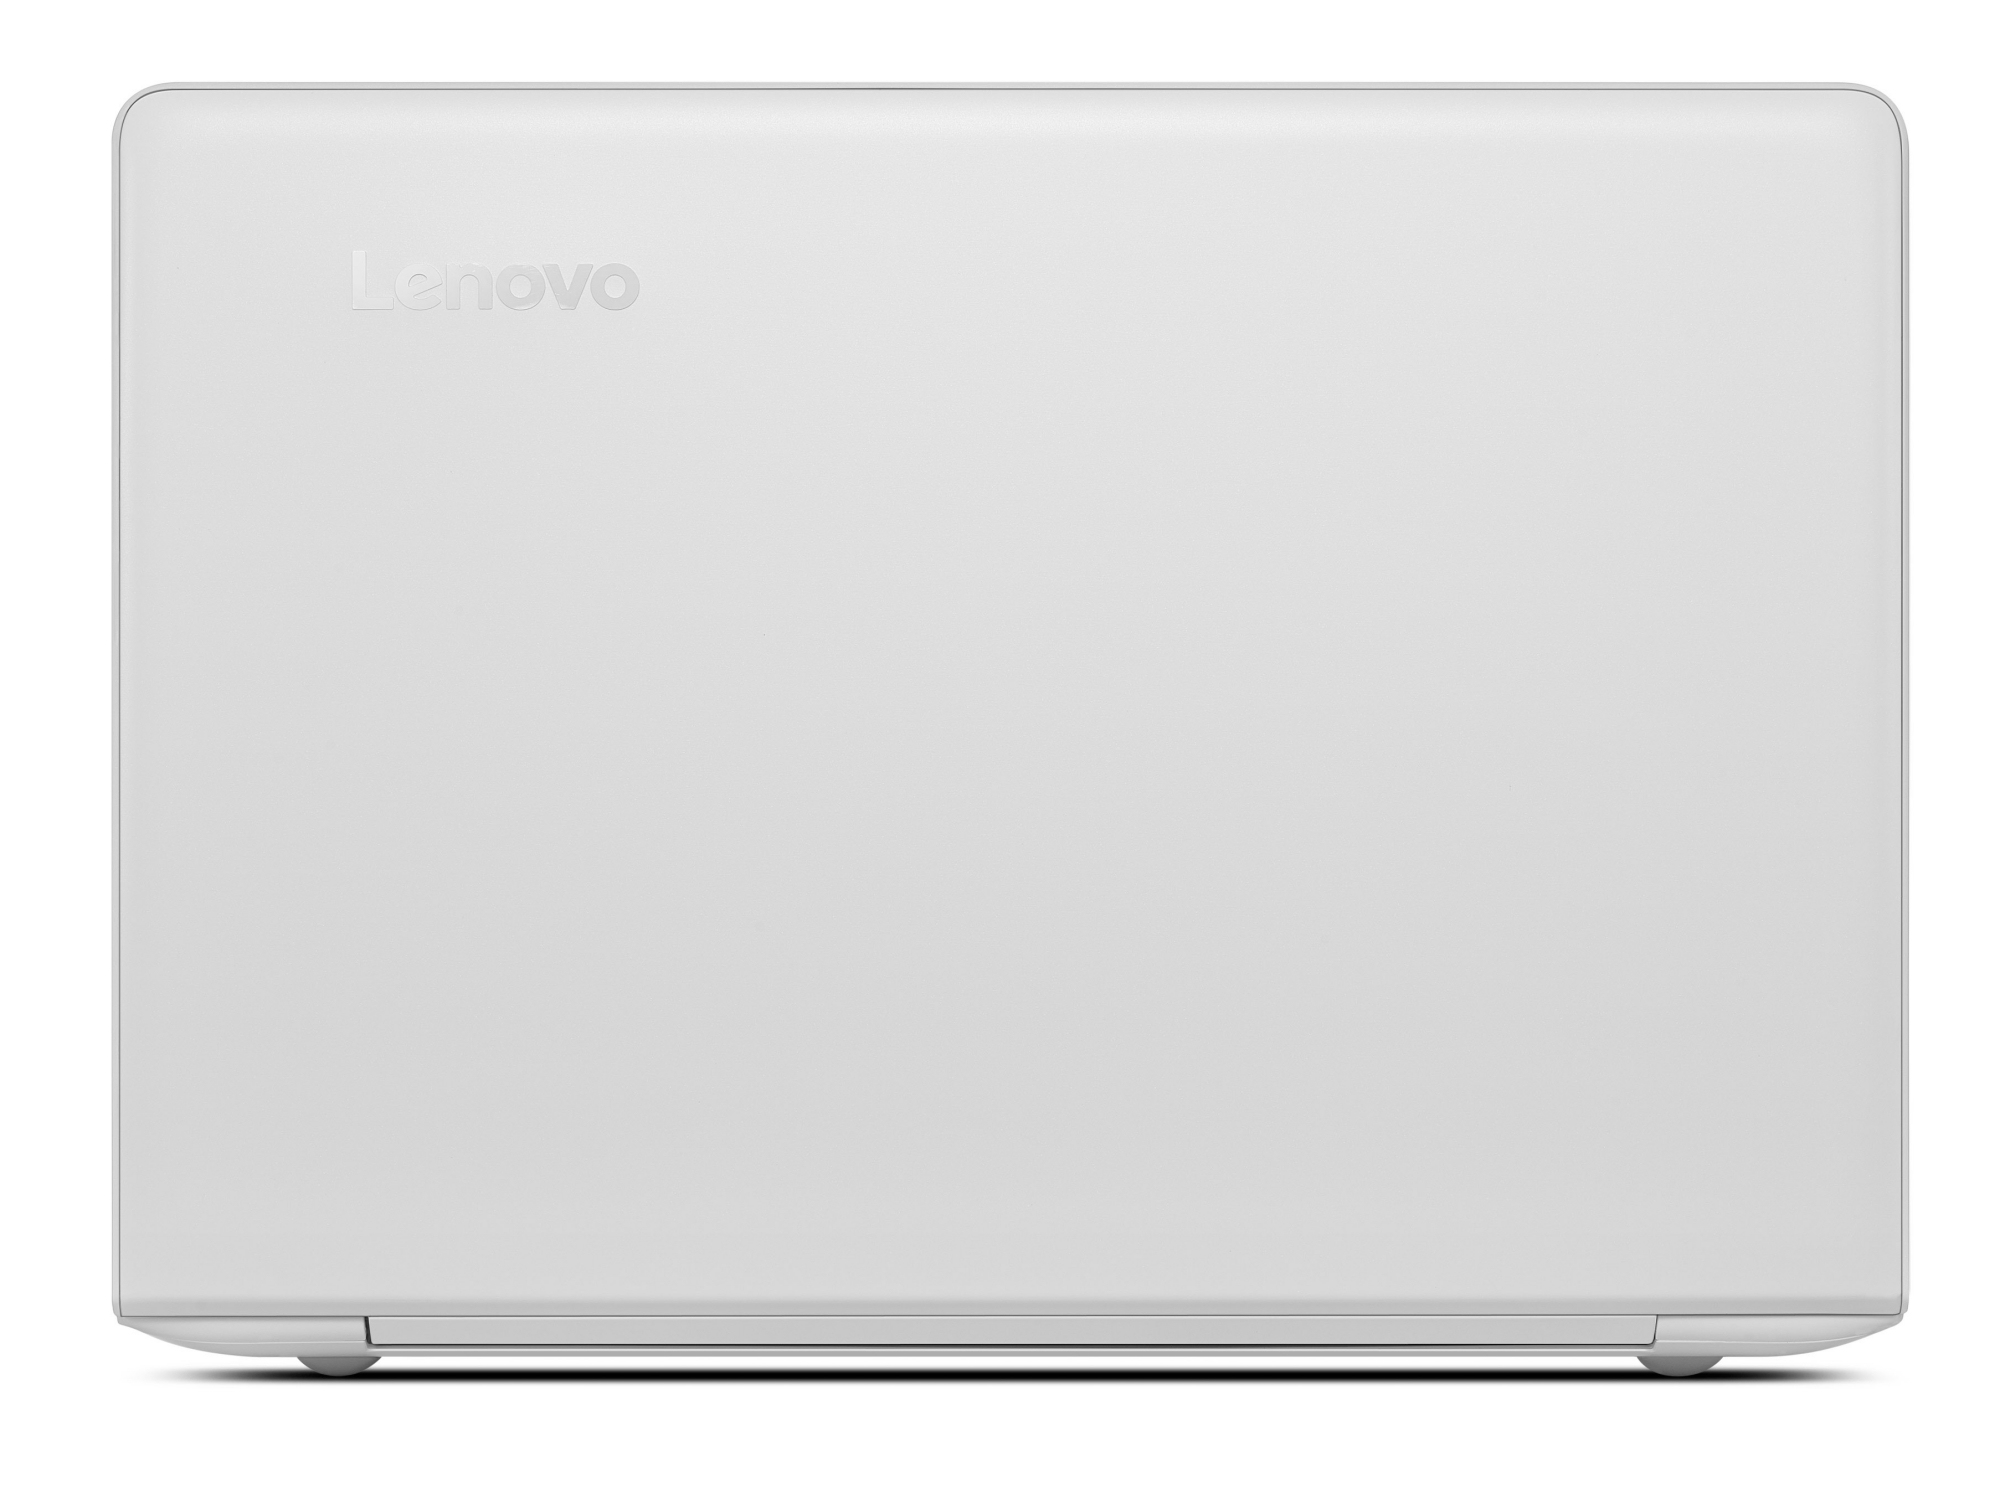
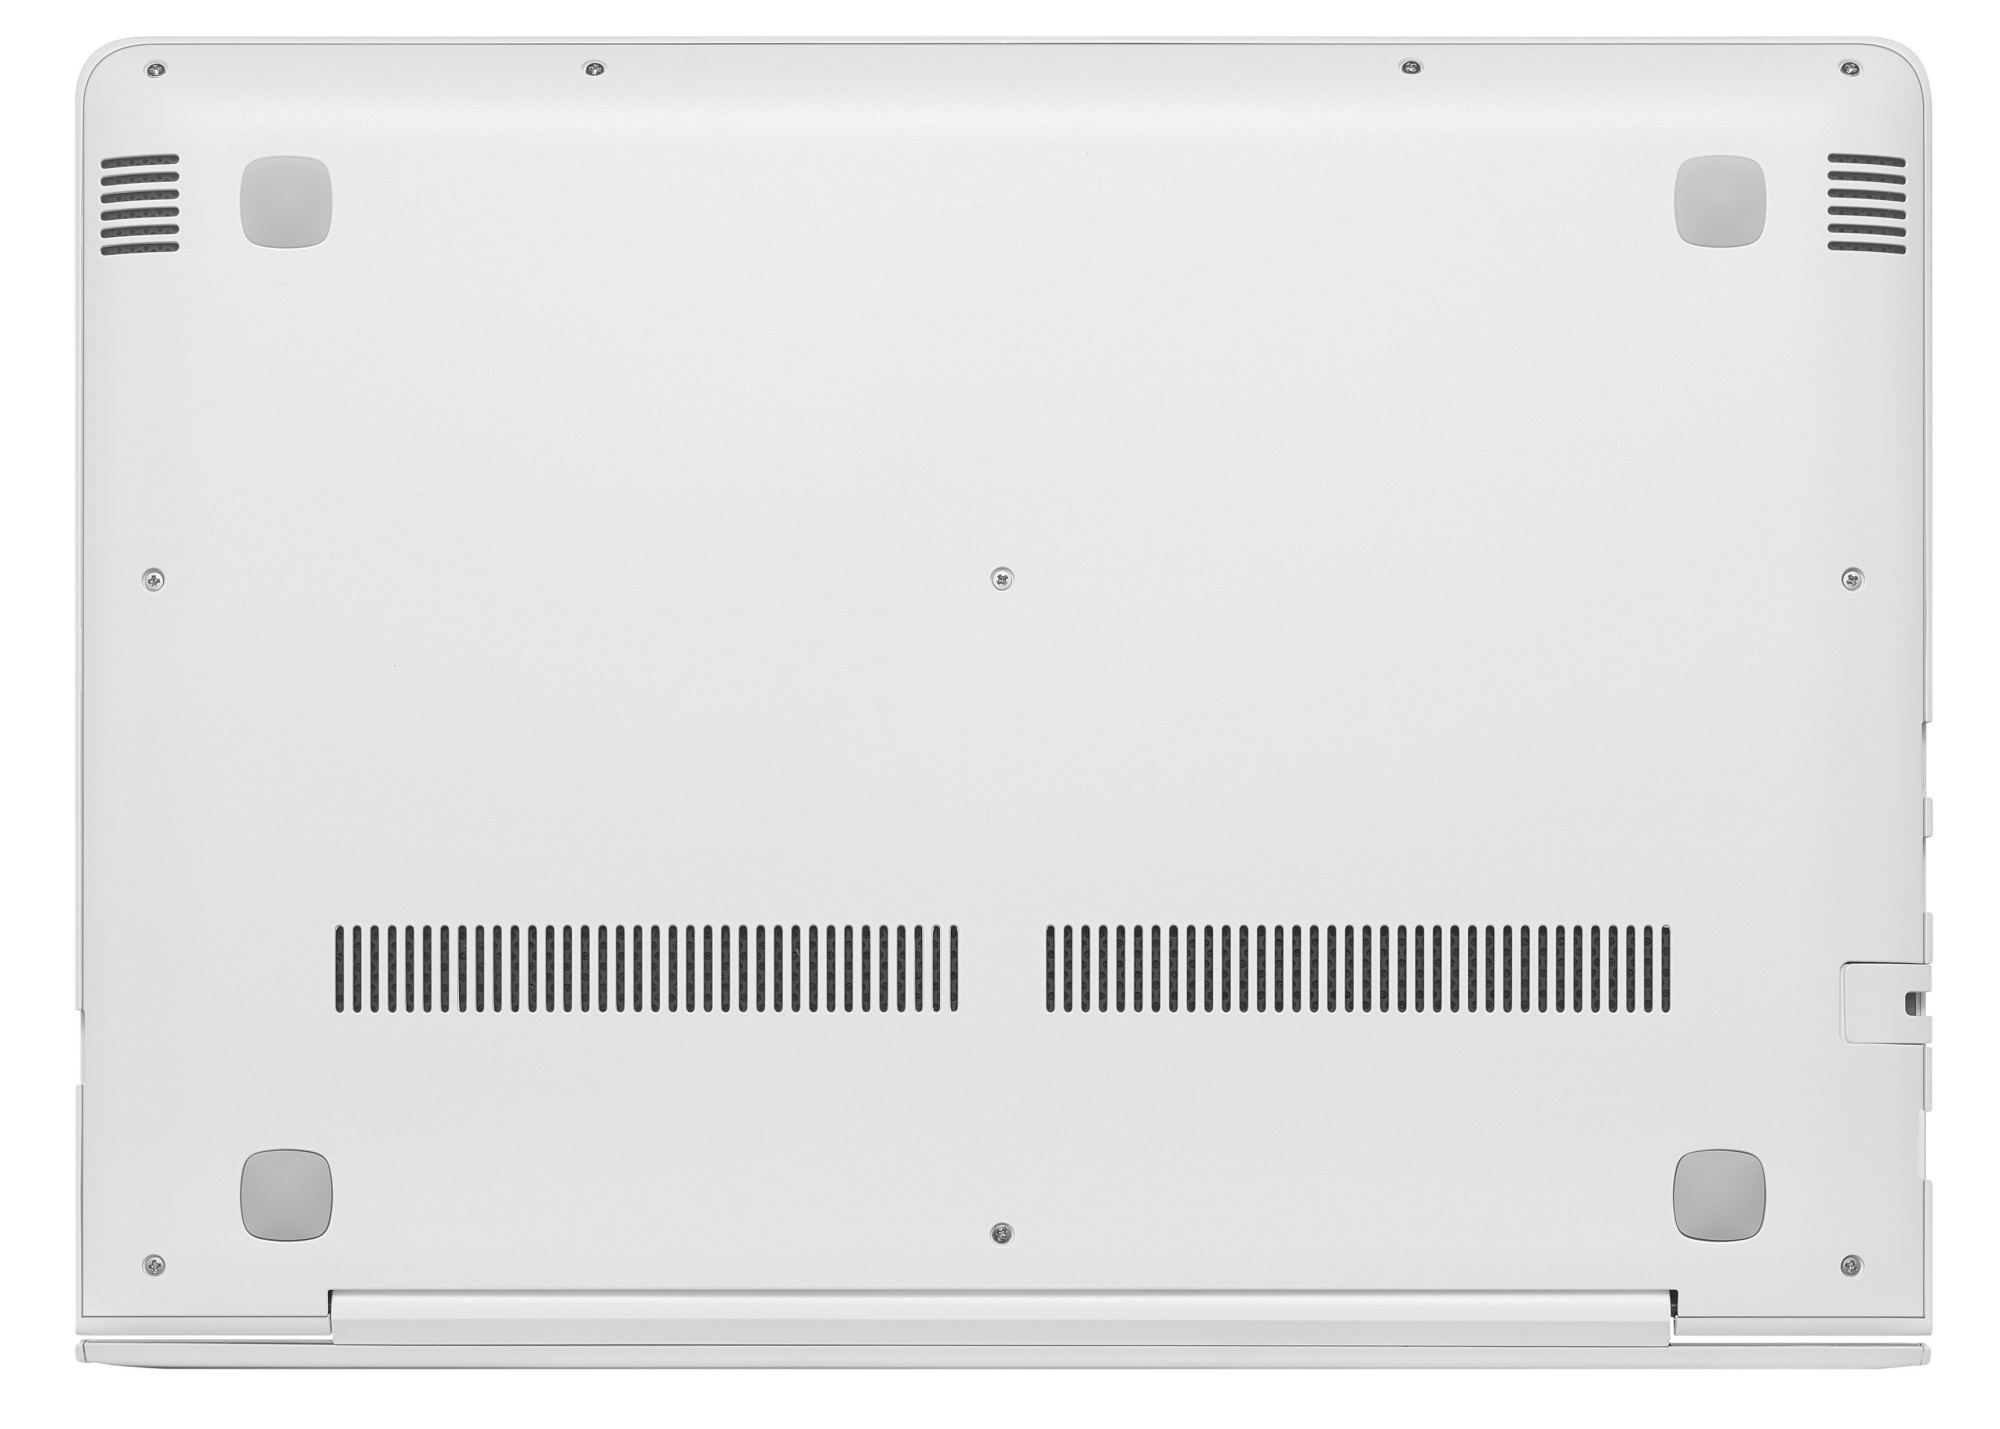
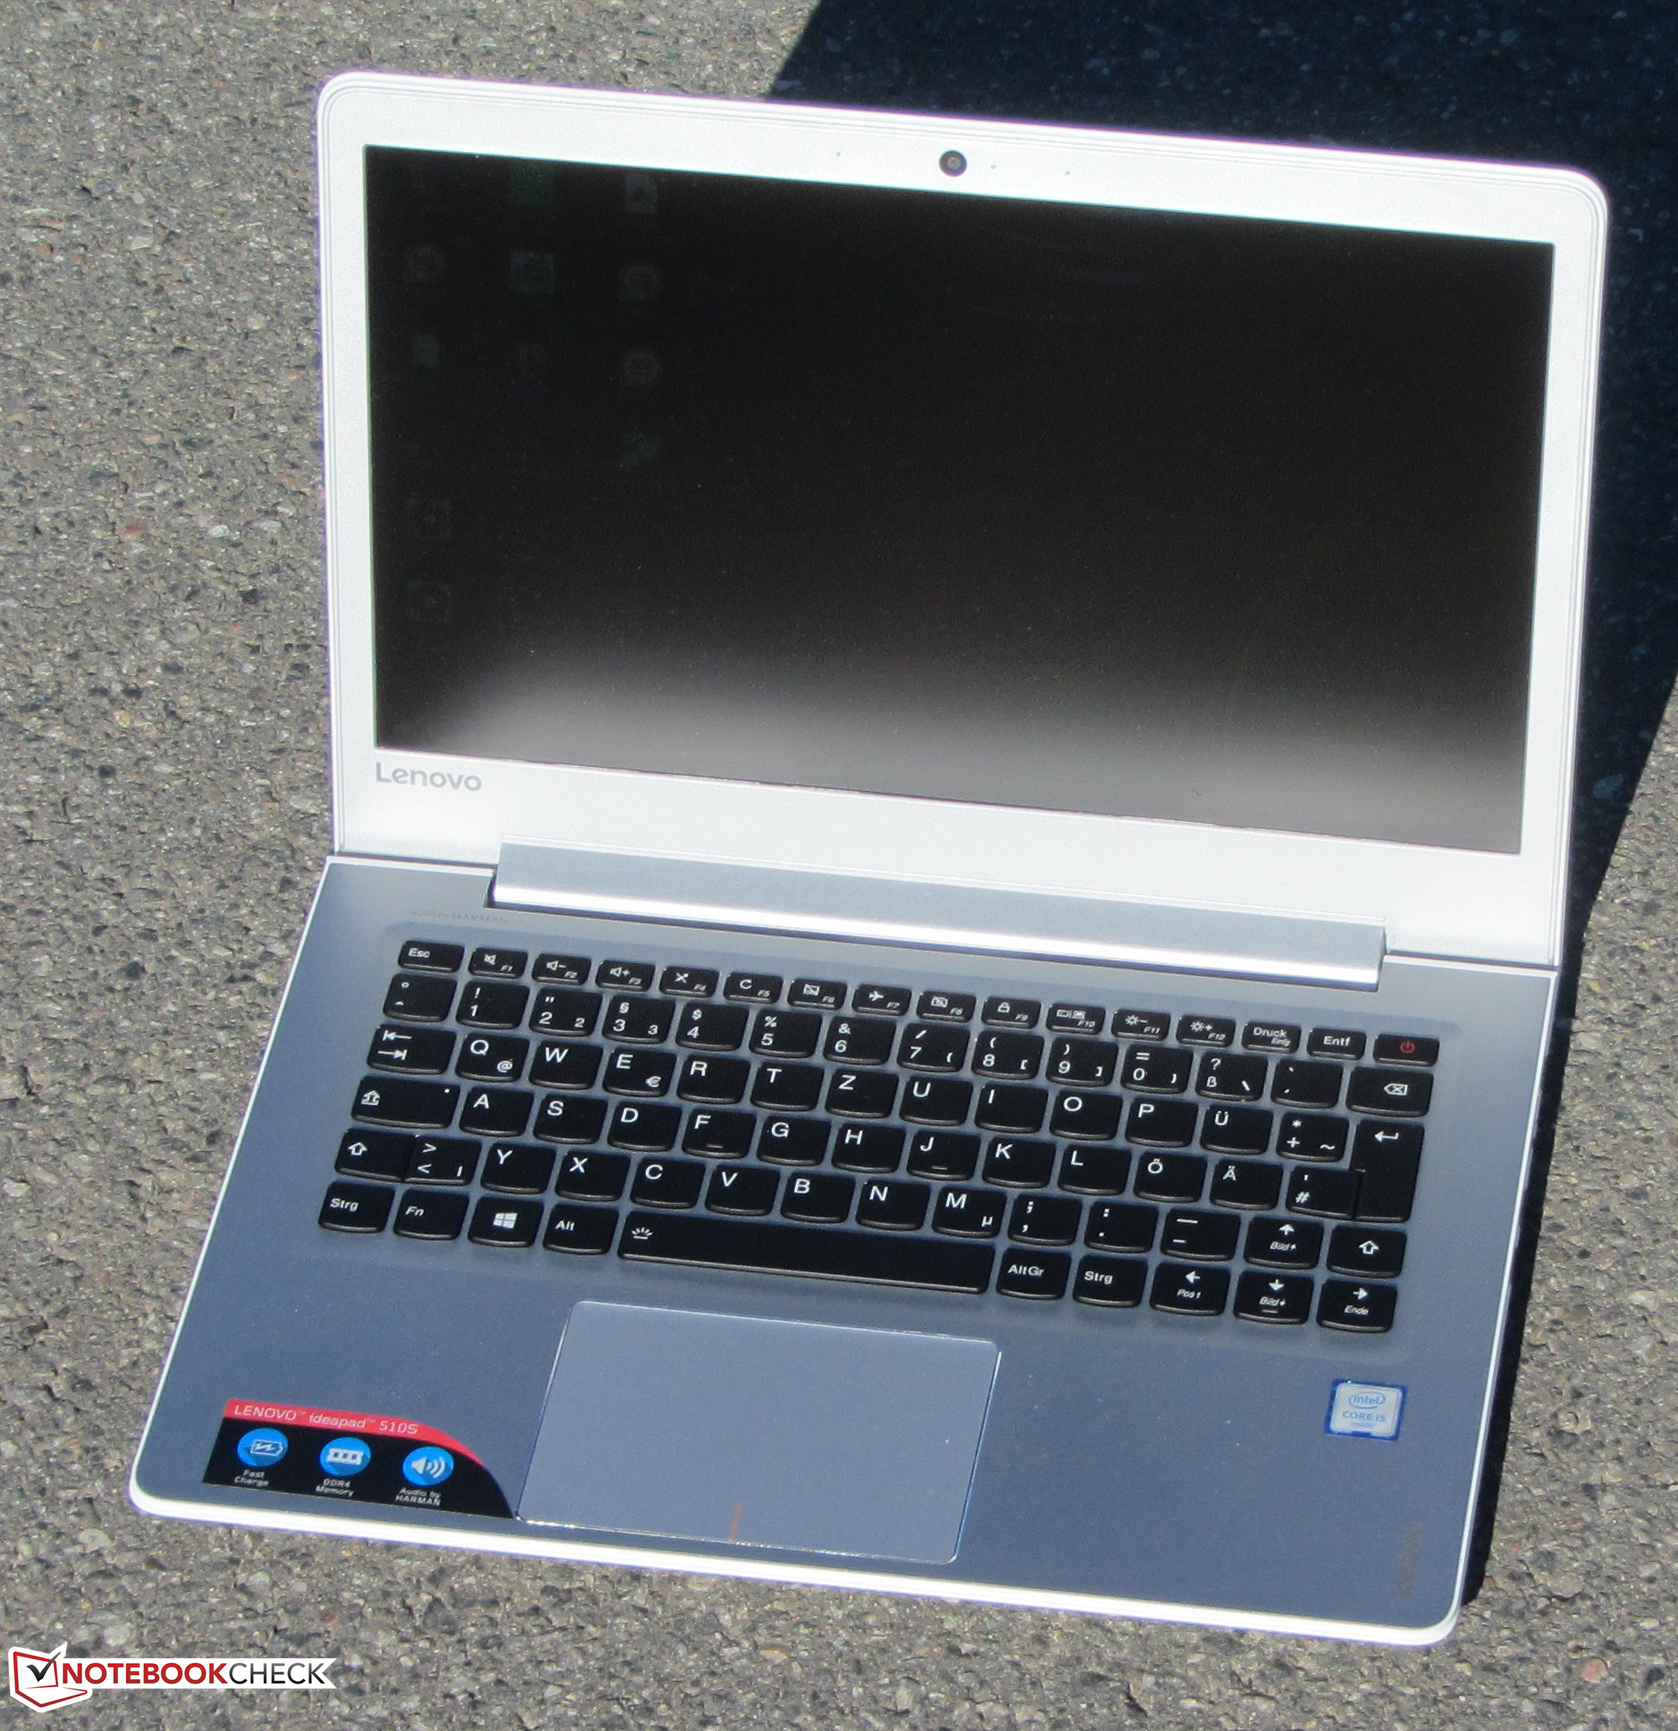
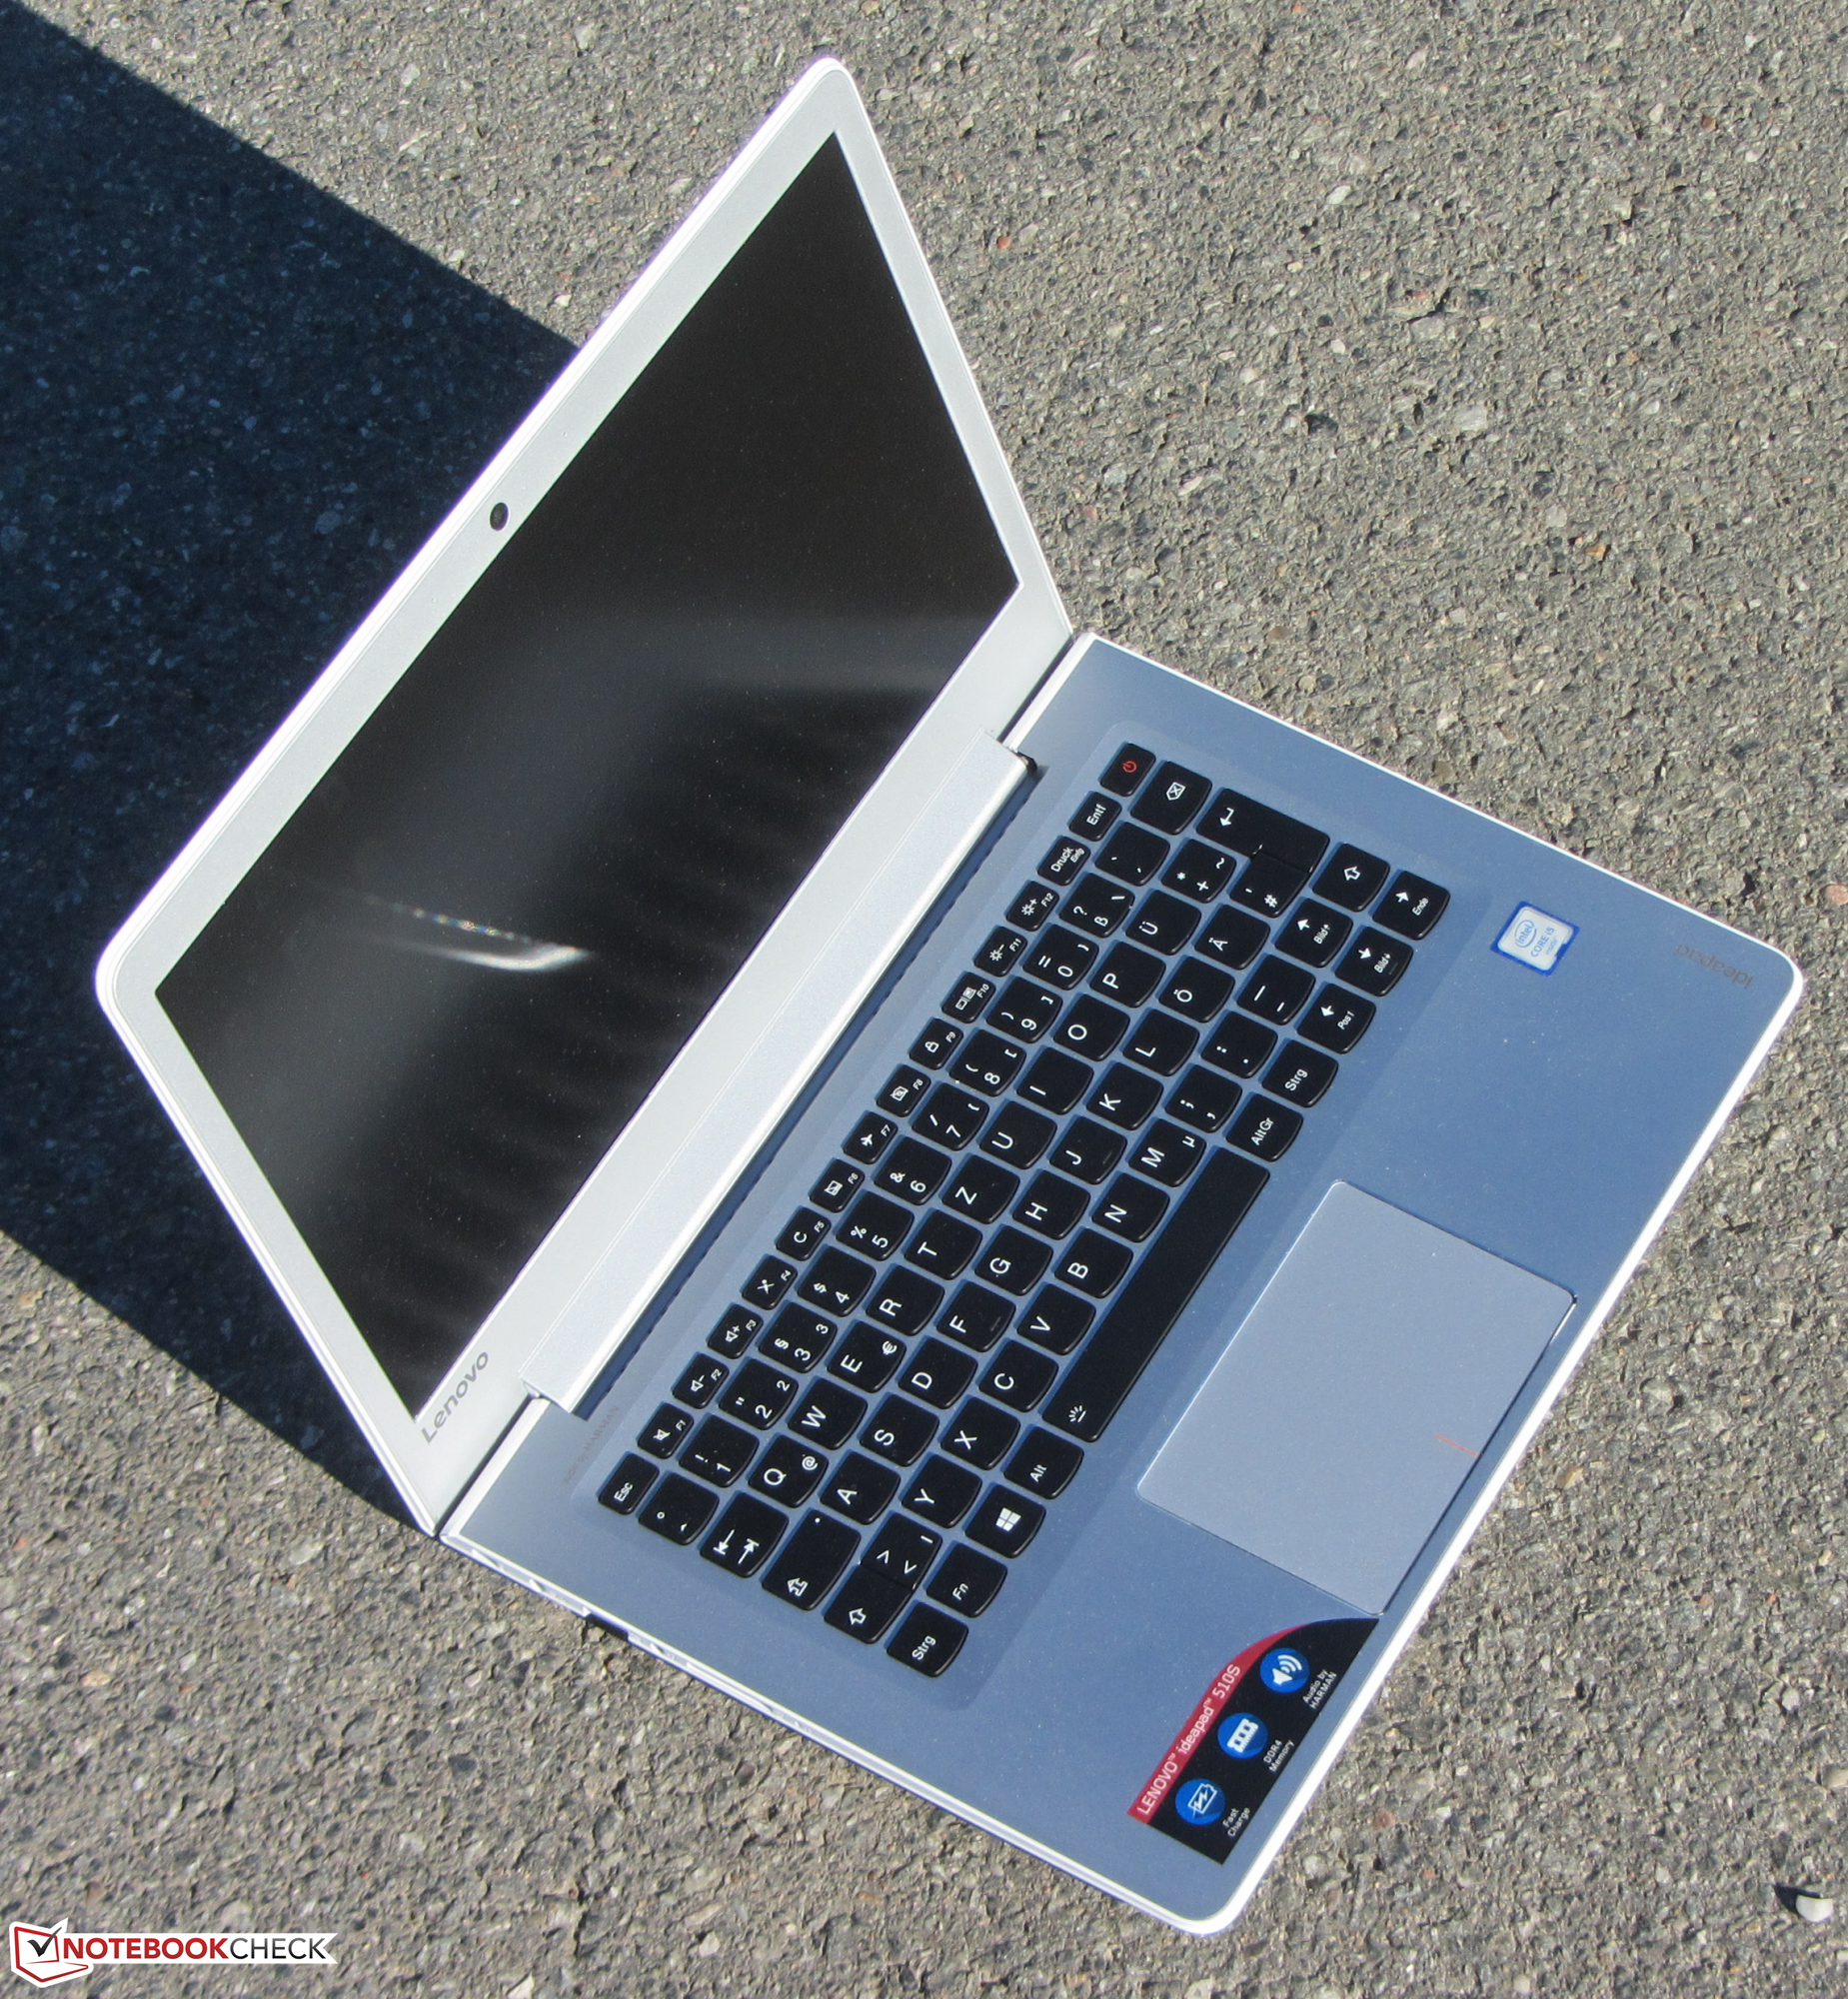
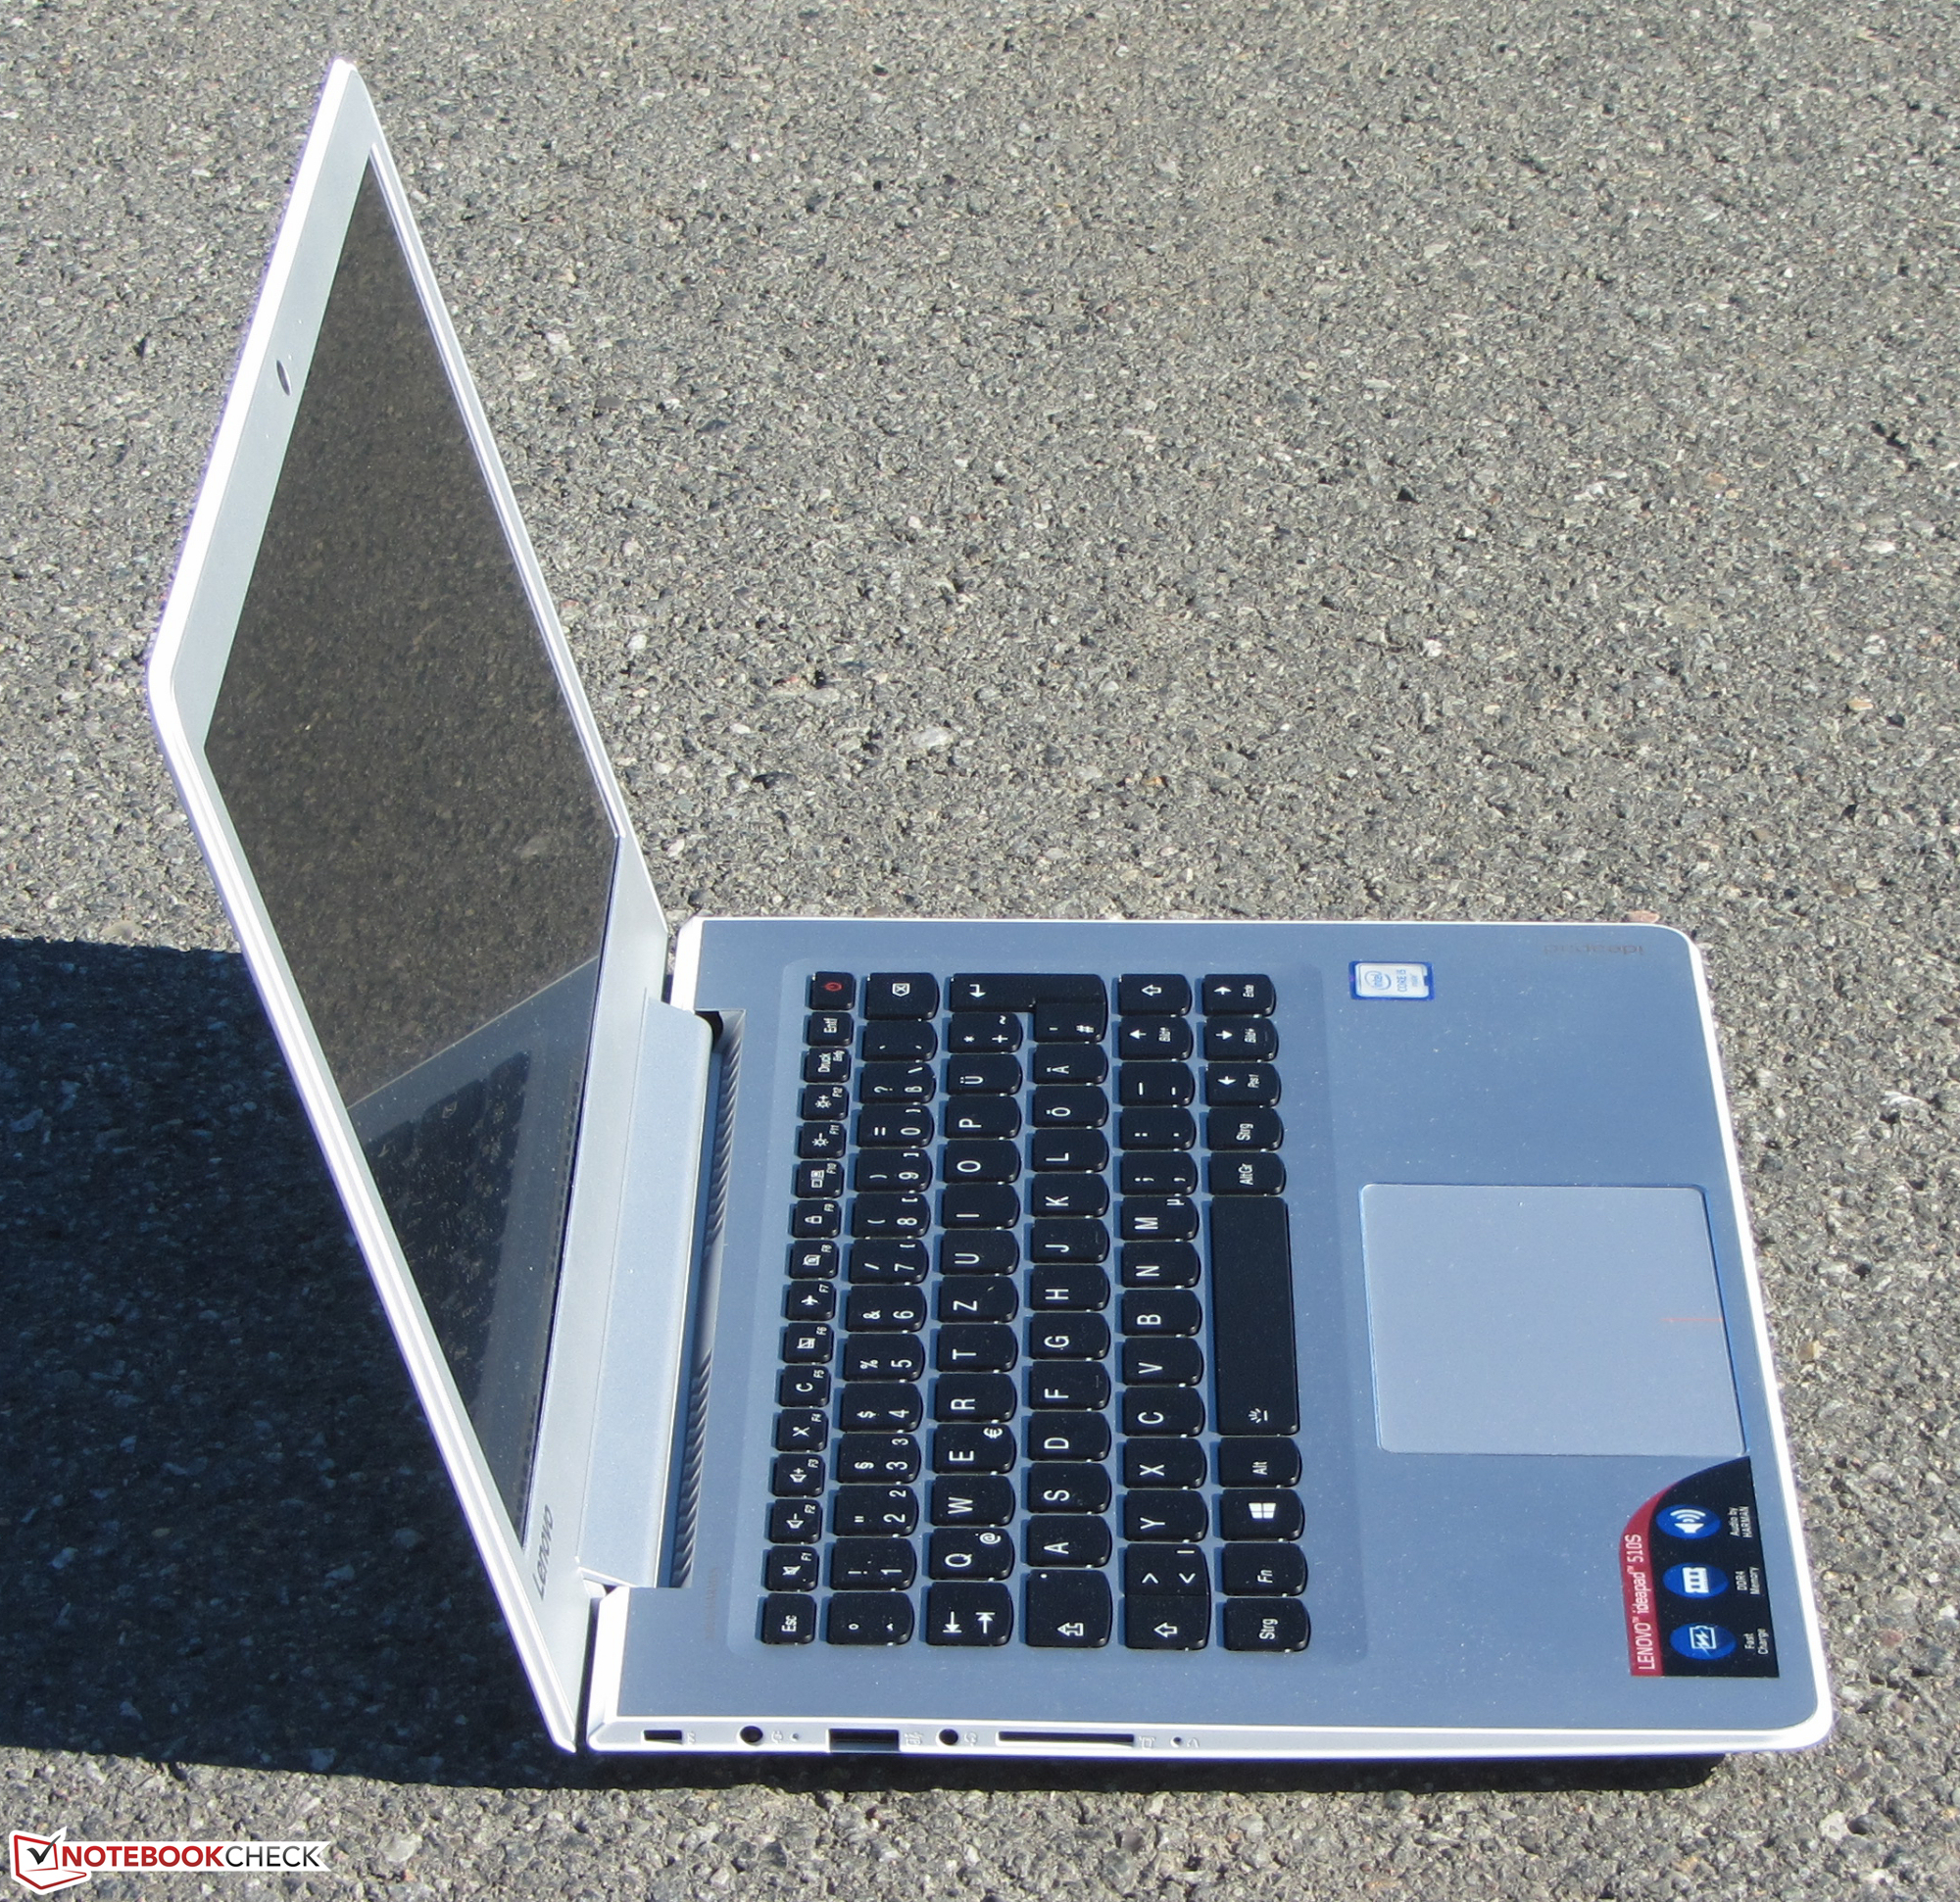
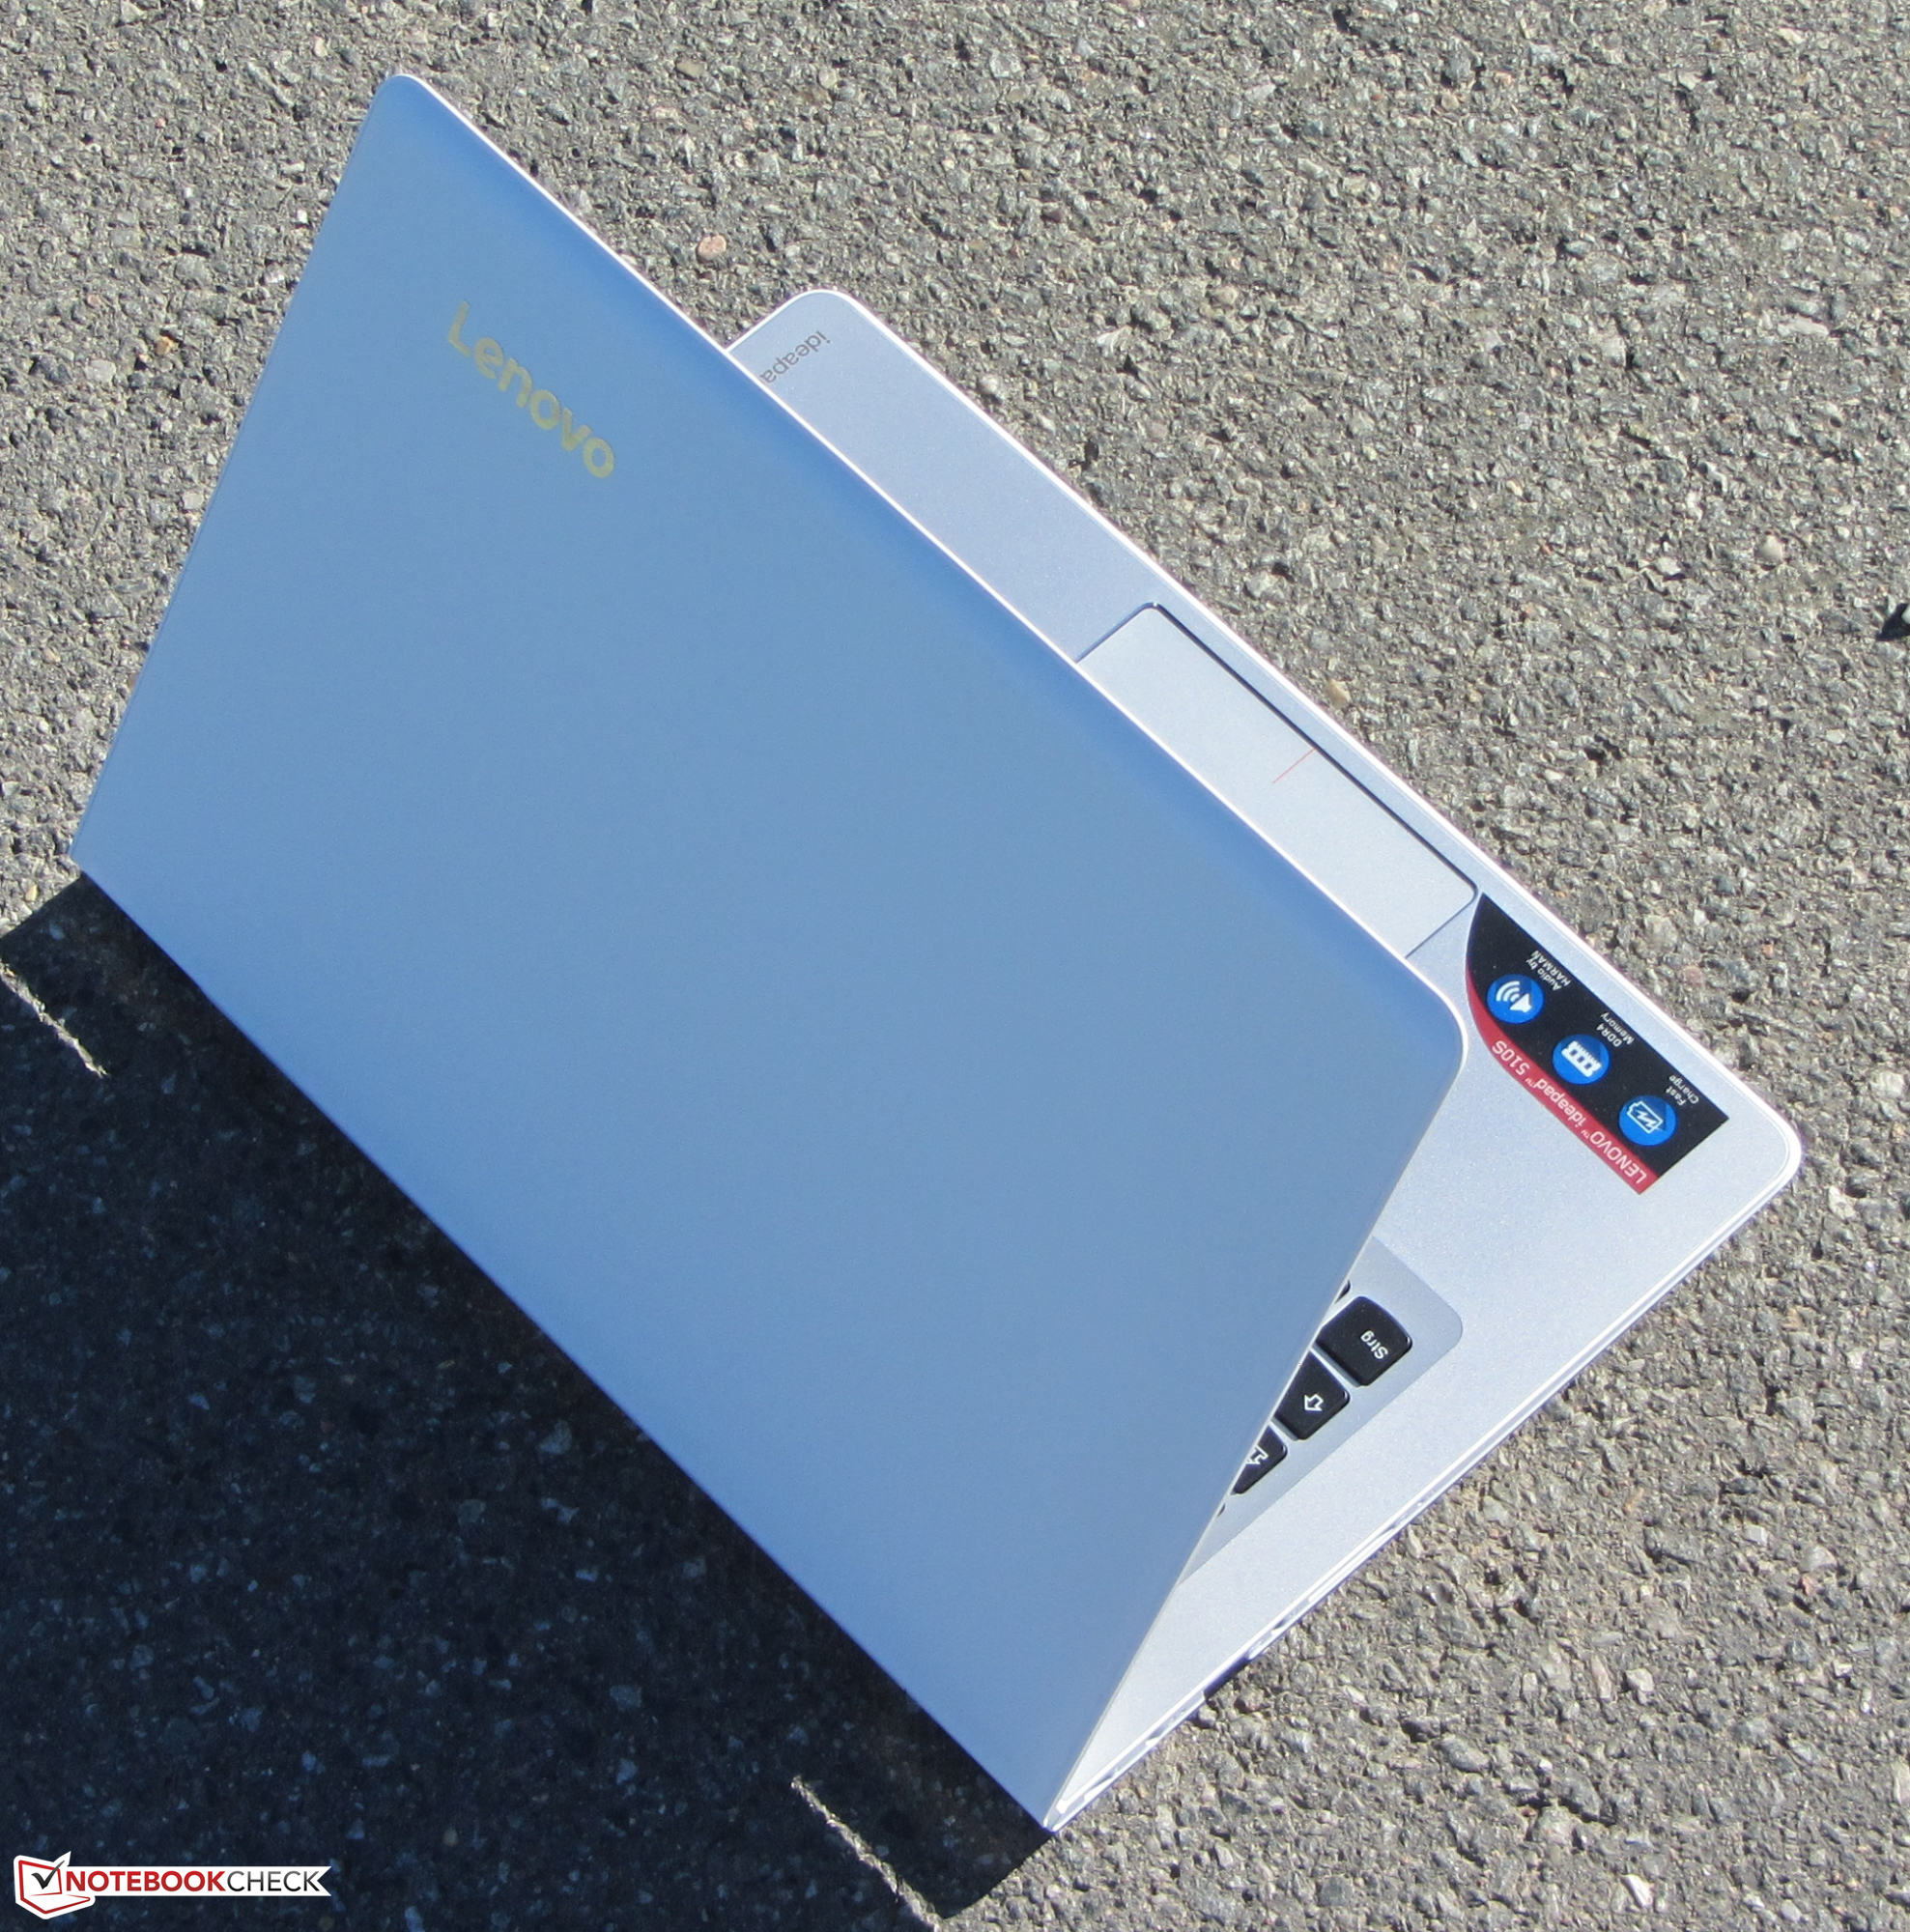
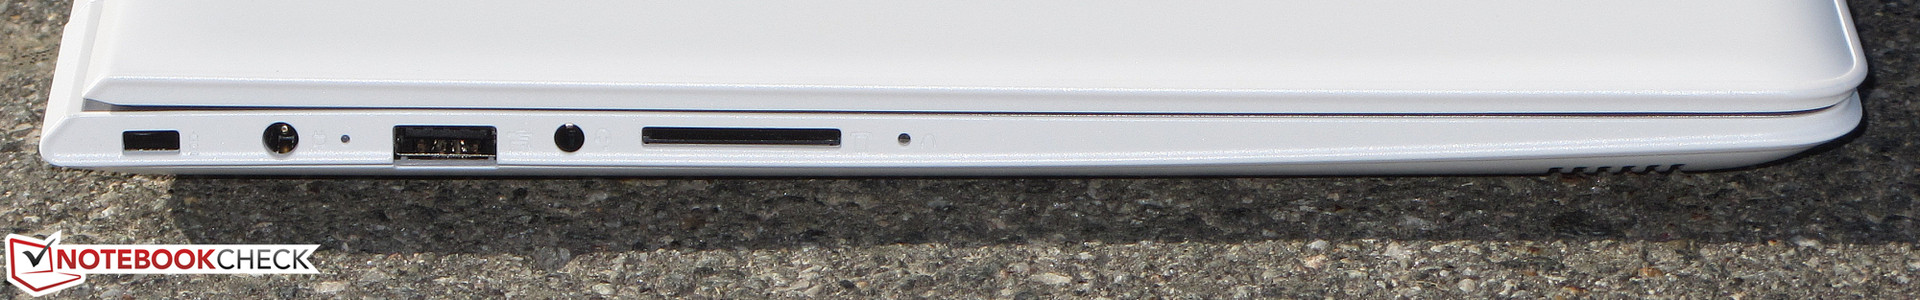
Breve Análise do Subportátil Lenovo IdeaPad 510S-13ISK
| SD Card Reader | |
| average JPG Copy Test (av. of 3 runs) | |
| Asus Zenbook UX303UA-R4051T | |
| Asus Zenbook UX303UA-FN121T | |
| HP Envy 13-d020ng | |
| Lenovo Ideapad 510S-13ISK | |
| Asus X302UV-FN016T | |
| Acer Aspire V3-372-57CW | |
| Lenovo IdeaPad 500S-13ISK | |
| Lenovo E31-70 80KX015RGE | |
| maximum AS SSD Seq Read Test (1GB) | |
| Asus Zenbook UX303UA-FN121T | |
| Asus Zenbook UX303UA-R4051T | |
| HP Envy 13-d020ng | |
| Lenovo Ideapad 510S-13ISK | |
| Asus X302UV-FN016T | |
| Lenovo E31-70 80KX015RGE | |
| Acer Aspire V3-372-57CW | |
| Lenovo IdeaPad 500S-13ISK | |
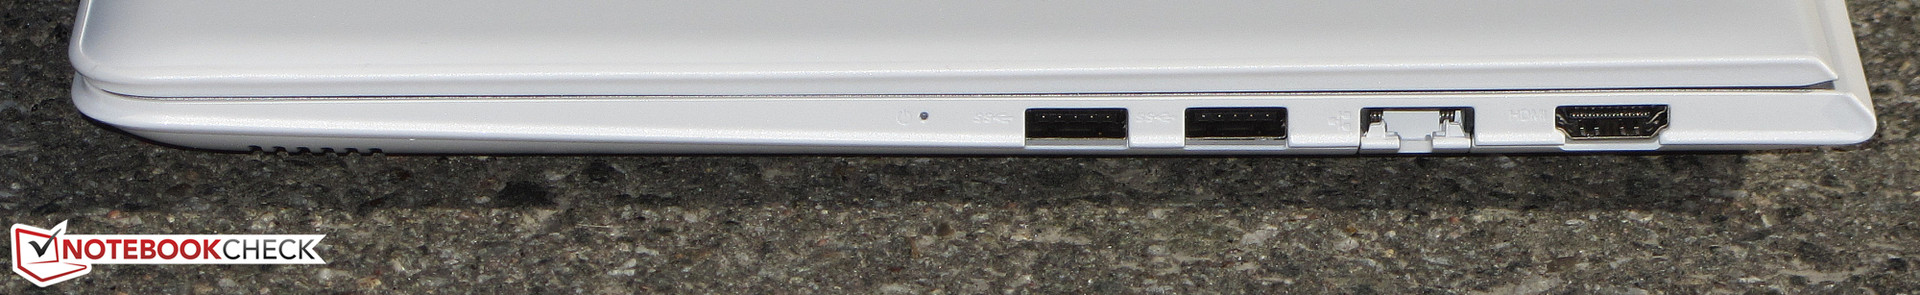
| Networking | |
| iperf Server (receive) TCP 1 m | |
| Apple MacBook 12 (Early 2016) 1.1 GHz | |
| Lenovo Ideapad 510S-13ISK (seb) | |
| Lenovo IdeaPad 510S-14ISK | |
| iperf Client (transmit) TCP 1 m | |
| Apple MacBook 12 (Early 2016) 1.1 GHz | |
| Lenovo IdeaPad 510S-14ISK | |
| Lenovo Ideapad 510S-13ISK (seb) | |
| |||||||||||||||||||||||||
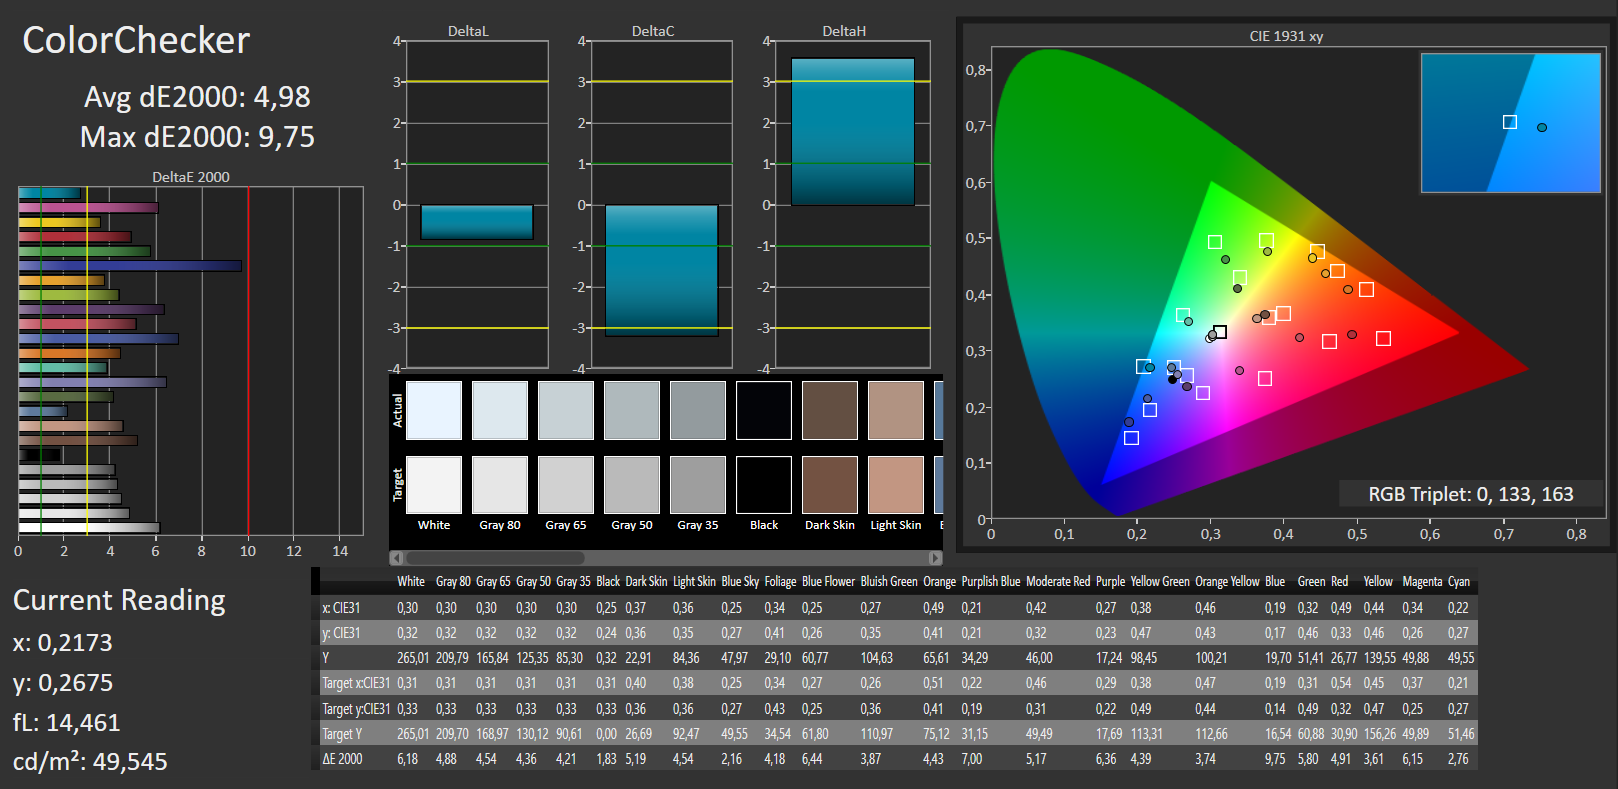
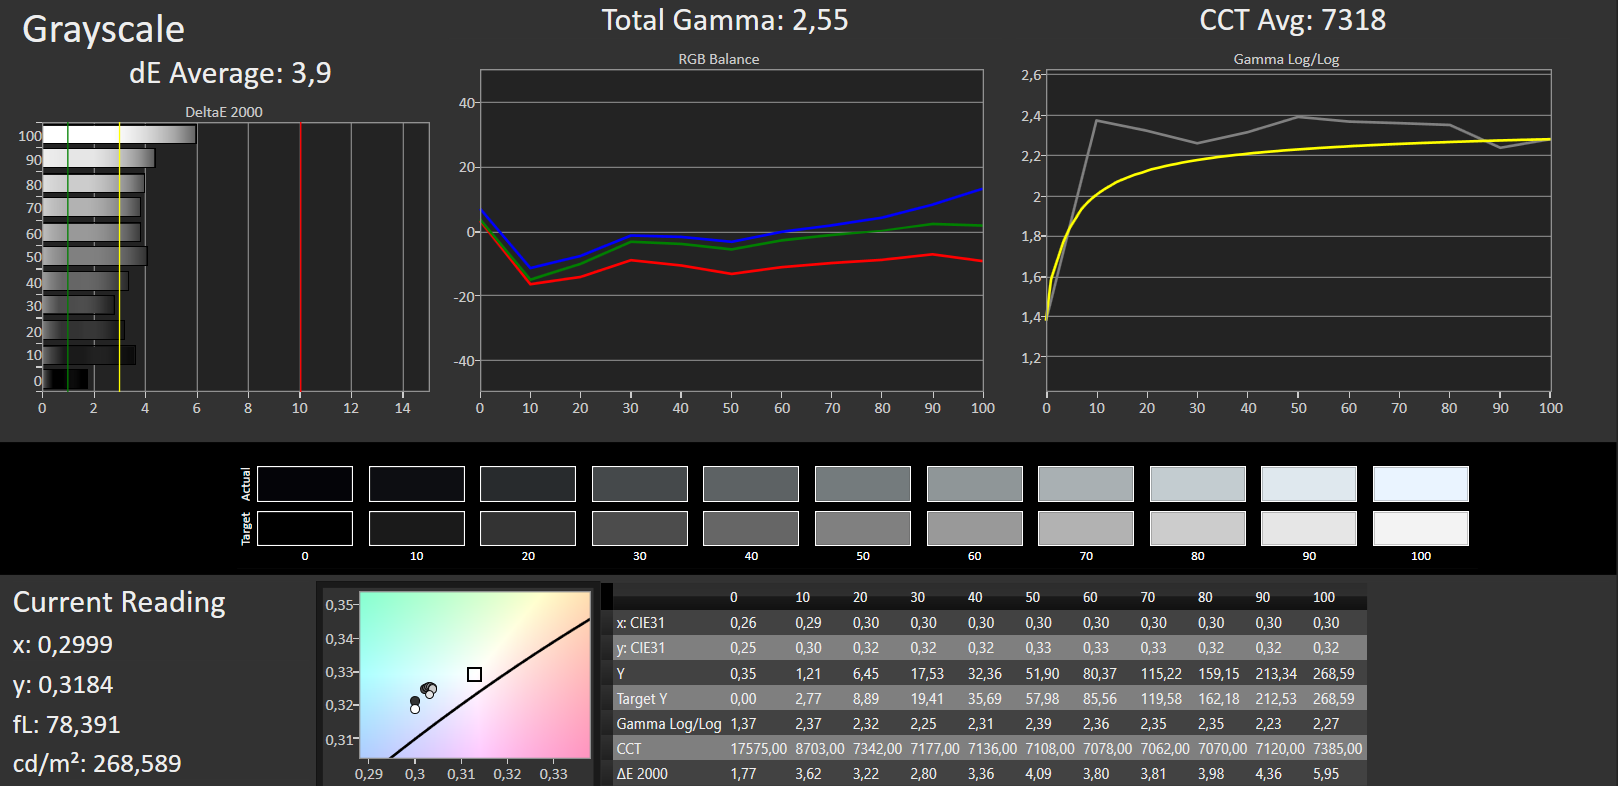
iluminação: 90 %
iluminação com acumulador: 265 cd/m²
Contraste: 803:1 (Preto: 0.33 cd/m²)
ΔE ColorChecker Calman: 4.98 | ∀{0.5-29.43 Ø4.72}
ΔE Greyscale Calman: 3.9 | ∀{0.09-98 Ø4.97}
59% sRGB (Argyll 1.6.3 3D)
38% AdobeRGB 1998 (Argyll 1.6.3 3D)
40.8% AdobeRGB 1998 (Argyll 3D)
59.2% sRGB (Argyll 3D)
39.48% Display P3 (Argyll 3D)
Gamma: 2.55
CCT: 7318 K
| Lenovo Ideapad 510S-13ISK LG Philips LP133WF2-SPL1, IPS | Lenovo IdeaPad 500S-13ISK LGD048C (LP133WF2-SPL1), IPS | Asus X302UV-FN016T InfoVision M133NWN1 R3, TN LED | Acer Aspire V3-372-57CW LG LP133WF2-SPL3, IPS | HP Envy 13-d020ng AU Optronics AUO272D, IPS | Asus Zenbook UX303UA-R4051T ChiMei N133HSE-EA3 (CMN1361), IPS | Apple MacBook Air 13 inch 2015-03 Apple APP9CF0, TN LED | |
|---|---|---|---|---|---|---|---|
| Display | 1% | 23% | -1% | 59% | 64% | 2% | |
| Display P3 Coverage (%) | 39.48 | 40.74 3% 38.91 -1% | 48.37 23% | 39.18 -1% | 63.7 61% | 67.5 71% | 40.1 2% |
| sRGB Coverage (%) | 59.2 | 60.6 2% 58.5 -1% | 72.6 23% | 58.6 -1% | 93 57% | 92.5 56% | 59.8 1% |
| AdobeRGB 1998 Coverage (%) | 40.8 | 42.15 3% 40.21 -1% | 49.98 23% | 40.51 -1% | 65.1 60% | 67.7 66% | 41.51 2% |
| Response Times | -18% | -14% | -37% | -4% | 5% | ||
| Response Time Grey 50% / Grey 80% * (ms) | 33 ? | 46 ? -39% | 42 ? -27% | 41 ? -24% | 34 ? -3% | 31 ? 6% | |
| Response Time Black / White * (ms) | 23 ? | 22 ? 4% | 23 ? -0% | 34.4 ? -50% | 24 ? -4% | 22 ? 4% | |
| PWM Frequency (Hz) | 50 ? | 50 ? | 208 ? | 198 ? | |||
| Screen | -8% | -7% | -16% | 24% | 19% | 7% | |
| Brightness middle (cd/m²) | 265 | 219 -17% | 218 -18% | 247 -7% | 345 30% | 357 35% | 329 24% |
| Brightness (cd/m²) | 261 | 212 -19% | 210 -20% | 239 -8% | 335 28% | 351 34% | 310 19% |
| Brightness Distribution (%) | 90 | 82 -9% | 88 -2% | 81 -10% | 95 6% | 90 0% | 82 -9% |
| Black Level * (cd/m²) | 0.33 | 0.35 -6% | 0.5 -52% | 0.38 -15% | 0.25 24% | 0.58 -76% | 0.405 -23% |
| Contrast (:1) | 803 | 626 -22% | 436 -46% | 650 -19% | 1380 72% | 616 -23% | 812 1% |
| Colorchecker dE 2000 * | 4.98 | 4.95 1% | 3.89 22% | 5.95 -19% | 4.94 1% | 3.39 32% | 3.96 20% |
| Colorchecker dE 2000 max. * | 9.75 | 11.17 -15% | 7.11 27% | 14.2 -46% | 8.85 9% | 6.76 31% | 7.51 23% |
| Greyscale dE 2000 * | 3.9 | 3.45 12% | 4.9 -26% | 5.25 -35% | 5.85 -50% | 2.36 39% | 3.51 10% |
| Gamma | 2.55 86% | 2.34 94% | 2.41 91% | 2.42 91% | 2.25 98% | 2.2 100% | 3.83 57% |
| CCT | 7318 89% | 6815 95% | 7860 83% | 6736 96% | 7105 91% | 6653 98% | 6711 97% |
| Color Space (Percent of AdobeRGB 1998) (%) | 38 | 37 -3% | 46 21% | 37.28 -2% | 60 58% | 60 58% | 38.4 1% |
| Color Space (Percent of sRGB) (%) | 59 | 58 -2% | 73 24% | 58.37 -1% | 93 58% | 93 58% | 59.8 1% |
| Média Total (Programa/Configurações) | -8% /
-6% | 1% /
-2% | -18% /
-16% | 26% /
27% | 29% /
26% | 5% /
6% |
* ... menor é melhor
Cintilação da tela / PWM (modulação por largura de pulso)
| Tela tremeluzindo/PWM detectado | 50 Hz | ≤ 80 % configuração de brilho | 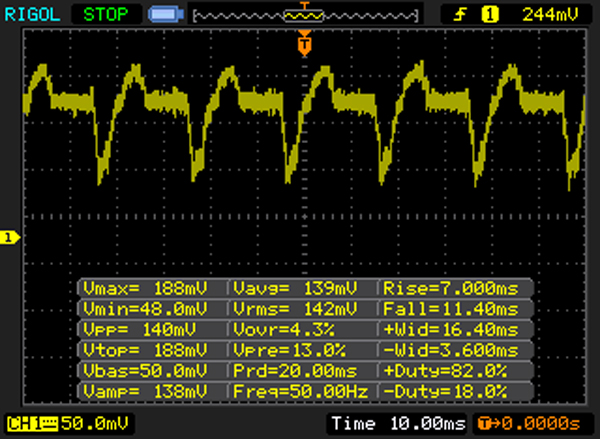 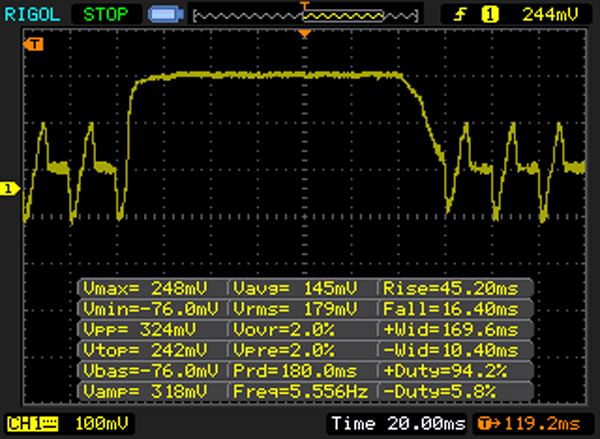 |
A luz de fundo da tela pisca em 50 Hz (pior caso, por exemplo, utilizando PWM) Cintilação detectada em uma configuração de brilho de 80 % e abaixo. Não deve haver cintilação ou PWM acima desta configuração de brilho. A frequência de 50 Hz é muito baixa, portanto a oscilação pode causar fadiga ocular e dores de cabeça após uso prolongado. [pwm_comparison] Em comparação: 52 % de todos os dispositivos testados não usam PWM para escurecer a tela. Se PWM foi detectado, uma média de 7769 (mínimo: 5 - máximo: 343500) Hz foi medida. | |||
Exibir tempos de resposta
| ↔ Tempo de resposta preto para branco | ||
|---|---|---|
| 23 ms ... ascensão ↗ e queda ↘ combinadas | ↗ 5 ms ascensão | 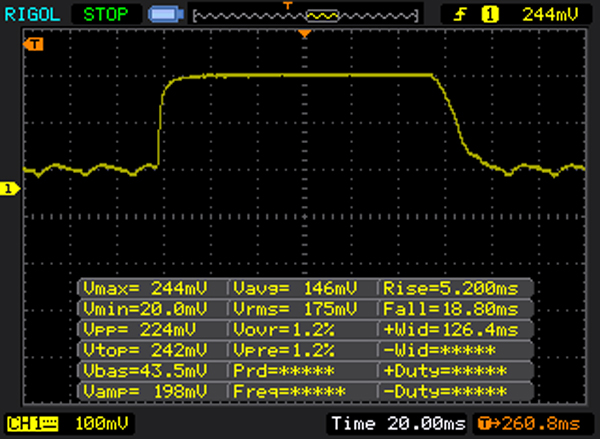 |
| ↘ 18 ms queda | ||
| A tela mostra boas taxas de resposta em nossos testes, mas pode ser muito lenta para jogadores competitivos. Em comparação, todos os dispositivos testados variam de 0.1 (mínimo) a 240 (máximo) ms. » 52 % de todos os dispositivos são melhores. Isso significa que o tempo de resposta medido é pior que a média de todos os dispositivos testados (19.8 ms). | ||
| ↔ Tempo de resposta 50% cinza a 80% cinza | ||
| 33 ms ... ascensão ↗ e queda ↘ combinadas | ↗ 12 ms ascensão | 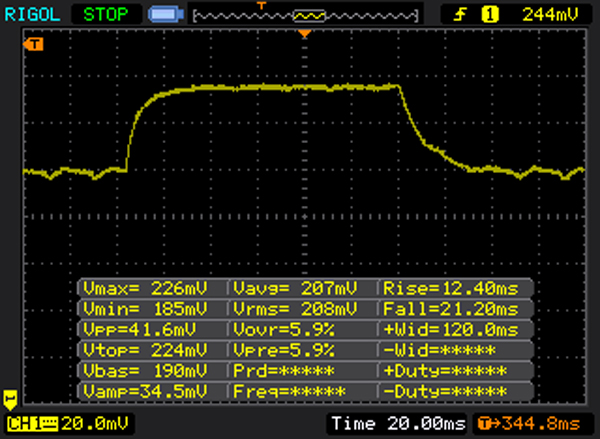 |
| ↘ 21 ms queda | ||
| A tela mostra taxas de resposta lentas em nossos testes e será insatisfatória para os jogadores. Em comparação, todos os dispositivos testados variam de 0.165 (mínimo) a 636 (máximo) ms. » 45 % de todos os dispositivos são melhores. Isso significa que o tempo de resposta medido é semelhante à média de todos os dispositivos testados (31 ms). | ||

| Cinebench R15 | |
| CPU Single 64Bit | |
| Acer Aspire V3-372-57CW | |
| Asus Zenbook UX303UA-R4051T | |
| Lenovo IdeaPad 500S-13ISK | |
| Asus X302UV-FN016T | |
| Apple MacBook Air 13 inch 2015-03 | |
| HP Envy 13-d020ng | |
| Asus Zenbook UX303UA-FN121T | |
| Lenovo Ideapad 510S-13ISK | |
| Apple MacBook 12 (Early 2016) 1.1 GHz | |
| Apple MacBook 12 (Early 2016) 1.1 GHz | |
| Lenovo E31-70 80KX015RGE | |
| CPU Multi 64Bit | |
| Acer Aspire V3-372-57CW | |
| Asus Zenbook UX303UA-R4051T | |
| Apple MacBook Air 13 inch 2015-03 | |
| Asus X302UV-FN016T | |
| Lenovo Ideapad 510S-13ISK | |
| Asus Zenbook UX303UA-FN121T | |
| HP Envy 13-d020ng | |
| Lenovo IdeaPad 500S-13ISK | |
| Apple MacBook 12 (Early 2016) 1.1 GHz | |
| Lenovo E31-70 80KX015RGE | |
| PCMark 8 | |
| Home Score Accelerated v2 | |
| Acer Aspire V3-372-57CW | |
| Apple MacBook Air 13 inch 2015-03 | |
| Asus X302UV-FN016T | |
| Asus Zenbook UX303UA-R4051T | |
| HP Envy 13-d020ng | |
| Asus Zenbook UX303UA-FN121T | |
| Lenovo Ideapad 510S-13ISK | |
| Lenovo IdeaPad 500S-13ISK | |
| Lenovo E31-70 80KX015RGE | |
| Apple MacBook 12 (Early 2016) 1.1 GHz | |
| Work Score Accelerated v2 | |
| Acer Aspire V3-372-57CW | |
| Asus X302UV-FN016T | |
| Apple MacBook Air 13 inch 2015-03 | |
| Asus Zenbook UX303UA-R4051T | |
| HP Envy 13-d020ng | |
| Asus Zenbook UX303UA-FN121T | |
| Lenovo IdeaPad 500S-13ISK | |
| Lenovo Ideapad 510S-13ISK | |
| Apple MacBook 12 (Early 2016) 1.1 GHz | |
| PCMark 7 Score | 2846 pontos | |
| PCMark 8 Home Score Accelerated v2 | 3077 pontos | |
| PCMark 8 Creative Score Accelerated v2 | 3560 pontos | |
| PCMark 8 Work Score Accelerated v2 | 3629 pontos | |
Ajuda | ||

| Lenovo Ideapad 510S-13ISK WDC Slim WD10SPCX-24HWST1 | Lenovo IdeaPad 500S-13ISK Seagate ST500LM000 Solid State Hybrid Drive | Asus X302UV-FN016T Hynix HFS128G3MND | Acer Aspire V3-372-57CW Kingston RBU-SNS8152S3256GG2 | Lenovo E31-70 80KX015RGE Seagate ST500LM000 Solid State Hybrid Drive | HP Envy 13-d020ng Samsung MZRPC256HADR-000SO | Asus Zenbook UX303UA-FN121T Hitachi Travelstar Z5K500 HTS545050A7E680 | |
|---|---|---|---|---|---|---|---|
| CrystalDiskMark 3.0 | 23% | 5639% | 8603% | 35% | 8596% | -20% | |
| Read Seq (MB/s) | 108.3 | 108.1 0% | 428.2 295% | 515 376% | 116.4 7% | 478.7 342% | 97.7 -10% |
| Write Seq (MB/s) | 109 | 113 4% | 178.6 64% | 338 210% | 120.7 11% | 268.5 146% | 94.5 -13% |
| Read 512 (MB/s) | 35.24 | 37.68 7% | 282.6 702% | 368.1 945% | 37.01 5% | 386.6 997% | 31.27 -11% |
| Write 512 (MB/s) | 53.3 | 61.2 15% | 179.1 236% | 338.6 535% | 73.1 37% | 268.8 404% | 35.06 -34% |
| Read 4k (MB/s) | 0.395 | 0.48 22% | 6.559 1561% | 28.88 7211% | 0.507 28% | 26.88 6705% | 0.379 -4% |
| Write 4k (MB/s) | 1.19 | 3.439 189% | 71.2 5883% | 74.2 6135% | 4.156 249% | 78.7 6513% | 0.862 -28% |
| Read 4k QD32 (MB/s) | 1.139 | 1.026 -10% | 253 22112% | 319.9 27986% | 0.967 -15% | 369.4 32332% | 0.792 -30% |
| Write 4k QD32 (MB/s) | 1.212 | 0.673 -44% | 174 14256% | 309.4 25428% | 0.652 -46% | 259.7 21327% | 0.871 -28% |
| 3DMark 06 Standard Score | 5463 pontos | |
| 3DMark 11 Performance | 1488 pontos | |
| 3DMark Ice Storm Standard Score | 49866 pontos | |
| 3DMark Cloud Gate Standard Score | 5341 pontos | |
| 3DMark Fire Strike Score | 749 pontos | |
Ajuda | ||
| 3DMark 11 - 1280x720 Performance GPU | |
| Acer Aspire V3-372-57CW | |
| Asus X302UV-FN016T | |
| Asus Zenbook UX303UA-R4051T | |
| Lenovo Ideapad 510S-13ISK | |
| Apple MacBook Air 13 inch 2015-03 | |
| HP Envy 13-d020ng | |
| Asus Zenbook UX303UA-FN121T | |
| Lenovo IdeaPad 500S-13ISK | |
| Apple MacBook 12 (Early 2016) 1.1 GHz | |
| Lenovo E31-70 80KX015RGE | |
| 3DMark | |
| 1280x720 Cloud Gate Standard Graphics | |
| Acer Aspire V3-372-57CW | |
| Asus Zenbook UX303UA-R4051T | |
| Asus X302UV-FN016T | |
| Apple MacBook Air 13 inch 2015-03 | |
| HP Envy 13-d020ng | |
| Lenovo Ideapad 510S-13ISK | |
| Asus Zenbook UX303UA-FN121T | |
| Apple MacBook 12 (Early 2016) 1.1 GHz | |
| Lenovo IdeaPad 500S-13ISK | |
| 1920x1080 Fire Strike Graphics | |
| Acer Aspire V3-372-57CW | |
| Asus X302UV-FN016T | |
| Apple MacBook Air 13 inch 2015-03 | |
| Asus Zenbook UX303UA-R4051T | |
| HP Envy 13-d020ng | |
| Asus Zenbook UX303UA-FN121T | |
| Lenovo Ideapad 510S-13ISK | |
| Apple MacBook 12 (Early 2016) 1.1 GHz | |
| Lenovo IdeaPad 500S-13ISK | |
| baixo | média | alto | ultra | |
|---|---|---|---|---|
| Tomb Raider (2013) | 68.3 | 34.6 | 20.3 | 9.5 |
| BioShock Infinite (2013) | 42.2 | 24.7 | 20.5 | 6 |
| Battlefield 4 (2013) | 32 | 25.3 | 16.8 | 5.4 |
Barulho
| Ocioso |
| 32.1 / 32.1 / 32.1 dB |
| HDD |
| 32.1 dB |
| Carga |
| 40 / 40.9 dB |
 | ||
30 dB silencioso 40 dB(A) audível 50 dB(A) ruidosamente alto |
||
min: | ||
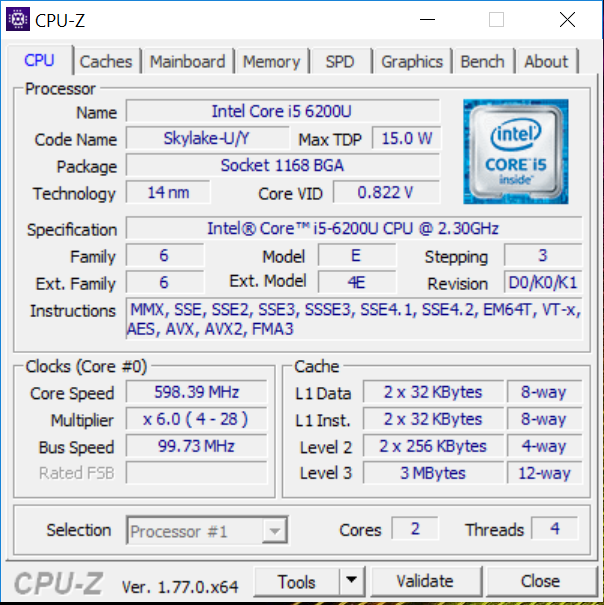
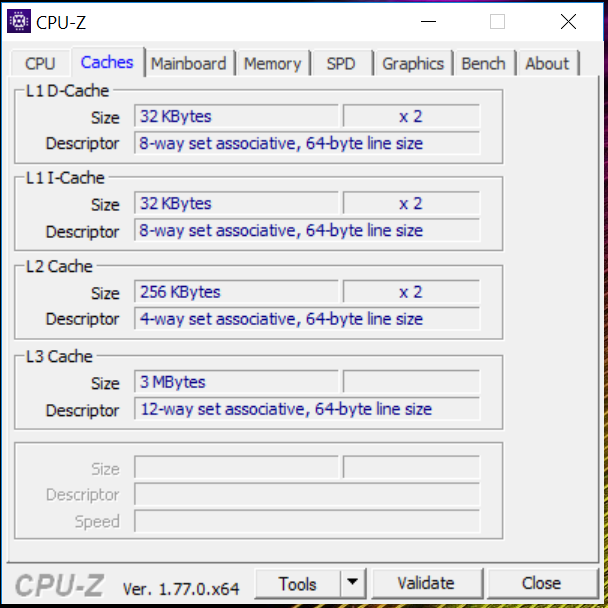
| Lenovo Ideapad 510S-13ISK 6200U, HD Graphics 520 | Lenovo IdeaPad 500S-13ISK 6200U, HD Graphics 520 | Asus X302UV-FN016T 6200U, GeForce 920MX | Acer Aspire V3-372-57CW 6267U, Iris Graphics 550 | HP Envy 13-d020ng 6200U, HD Graphics 520 | Asus Zenbook UX303UA-R4051T 6500U, HD Graphics 520 | Apple MacBook Air 13 inch 2015-03 5650U, HD Graphics 6000 | |
|---|---|---|---|---|---|---|---|
| Noise | 3% | 4% | 3% | 4% | 7% | 3% | |
| desligado / ambiente * (dB) | 31.2 | 31.3 -0% | 31.2 -0% | 29.1 7% | 31.3 -0% | ||
| Idle Minimum * (dB) | 32.1 | 31.3 2% | 32.9 -2% | 29.1 9% | 32.5 -1% | 31.3 2% | 29.2 9% |
| Idle Average * (dB) | 32.1 | 31.7 1% | 32.9 -2% | 29.1 9% | 32.5 -1% | 31.3 2% | 29.2 9% |
| Idle Maximum * (dB) | 32.1 | 31.8 1% | 33 -3% | 29.1 9% | 32.4 -1% | 31.5 2% | 29.2 9% |
| Load Average * (dB) | 40 | 36.7 8% | 33 17% | 41.1 -3% | 36 10% | 33.2 17% | 40.2 -1% |
| Load Maximum * (dB) | 40.9 | 39.4 4% | 34.6 15% | 46.4 -13% | 36.5 11% | 34.1 17% | 46.3 -13% |
* ... menor é melhor
(+) A temperatura máxima no lado superior é 38 °C / 100 F, em comparação com a média de 35.9 °C / 97 F , variando de 21.4 a 59 °C para a classe Subnotebook.
(+) A parte inferior aquece até um máximo de 39.1 °C / 102 F, em comparação com a média de 39.2 °C / 103 F
(+) Em uso inativo, a temperatura média para o lado superior é 28.1 °C / 83 F, em comparação com a média do dispositivo de 30.8 °C / ### class_avg_f### F.
(+) Os apoios para as mãos e o touchpad são mais frios que a temperatura da pele, com um máximo de 29.6 °C / 85.3 F e, portanto, são frios ao toque.
(±) A temperatura média da área do apoio para as mãos de dispositivos semelhantes foi 28.2 °C / 82.8 F (-1.4 °C / -2.5 F).
| Lenovo Ideapad 510S-13ISK 6200U, HD Graphics 520 | Lenovo IdeaPad 500S-13ISK 6200U, HD Graphics 520 | Asus X302UV-FN016T 6200U, GeForce 920MX | Acer Aspire V3-372-57CW 6267U, Iris Graphics 550 | HP Envy 13-d020ng 6200U, HD Graphics 520 | Asus Zenbook UX303UA-R4051T 6500U, HD Graphics 520 | Apple MacBook Air 13 inch 2015-03 5650U, HD Graphics 6000 | |
|---|---|---|---|---|---|---|---|
| Heat | 5% | 13% | -6% | -3% | 8% | -2% | |
| Maximum Upper Side * (°C) | 38 | 35.9 6% | 29.6 22% | 37.1 2% | 51 -34% | 38.1 -0% | 43.8 -15% |
| Maximum Bottom * (°C) | 39.1 | 39.1 -0% | 41 -5% | 43.2 -10% | 46 -18% | 40.3 -3% | 42.1 -8% |
| Idle Upper Side * (°C) | 30.7 | 27.8 9% | 24.8 19% | 32.1 -5% | 25.5 17% | 25.8 16% | 28.5 7% |
| Idle Bottom * (°C) | 31.1 | 29.1 6% | 26.6 14% | 34.4 -11% | 24.4 22% | 25.5 18% | 28.9 7% |
* ... menor é melhor
Lenovo Ideapad 510S-13ISK análise de áudio
(-) | alto-falantes não muito altos (###valor### dB)
Graves 100 - 315Hz
(-) | quase nenhum baixo - em média 19.7% menor que a mediana
(±) | a linearidade dos graves é média (11.2% delta para a frequência anterior)
Médios 400 - 2.000 Hz
(+) | médios equilibrados - apenas 1.3% longe da mediana
(+) | médios são lineares (6.9% delta para frequência anterior)
Altos 2 - 16 kHz
(+) | agudos equilibrados - apenas 1.7% longe da mediana
(+) | os máximos são lineares (6% delta da frequência anterior)
Geral 100 - 16.000 Hz
(±) | a linearidade do som geral é média (19.6% diferença em relação à mediana)
Comparado com a mesma classe
» 61% de todos os dispositivos testados nesta classe foram melhores, 6% semelhantes, 32% piores
» O melhor teve um delta de 5%, a média foi 18%, o pior foi 53%
Comparado com todos os dispositivos testados
» 49% de todos os dispositivos testados foram melhores, 7% semelhantes, 44% piores
» O melhor teve um delta de 4%, a média foi 24%, o pior foi 134%
Apple MacBook 12 (Early 2016) 1.1 GHz análise de áudio
(+) | os alto-falantes podem tocar relativamente alto (###valor### dB)
Graves 100 - 315Hz
(±) | graves reduzidos - em média 11.3% menor que a mediana
(±) | a linearidade dos graves é média (14.2% delta para a frequência anterior)
Médios 400 - 2.000 Hz
(+) | médios equilibrados - apenas 2.4% longe da mediana
(+) | médios são lineares (5.5% delta para frequência anterior)
Altos 2 - 16 kHz
(+) | agudos equilibrados - apenas 2% longe da mediana
(+) | os máximos são lineares (4.5% delta da frequência anterior)
Geral 100 - 16.000 Hz
(+) | o som geral é linear (10.2% diferença em relação à mediana)
Comparado com a mesma classe
» 7% de todos os dispositivos testados nesta classe foram melhores, 2% semelhantes, 91% piores
» O melhor teve um delta de 5%, a média foi 18%, o pior foi 53%
Comparado com todos os dispositivos testados
» 5% de todos os dispositivos testados foram melhores, 1% semelhantes, 94% piores
» O melhor teve um delta de 4%, a média foi 24%, o pior foi 134%
| desligado | |
| Ocioso | |
| Carga |
|
Key:
min: | |
| Lenovo Ideapad 510S-13ISK 6200U, HD Graphics 520 | Lenovo IdeaPad 500S-13ISK 6200U, HD Graphics 520 | Asus X302UV-FN016T 6200U, GeForce 920MX | Acer Aspire V3-372-57CW 6267U, Iris Graphics 550 | HP Envy 13-d020ng 6200U, HD Graphics 520 | Asus Zenbook UX303UA-R4051T 6500U, HD Graphics 520 | Apple MacBook Air 13 inch 2015-03 5650U, HD Graphics 6000 | |
|---|---|---|---|---|---|---|---|
| Power Consumption | 10% | 16% | -5% | -2% | 14% | 18% | |
| Idle Minimum * (Watt) | 5 | 5.2 -4% | 3.3 34% | 3.4 32% | 4.2 16% | 3.5 30% | 2.7 46% |
| Idle Average * (Watt) | 7.2 | 6.9 4% | 5.1 29% | 6.5 10% | 7.4 -3% | 7.3 -1% | 5.7 21% |
| Idle Maximum * (Watt) | 8.7 | 7.2 17% | 5.2 40% | 7 20% | 10.1 -16% | 7.9 9% | 6 31% |
| Load Average * (Watt) | 32 | 26.7 17% | 29.5 8% | 44.5 -39% | 33.4 -4% | 26.6 17% | 32.1 -0% |
| Load Maximum * (Watt) | 33 | 28.2 15% | 44 -33% | 49.5 -50% | 34.7 -5% | 28 15% | 36.2 -10% |
* ... menor é melhor
| Lenovo Ideapad 510S-13ISK 35 Wh | Lenovo IdeaPad 500S-13ISK 35 Wh | Asus X302UV-FN016T 38 Wh | Acer Aspire V3-372-57CW 51 Wh | HP Envy 13-d020ng 45 Wh | Asus Zenbook UX303UA-R4051T 50 Wh | Apple MacBook Air 13 inch 2015-03 54 Wh | |
|---|---|---|---|---|---|---|---|
| Duração da bateria | -5% | 10% | 72% | 8% | 15% | 86% | |
| Reader / Idle (h) | 9.3 | 10.3 11% | 17.3 86% | 26.2 182% | |||
| H.264 (h) | 5.4 | 5.2 -4% | |||||
| WiFi v1.3 (h) | 5.9 | 5 -15% | 6.5 10% | 6.9 17% | 6.4 8% | 6.8 15% | 10.3 75% |
| Load (h) | 1.6 | 1.4 -13% | 3.4 113% | 1.6 0% |
Pro
Contra
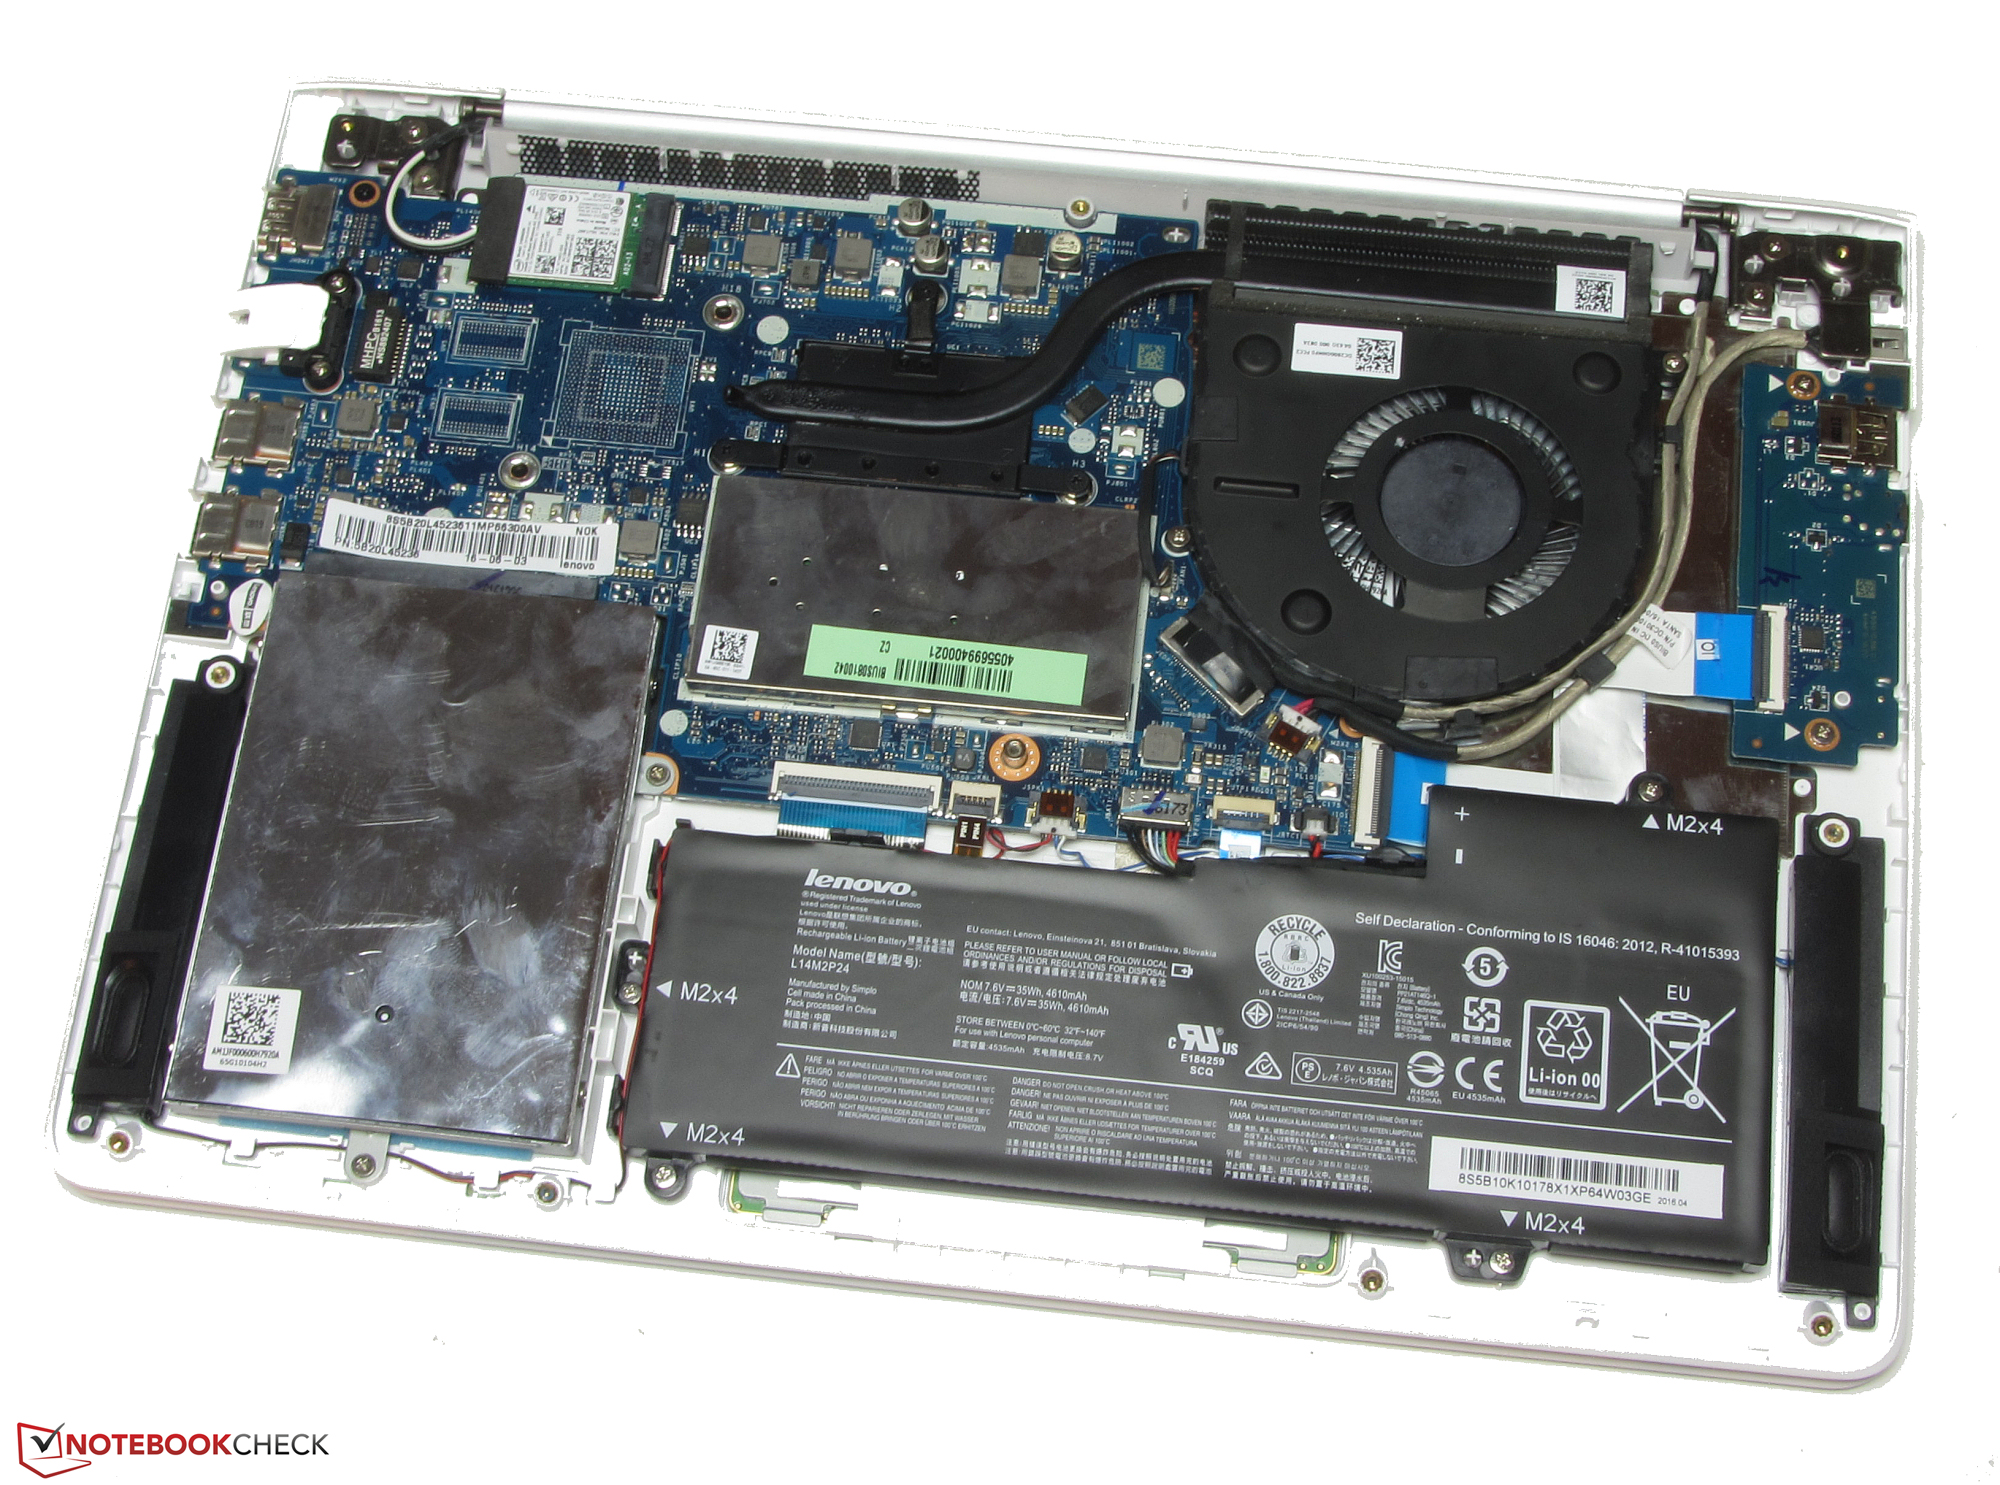
O Lenovo IdeaPad 510S-13ISK de 13,3 polegadas oferece suficiente desempenho para o uso diário. O portátil não esquenta muito ou produz muito ruído. Graças ao HD tradicional, o usuário tem 1 TB de espaço de armazenamento. Também é possível trocar o HDD por um SSD mais veloz. O usuário deve remover a parte inferior do portátil para este procedimento, mas isto não deve ser difícil. O teclado é bom para os escritores, dado que fornece teclas iluminadas. A duração da bateria é relativamente longa, porém, como os outros modelos de 13,3-polegadas mostram, é possível oferecer mais. A tela IPS Full HD pode não ser excepcional, mas faz bem o seu trabalho.
O IdeaPad é um portátil ideal para estudantes. No entanto, sua duração de bateria deveria ser mais longa.
Se você puder viver com uma duração de bateria média, então o modelo 80SJ0019GE é uma boa opção. Por 599 Euros (~$669), o usuário recebe uma CPU Core i3-6100U, um SSD de 128 GB e uma tela FHD. O IdeaPad 500S-13ISK está disponível por 550 Euros (~$614) sem um SSD, mas com um HD.
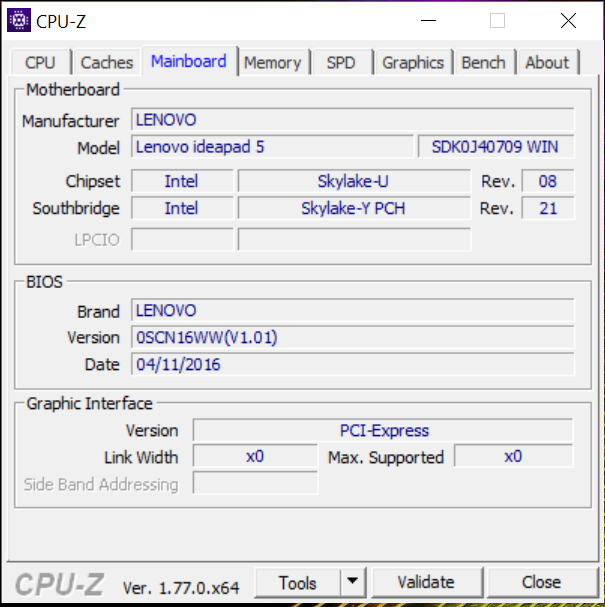
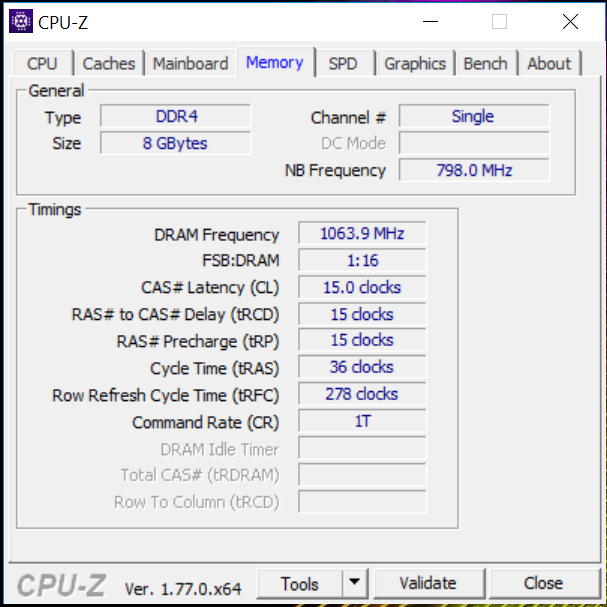
Lenovo Ideapad 510S-13ISK
- 12/05/2016 v6 (old)
Sascha Mölck