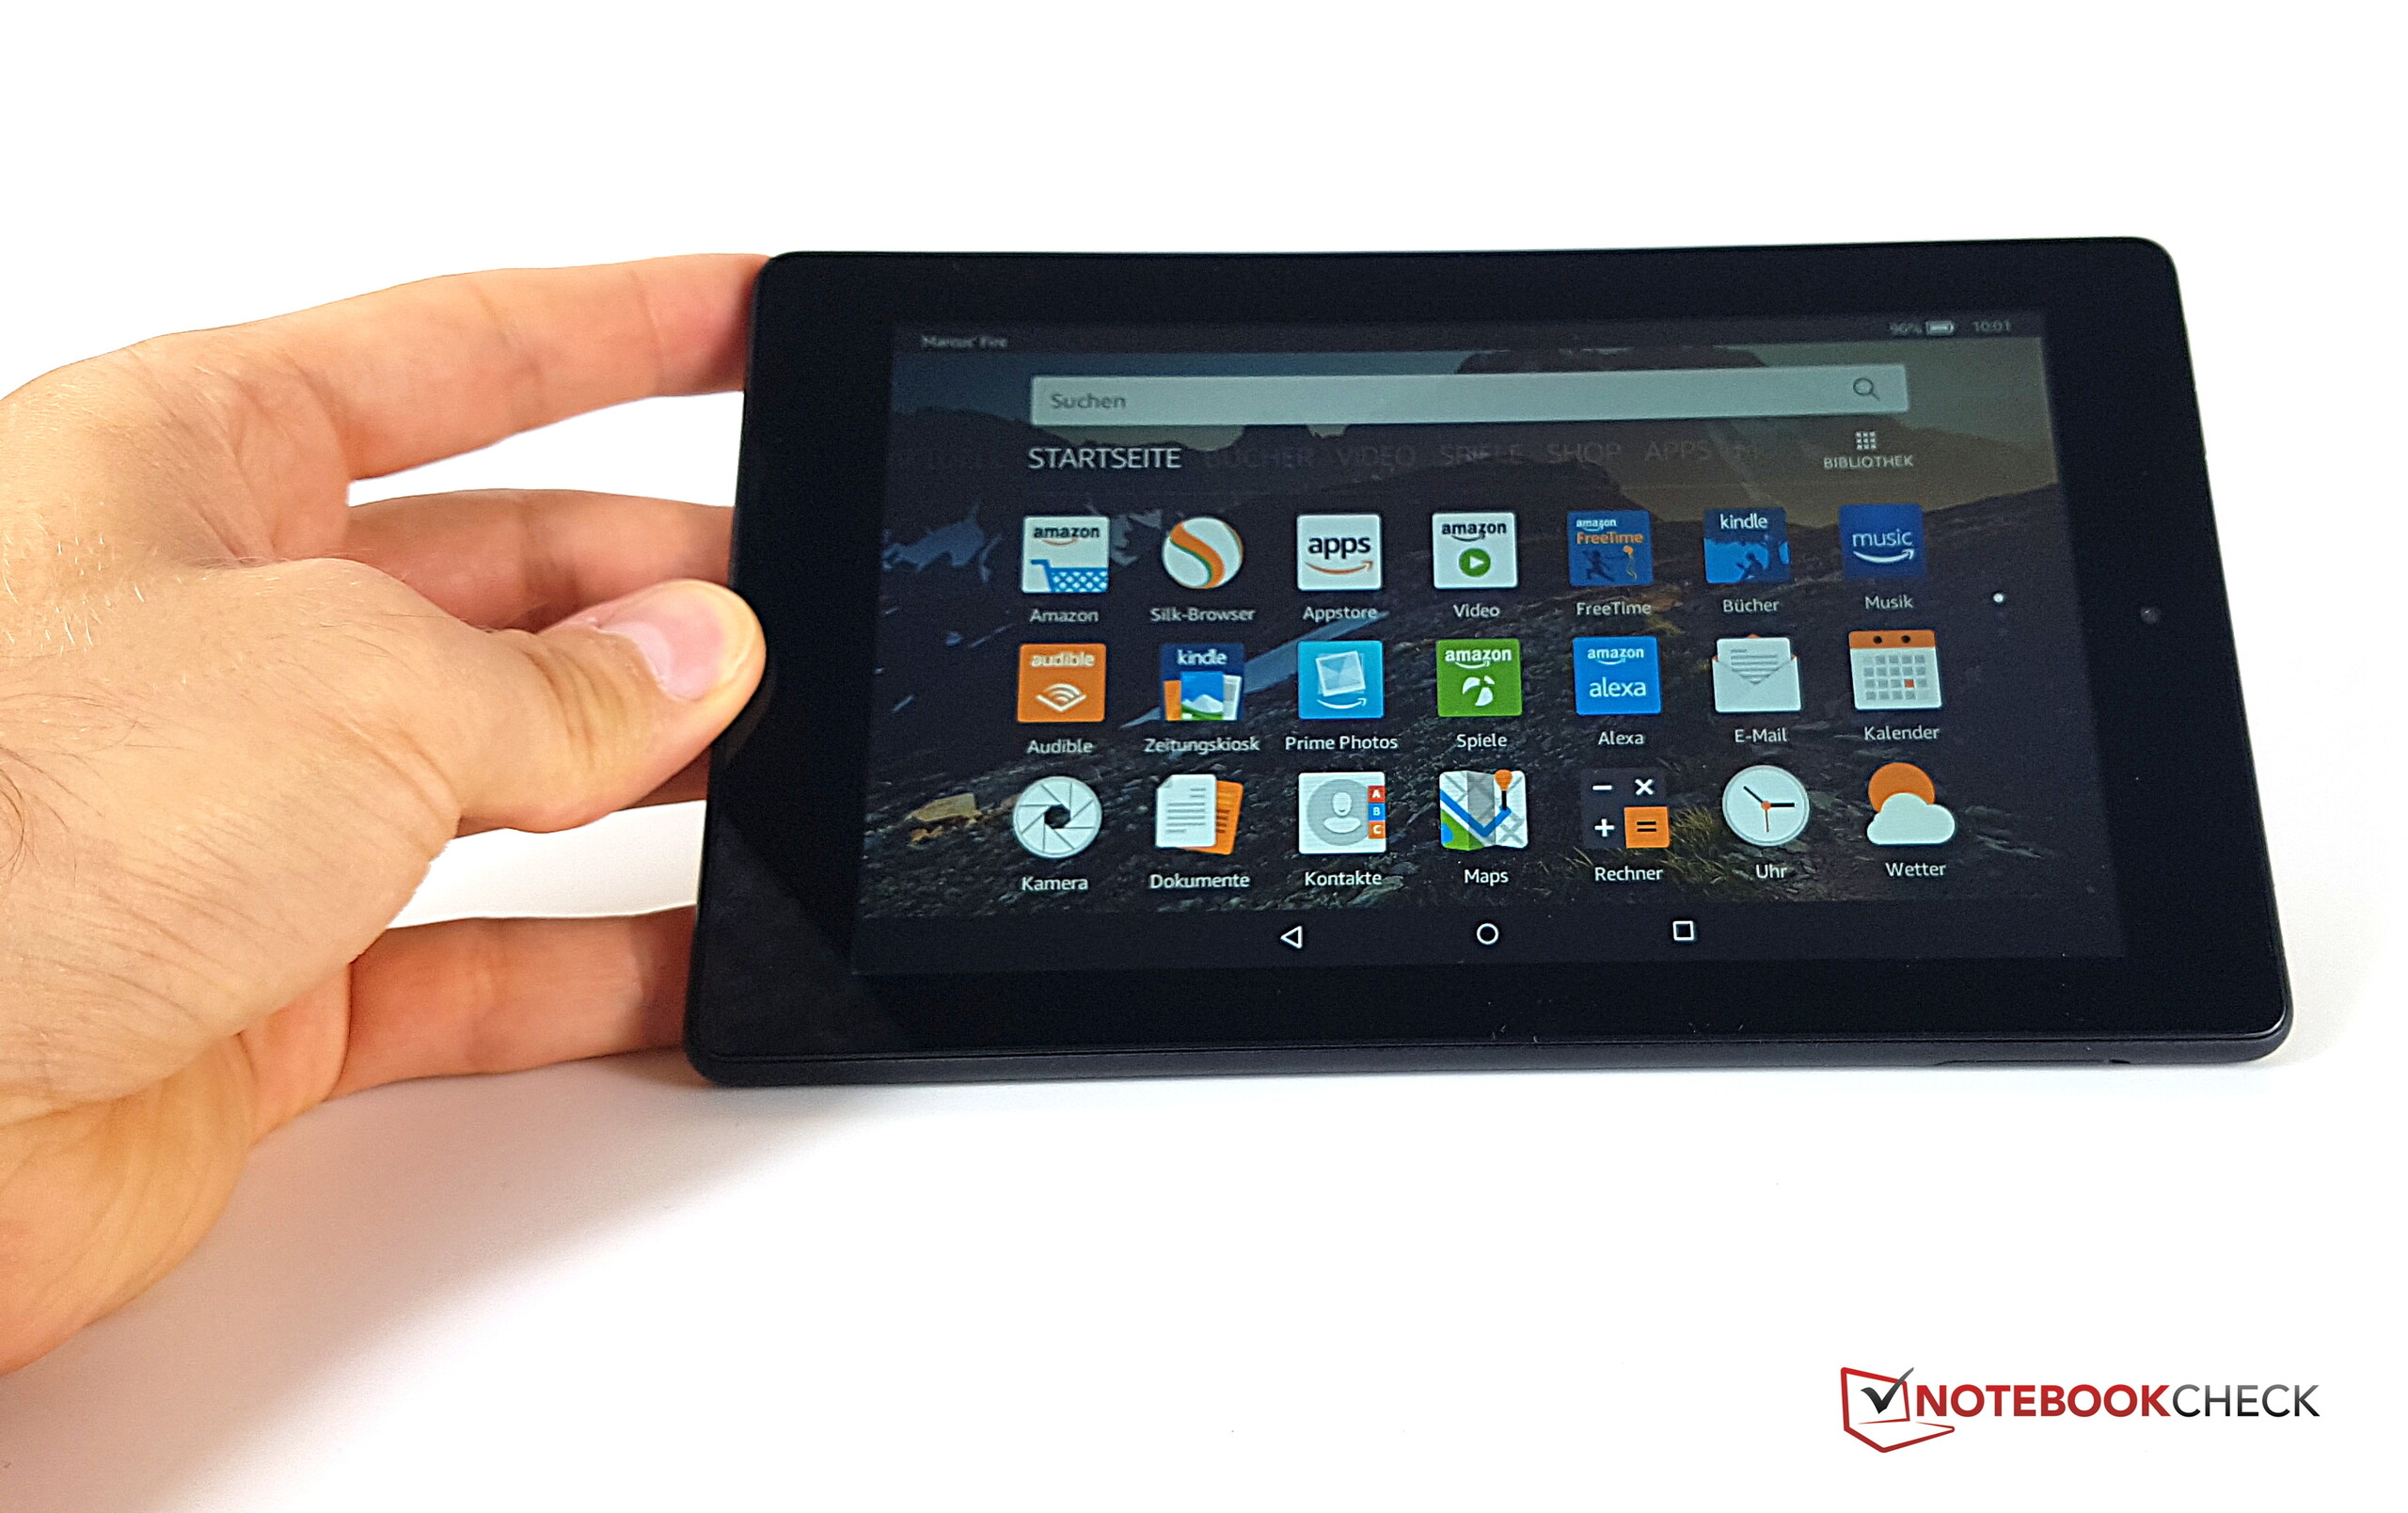
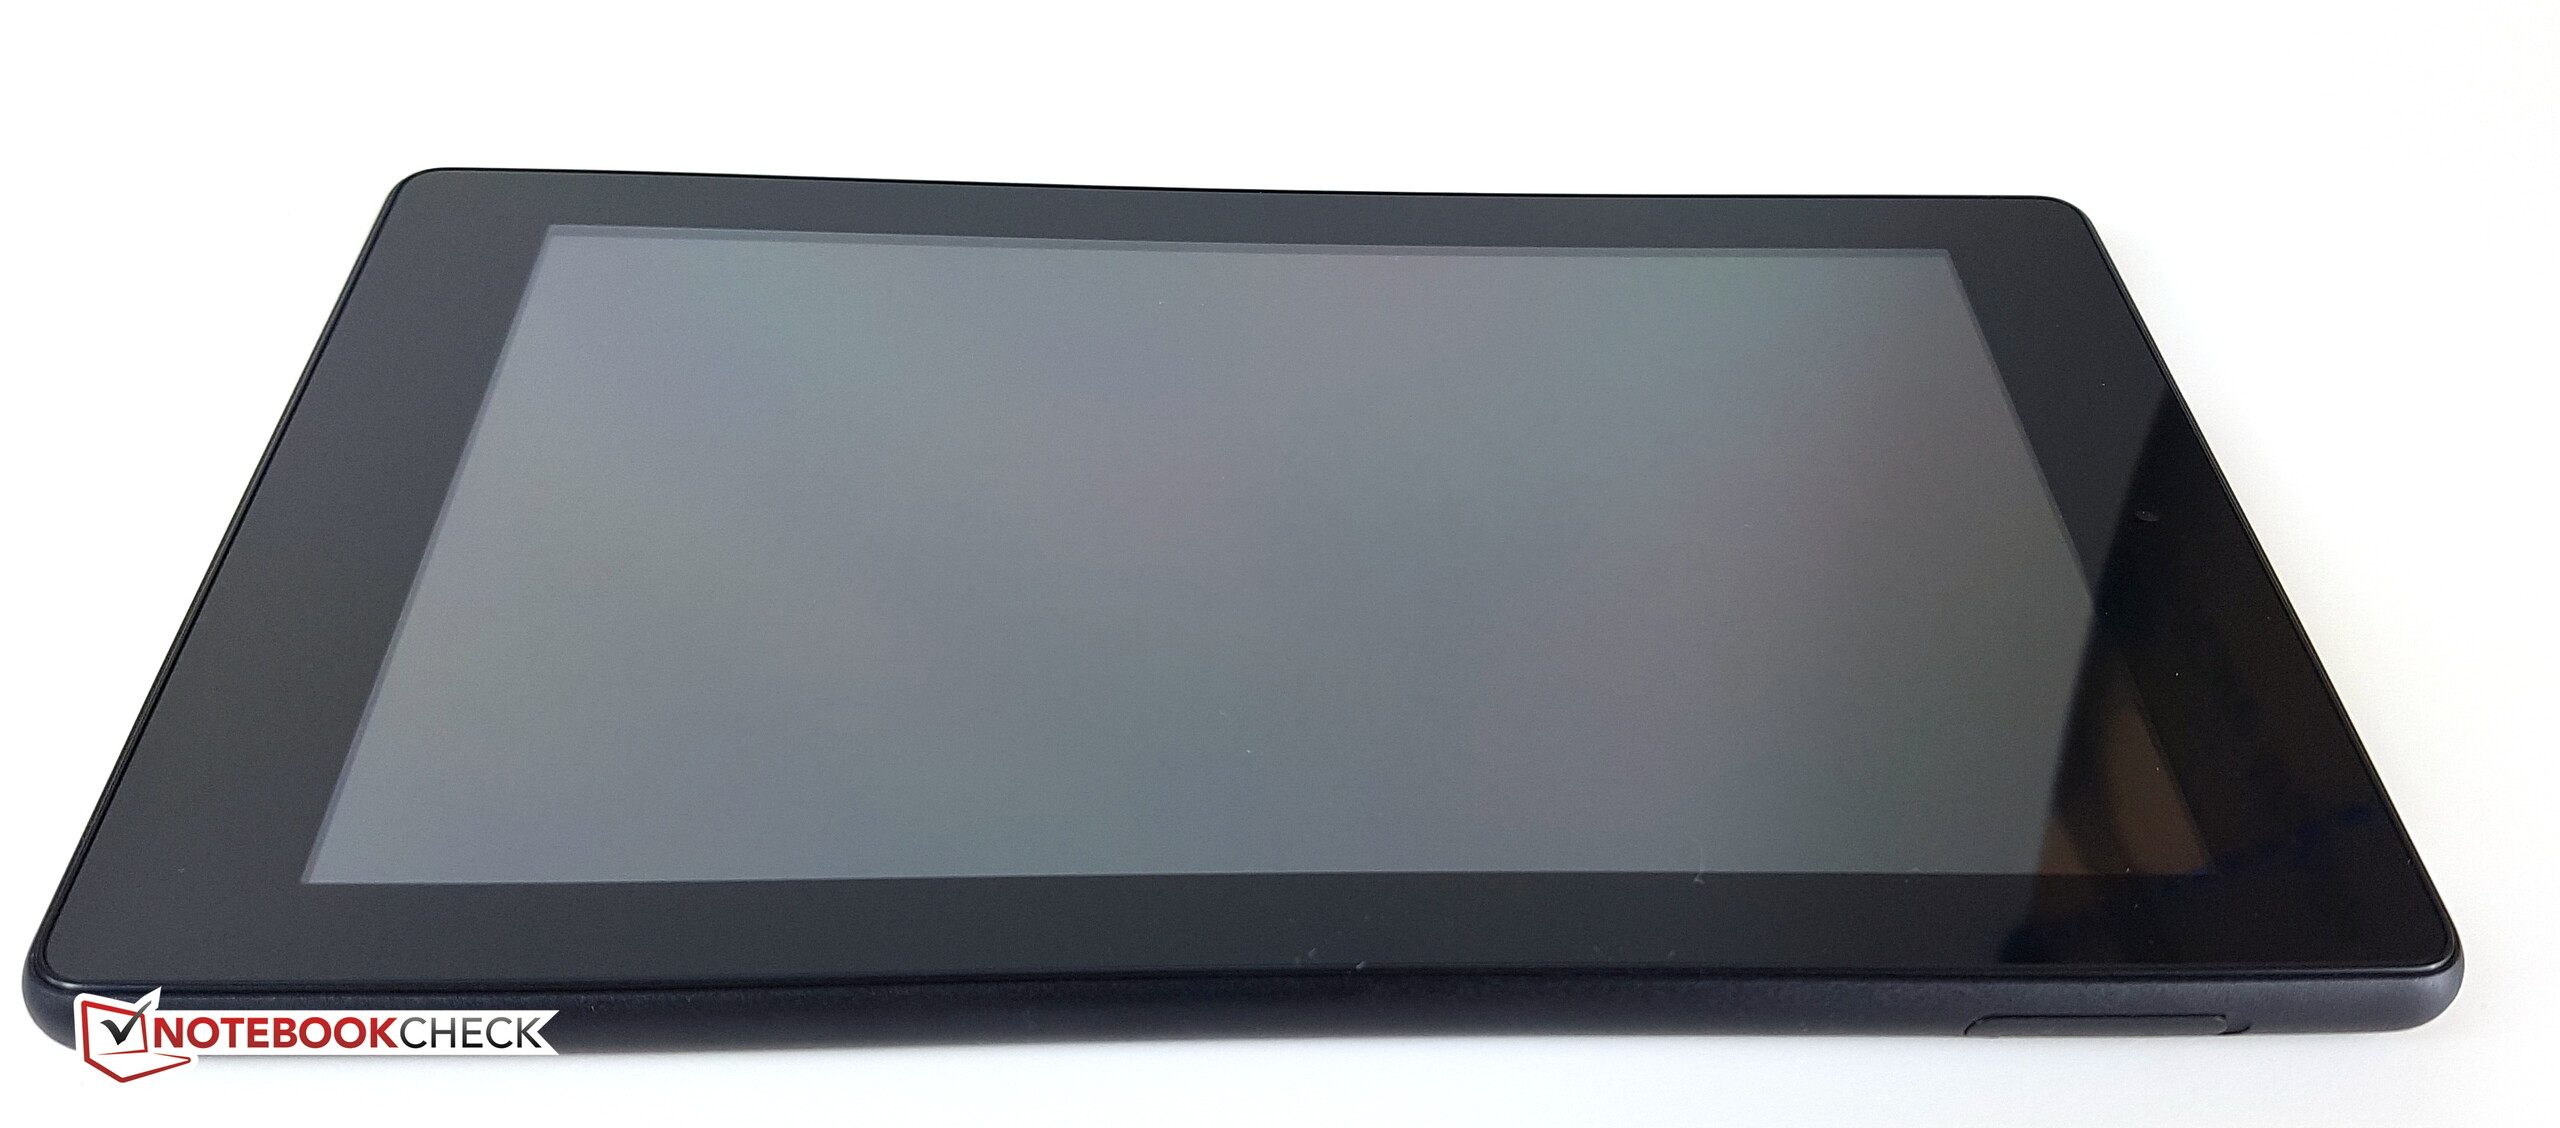
Breve Análise do Tablet Amazon Fire 7 (2017)
| Networking | |
| iperf3 transmit AX12 | |
| Samsung Galaxy Tab S3 SM-T825 | |
| Amazon Fire 7 2017 | |
| Amazon Fire Tablet | |
| iperf3 receive AX12 | |
| Samsung Galaxy Tab S3 SM-T825 | |
| Amazon Fire 7 2017 | |
| Amazon Fire Tablet | |

| |||||||||||||||||||||||||
iluminação: 88 %
iluminação com acumulador: 328 cd/m²
Contraste: 937:1 (Preto: 0.35 cd/m²)
ΔE ColorChecker Calman: 4.6 | ∀{0.5-29.43 Ø4.71}
ΔE Greyscale Calman: 3.8 | ∀{0.09-98 Ø4.96}
Gamma: 2.25
CCT: 7338 K
| Amazon Fire 7 2017 IPS, 1024x600, 7" | Amazon Fire Tablet IPS, 1024x600, 7" | Acer Iconia One 8 IPS, 1280x800, 8" | Samsung Galaxy Tab A7 2016 IPS, 1280x800, 7" | Xiaomi MiPad 2 IPS, 2048x1536, 7.9" | Samsung Galaxy Tab S3 SM-T825 Super AMOLED, 2048x1526, 9.7" | |
|---|---|---|---|---|---|---|
| Screen | -30% | 6% | -4% | 9% | 46% | |
| Brightness middle (cd/m²) | 328 | 323 -2% | 367 12% | 358 9% | 425 30% | 452 38% |
| Brightness (cd/m²) | 337 | 299 -11% | 338 0% | 344 2% | 402 19% | 468 39% |
| Brightness Distribution (%) | 88 | 83 -6% | 83 -6% | 92 5% | 91 3% | 82 -7% |
| Black Level * (cd/m²) | 0.35 | 0.38 -9% | 0.31 11% | 0.37 -6% | 0.4 -14% | |
| Contrast (:1) | 937 | 850 -9% | 1184 26% | 968 3% | 1063 13% | |
| Colorchecker dE 2000 * | 4.6 | 9.3 -102% | 4.1 11% | 5.3 -15% | 4.98 -8% | 1.8 61% |
| Colorchecker dE 2000 max. * | 18.6 | 17.6 5% | 20.2 -9% | 6.61 64% | 4 78% | |
| Greyscale dE 2000 * | 3.8 | 7.8 -105% | 4.38 -15% | 4.7 -24% | 5.2 -37% | 1.2 68% |
| Gamma | 2.25 98% | 1.99 111% | 2.33 94% | 2.44 90% | 2.65 83% | 2.11 104% |
| CCT | 7338 89% | 7736 84% | 6394 102% | 7222 90% | 7249 90% | 6500 100% |
| Color Space (Percent of AdobeRGB 1998) (%) | 82.32 | |||||
| Color Space (Percent of sRGB) (%) | 99.06 |
* ... menor é melhor
Cintilação da tela / PWM (modulação por largura de pulso)
| Tela tremeluzindo/PWM detectado | 12500 Hz | ≤ 17 % configuração de brilho | 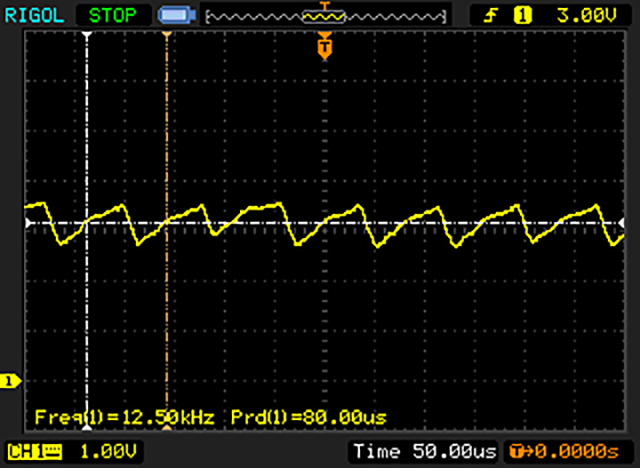 |
A luz de fundo da tela pisca em 12500 Hz (pior caso, por exemplo, utilizando PWM) Cintilação detectada em uma configuração de brilho de 17 % e abaixo. Não deve haver cintilação ou PWM acima desta configuração de brilho. A frequência de 12500 Hz é bastante alta, então a maioria dos usuários sensíveis ao PWM não deve notar nenhuma oscilação. [pwm_comparison] Em comparação: 52 % de todos os dispositivos testados não usam PWM para escurecer a tela. Se PWM foi detectado, uma média de 7741 (mínimo: 5 - máximo: 343500) Hz foi medida. | |||
Exibir tempos de resposta
| ↔ Tempo de resposta preto para branco | ||
|---|---|---|
| 28.4 ms ... ascensão ↗ e queda ↘ combinadas | ↗ 16 ms ascensão | 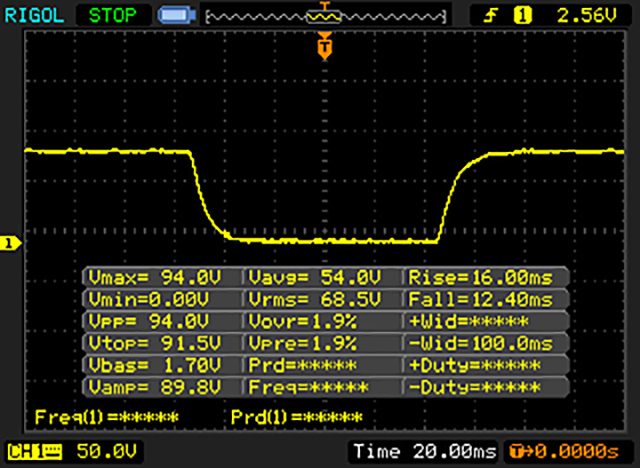 |
| ↘ 12.4 ms queda | ||
| A tela mostra taxas de resposta relativamente lentas em nossos testes e pode ser muito lenta para os jogadores. Em comparação, todos os dispositivos testados variam de 0.1 (mínimo) a 240 (máximo) ms. » 75 % de todos os dispositivos são melhores. Isso significa que o tempo de resposta medido é pior que a média de todos os dispositivos testados (19.8 ms). | ||
| ↔ Tempo de resposta 50% cinza a 80% cinza | ||
| 39.2 ms ... ascensão ↗ e queda ↘ combinadas | ↗ 20.4 ms ascensão | 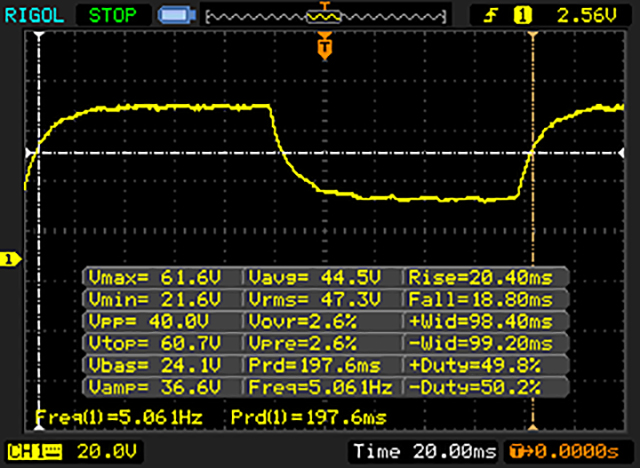 |
| ↘ 18.8 ms queda | ||
| A tela mostra taxas de resposta lentas em nossos testes e será insatisfatória para os jogadores. Em comparação, todos os dispositivos testados variam de 0.165 (mínimo) a 636 (máximo) ms. » 60 % de todos os dispositivos são melhores. Isso significa que o tempo de resposta medido é pior que a média de todos os dispositivos testados (30.9 ms). | ||
| AnTuTu v6 - Total Score | |
| Samsung Galaxy Tab S3 SM-T825 | |
| Xiaomi MiPad 2 | |
| Amazon Fire 7 2017 | |
| Amazon Fire Tablet | |
| Samsung Galaxy Tab A7 2016 | |
| PCMark for Android | |
| Work performance score | |
| Samsung Galaxy Tab S3 SM-T825 | |
| Xiaomi MiPad 2 | |
| Acer Iconia One 8 | |
| Amazon Fire 7 2017 | |
| Amazon Fire Tablet | |
| Samsung Galaxy Tab A7 2016 | |
| Work 2.0 performance score | |
| Samsung Galaxy Tab S3 SM-T825 | |
| Amazon Fire 7 2017 | |
| Geekbench 4.4 | |
| 64 Bit Single-Core Score | |
| Samsung Galaxy Tab S3 SM-T825 | |
| Amazon Fire 7 2017 | |
| 64 Bit Multi-Core Score | |
| Samsung Galaxy Tab S3 SM-T825 | |
| Amazon Fire 7 2017 | |
| Compute RenderScript Score | |
| Samsung Galaxy Tab S3 SM-T825 | |
| GFXBench (DX / GLBenchmark) 2.7 | |
| T-Rex Onscreen | |
| Samsung Galaxy Tab S3 SM-T825 | |
| Acer Iconia One 8 | |
| Amazon Fire Tablet | |
| Xiaomi MiPad 2 | |
| Amazon Fire 7 2017 | |
| Samsung Galaxy Tab A7 2016 | |
| 1920x1080 T-Rex Offscreen | |
| Samsung Galaxy Tab S3 SM-T825 | |
| Xiaomi MiPad 2 | |
| Amazon Fire Tablet | |
| Amazon Fire 7 2017 | |
| Acer Iconia One 8 | |
| Samsung Galaxy Tab A7 2016 | |
| Octane V2 - Total Score | |
| Samsung Galaxy Tab S3 SM-T825 | |
| Xiaomi MiPad 2 | |
| Acer Iconia One 8 | |
| Amazon Fire Tablet | |
| Samsung Galaxy Tab A7 2016 | |
| Amazon Fire 7 2017 | |
| WebXPRT 2015 - Overall | |
| Samsung Galaxy Tab S3 SM-T825 | |
| Acer Iconia One 8 | |
| Samsung Galaxy Tab A7 2016 | |
| Amazon Fire 7 2017 | |
| JetStream 1.1 - 1.1 Total | |
| Xiaomi MiPad 2 | |
| Samsung Galaxy Tab S3 SM-T825 | |
| Samsung Galaxy Tab A7 2016 | |
| Amazon Fire Tablet | |
| Amazon Fire 7 2017 | |
| Mozilla Kraken 1.1 - Total | |
| Amazon Fire 7 2017 | |
| Samsung Galaxy Tab A7 2016 | |
| Amazon Fire Tablet | |
| Acer Iconia One 8 | |
| Xiaomi MiPad 2 | |
| Samsung Galaxy Tab S3 SM-T825 | |
* ... menor é melhor
| Amazon Fire 7 2017 | Amazon Fire Tablet | Acer Iconia One 8 | Samsung Galaxy Tab A7 2016 | Xiaomi MiPad 2 | Samsung Galaxy Tab S3 SM-T825 | |
|---|---|---|---|---|---|---|
| AndroBench 3-5 | 22% | -12% | -14% | 60% | 120% | |
| Sequential Read 256KB (MB/s) | 113.7 | 147 29% | 126 11% | 65.9 -42% | 147.9 30% | 288.6 154% |
| Sequential Write 256KB (MB/s) | 34.1 | 37 9% | 40 17% | 28.95 -15% | 56.4 65% | 87.6 157% |
| Random Read 4KB (MB/s) | 21.97 | 22 0% | 17 -23% | 21.95 0% | 24.42 11% | 45.82 109% |
| Random Write 4KB (MB/s) | 6.03 | 11 82% | 2.9 -52% | 9.55 58% | 13.96 132% | 13.13 118% |
| Sequential Read 256KB SDCard (MB/s) | 45.54 | 49.4 8% | 21.41 -53% | 76.4 68% | ||
| Sequential Write 256KB SDCard (MB/s) | 27.74 | 29.19 5% | 18.4 -34% | 58.6 111% |
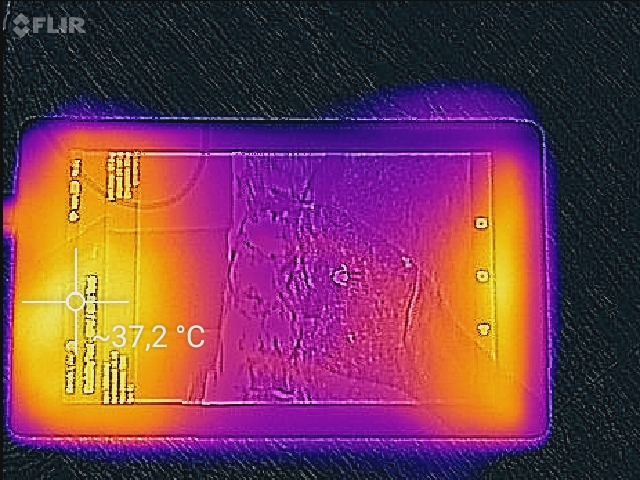
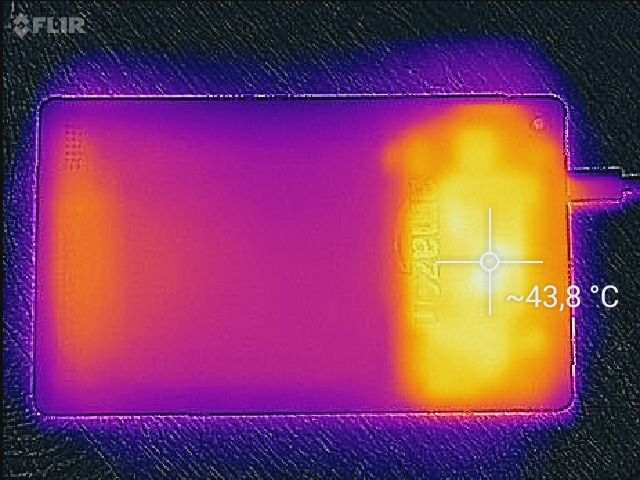
(+) A temperatura máxima no lado superior é 39.3 °C / 103 F, em comparação com a média de 33.7 °C / 93 F , variando de 20.7 a 53.2 °C para a classe Tablet.
(±) A parte inferior aquece até um máximo de 43.3 °C / 110 F, em comparação com a média de 33.2 °C / 92 F
(+) Em uso inativo, a temperatura média para o lado superior é 30.6 °C / 87 F, em comparação com a média do dispositivo de 30 °C / ### class_avg_f### F.
Amazon Fire 7 2017 análise de áudio
(±) | o volume do alto-falante é médio, mas bom (###valor### dB)
Graves 100 - 315Hz
(-) | quase nenhum baixo - em média 24.7% menor que a mediana
(±) | a linearidade dos graves é média (12.1% delta para a frequência anterior)
Médios 400 - 2.000 Hz
(±) | médios mais altos - em média 8.1% maior que a mediana
(±) | a linearidade dos médios é média (9.3% delta para frequência anterior)
Altos 2 - 16 kHz
(±) | máximos mais altos - em média 5.7% maior que a mediana
(+) | os máximos são lineares (4.5% delta da frequência anterior)
Geral 100 - 16.000 Hz
(±) | a linearidade do som geral é média (27.3% diferença em relação à mediana)
Comparado com a mesma classe
» 84% de todos os dispositivos testados nesta classe foram melhores, 4% semelhantes, 11% piores
» O melhor teve um delta de 7%, a média foi 20%, o pior foi 129%
Comparado com todos os dispositivos testados
» 83% de todos os dispositivos testados foram melhores, 4% semelhantes, 13% piores
» O melhor teve um delta de 4%, a média foi 23%, o pior foi 134%
Samsung Galaxy Tab A7 2016 análise de áudio
(+) | os alto-falantes podem tocar relativamente alto (###valor### dB)
Graves 100 - 315Hz
(-) | quase nenhum baixo - em média 35.9% menor que a mediana
(±) | a linearidade dos graves é média (10.6% delta para a frequência anterior)
Médios 400 - 2.000 Hz
(+) | médios equilibrados - apenas 4.6% longe da mediana
(+) | médios são lineares (5.2% delta para frequência anterior)
Altos 2 - 16 kHz
(+) | agudos equilibrados - apenas 3.9% longe da mediana
(+) | os máximos são lineares (6.4% delta da frequência anterior)
Geral 100 - 16.000 Hz
(±) | a linearidade do som geral é média (23.9% diferença em relação à mediana)
Comparado com a mesma classe
» 75% de todos os dispositivos testados nesta classe foram melhores, 6% semelhantes, 19% piores
» O melhor teve um delta de 7%, a média foi 20%, o pior foi 129%
Comparado com todos os dispositivos testados
» 72% de todos os dispositivos testados foram melhores, 6% semelhantes, 22% piores
» O melhor teve um delta de 4%, a média foi 23%, o pior foi 134%
Xiaomi MiPad 2 análise de áudio
(+) | os alto-falantes podem tocar relativamente alto (###valor### dB)
Graves 100 - 315Hz
(-) | quase nenhum baixo - em média 26.3% menor que a mediana
(+) | o baixo é linear (5.4% delta para a frequência anterior)
Médios 400 - 2.000 Hz
(±) | médios reduzidos - em média 5% menor que a mediana
(+) | médios são lineares (4.2% delta para frequência anterior)
Altos 2 - 16 kHz
(+) | agudos equilibrados - apenas 3.9% longe da mediana
(+) | os máximos são lineares (1.8% delta da frequência anterior)
Geral 100 - 16.000 Hz
(±) | a linearidade do som geral é média (17.9% diferença em relação à mediana)
Comparado com a mesma classe
» 45% de todos os dispositivos testados nesta classe foram melhores, 6% semelhantes, 48% piores
» O melhor teve um delta de 7%, a média foi 20%, o pior foi 129%
Comparado com todos os dispositivos testados
» 37% de todos os dispositivos testados foram melhores, 8% semelhantes, 55% piores
» O melhor teve um delta de 4%, a média foi 23%, o pior foi 134%
| desligado | |
| Ocioso | |
| Carga |
|
Key:
min: | |
| Amazon Fire 7 2017 2980 mAh | Amazon Fire Tablet 2980 mAh | Acer Iconia One 8 mAh | Samsung Galaxy Tab A7 2016 4000 mAh | Xiaomi MiPad 2 6190 mAh | |
|---|---|---|---|---|---|
| Power Consumption | -13% | -16% | -35% | -124% | |
| Idle Minimum * (Watt) | 0.97 | 1.12 -15% | 0.8 18% | 1.91 -97% | 3.33 -243% |
| Idle Average * (Watt) | 2.68 | 3.06 -14% | 3.1 -16% | 3.59 -34% | 5.01 -87% |
| Idle Maximum * (Watt) | 2.69 | 3.31 -23% | 3.3 -23% | 4.06 -51% | 5.19 -93% |
| Load Average * (Watt) | 4.26 | 4.44 -4% | 5.1 -20% | 4.29 -1% | 8.32 -95% |
| Load Maximum * (Watt) | 4.64 | 5.09 -10% | 6.5 -40% | 4.31 7% | 9.33 -101% |
* ... menor é melhor
| Amazon Fire 7 2017 2980 mAh | Amazon Fire Tablet 2980 mAh | Acer Iconia One 8 mAh | Samsung Galaxy Tab A7 2016 4000 mAh | Xiaomi MiPad 2 6190 mAh | |
|---|---|---|---|---|---|
| Duração da bateria | -17% | 31% | 36% | -19% | |
| Reader / Idle (h) | 15.7 | 21 34% | 22.6 44% | ||
| H.264 (h) | 8.5 | 13.3 56% | 8.6 1% | ||
| WiFi v1.3 (h) | 8.6 | 7.1 -17% | 12.4 44% | 10.3 20% | 7 -19% |
| Load (h) | 3.5 | 3.1 -11% | 6.3 80% |
Pro
Contra
Considerando o baixo preço de apenas $49, o Fire 7 (2017) é uma ótima e bem planejada oferta. Teríamos preferido ver uma atualização mais significativa, mas, infelizmente, o SoC lento e o armazenamento interno, a tela de baixa resolução e apenas 1 GB de RAM ainda estão conosco. Assim, apesar do fato de que a duração da bateria e a precisão das cores foram melhoradas, o desempenho geral do sistema do tablet ainda é bastante pobre.
A pergunta sobre na mente de todos é: para que serve o tablet Fire 7 (2017)? A tela de 170 ppp de baixa resolução certamente não é feita para extensas sessões de leitura. A falta de potência para executar jogos sem problemas ou mesmo simplesmente navegar na web. Assistir filmes teria sido muito mais agradável, se não fosse pelo único alto-falante traseiro de baixa qualidade. Obviamente, tudo sobre essa lista pode ser feito com o Fire 7 (2017), mas requer alguns compromissos sérios.
O mais recente Tablet Fire 7 da Amazon será mais uma vez suficiente para os usuários mais modestos. Infelizmente, a Amazon não conseguiu atualizar o hardware do tablet. Assim, o ponto de venda mais convincente do Fire 7 (2017) continua sendo seu baixo preço.
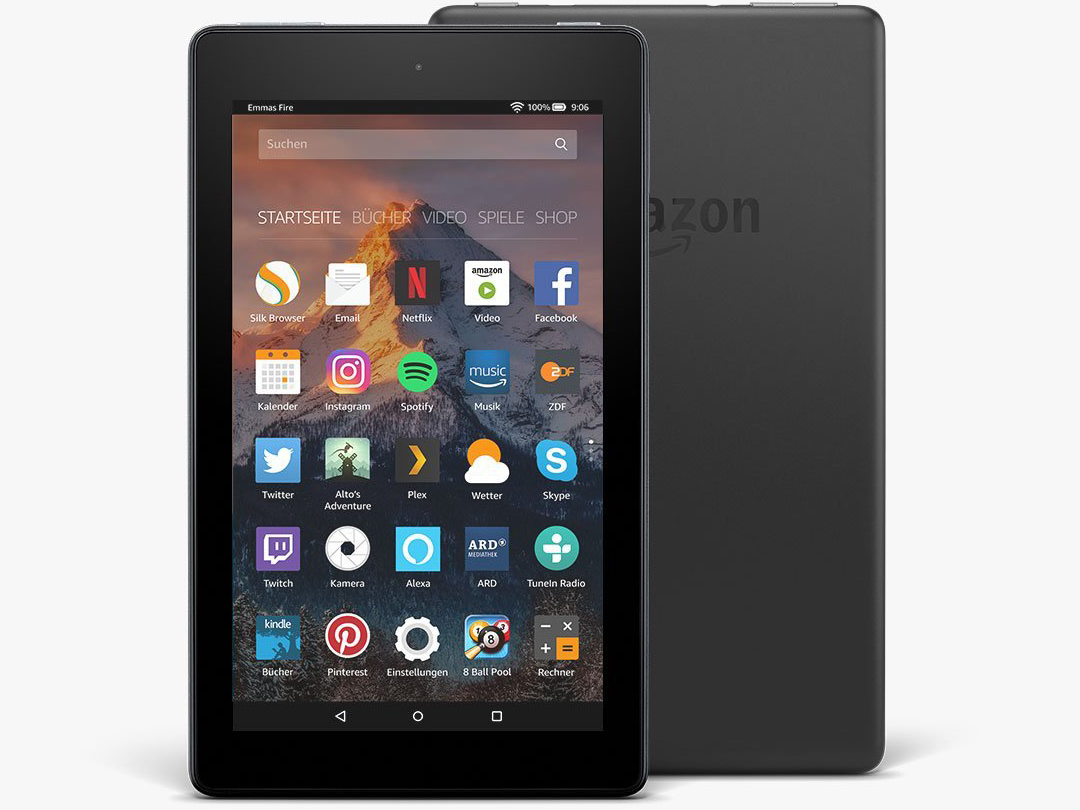
Amazon Fire 7 2017
- 07/10/2017 v6 (old)
Marcus Herbrich
Price comparison
