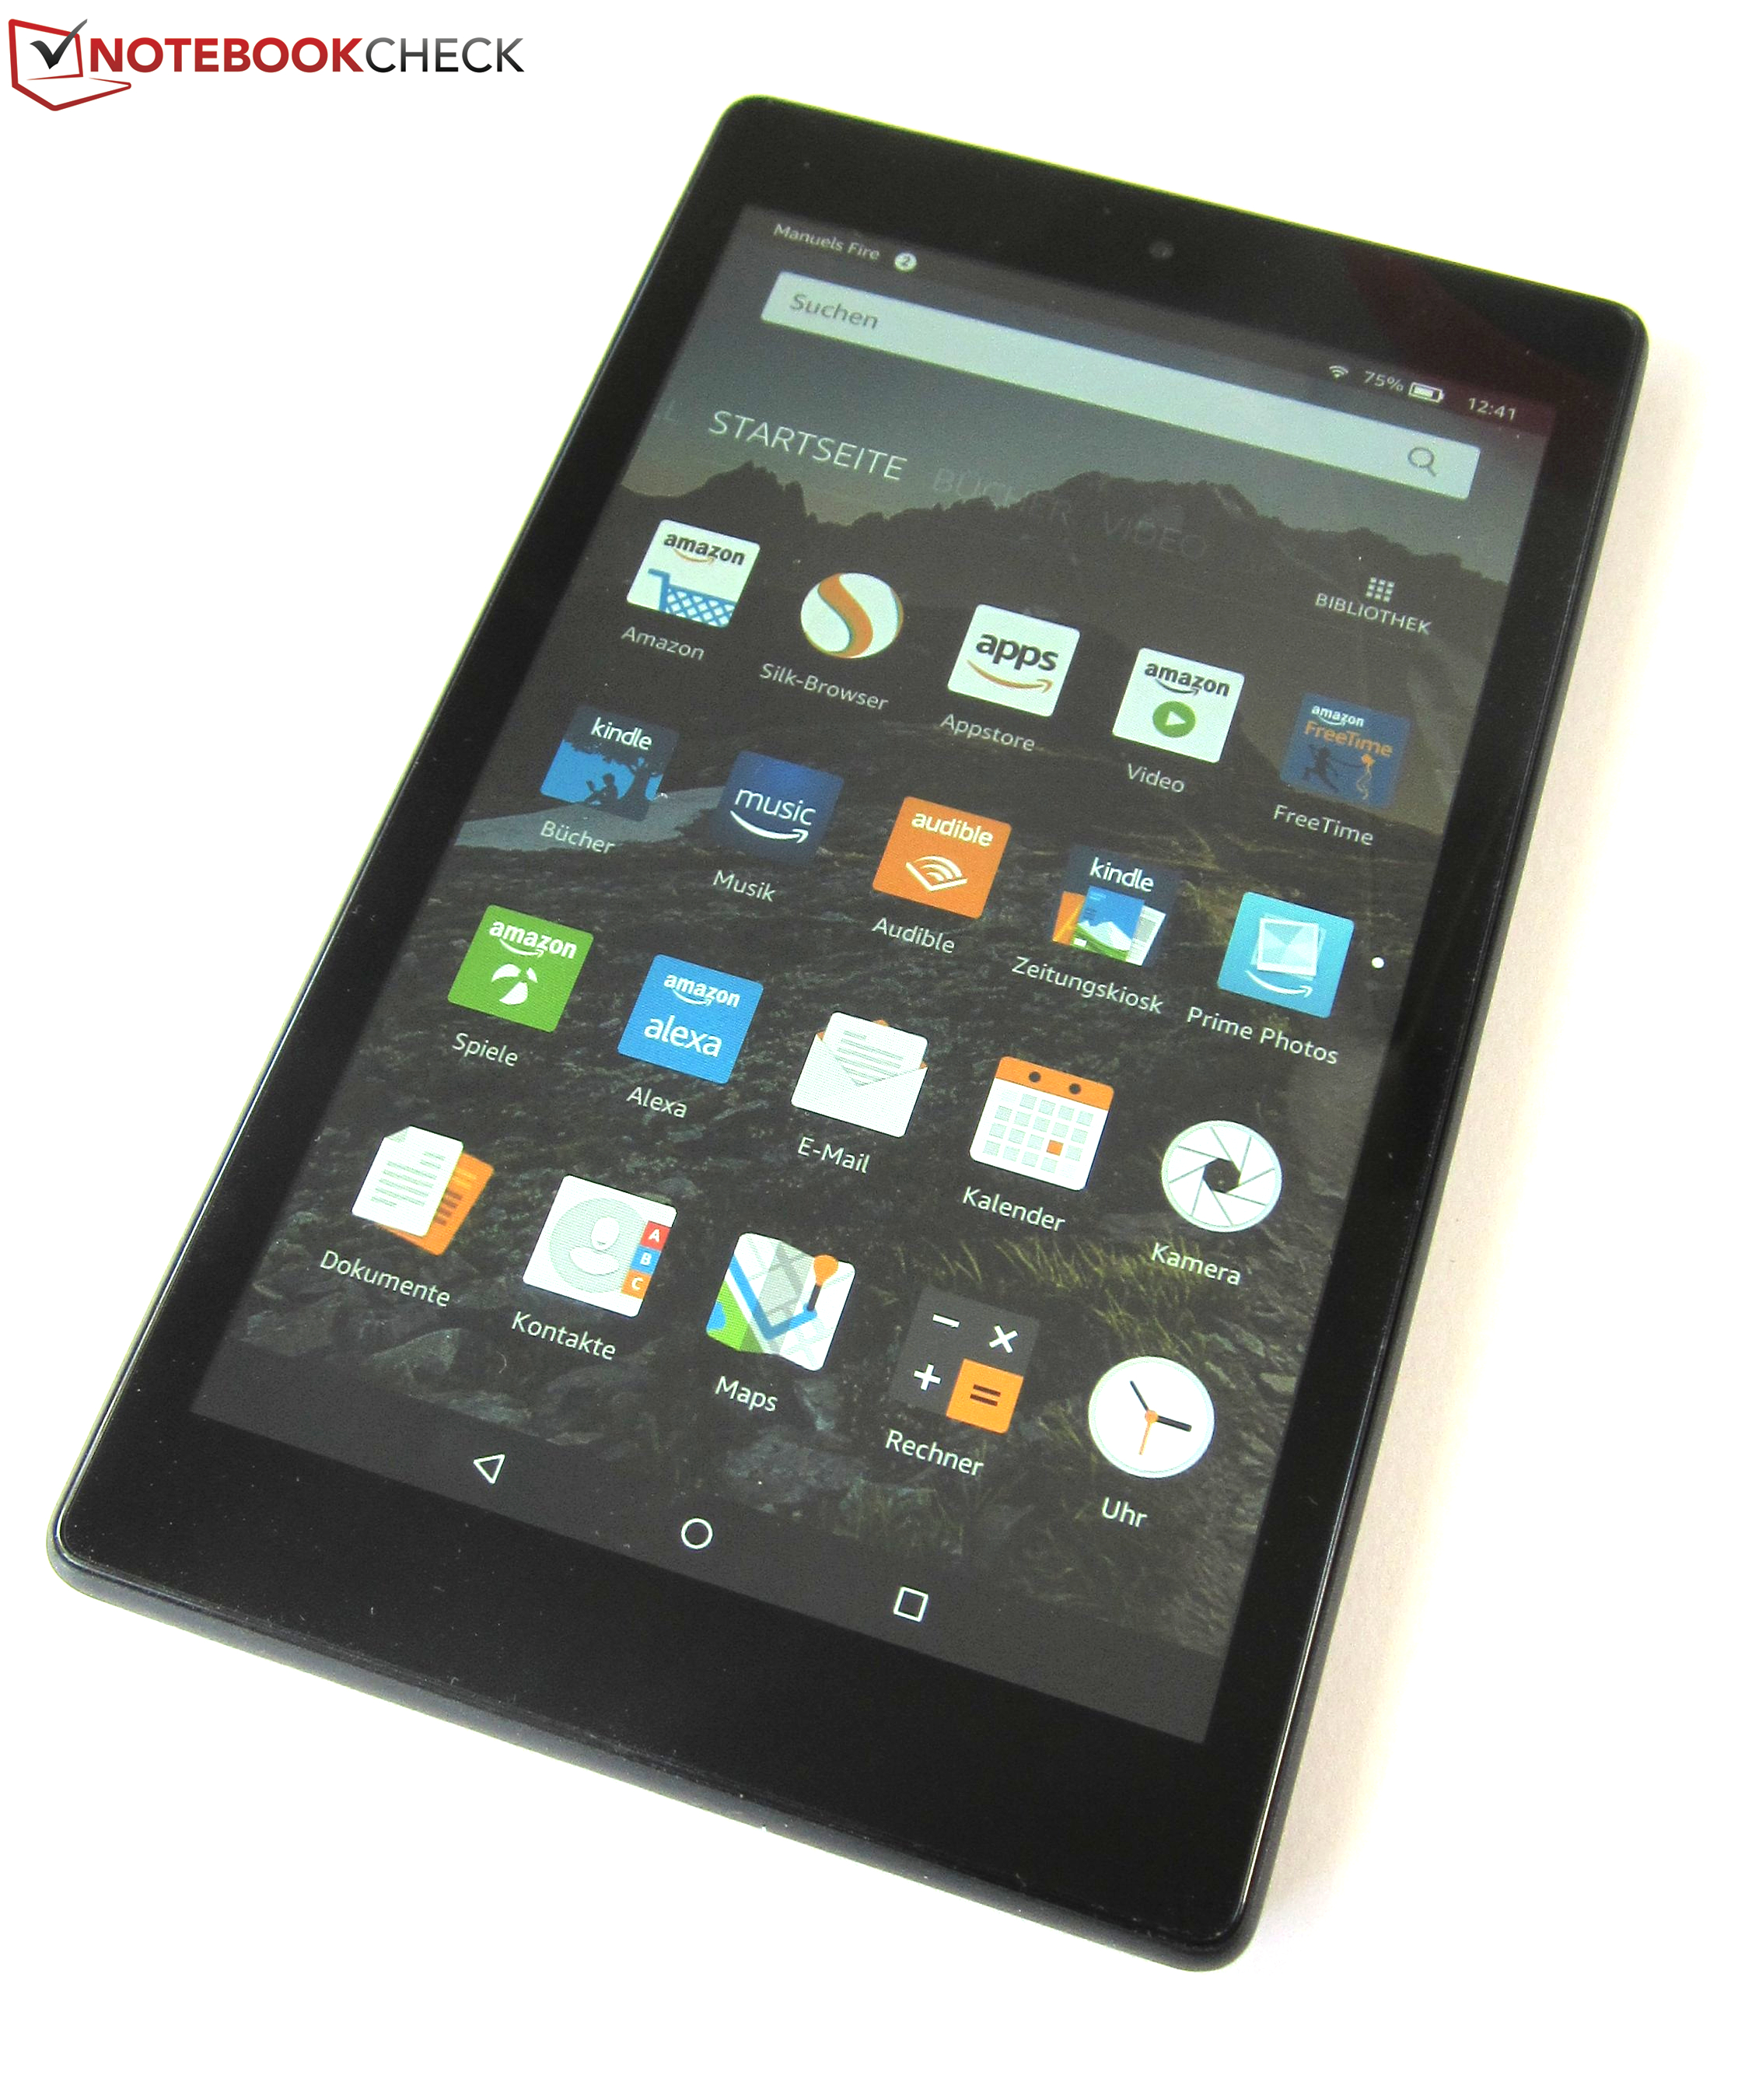
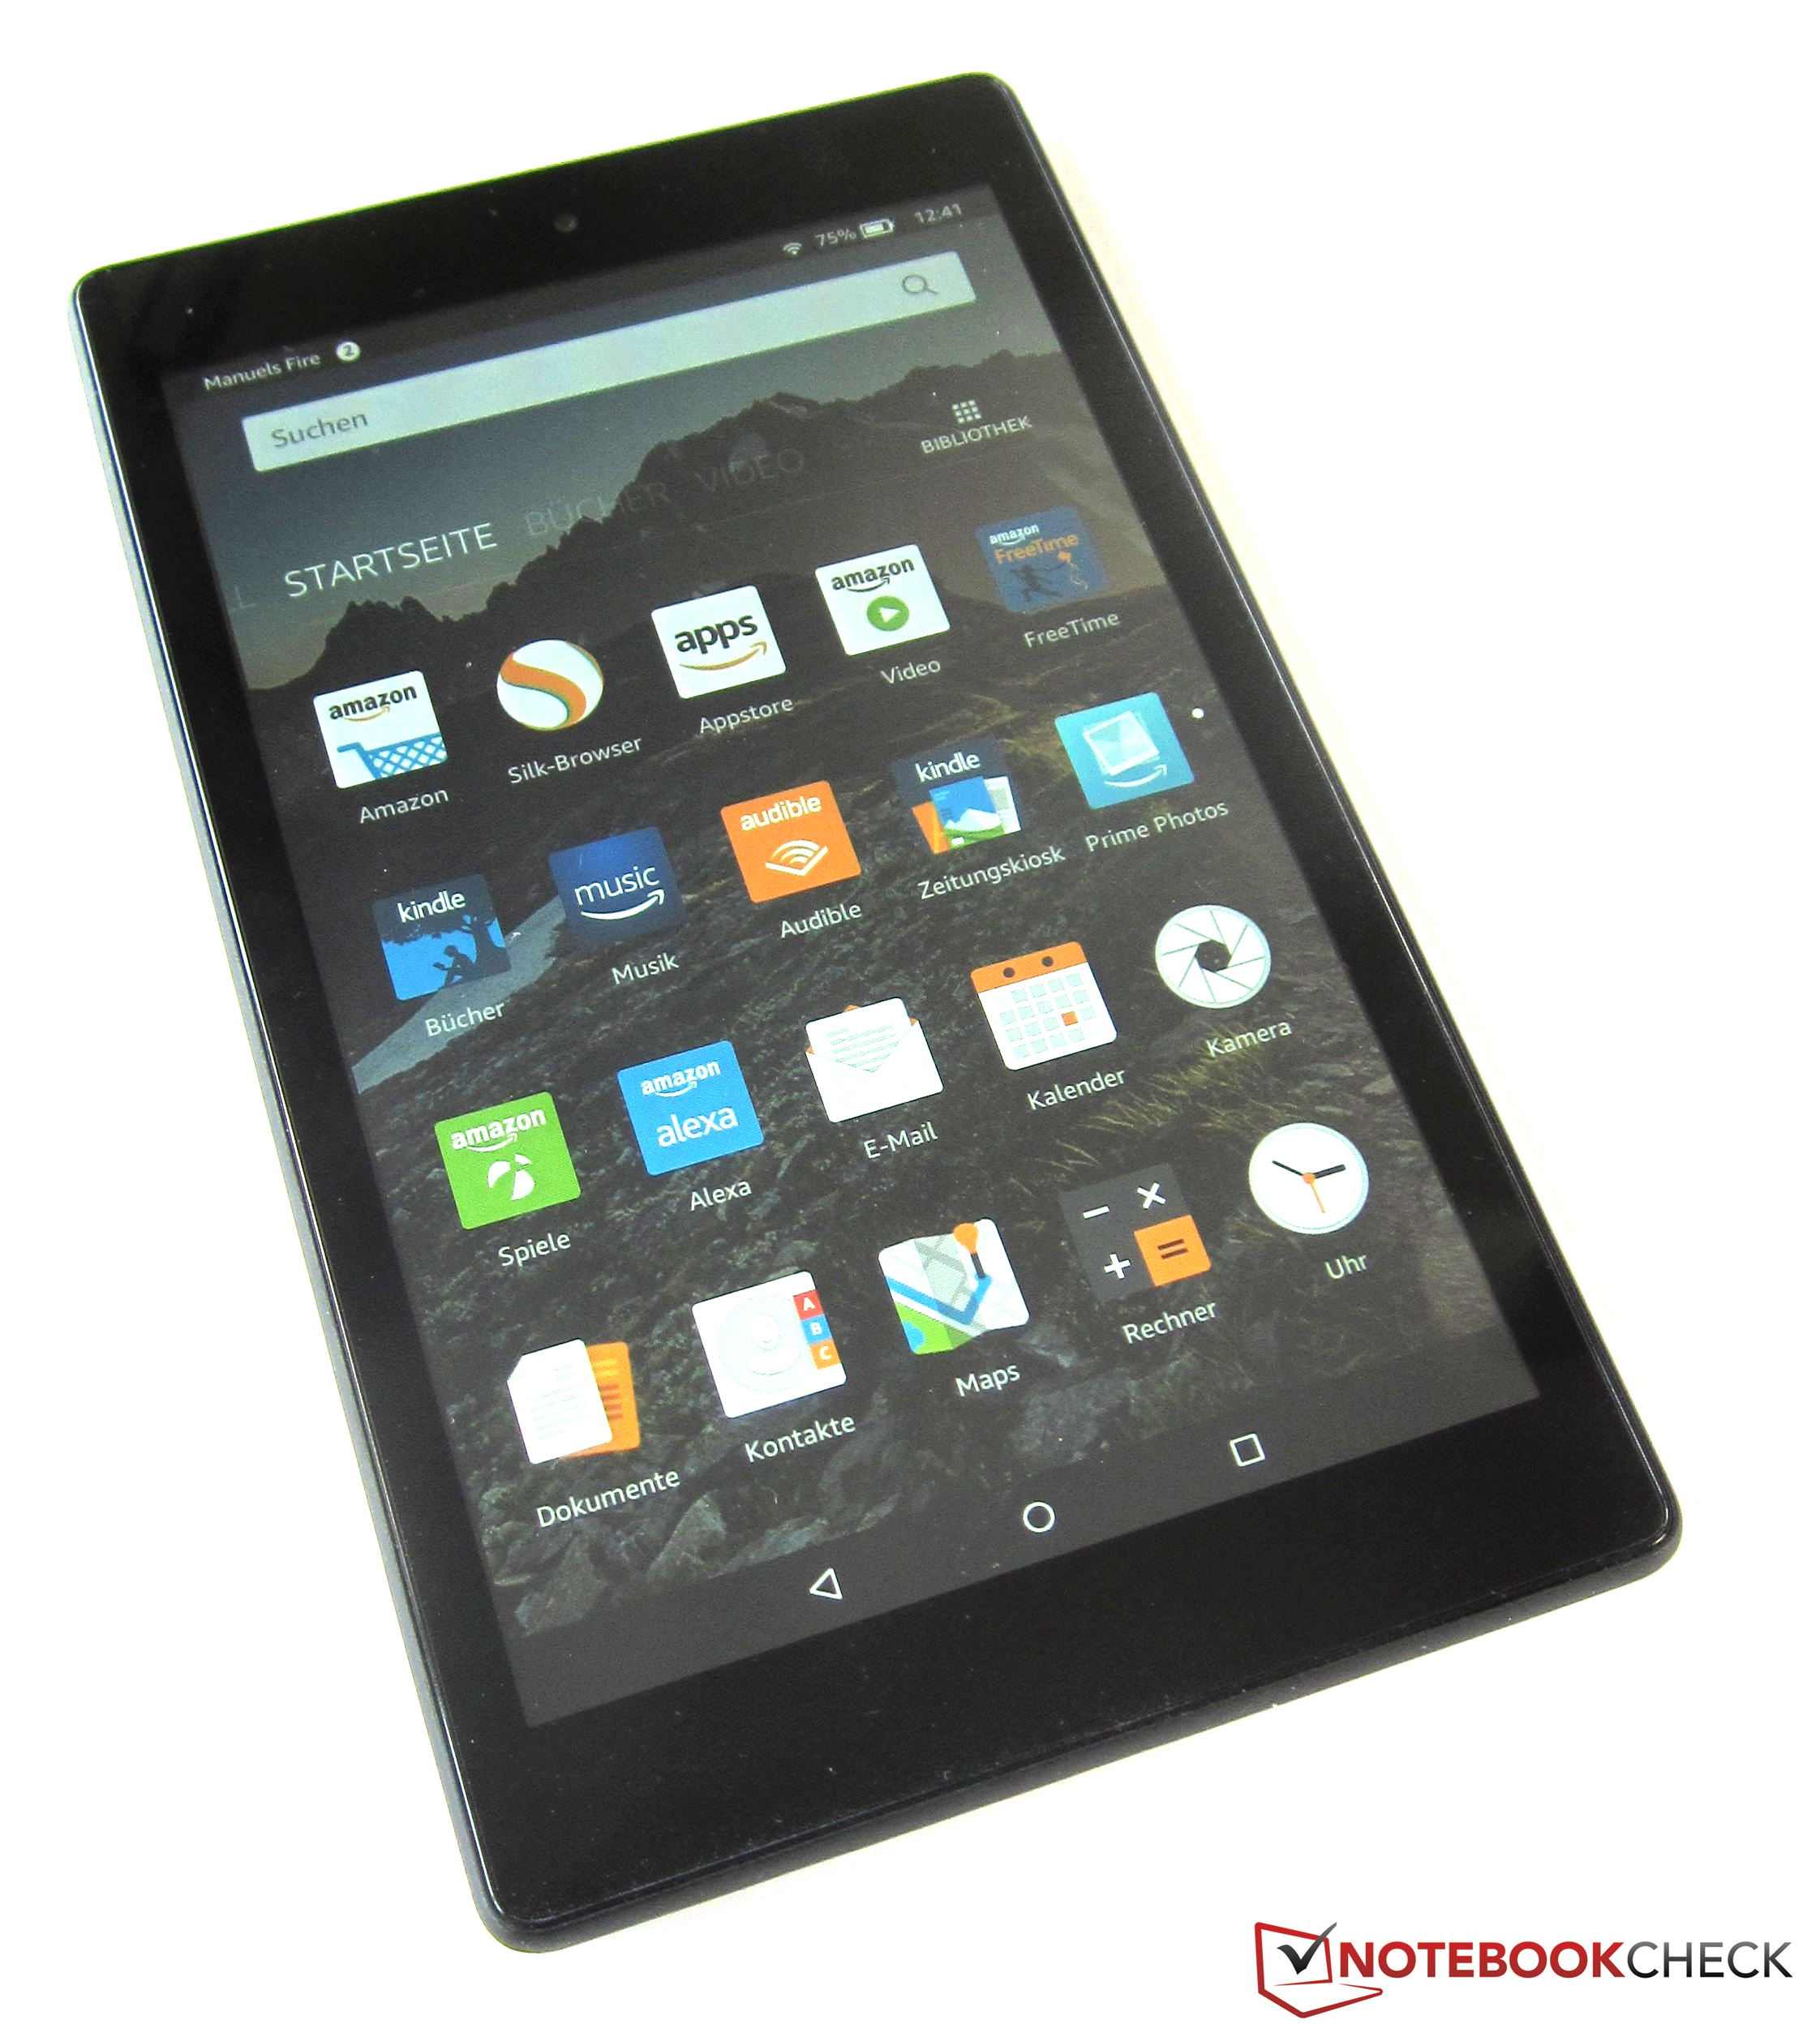
Breve Análise do Tablet Amazon Fire HD 8 (2017)
| Networking | |
| iperf3 transmit AX12 | |
| Huawei MediaPad M3 8.4 inch | |
| Amazon Fire HD 8 2017 | |
| iperf3 receive AX12 | |
| Huawei MediaPad M3 8.4 inch | |
| Amazon Fire HD 8 2017 | |

| |||||||||||||||||||||||||
iluminação: 91 %
iluminação com acumulador: 419 cd/m²
Contraste: 1074:1 (Preto: 0.39 cd/m²)
ΔE ColorChecker Calman: 8.5 | ∀{0.5-29.43 Ø4.71}
ΔE Greyscale Calman: 10.3 | ∀{0.09-98 Ø4.96}
Gamma: 2.6
CCT: 6216 K
| Amazon Fire HD 8 2017 IPS, 1280x800, 8" | Asus ZenPad 8.0 Z380M-6B026A IPS, 1280x800, 8" | Xiaomi MiPad 2 IPS, 2048x1536, 7.9" | Huawei MediaPad M3 8.4 inch IPS, 2560x1600, 8.4" | |
|---|---|---|---|---|
| Screen | 10% | 17% | 11% | |
| Brightness middle (cd/m²) | 419 | 363 -13% | 425 1% | 460 10% |
| Brightness (cd/m²) | 412 | 348 -16% | 402 -2% | 445 8% |
| Brightness Distribution (%) | 91 | 90 -1% | 91 0% | 90 -1% |
| Black Level * (cd/m²) | 0.39 | 0.26 33% | 0.4 -3% | 0.45 -15% |
| Contrast (:1) | 1074 | 1396 30% | 1063 -1% | 1022 -5% |
| Colorchecker dE 2000 * | 8.5 | 5.8 32% | 4.98 41% | 6.2 27% |
| Colorchecker dE 2000 max. * | 13.8 | 17.8 -29% | 6.61 52% | 10.5 24% |
| Greyscale dE 2000 * | 10.3 | 5.5 47% | 5.2 50% | 6.5 37% |
| Gamma | 2.6 85% | 2.24 98% | 2.65 83% | 2.33 94% |
| CCT | 6216 105% | 7388 88% | 7249 90% | 8056 81% |
* ... menor é melhor
Cintilação da tela / PWM (modulação por largura de pulso)
| Tela tremeluzindo / PWM não detectado | 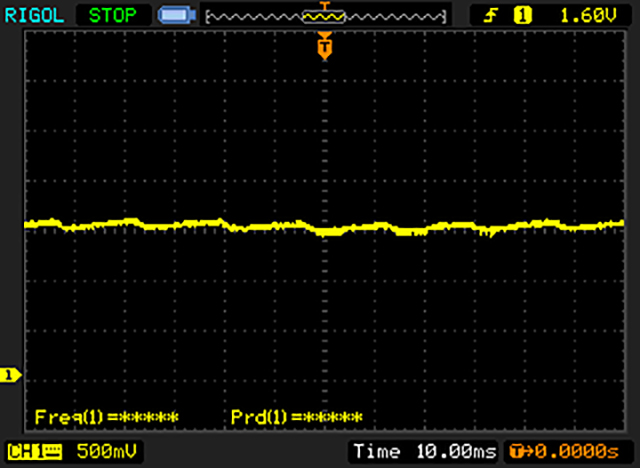 | ||
[pwm_comparison] Em comparação: 52 % de todos os dispositivos testados não usam PWM para escurecer a tela. Se PWM foi detectado, uma média de 7754 (mínimo: 5 - máximo: 343500) Hz foi medida. | |||
Exibir tempos de resposta
| ↔ Tempo de resposta preto para branco | ||
|---|---|---|
| 22.8 ms ... ascensão ↗ e queda ↘ combinadas | ↗ 11.6 ms ascensão | 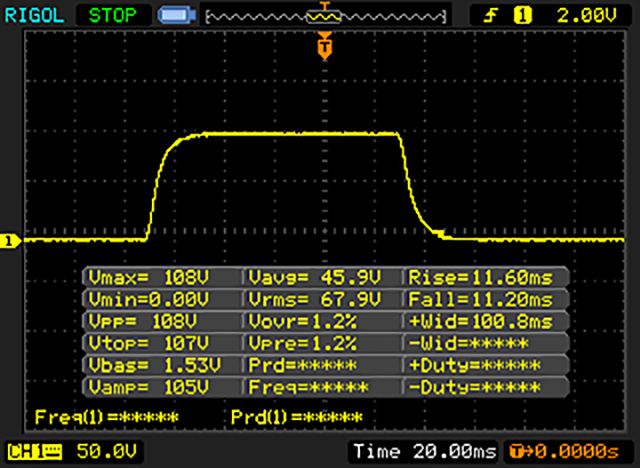 |
| ↘ 11.2 ms queda | ||
| A tela mostra boas taxas de resposta em nossos testes, mas pode ser muito lenta para jogadores competitivos. Em comparação, todos os dispositivos testados variam de 0.1 (mínimo) a 240 (máximo) ms. » 51 % de todos os dispositivos são melhores. Isso significa que o tempo de resposta medido é pior que a média de todos os dispositivos testados (19.8 ms). | ||
| ↔ Tempo de resposta 50% cinza a 80% cinza | ||
| 35.2 ms ... ascensão ↗ e queda ↘ combinadas | ↗ 16.4 ms ascensão | 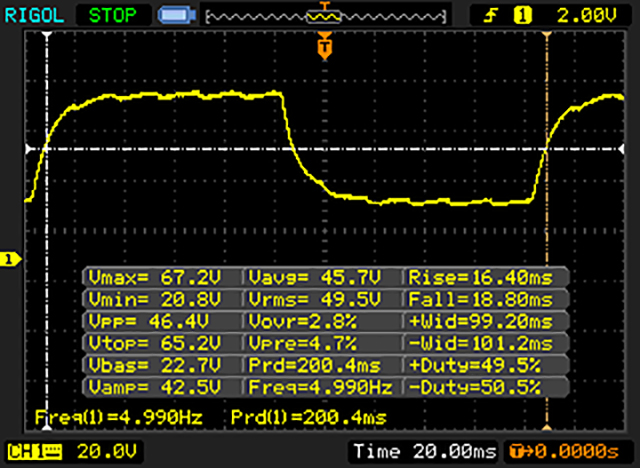 |
| ↘ 18.8 ms queda | ||
| A tela mostra taxas de resposta lentas em nossos testes e será insatisfatória para os jogadores. Em comparação, todos os dispositivos testados variam de 0.165 (mínimo) a 636 (máximo) ms. » 49 % de todos os dispositivos são melhores. Isso significa que o tempo de resposta medido é pior que a média de todos os dispositivos testados (31 ms). | ||
| AnTuTu v6 - Total Score | |
| Huawei MediaPad M3 8.4 inch | |
| Xiaomi MiPad 2 | |
| Asus ZenPad 8.0 Z380M-6B026A | |
| Amazon Fire HD 8 2017 | |
| PCMark for Android | |
| Work performance score | |
| Xiaomi MiPad 2 | |
| Huawei MediaPad M3 8.4 inch | |
| Asus ZenPad 8.0 Z380M-6B026A | |
| Amazon Fire HD 8 2017 | |
| Work 2.0 performance score | |
| Amazon Fire HD 8 2017 | |
| Geekbench 4.0 | |
| 64 Bit Single-Core Score | |
| Huawei MediaPad M3 8.4 inch | |
| Amazon Fire HD 8 2017 | |
| 64 Bit Multi-Core Score | |
| Huawei MediaPad M3 8.4 inch | |
| Amazon Fire HD 8 2017 | |
| Geekbench 4.4 | |
| 64 Bit Single-Core Score | |
| Amazon Fire HD 8 2017 | |
| 64 Bit Multi-Core Score | |
| Amazon Fire HD 8 2017 | |
| GFXBench (DX / GLBenchmark) 2.7 | |
| T-Rex Onscreen | |
| Huawei MediaPad M3 8.4 inch | |
| Asus ZenPad 8.0 Z380M-6B026A | |
| Amazon Fire HD 8 2017 | |
| Xiaomi MiPad 2 | |
| 1920x1080 T-Rex Offscreen | |
| Xiaomi MiPad 2 | |
| Huawei MediaPad M3 8.4 inch | |
| Asus ZenPad 8.0 Z380M-6B026A | |
| Amazon Fire HD 8 2017 | |
| GFXBench 3.0 | |
| on screen Manhattan Onscreen OGL | |
| Huawei MediaPad M3 8.4 inch | |
| Asus ZenPad 8.0 Z380M-6B026A | |
| Amazon Fire HD 8 2017 | |
| Xiaomi MiPad 2 | |
| 1920x1080 1080p Manhattan Offscreen | |
| Huawei MediaPad M3 8.4 inch | |
| Xiaomi MiPad 2 | |
| Asus ZenPad 8.0 Z380M-6B026A | |
| Amazon Fire HD 8 2017 | |
| GFXBench 3.1 | |
| on screen Manhattan ES 3.1 Onscreen | |
| Xiaomi MiPad 2 | |
| Asus ZenPad 8.0 Z380M-6B026A | |
| Amazon Fire HD 8 2017 | |
| Huawei MediaPad M3 8.4 inch | |
| 1920x1080 Manhattan ES 3.1 Offscreen | |
| Xiaomi MiPad 2 | |
| Huawei MediaPad M3 8.4 inch | |
| Asus ZenPad 8.0 Z380M-6B026A | |
| Amazon Fire HD 8 2017 | |
| GFXBench | |
| on screen Car Chase Onscreen | |
| Xiaomi MiPad 2 | |
| Huawei MediaPad M3 8.4 inch | |
| 1920x1080 Car Chase Offscreen | |
| Xiaomi MiPad 2 | |
| Huawei MediaPad M3 8.4 inch | |
| Octane V2 - Total Score | |
| Huawei MediaPad M3 8.4 inch | |
| Xiaomi MiPad 2 | |
| Amazon Fire HD 8 2017 | |
| Asus ZenPad 8.0 Z380M-6B026A | |
| WebXPRT 2015 - Overall | |
| Huawei MediaPad M3 8.4 inch | |
| Asus ZenPad 8.0 Z380M-6B026A | |
| Amazon Fire HD 8 2017 | |
| JetStream 1.1 - 1.1 Total | |
| Huawei MediaPad M3 8.4 inch | |
| Xiaomi MiPad 2 | |
| Amazon Fire HD 8 2017 | |
| Asus ZenPad 8.0 Z380M-6B026A | |
| Mozilla Kraken 1.1 - Total | |
| Asus ZenPad 8.0 Z380M-6B026A | |
| Amazon Fire HD 8 2017 | |
| Xiaomi MiPad 2 | |
| Huawei MediaPad M3 8.4 inch | |
* ... menor é melhor
| Amazon Fire HD 8 2017 | Asus ZenPad 8.0 Z380M-6B026A | Xiaomi MiPad 2 | Huawei MediaPad M3 8.4 inch | |
|---|---|---|---|---|
| AndroBench 3-5 | -14% | 12% | 69% | |
| Sequential Read 256KB (MB/s) | 159.1 | 158.4 0% | 147.9 -7% | 249.7 57% |
| Sequential Write 256KB (MB/s) | 47.23 | 45.71 -3% | 56.4 19% | 117.2 148% |
| Random Read 4KB (MB/s) | 21.55 | 21.96 2% | 24.42 13% | 32.04 49% |
| Random Write 4KB (MB/s) | 11.51 | 8.35 -27% | 13.96 21% | 31.35 172% |
| Sequential Read 256KB SDCard (MB/s) | 51.1 | 35.2 -31% | 61.7 21% | |
| Sequential Write 256KB SDCard (MB/s) | 34.15 | 24.9 -27% | 23.52 -31% |
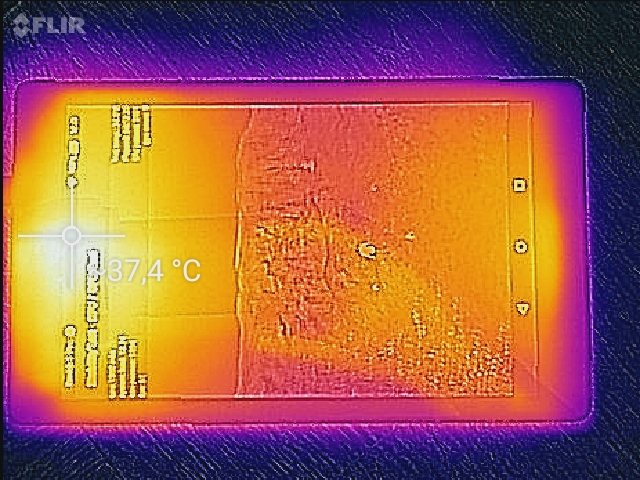
(+) A temperatura máxima no lado superior é 37.5 °C / 100 F, em comparação com a média de 33.7 °C / 93 F , variando de 20.7 a 53.2 °C para a classe Tablet.
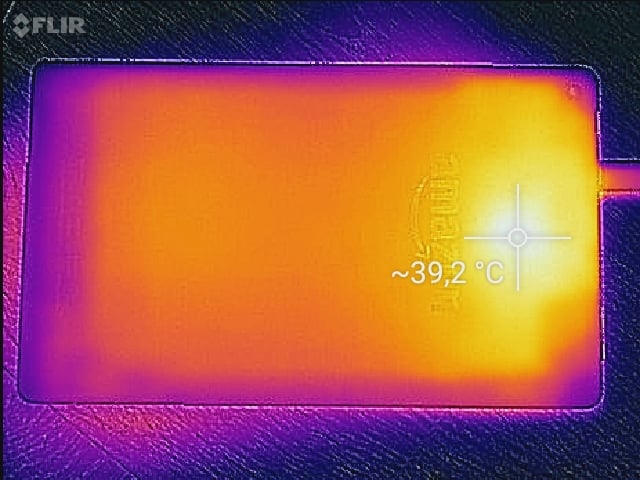
(+) A parte inferior aquece até um máximo de 37.7 °C / 100 F, em comparação com a média de 33.2 °C / 92 F
(+) Em uso inativo, a temperatura média para o lado superior é 29.6 °C / 85 F, em comparação com a média do dispositivo de 30 °C / ### class_avg_f### F.
Amazon Fire HD 8 2017 análise de áudio
(±) | o volume do alto-falante é médio, mas bom (###valor### dB)
Graves 100 - 315Hz
(±) | graves reduzidos - em média 12.9% menor que a mediana
(±) | a linearidade dos graves é média (7.5% delta para a frequência anterior)
Médios 400 - 2.000 Hz
(+) | médios equilibrados - apenas 1.5% longe da mediana
(+) | médios são lineares (4.6% delta para frequência anterior)
Altos 2 - 16 kHz
(+) | agudos equilibrados - apenas 2.9% longe da mediana
(+) | os máximos são lineares (3.9% delta da frequência anterior)
Geral 100 - 16.000 Hz
(+) | o som geral é linear (14.4% diferença em relação à mediana)
Comparado com a mesma classe
» 30% de todos os dispositivos testados nesta classe foram melhores, 4% semelhantes, 66% piores
» O melhor teve um delta de 7%, a média foi 20%, o pior foi 129%
Comparado com todos os dispositivos testados
» 18% de todos os dispositivos testados foram melhores, 4% semelhantes, 78% piores
» O melhor teve um delta de 4%, a média foi 23%, o pior foi 134%
Huawei MediaPad M3 8.4 inch análise de áudio
(+) | os alto-falantes podem tocar relativamente alto (###valor### dB)
Graves 100 - 315Hz
(-) | quase nenhum baixo - em média 26.8% menor que a mediana
(±) | a linearidade dos graves é média (14.3% delta para a frequência anterior)
Médios 400 - 2.000 Hz
(+) | médios equilibrados - apenas 4.1% longe da mediana
(+) | médios são lineares (3.9% delta para frequência anterior)
Altos 2 - 16 kHz
(±) | máximos mais altos - em média 6.3% maior que a mediana
(±) | a linearidade dos máximos é média (8.1% delta para frequência anterior)
Geral 100 - 16.000 Hz
(±) | a linearidade do som geral é média (23% diferença em relação à mediana)
Comparado com a mesma classe
» 72% de todos os dispositivos testados nesta classe foram melhores, 4% semelhantes, 24% piores
» O melhor teve um delta de 7%, a média foi 20%, o pior foi 129%
Comparado com todos os dispositivos testados
» 69% de todos os dispositivos testados foram melhores, 5% semelhantes, 26% piores
» O melhor teve um delta de 4%, a média foi 23%, o pior foi 134%
Asus ZenPad 8.0 Z380M-6B026A análise de áudio
(±) | o volume do alto-falante é médio, mas bom (###valor### dB)
Graves 100 - 315Hz
(-) | quase nenhum baixo - em média 28.5% menor que a mediana
(-) | graves não são lineares (18.8% delta para frequência anterior)
Médios 400 - 2.000 Hz
(+) | médios equilibrados - apenas 3.9% longe da mediana
(±) | a linearidade dos médios é média (9.3% delta para frequência anterior)
Altos 2 - 16 kHz
(+) | agudos equilibrados - apenas 2.5% longe da mediana
(+) | os máximos são lineares (5.4% delta da frequência anterior)
Geral 100 - 16.000 Hz
(±) | a linearidade do som geral é média (23.9% diferença em relação à mediana)
Comparado com a mesma classe
» 75% de todos os dispositivos testados nesta classe foram melhores, 6% semelhantes, 19% piores
» O melhor teve um delta de 7%, a média foi 20%, o pior foi 129%
Comparado com todos os dispositivos testados
» 72% de todos os dispositivos testados foram melhores, 6% semelhantes, 22% piores
» O melhor teve um delta de 4%, a média foi 23%, o pior foi 134%
| desligado | |
| Ocioso | |
| Carga |
|
Key:
min: | |
| Amazon Fire HD 8 2017 mAh | Asus ZenPad 8.0 Z380M-6B026A 4000 mAh | Xiaomi MiPad 2 6190 mAh | Huawei MediaPad M3 8.4 inch 5100 mAh | |
|---|---|---|---|---|
| Power Consumption | -3% | -110% | -46% | |
| Idle Minimum * (Watt) | 0.99 | 1.32 -33% | 3.33 -236% | 1.51 -53% |
| Idle Average * (Watt) | 2.74 | 2.71 1% | 5.01 -83% | 3.64 -33% |
| Idle Maximum * (Watt) | 2.83 | 2.83 -0% | 5.19 -83% | 3.68 -30% |
| Load Average * (Watt) | 4.51 | 4.24 6% | 8.32 -84% | 6.95 -54% |
| Load Maximum * (Watt) | 5.69 | 5.01 12% | 9.33 -64% | 9.11 -60% |
* ... menor é melhor
| Amazon Fire HD 8 2017 mAh | Asus ZenPad 8.0 Z380M-6B026A 4000 mAh | Xiaomi MiPad 2 6190 mAh | Huawei MediaPad M3 8.4 inch 5100 mAh | |
|---|---|---|---|---|
| Duração da bateria | -29% | -45% | -32% | |
| Reader / Idle (h) | 33.9 | 21.8 -36% | 18.5 -45% | |
| H.264 (h) | 12.4 | 10.4 -16% | 9.7 -22% | |
| WiFi v1.3 (h) | 12.8 | 7.9 -38% | 7 -45% | 9.1 -29% |
| Load (h) | 6.6 | 4.8 -27% | 4.5 -32% |
Pro
Contra

Como seus predecessores e irmãos de 7 e 10 polegadas, o Amazon Fire HD 8 (2017) oferece uma incrível relação preço-desempenho.
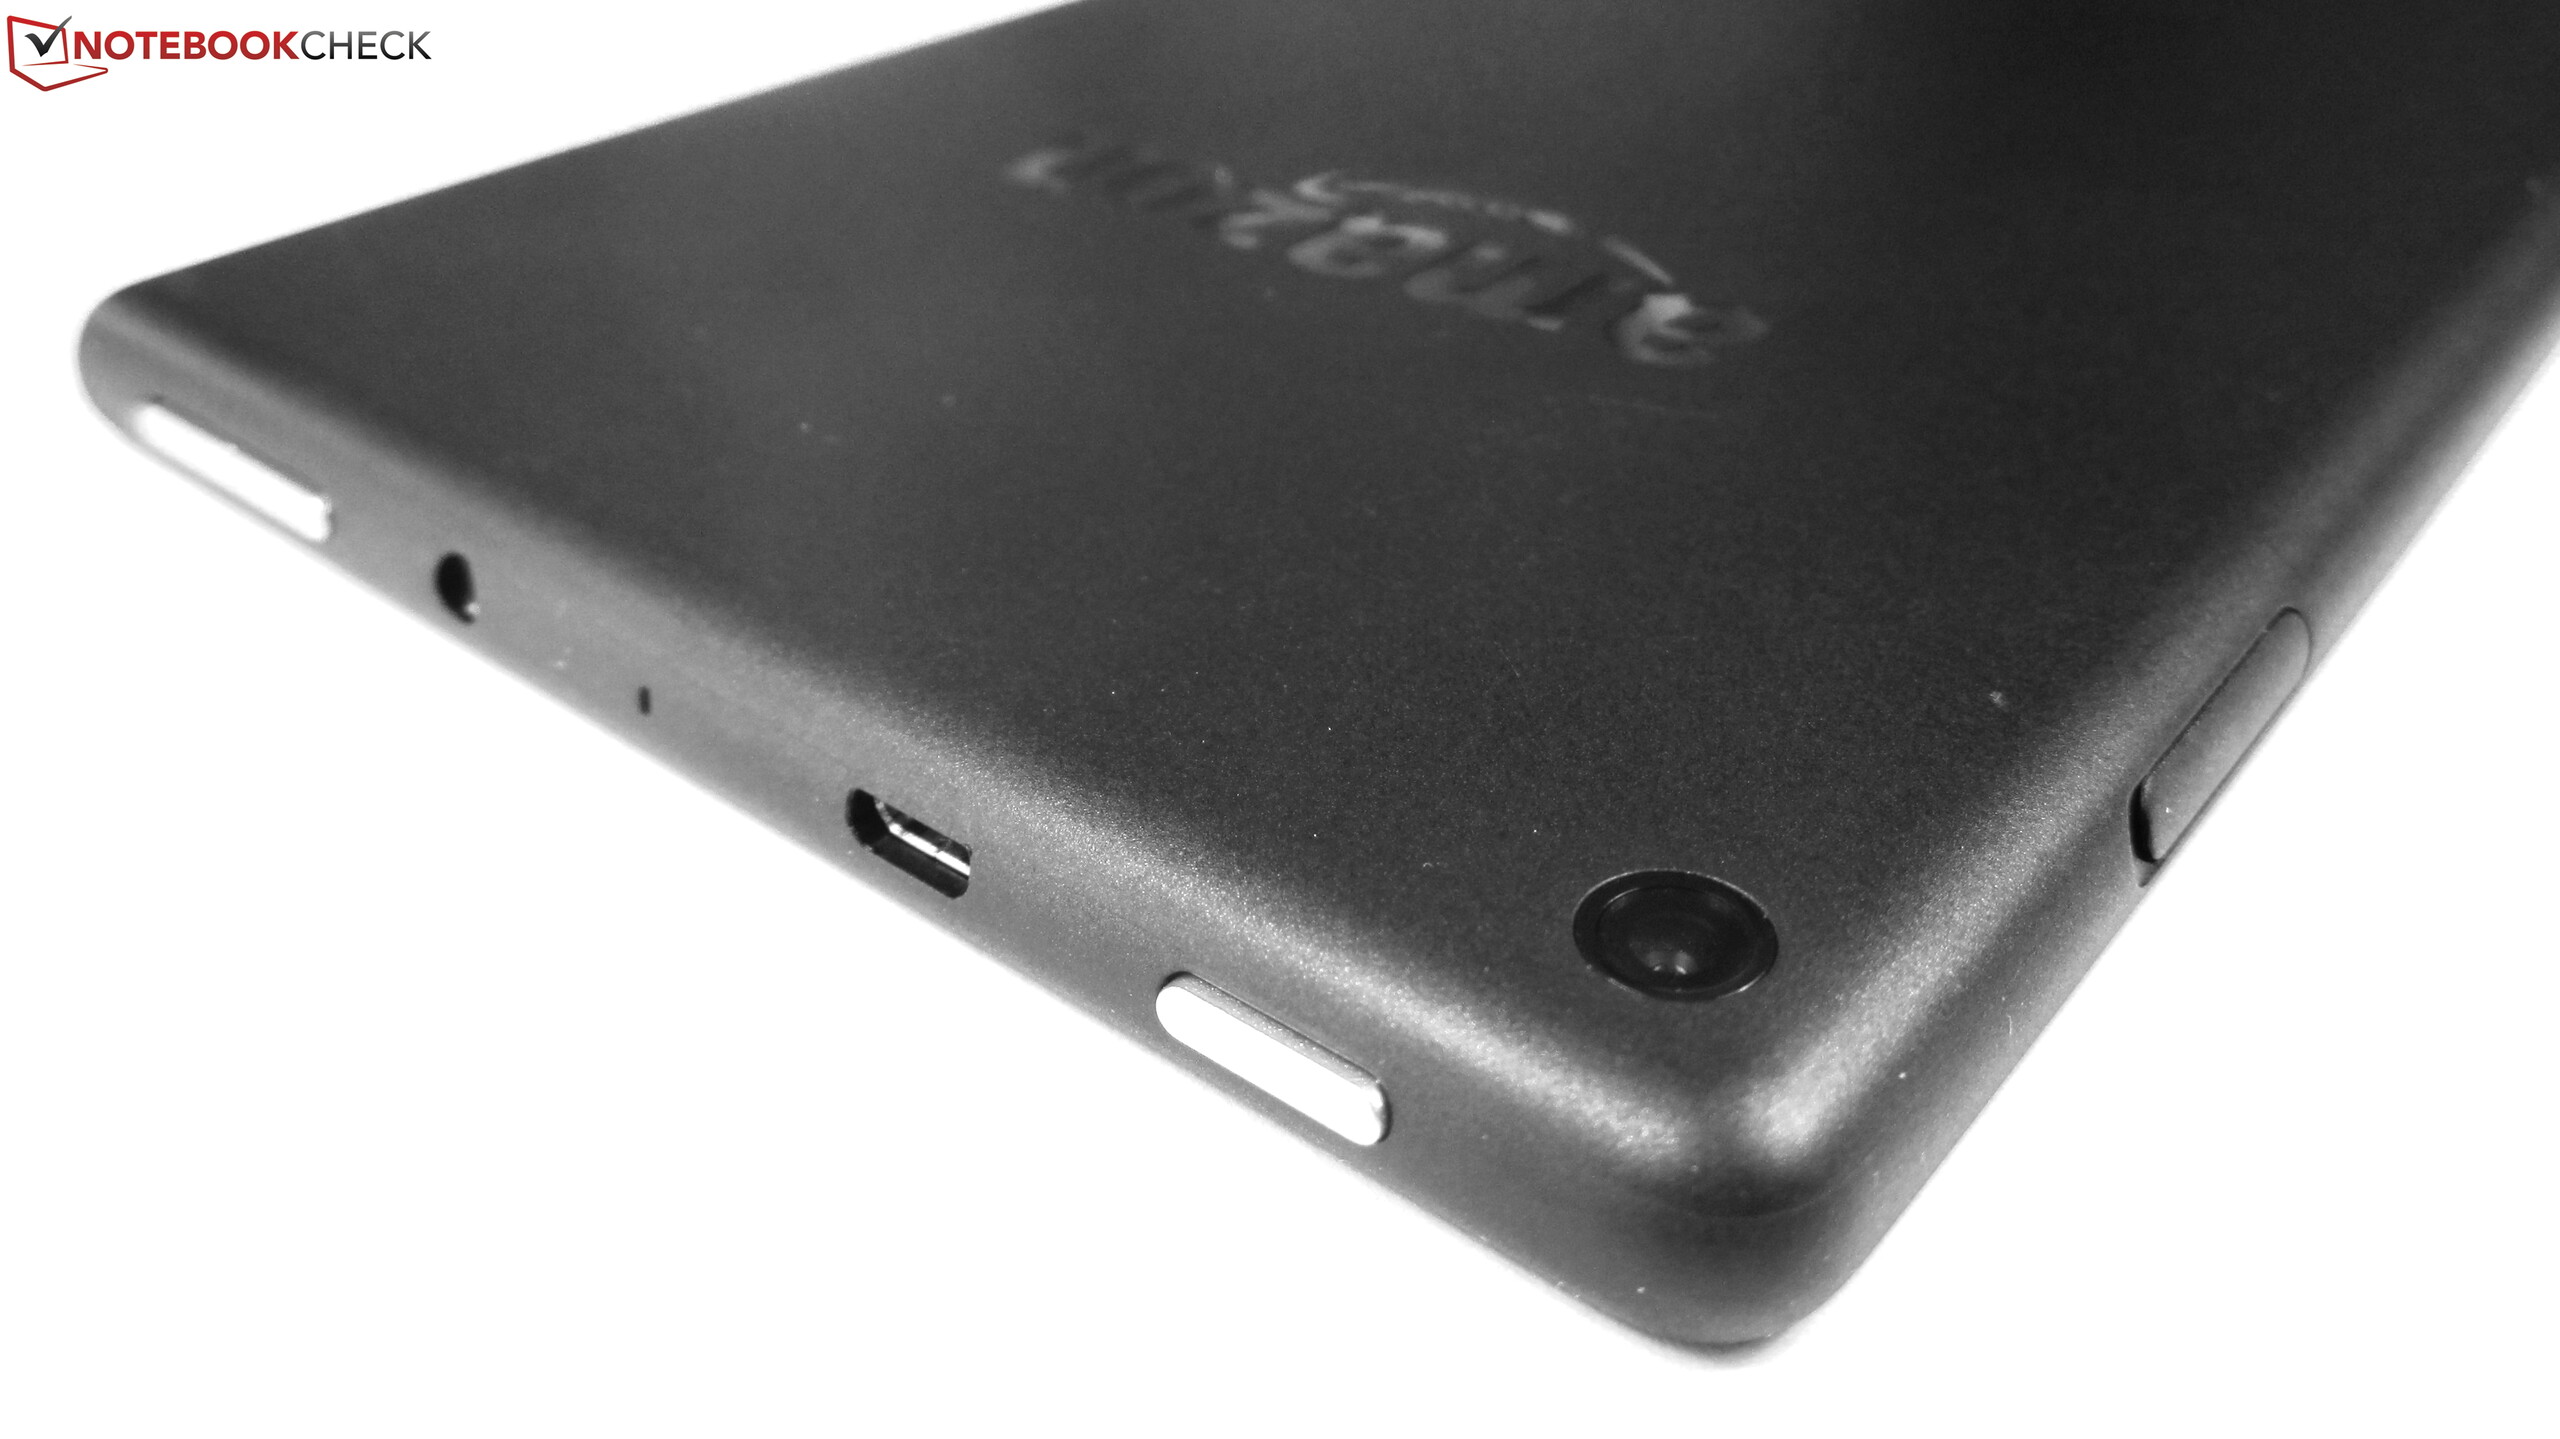
Equipado com uma tela IPS de 8 polegadas de 1280x800, um SoC quad-core MediaTek MT8163, e 16 ou 32 GB de armazenamento, o Fire HD oferece suficiente desemepnho ára o uso diário. E, embora isso também seja verdade para seus concorrentes, eles tendem a ser mais caros. Em qualquer lugar entre $80 e $125, você terá um tablet bem feito com longa duração da bateria e som estéreo decente.
Aqueles de vocês, que já possuem o antecessor, podem ignorar esta última versão. Além de alguns aprimoramentos menores (cartão microSD maior, GPU um pouco mais veloz), ele realmente não mudou muito.
Por outro lado, o tablet vem com seu próprio conjunto peculiar de limitações, o foco essencialmente óbvio no ecossistema da Amazon em geral. A Play Store do Google não é oficialmente suportado e sua instalação, anulará sua garantia. O Fire HD 8 (2017) é o aparelho perfeito se planeja ficar dentro do universo da Amazon.
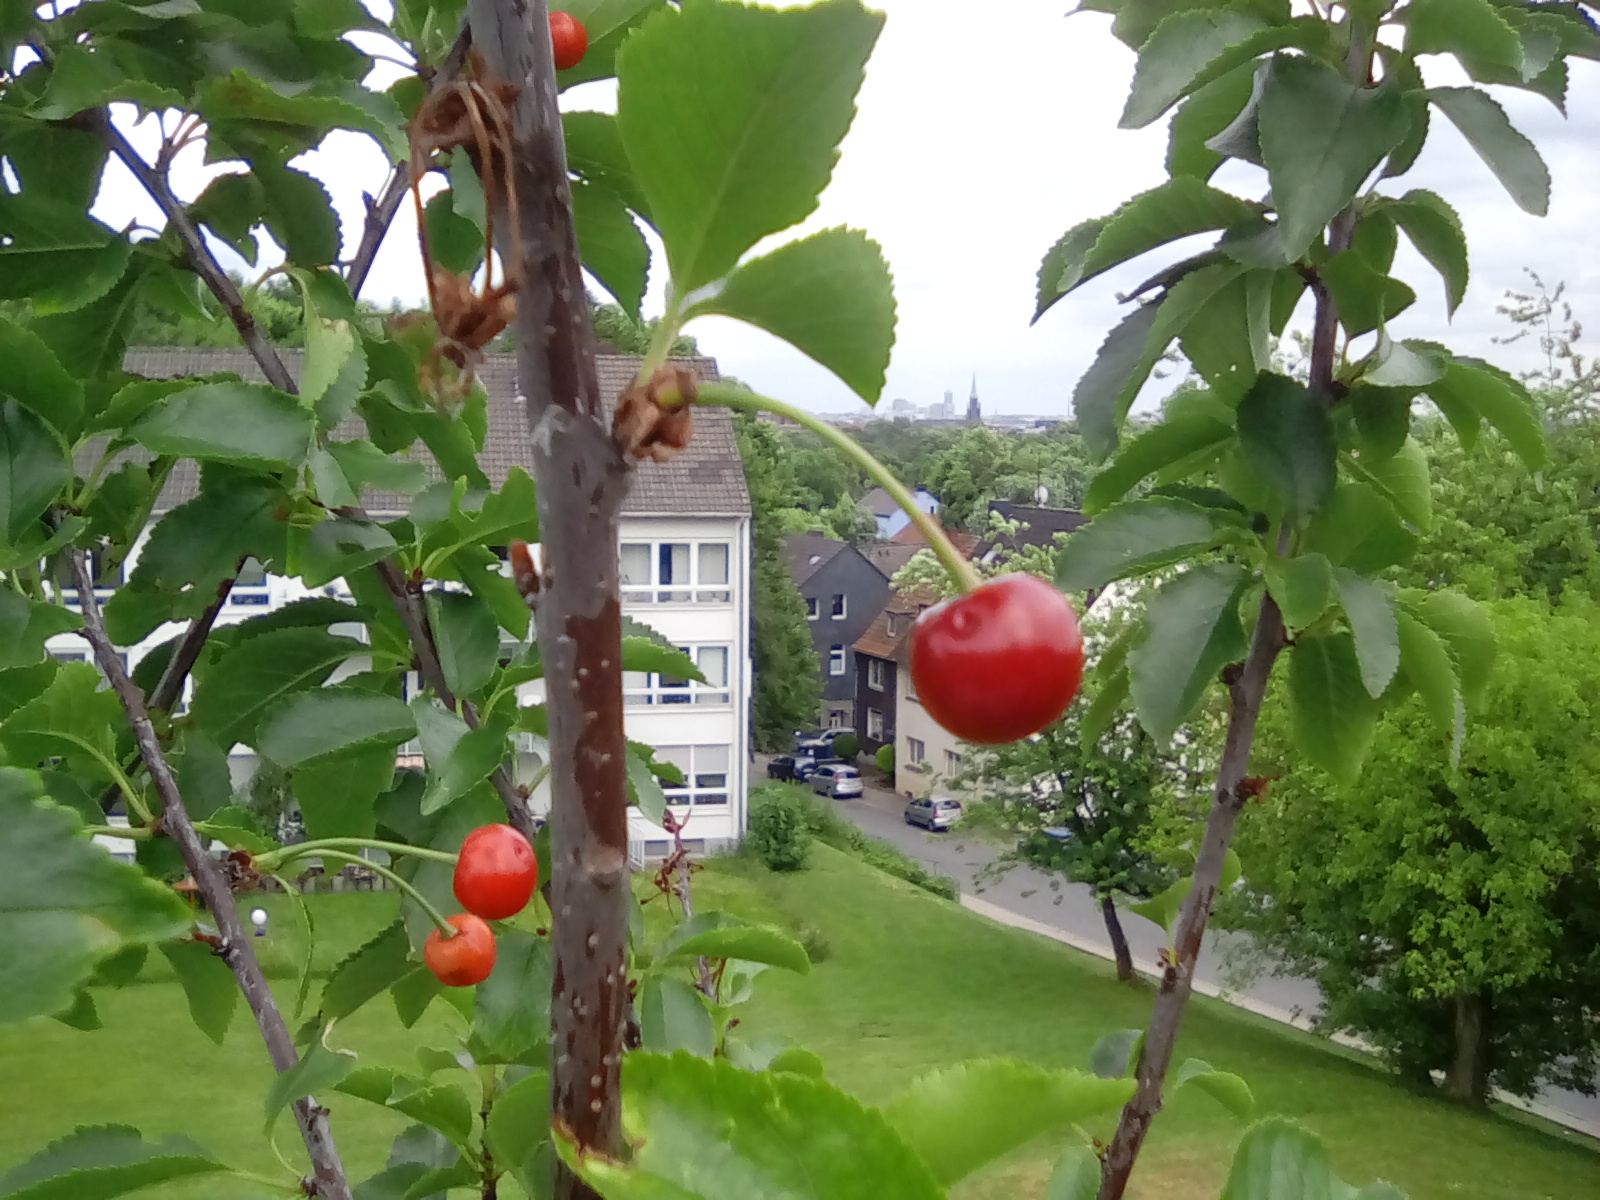
Outras limitações são simplesmente terríveis, como o SO Android 5.1.1 desatualizado, a falta do GPS e WWAN, e as câmeras pobres que você teria que ser quase cego para encontrá-las remotamente aceitáveis.
Amazon Fire HD 8 2017
- 07/07/2017 v6 (old)
Manuel Masiero
Price comparison
