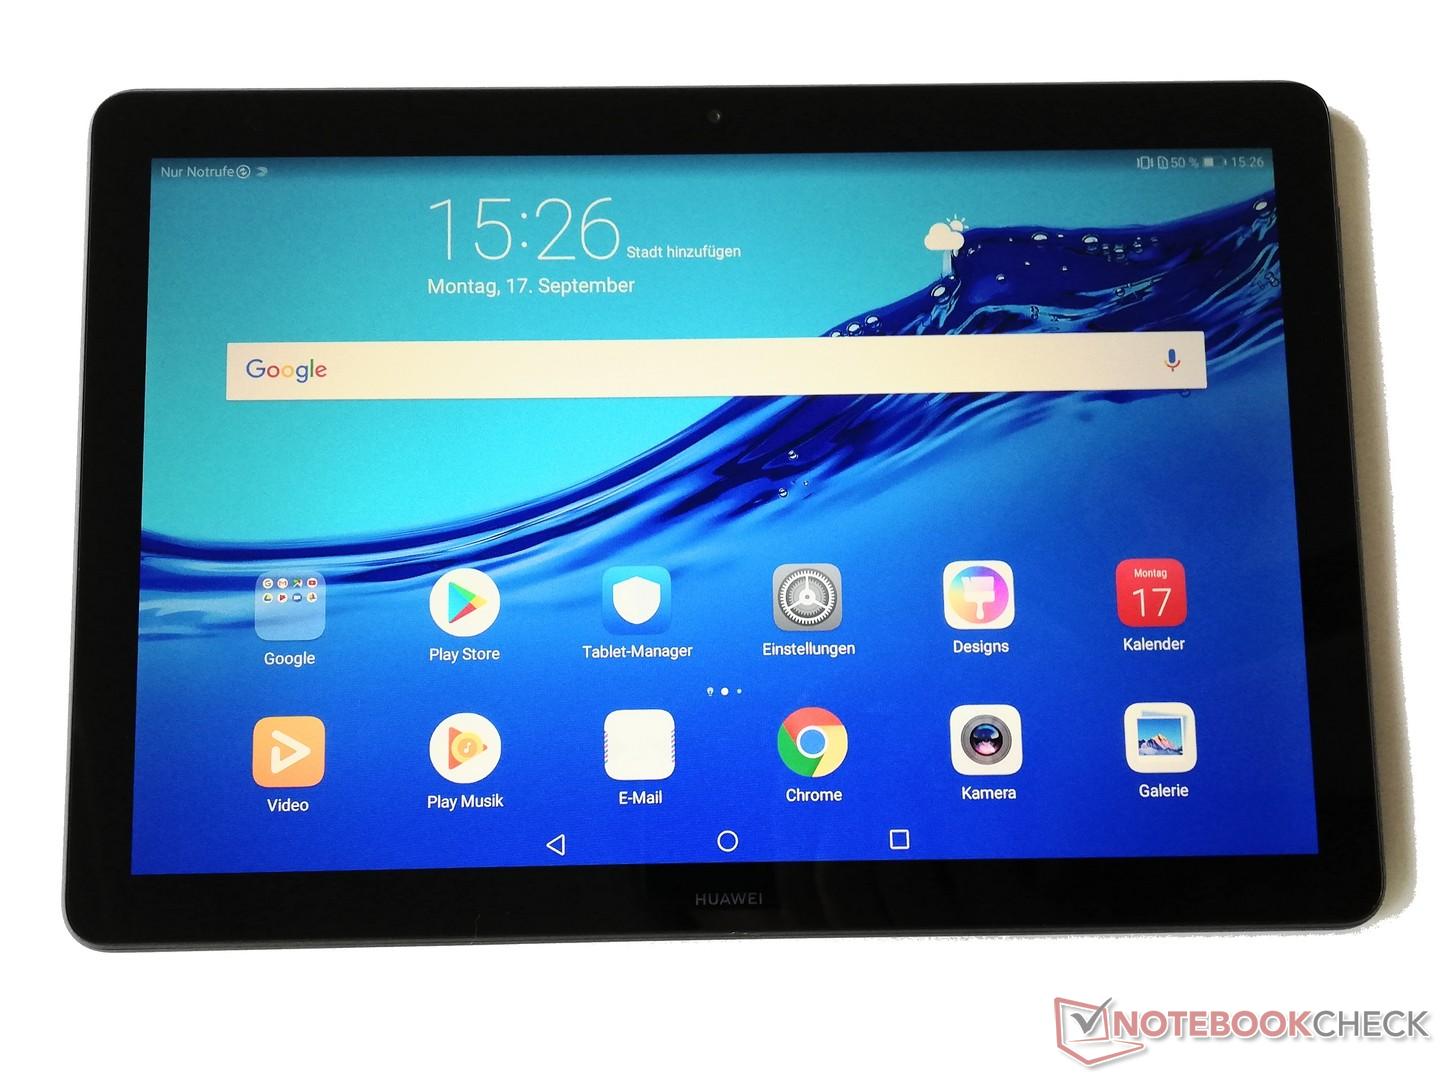
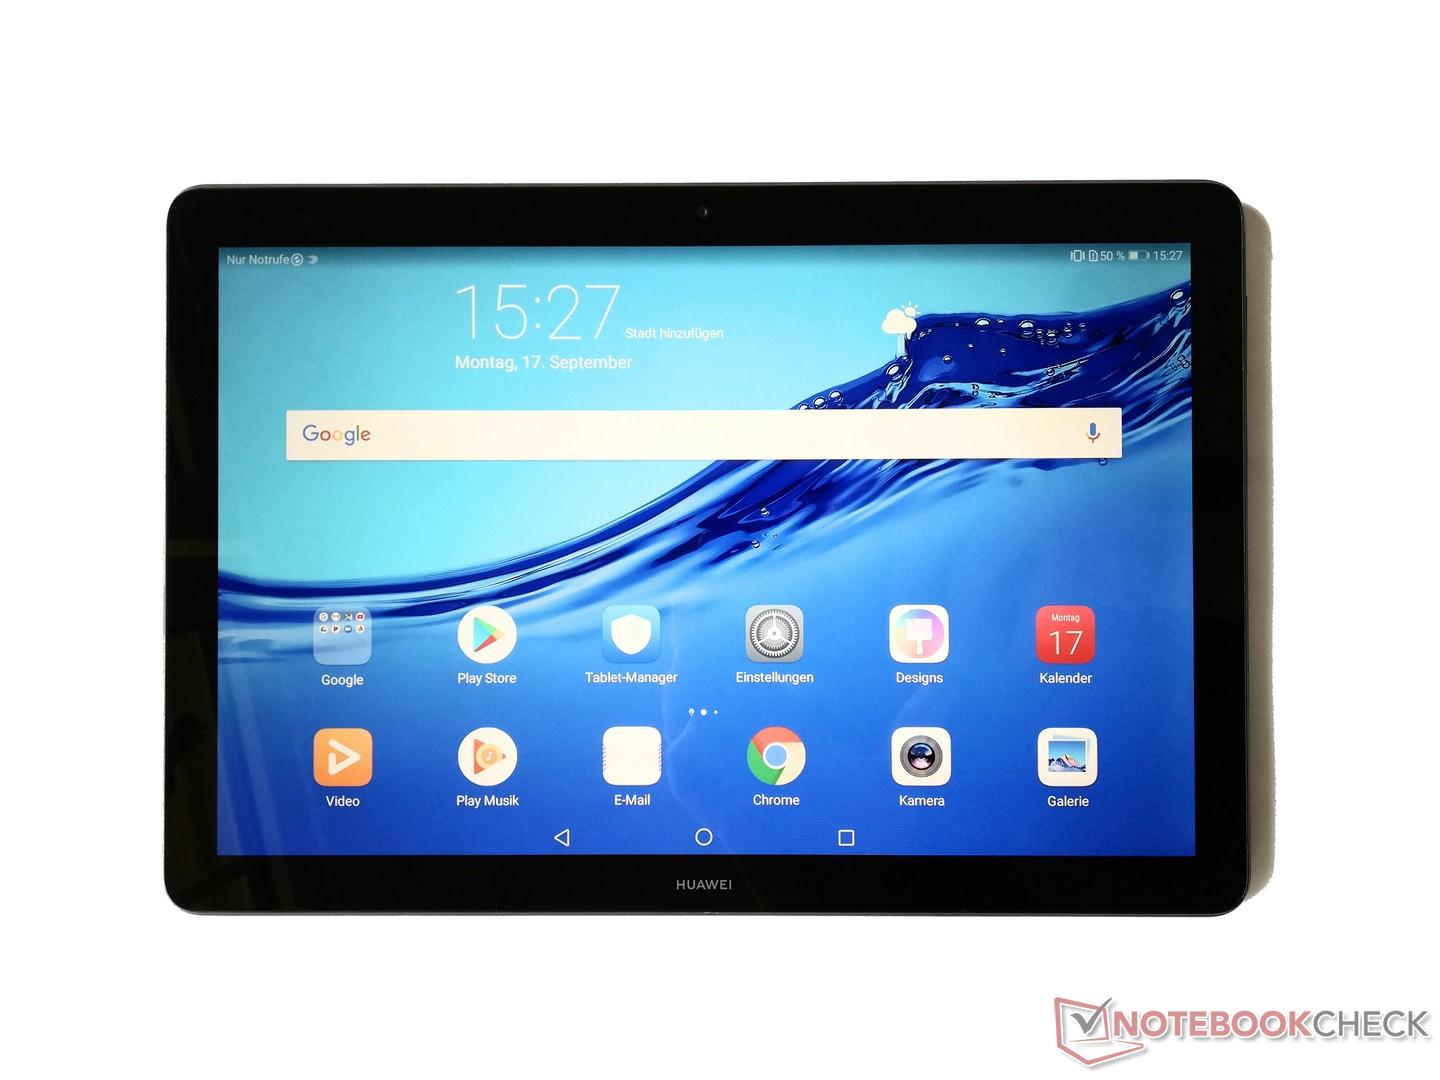
Breve Análise do Tablet Huawei MediaPad T5 (10,1 polegadas, LTE)
| Networking | |
| iperf3 transmit AX12 | |
| Acer Iconia Tab 10 A3-A50 | |
| Huawei MediaPad T5 10 | |
| Amazon Fire HD 10 2017 | |
| Medion Lifetab P10606 | |
| Asus ZenPad 10 (Z301ML) | |
| iperf3 receive AX12 | |
| Medion Lifetab P10606 | |
| Acer Iconia Tab 10 A3-A50 | |
| Amazon Fire HD 10 2017 | |
| Huawei MediaPad T5 10 | |
| Asus ZenPad 10 (Z301ML) | |


| |||||||||||||||||||||||||
iluminação: 92 %
iluminação com acumulador: 356 cd/m²
Contraste: 712:1 (Preto: 0.5 cd/m²)
ΔE ColorChecker Calman: 2.3 | ∀{0.5-29.43 Ø4.71}
ΔE Greyscale Calman: 1.4 | ∀{0.09-98 Ø4.96}
97.7% sRGB (Calman 2D)
Gamma: 2.16
CCT: 6565 K
| Huawei MediaPad T5 10 IPS, 1920x1200, 10.1" | Medion Lifetab P10606 IPS, 1920x1200, 10.1" | Acer Iconia Tab 10 A3-A50 IPS, 1920x1200, 10.1" | Amazon Fire HD 10 2017 IPS, 1920x1200, 10.1" | Asus ZenPad 10 (Z301ML) IPS, 1280x800, 10.1" | |
|---|---|---|---|---|---|
| Screen | -159% | -99% | -34% | -10% | |
| Brightness middle (cd/m²) | 356 | 326 -8% | 340 -4% | 426 20% | 392 10% |
| Brightness (cd/m²) | 340 | 338 -1% | 320 -6% | 399 17% | 383 13% |
| Brightness Distribution (%) | 92 | 92 0% | 84 -9% | 91 -1% | 81 -12% |
| Black Level * (cd/m²) | 0.5 | 0.56 -12% | 0.19 62% | 0.38 24% | 0.25 50% |
| Contrast (:1) | 712 | 582 -18% | 1789 151% | 1121 57% | 1568 120% |
| Colorchecker dE 2000 * | 2.3 | 9.1 -296% | 15 -552% | 4.5 -96% | 4.2 -83% |
| Colorchecker dE 2000 max. * | 6.5 | 18.2 -180% | 22.8 -251% | 7.9 -22% | 11.2 -72% |
| Greyscale dE 2000 * | 1.4 | 12 -757% | 4 -186% | 5.2 -271% | 2.9 -107% |
| Gamma | 2.16 102% | 2.32 95% | 2.09 105% | 2.23 99% | 2.23 99% |
| CCT | 6565 99% | 11359 57% | 6940 94% | 6875 95% | 7115 91% |
* ... menor é melhor
Cintilação da tela / PWM (modulação por largura de pulso)
| Tela tremeluzindo/PWM detectado | 67.6 Hz | ≤ 20 % configuração de brilho | 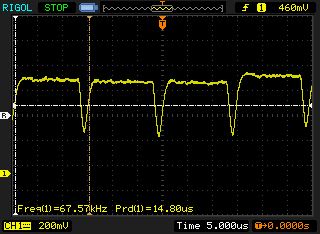 |
A luz de fundo da tela pisca em 67.6 Hz (pior caso, por exemplo, utilizando PWM) Cintilação detectada em uma configuração de brilho de 20 % e abaixo. Não deve haver cintilação ou PWM acima desta configuração de brilho. A frequência de 67.6 Hz é muito baixa, portanto a oscilação pode causar fadiga ocular e dores de cabeça após uso prolongado. [pwm_comparison] Em comparação: 52 % de todos os dispositivos testados não usam PWM para escurecer a tela. Se PWM foi detectado, uma média de 7748 (mínimo: 5 - máximo: 343500) Hz foi medida. | |||
Exibir tempos de resposta
| ↔ Tempo de resposta preto para branco | ||
|---|---|---|
| 29.8 ms ... ascensão ↗ e queda ↘ combinadas | ↗ 19.6 ms ascensão | 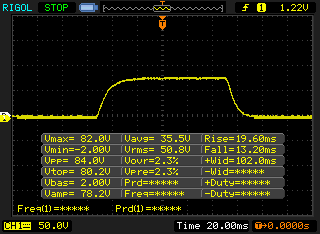 |
| ↘ 13.2 ms queda | ||
| A tela mostra taxas de resposta relativamente lentas em nossos testes e pode ser muito lenta para os jogadores. Em comparação, todos os dispositivos testados variam de 0.1 (mínimo) a 240 (máximo) ms. » 80 % de todos os dispositivos são melhores. Isso significa que o tempo de resposta medido é pior que a média de todos os dispositivos testados (19.8 ms). | ||
| ↔ Tempo de resposta 50% cinza a 80% cinza | ||
| 28.4 ms ... ascensão ↗ e queda ↘ combinadas | ↗ 21.2 ms ascensão | 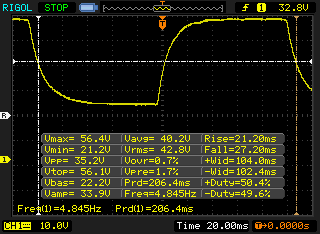 |
| ↘ 27.2 ms queda | ||
| A tela mostra taxas de resposta relativamente lentas em nossos testes e pode ser muito lenta para os jogadores. Em comparação, todos os dispositivos testados variam de 0.165 (mínimo) a 636 (máximo) ms. » 38 % de todos os dispositivos são melhores. Isso significa que o tempo de resposta medido é semelhante à média de todos os dispositivos testados (30.9 ms). | ||
| AnTuTu v6 - Total Score | |
| Acer Iconia Tab 10 A3-A50 | |
| Huawei MediaPad T5 10 | |
| Média HiSilicon Kirin 659 (62810 - 68232, n=8) | |
| Amazon Fire HD 10 2017 | |
| Medion Lifetab P10606 | |
| Asus ZenPad 10 (Z301ML) | |
| AnTuTu v7 - Total Score | |
| Huawei MediaPad T5 10 | |
| Média HiSilicon Kirin 659 (81992 - 89639, n=6) | |
| Amazon Fire HD 10 2017 | |
| Medion Lifetab P10606 | |
| PCMark for Android | |
| Work performance score | |
| Média HiSilicon Kirin 659 (5704 - 6252, n=7) | |
| Acer Iconia Tab 10 A3-A50 | |
| Huawei MediaPad T5 10 | |
| Amazon Fire HD 10 2017 | |
| Medion Lifetab P10606 | |
| Asus ZenPad 10 (Z301ML) | |
| Work 2.0 performance score | |
| Acer Iconia Tab 10 A3-A50 | |
| Média HiSilicon Kirin 659 (4615 - 4911, n=8) | |
| Huawei MediaPad T5 10 | |
| Amazon Fire HD 10 2017 | |
| Medion Lifetab P10606 | |
| Asus ZenPad 10 (Z301ML) | |
| Geekbench 4.4 | |
| 64 Bit Single-Core Score | |
| Média da turma Tablet (4231 - 9867, n=8, últimos 2 anos) | |
| Acer Iconia Tab 10 A3-A50 | |
| Amazon Fire HD 10 2017 | |
| Média HiSilicon Kirin 659 (869 - 946, n=8) | |
| Huawei MediaPad T5 10 | |
| Medion Lifetab P10606 | |
| Asus ZenPad 10 (Z301ML) | |
| 64 Bit Multi-Core Score | |
| Média da turma Tablet (11144 - 28034, n=8, últimos 2 anos) | |
| Média HiSilicon Kirin 659 (3316 - 3805, n=8) | |
| Huawei MediaPad T5 10 | |
| Amazon Fire HD 10 2017 | |
| Acer Iconia Tab 10 A3-A50 | |
| Medion Lifetab P10606 | |
| Asus ZenPad 10 (Z301ML) | |
| Compute RenderScript Score | |
| Média da turma Tablet (8856 - 22243, n=5, últimos 2 anos) | |
| Acer Iconia Tab 10 A3-A50 | |
| Huawei MediaPad T5 10 | |
| Média HiSilicon Kirin 659 (2772 - 3148, n=8) | |
| Medion Lifetab P10606 | |
| Amazon Fire HD 10 2017 | |
| Asus ZenPad 10 (Z301ML) | |
| GFXBench (DX / GLBenchmark) 2.7 | |
| T-Rex Onscreen | |
| Média da turma Tablet (22 - 165, n=57, últimos 2 anos) | |
| Amazon Fire HD 10 2017 | |
| Huawei MediaPad T5 10 | |
| Média HiSilicon Kirin 659 (16 - 20, n=8) | |
| Acer Iconia Tab 10 A3-A50 | |
| Medion Lifetab P10606 | |
| Asus ZenPad 10 (Z301ML) | |
| 1920x1080 T-Rex Offscreen | |
| Média da turma Tablet (24 - 886, n=57, últimos 2 anos) | |
| Amazon Fire HD 10 2017 | |
| Huawei MediaPad T5 10 | |
| Média HiSilicon Kirin 659 (16 - 20, n=8) | |
| Acer Iconia Tab 10 A3-A50 | |
| Medion Lifetab P10606 | |
| Asus ZenPad 10 (Z301ML) | |
| GFXBench 3.0 | |
| on screen Manhattan Onscreen OGL | |
| Média da turma Tablet (14 - 165, n=57, últimos 2 anos) | |
| Amazon Fire HD 10 2017 | |
| Huawei MediaPad T5 10 | |
| Acer Iconia Tab 10 A3-A50 | |
| Média HiSilicon Kirin 659 (6.7 - 8.9, n=8) | |
| Medion Lifetab P10606 | |
| Asus ZenPad 10 (Z301ML) | |
| 1920x1080 1080p Manhattan Offscreen | |
| Média da turma Tablet (15 - 532, n=57, últimos 2 anos) | |
| Amazon Fire HD 10 2017 | |
| Acer Iconia Tab 10 A3-A50 | |
| Huawei MediaPad T5 10 | |
| Média HiSilicon Kirin 659 (7.3 - 8.8, n=8) | |
| Medion Lifetab P10606 | |
| Asus ZenPad 10 (Z301ML) | |
| GFXBench 3.1 | |
| on screen Manhattan ES 3.1 Onscreen | |
| Média da turma Tablet (9.2 - 160, n=57, últimos 2 anos) | |
| Acer Iconia Tab 10 A3-A50 | |
| Média HiSilicon Kirin 659 (4.5 - 5.6, n=8) | |
| Huawei MediaPad T5 10 | |
| Amazon Fire HD 10 2017 | |
| Asus ZenPad 10 (Z301ML) | |
| Medion Lifetab P10606 | |
| 1920x1080 Manhattan ES 3.1 Offscreen | |
| Média da turma Tablet (9.8 - 361, n=57, últimos 2 anos) | |
| Acer Iconia Tab 10 A3-A50 | |
| Huawei MediaPad T5 10 | |
| Amazon Fire HD 10 2017 | |
| Média HiSilicon Kirin 659 (3.2 - 5.4, n=8) | |
| Medion Lifetab P10606 | |
| Asus ZenPad 10 (Z301ML) | |
| GFXBench | |
| on screen Car Chase Onscreen | |
| Média da turma Tablet (3.8 - 110, n=57, últimos 2 anos) | |
| Acer Iconia Tab 10 A3-A50 | |
| Média HiSilicon Kirin 659 (2.7 - 3.3, n=8) | |
| Huawei MediaPad T5 10 | |
| Medion Lifetab P10606 | |
| Amazon Fire HD 10 2017 | |
| 1920x1080 Car Chase Offscreen | |
| Média da turma Tablet (4 - 256, n=57, últimos 2 anos) | |
| Huawei MediaPad T5 10 | |
| Média HiSilicon Kirin 659 (2.9 - 3.2, n=8) | |
| Acer Iconia Tab 10 A3-A50 | |
| Medion Lifetab P10606 | |
| Amazon Fire HD 10 2017 | |
| Octane V2 - Total Score | |
| Média da turma Tablet (1633 - 138481, n=71, últimos 2 anos) | |
| Acer Iconia Tab 10 A3-A50 (Browser: Chrome Version 63) | |
| Amazon Fire HD 10 2017 (Amazon Silk 61.2) | |
| Huawei MediaPad T5 10 (Chrome 67) | |
| Média HiSilicon Kirin 659 (4191 - 5471, n=8) | |
| Medion Lifetab P10606 (Chrome 60) | |
| Asus ZenPad 10 (Z301ML) (Chrome 59) | |
| WebXPRT 2015 - Overall | |
| Amazon Fire HD 10 2017 (Amazon Silk 61.2) | |
| Huawei MediaPad T5 10 (Chrome 67) | |
| Média HiSilicon Kirin 659 (86 - 120, n=8) | |
| Medion Lifetab P10606 (Chrome 60) | |
| Asus ZenPad 10 (Z301ML) (Chrome 59) | |
| JetStream 1.1 - 1.1 Total | |
| Acer Iconia Tab 10 A3-A50 (Browser: Chrome Version 63) | |
| Amazon Fire HD 10 2017 (Amazon Silk 61.2) | |
| Huawei MediaPad T5 10 (Chrome 67) | |
| Média HiSilicon Kirin 659 (23.4 - 31.3, n=8) | |
| Medion Lifetab P10606 (Chrome 60) | |
| Asus ZenPad 10 (Z301ML) (Chrome 59) | |
| Mozilla Kraken 1.1 - Total | |
| Asus ZenPad 10 (Z301ML) (Chrome 59) | |
| Medion Lifetab P10606 (Chrome 60) | |
| Média HiSilicon Kirin 659 (8684 - 10788, n=8) | |
| Huawei MediaPad T5 10 (Chrome 67) | |
| Amazon Fire HD 10 2017 (Amazon Silk 61.2) | |
| Acer Iconia Tab 10 A3-A50 (Browser: Chrome Version 63) | |
| Média da turma Tablet (243 - 16233, n=65, últimos 2 anos) | |
* ... menor é melhor
| Huawei MediaPad T5 10 | Medion Lifetab P10606 | Acer Iconia Tab 10 A3-A50 | Amazon Fire HD 10 2017 | Asus ZenPad 10 (Z301ML) | Média 32 GB eMMC Flash | Média da turma Tablet | |
|---|---|---|---|---|---|---|---|
| AndroBench 3-5 | -30% | -38% | -31% | -52% | -26% | 760% | |
| Sequential Read 256KB (MB/s) | 312.2 | 274.7 -12% | 173.7 -44% | 262.2 -16% | 216 -31% | 242 ? -22% | 2073 ? 564% |
| Sequential Write 256KB (MB/s) | 83.8 | 74.2 -11% | 92.4 10% | 147.7 76% | 66 -21% | 100.5 ? 20% | 1667 ? 1889% |
| Random Read 4KB (MB/s) | 76.7 | 34.59 -55% | 13.7 -82% | 27.72 -64% | 23 -70% | 43.1 ? -44% | 275 ? 259% |
| Random Write 4KB (MB/s) | 76.1 | 12.02 -84% | 8.77 -88% | 9.37 -88% | 9.8 -87% | 22.3 ? -71% | 324 ? 326% |
| Sequential Read 256KB SDCard (MB/s) | 83.9 ? | 79.6 ? -5% | 80.4 ? -4% | 55.5 ? -34% | 40.9 -51% | 71.8 ? -14% | |
| Sequential Write 256KB SDCard (MB/s) | 72.5 ? | 64.9 ? -10% | 56.8 ? -22% | 30.14 ? -58% | 34.9 -52% | 52.9 ? -27% |
| Dead Trigger 2 | |||
| Configurações | Valor | ||
| high | 30 fps | ||
| Arena of Valor | |||
| Configurações | Valor | ||
| min | 31 fps | ||
| high HD | 31 fps | ||
(+) A temperatura máxima no lado superior é 32.8 °C / 91 F, em comparação com a média de 33.7 °C / 93 F , variando de 20.7 a 53.2 °C para a classe Tablet.
(+) A parte inferior aquece até um máximo de 30.5 °C / 87 F, em comparação com a média de 33.2 °C / 92 F
(+) Em uso inativo, a temperatura média para o lado superior é 28.6 °C / 83 F, em comparação com a média do dispositivo de 30 °C / ### class_avg_f### F.
Huawei MediaPad T5 10 análise de áudio
(+) | os alto-falantes podem tocar relativamente alto (###valor### dB)
Graves 100 - 315Hz
(-) | quase nenhum baixo - em média 30.4% menor que a mediana
(±) | a linearidade dos graves é média (12% delta para a frequência anterior)
Médios 400 - 2.000 Hz
(+) | médios equilibrados - apenas 3.5% longe da mediana
(+) | médios são lineares (5.3% delta para frequência anterior)
Altos 2 - 16 kHz
(±) | máximos mais altos - em média 6.9% maior que a mediana
(+) | os máximos são lineares (3.1% delta da frequência anterior)
Geral 100 - 16.000 Hz
(±) | a linearidade do som geral é média (22% diferença em relação à mediana)
Comparado com a mesma classe
» 68% de todos os dispositivos testados nesta classe foram melhores, 6% semelhantes, 26% piores
» O melhor teve um delta de 7%, a média foi 20%, o pior foi 129%
Comparado com todos os dispositivos testados
» 64% de todos os dispositivos testados foram melhores, 6% semelhantes, 30% piores
» O melhor teve um delta de 4%, a média foi 23%, o pior foi 134%
Medion Lifetab P10606 análise de áudio
(±) | o volume do alto-falante é médio, mas bom (###valor### dB)
Graves 100 - 315Hz
(-) | quase nenhum baixo - em média 23.1% menor que a mediana
(±) | a linearidade dos graves é média (11.5% delta para a frequência anterior)
Médios 400 - 2.000 Hz
(±) | médios mais altos - em média 5.4% maior que a mediana
(+) | médios são lineares (6.8% delta para frequência anterior)
Altos 2 - 16 kHz
(+) | agudos equilibrados - apenas 3.7% longe da mediana
(+) | os máximos são lineares (4.9% delta da frequência anterior)
Geral 100 - 16.000 Hz
(±) | a linearidade do som geral é média (25.4% diferença em relação à mediana)
Comparado com a mesma classe
» 81% de todos os dispositivos testados nesta classe foram melhores, 3% semelhantes, 16% piores
» O melhor teve um delta de 7%, a média foi 20%, o pior foi 129%
Comparado com todos os dispositivos testados
» 78% de todos os dispositivos testados foram melhores, 5% semelhantes, 17% piores
» O melhor teve um delta de 4%, a média foi 23%, o pior foi 134%
| desligado | |
| Ocioso | |
| Carga |
|
Key:
min: | |
| Huawei MediaPad T5 10 5100 mAh | Medion Lifetab P10606 7000 mAh | Acer Iconia Tab 10 A3-A50 6100 mAh | Amazon Fire HD 10 2017 6300 mAh | Asus ZenPad 10 (Z301ML) 4680 mAh | |
|---|---|---|---|---|---|
| Power Consumption | 33% | 10% | 38% | 60% | |
| Idle Minimum * (Watt) | 2.33 | 1.4 40% | 3.21 -38% | 1.55 33% | 0.76 67% |
| Idle Average * (Watt) | 8.46 | 4.17 51% | 5.97 29% | 4.17 51% | 3.23 62% |
| Idle Maximum * (Watt) | 8.49 | 4.2 51% | 6.19 27% | 4.25 50% | 3.35 61% |
| Load Average * (Watt) | 11.14 | 7.5 33% | 9.72 13% | 7.13 36% | 4.79 57% |
| Load Maximum * (Watt) | 12.3 | 13.71 -11% | 9.97 19% | 9.63 22% | 5.72 53% |
* ... menor é melhor
| Huawei MediaPad T5 10 5100 mAh | Medion Lifetab P10606 7000 mAh | Acer Iconia Tab 10 A3-A50 6100 mAh | Amazon Fire HD 10 2017 6300 mAh | Asus ZenPad 10 (Z301ML) 4680 mAh | |
|---|---|---|---|---|---|
| Duração da bateria | 26% | -44% | -13% | -10% | |
| Reader / Idle (h) | 55.5 | 25.1 -55% | 12.3 -78% | 16 -71% | 22 -60% |
| H.264 (h) | 9.7 | 11 13% | 9.8 1% | 10.4 7% | |
| WiFi v1.3 (h) | 8.8 | 13.3 51% | 6.5 -26% | 9 2% | 7.8 -11% |
| Load (h) | 4 | 7.7 93% | 2.9 -27% | 4.6 15% | 5 25% |
Pro
Contra
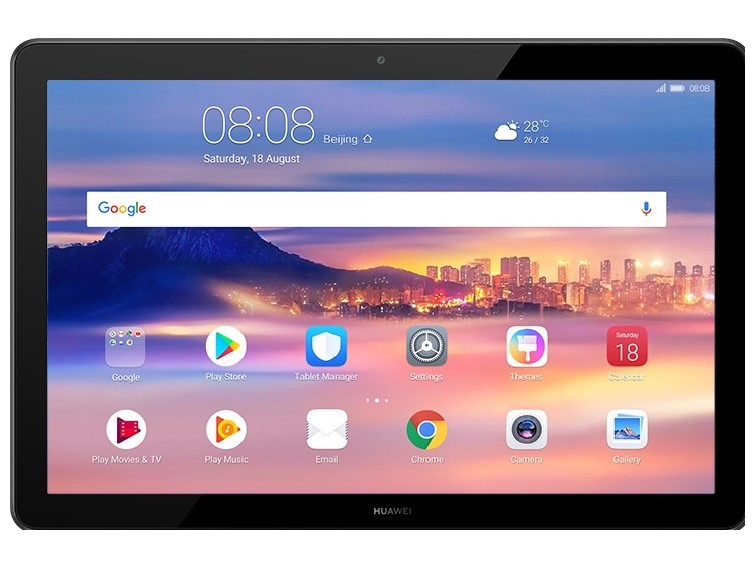
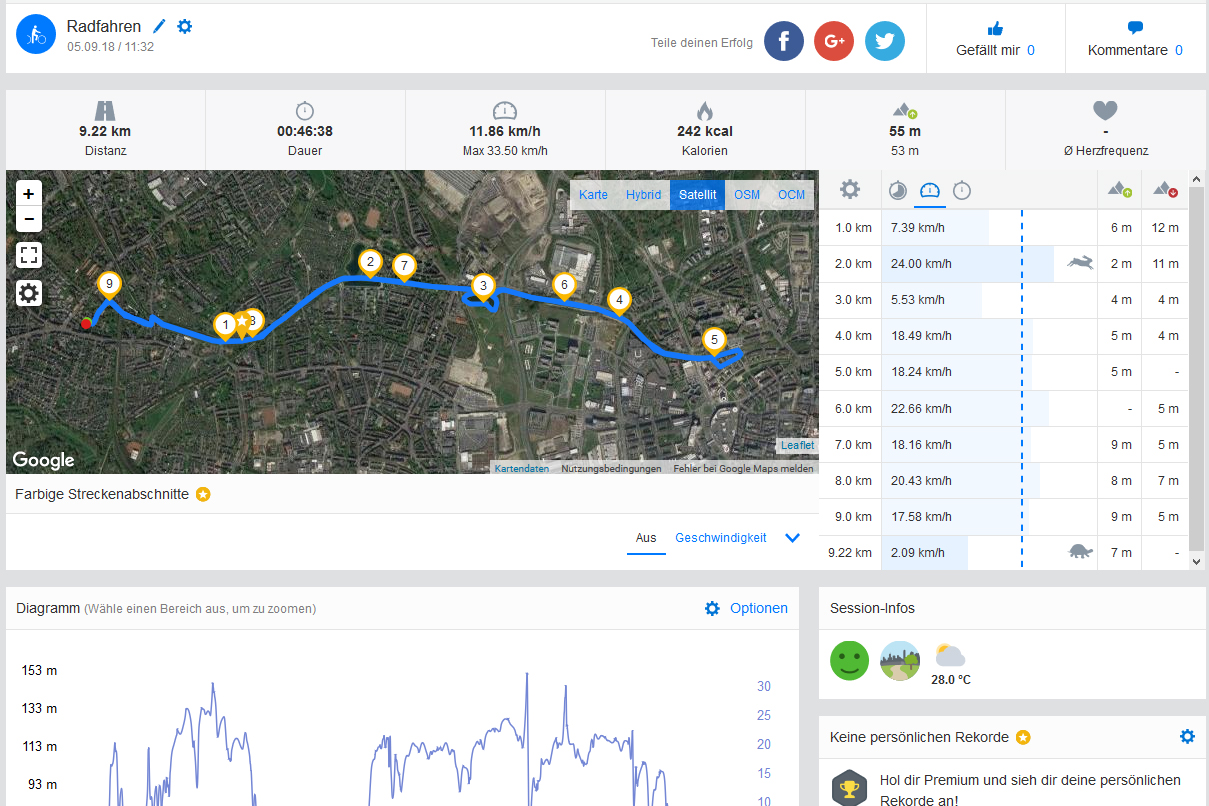
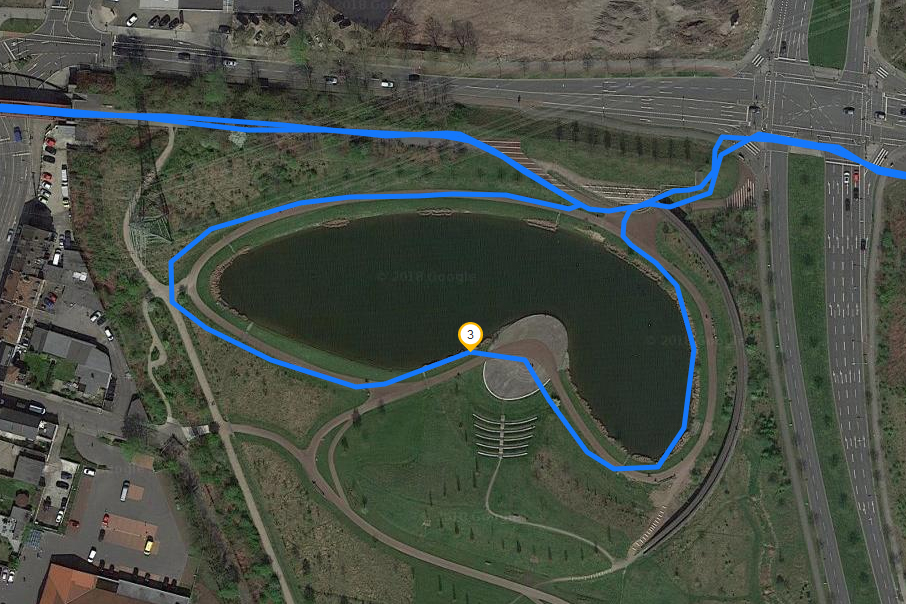
Durante nossos testes, o MediaPad T5 apresentou-se como um tablet de alto desempenho, adequado para a maioria das necessidades do dia a dia, seja navegando na web ou jogando. Graças à sua tela de 10 polegadas, ele conseguiu se manter razoavelmente portátil.
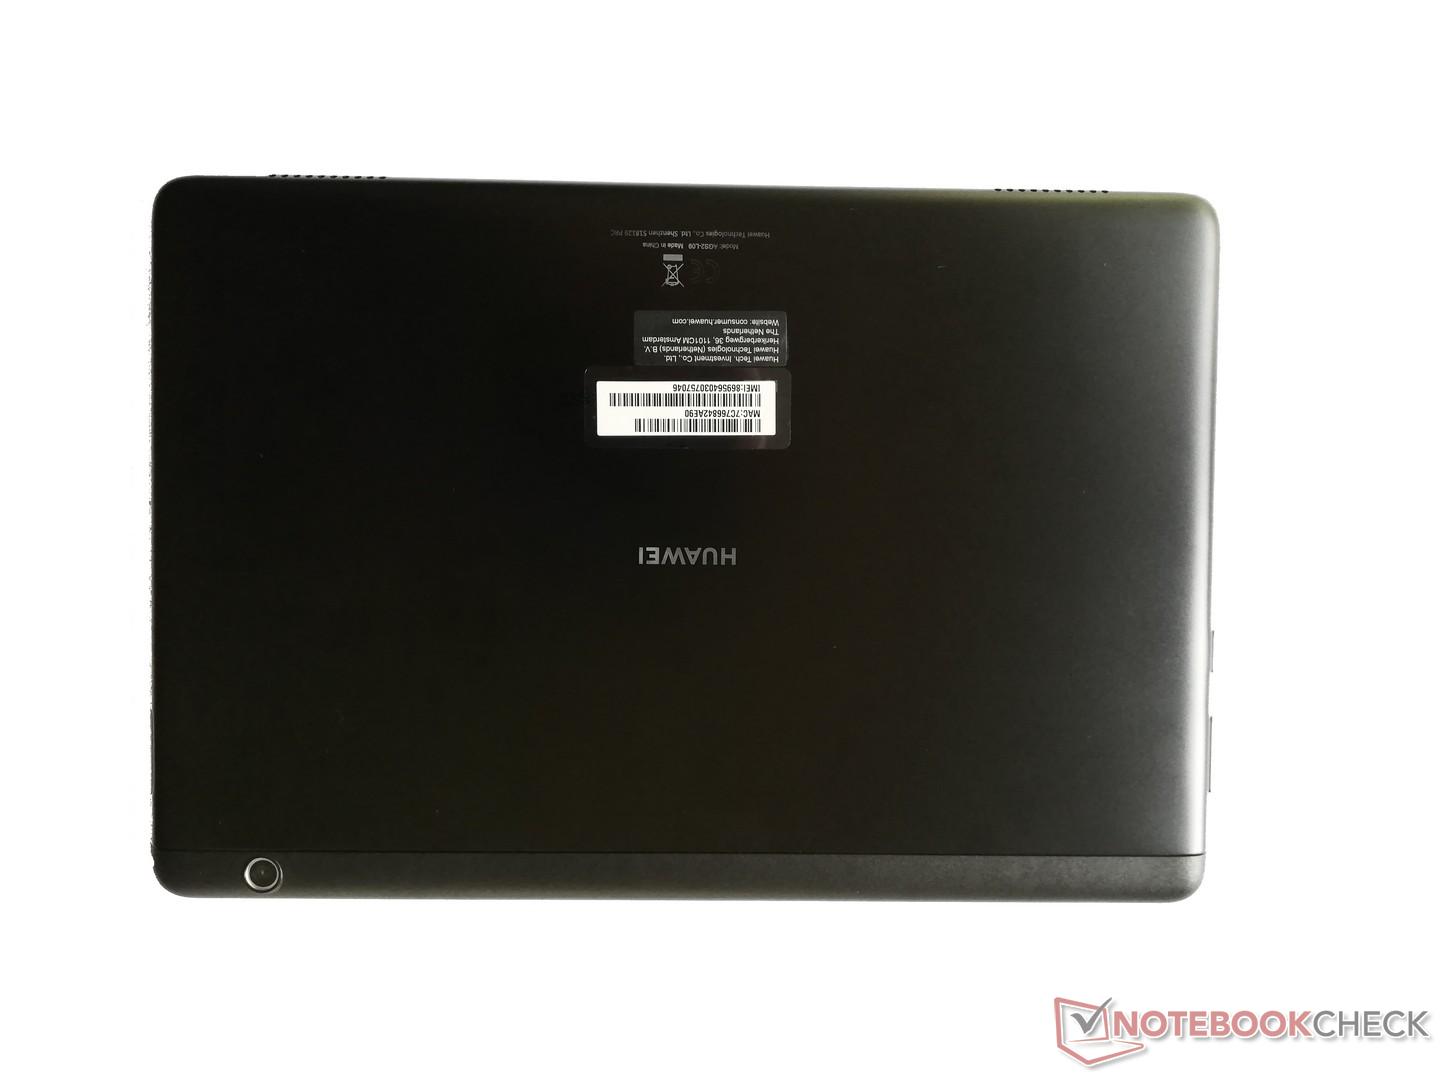
O Huawei MediaPad T5 oferece muito desempenho a um preço baixo. No entanto, o fabricante reduziu a conectividade.
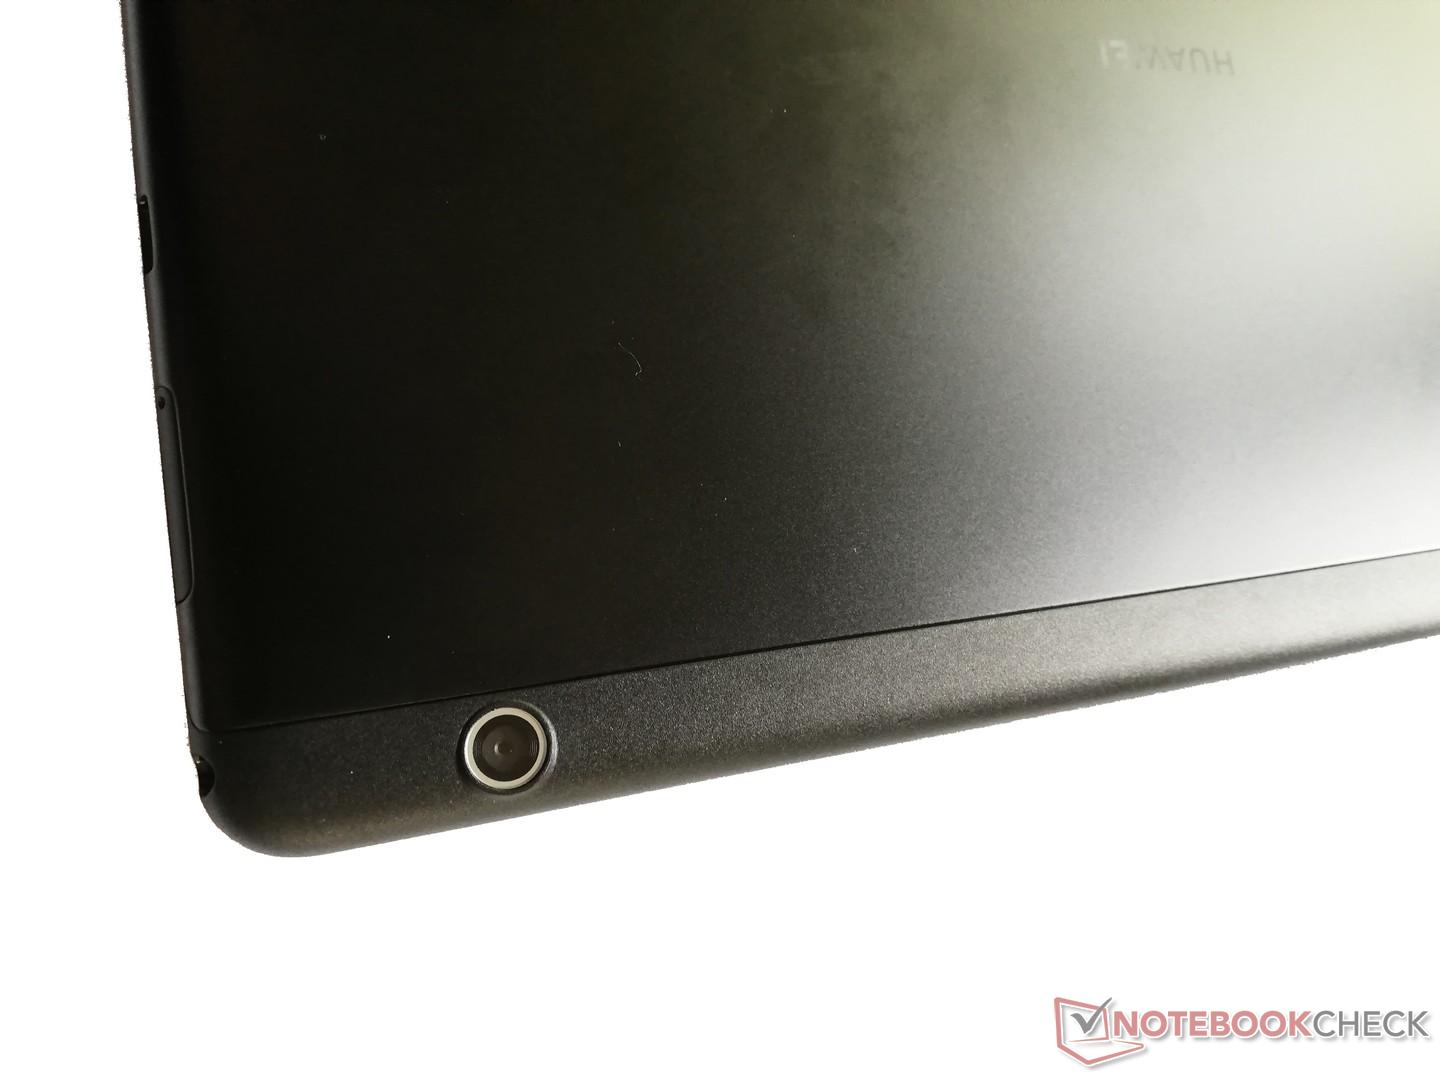
Seu preço de cerca de $230 significa que algumas modificações eram inevitáveis. Vamos pegar as câmeras, por exemplo: elas mal são boas o suficiente para fotos ocasionais. Ou o relativamente pequeno armazenamento interno de apenas 32 GB, que pode ser expandido via cartão microSD, mas apenas para armazenar arquivos de mídia, não aplicativos. Nossa maior reclamação, no entanto, foi o tempo de carregamento desnecessariamente longo, o que pode não incomodá-lo se você não se importar com a falta do Quick Charge. O tablet também não tinha recursos como um leitor de digitais ou ajuste automático de brilho.
Huawei MediaPad T5 10
- 11/05/2019 v7 (old)
Mike Wobker
Price comparison
