Breve Análise do Tablet Lenovo Tab 3 10 Business TB3-X70L
| Networking | |
| iperf3 transmit AX12 | |
| Apple iPhone 7 (Klaus I211) | |
| OnePlus 3 | |
| Lenovo Tab 3 10 Business TB3-X70L | |
| iperf3 receive AX12 | |
| Apple iPhone 7 (Klaus I211) | |
| OnePlus 3 | |
| Lenovo Tab 3 10 Business TB3-X70L | |


| |||||||||||||||||||||||||
iluminação: 92 %
iluminação com acumulador: 435 cd/m²
Contraste: 1279:1 (Preto: 0.34 cd/m²)
ΔE ColorChecker Calman: 4.1 | ∀{0.5-29.43 Ø4.71}
ΔE Greyscale Calman: 4.4 | ∀{0.09-98 Ø4.96}
Gamma: 2.11
CCT: 7414 K
| Lenovo Tab 3 10 Business TB3-X70L IPS, 1920x1200, 10.1" | Huawei MediaPad M2 10 inch IPS, 1920x1200, 10.1" | HP Pro Tablet 10 EE G1 IPS, 1280x800, 10.1" | Samsung Galaxy Tab A 10.1 2016 SM-T585 TFT, 1920x1200, 10.1" | LG G Pad II 10.1 AH-IPS, 1920x1200, 10.1" | |
|---|---|---|---|---|---|
| Screen | -16% | -12% | -10% | -17% | |
| Brightness middle (cd/m²) | 435 | 385 -11% | 389 -11% | 542 25% | 355 -18% |
| Brightness (cd/m²) | 425 | 383 -10% | 357 -16% | 520 22% | 367 -14% |
| Brightness Distribution (%) | 92 | 91 -1% | 71 -23% | 91 -1% | 89 -3% |
| Black Level * (cd/m²) | 0.34 | 0.41 -21% | 0.41 -21% | 0.68 -100% | 0.53 -56% |
| Contrast (:1) | 1279 | 939 -27% | 949 -26% | 797 -38% | 670 -48% |
| Colorchecker dE 2000 * | 4.1 | 5.31 -30% | 4.64 -13% | 4.2 -2% | 3.2 22% |
| Colorchecker dE 2000 max. * | 8.5 | 8.57 -1% | 11.97 -41% | 6.7 21% | |
| Greyscale dE 2000 * | 4.4 | 5.58 -27% | 1.96 55% | 4.8 -9% | 4.36 1% |
| Gamma | 2.11 104% | 2.4 92% | 2.43 91% | 2.42 91% | 2.2 100% |
| CCT | 7414 88% | 7044 92% | 6414 101% | 7434 87% | 7240 90% |
| Color Space (Percent of AdobeRGB 1998) (%) | 38 | ||||
| Color Space (Percent of sRGB) (%) | 60 |
* ... menor é melhor
Exibir tempos de resposta
| ↔ Tempo de resposta preto para branco | ||
|---|---|---|
| 26 ms ... ascensão ↗ e queda ↘ combinadas | ↗ 11 ms ascensão | 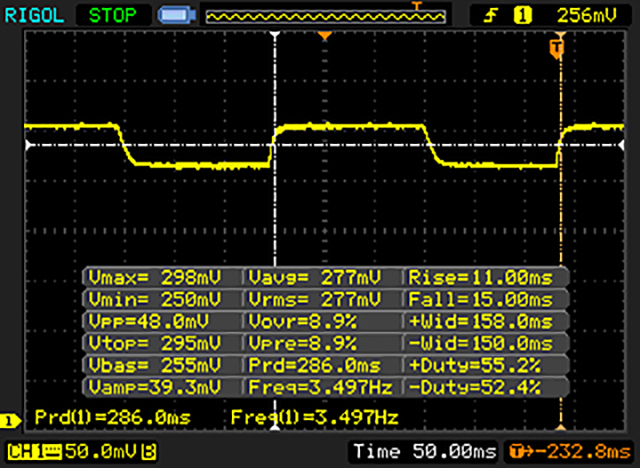 |
| ↘ 15 ms queda | ||
| A tela mostra taxas de resposta relativamente lentas em nossos testes e pode ser muito lenta para os jogadores. Em comparação, todos os dispositivos testados variam de 0.1 (mínimo) a 240 (máximo) ms. » 63 % de todos os dispositivos são melhores. Isso significa que o tempo de resposta medido é pior que a média de todos os dispositivos testados (19.8 ms). | ||
| ↔ Tempo de resposta 50% cinza a 80% cinza | ||
| 40 ms ... ascensão ↗ e queda ↘ combinadas | ↗ 19 ms ascensão | 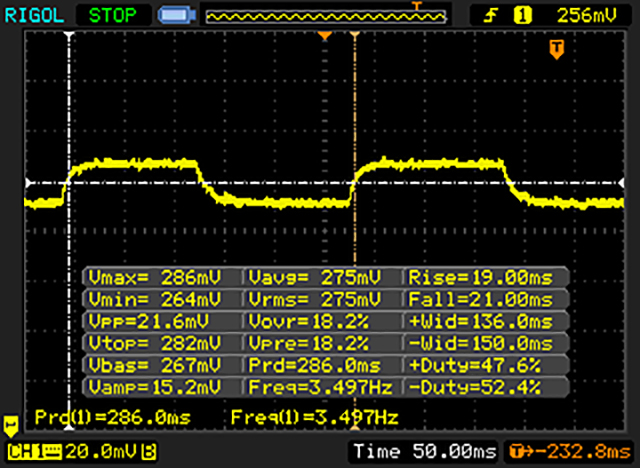 |
| ↘ 21 ms queda | ||
| A tela mostra taxas de resposta lentas em nossos testes e será insatisfatória para os jogadores. Em comparação, todos os dispositivos testados variam de 0.165 (mínimo) a 636 (máximo) ms. » 61 % de todos os dispositivos são melhores. Isso significa que o tempo de resposta medido é pior que a média de todos os dispositivos testados (30.9 ms). | ||
Cintilação da tela / PWM (modulação por largura de pulso)
| Tela tremeluzindo / PWM não detectado | 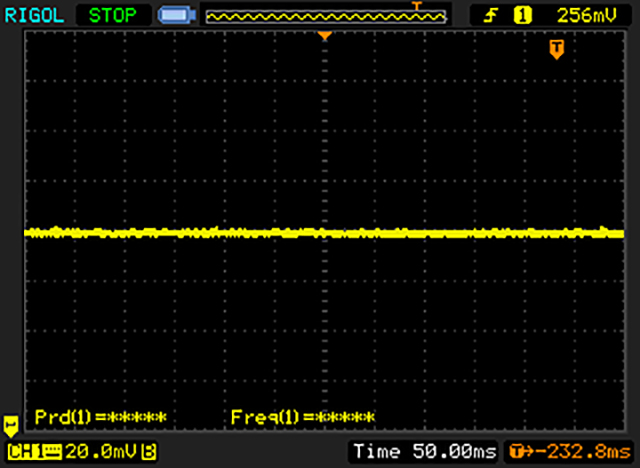 | ||
[pwm_comparison] Em comparação: 52 % de todos os dispositivos testados não usam PWM para escurecer a tela. Se PWM foi detectado, uma média de 7744 (mínimo: 5 - máximo: 343500) Hz foi medida. | |||
| AnTuTu v6 - Total Score | |
| Huawei MediaPad M2 10 inch | |
| Samsung Galaxy Tab A 10.1 2016 SM-T585 | |
| Lenovo Tab 3 10 Business TB3-X70L | |
| 3DMark | |
| 1280x720 offscreen Ice Storm Unlimited Score | |
| LG G Pad II 10.1 | |
| Huawei MediaPad M2 10 inch | |
| Samsung Galaxy Tab A 10.1 2016 SM-T585 | |
| Lenovo Tab 3 10 Business TB3-X70L | |
| 1280x720 offscreen Ice Storm Unlimited Graphics Score | |
| LG G Pad II 10.1 | |
| Huawei MediaPad M2 10 inch | |
| Samsung Galaxy Tab A 10.1 2016 SM-T585 | |
| Lenovo Tab 3 10 Business TB3-X70L | |
| 1280x720 offscreen Ice Storm Unlimited Physics | |
| LG G Pad II 10.1 | |
| Samsung Galaxy Tab A 10.1 2016 SM-T585 | |
| Huawei MediaPad M2 10 inch | |
| Lenovo Tab 3 10 Business TB3-X70L | |
| 2560x1440 Sling Shot OpenGL ES 3.0 | |
| Samsung Galaxy Tab A 10.1 2016 SM-T585 | |
| Lenovo Tab 3 10 Business TB3-X70L | |
| Huawei MediaPad M2 10 inch | |
| 2560x1440 Sling Shot OpenGL ES 3.0 Graphics | |
| Samsung Galaxy Tab A 10.1 2016 SM-T585 | |
| Lenovo Tab 3 10 Business TB3-X70L | |
| 2560x1440 Sling Shot OpenGL ES 3.0 Physics | |
| Samsung Galaxy Tab A 10.1 2016 SM-T585 | |
| Lenovo Tab 3 10 Business TB3-X70L | |
| GFXBench (DX / GLBenchmark) 2.7 | |
| T-Rex Onscreen | |
| LG G Pad II 10.1 | |
| Huawei MediaPad M2 10 inch | |
| Samsung Galaxy Tab A 10.1 2016 SM-T585 | |
| Lenovo Tab 3 10 Business TB3-X70L | |
| 1920x1080 T-Rex Offscreen | |
| LG G Pad II 10.1 | |
| Huawei MediaPad M2 10 inch | |
| Samsung Galaxy Tab A 10.1 2016 SM-T585 | |
| Lenovo Tab 3 10 Business TB3-X70L | |
| GFXBench 3.0 | |
| on screen Manhattan Onscreen OGL | |
| LG G Pad II 10.1 | |
| Huawei MediaPad M2 10 inch | |
| Samsung Galaxy Tab A 10.1 2016 SM-T585 | |
| Lenovo Tab 3 10 Business TB3-X70L | |
| 1920x1080 1080p Manhattan Offscreen | |
| LG G Pad II 10.1 | |
| Huawei MediaPad M2 10 inch | |
| Samsung Galaxy Tab A 10.1 2016 SM-T585 | |
| Lenovo Tab 3 10 Business TB3-X70L | |
| GFXBench 3.1 | |
| on screen Manhattan ES 3.1 Onscreen | |
| Lenovo Tab 3 10 Business TB3-X70L | |
| Samsung Galaxy Tab A 10.1 2016 SM-T585 | |
| 1920x1080 Manhattan ES 3.1 Offscreen | |
| Lenovo Tab 3 10 Business TB3-X70L | |
| Samsung Galaxy Tab A 10.1 2016 SM-T585 | |
| PCMark for Android - Work performance score | |
| Samsung Galaxy Tab A 10.1 2016 SM-T585 | |
| Huawei MediaPad M2 10 inch | |
| Lenovo Tab 3 10 Business TB3-X70L | |
| LG G Pad II 10.1 | |
| Geekbench 4.0 | |
| 64 Bit Single-Core Score | |
| Lenovo Tab 3 10 Business TB3-X70L | |
| 64 Bit Multi-Core Score | |
| Lenovo Tab 3 10 Business TB3-X70L | |
| Compute RenderScript Score | |
| Lenovo Tab 3 10 Business TB3-X70L | |
| Octane V2 - Total Score | |
| LG G Pad II 10.1 | |
| Huawei MediaPad M2 10 inch | |
| Samsung Galaxy Tab A 10.1 2016 SM-T585 | |
| HP Pro Tablet 10 EE G1 | |
| Lenovo Tab 3 10 Business TB3-X70L | |
| Mozilla Kraken 1.1 - Total | |
| Lenovo Tab 3 10 Business TB3-X70L | |
| Huawei MediaPad M2 10 inch | |
| Samsung Galaxy Tab A 10.1 2016 SM-T585 | |
| HP Pro Tablet 10 EE G1 | |
| LG G Pad II 10.1 | |
| JetStream 1.1 - 1.1 Total | |
| Huawei MediaPad M2 10 inch | |
| HP Pro Tablet 10 EE G1 | |
| Samsung Galaxy Tab A 10.1 2016 SM-T585 | |
| Lenovo Tab 3 10 Business TB3-X70L | |
| WebXPRT 2015 - Overall | |
| Huawei MediaPad M2 10 inch | |
| LG G Pad II 10.1 | |
| Samsung Galaxy Tab A 10.1 2016 SM-T585 | |
| Lenovo Tab 3 10 Business TB3-X70L | |
* ... menor é melhor
| Asphalt 8: Airborne | |||
| Configurações | Valor | ||
| high | 18 fps | ||
| very low | 29 fps | ||
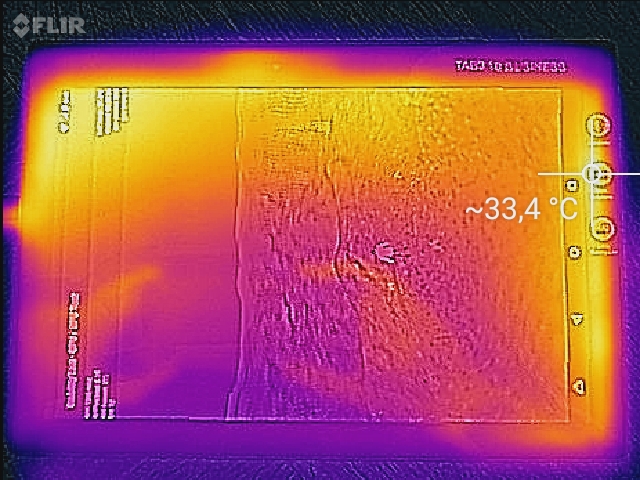
(+) A temperatura máxima no lado superior é 34.1 °C / 93 F, em comparação com a média de 33.7 °C / 93 F , variando de 20.7 a 53.2 °C para a classe Tablet.
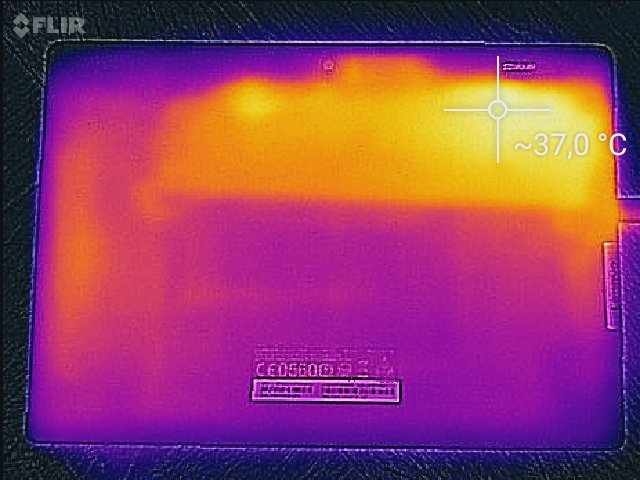
(+) A parte inferior aquece até um máximo de 35.3 °C / 96 F, em comparação com a média de 33.2 °C / 92 F
(+) Em uso inativo, a temperatura média para o lado superior é 31.3 °C / 88 F, em comparação com a média do dispositivo de 30 °C / ### class_avg_f### F.
Lenovo Tab 3 10 Business TB3-X70L análise de áudio
(+) | os alto-falantes podem tocar relativamente alto (###valor### dB)
Graves 100 - 315Hz
(-) | quase nenhum baixo - em média 32.7% menor que a mediana
(±) | a linearidade dos graves é média (11.7% delta para a frequência anterior)
Médios 400 - 2.000 Hz
(+) | médios equilibrados - apenas 4.3% longe da mediana
(±) | a linearidade dos médios é média (7.2% delta para frequência anterior)
Altos 2 - 16 kHz
(+) | agudos equilibrados - apenas 3.9% longe da mediana
(+) | os máximos são lineares (3.8% delta da frequência anterior)
Geral 100 - 16.000 Hz
(±) | a linearidade do som geral é média (24.1% diferença em relação à mediana)
Comparado com a mesma classe
» 76% de todos os dispositivos testados nesta classe foram melhores, 5% semelhantes, 19% piores
» O melhor teve um delta de 7%, a média foi 20%, o pior foi 129%
Comparado com todos os dispositivos testados
» 73% de todos os dispositivos testados foram melhores, 6% semelhantes, 21% piores
» O melhor teve um delta de 4%, a média foi 23%, o pior foi 134%
Huawei MediaPad M2 10 inch análise de áudio
(+) | os alto-falantes podem tocar relativamente alto (###valor### dB)
Graves 100 - 315Hz
(-) | quase nenhum baixo - em média 25.1% menor que a mediana
(±) | a linearidade dos graves é média (11.9% delta para a frequência anterior)
Médios 400 - 2.000 Hz
(+) | médios equilibrados - apenas 1.6% longe da mediana
(+) | médios são lineares (3.1% delta para frequência anterior)
Altos 2 - 16 kHz
(+) | agudos equilibrados - apenas 3.8% longe da mediana
(+) | os máximos são lineares (3.1% delta da frequência anterior)
Geral 100 - 16.000 Hz
(±) | a linearidade do som geral é média (17.7% diferença em relação à mediana)
Comparado com a mesma classe
» 44% de todos os dispositivos testados nesta classe foram melhores, 6% semelhantes, 50% piores
» O melhor teve um delta de 7%, a média foi 20%, o pior foi 129%
Comparado com todos os dispositivos testados
» 35% de todos os dispositivos testados foram melhores, 8% semelhantes, 56% piores
» O melhor teve um delta de 4%, a média foi 23%, o pior foi 134%
Samsung Galaxy Tab A 10.1 2016 SM-T585 análise de áudio
(+) | os alto-falantes podem tocar relativamente alto (###valor### dB)
Graves 100 - 315Hz
(-) | quase nenhum baixo - em média 35.7% menor que a mediana
(±) | a linearidade dos graves é média (11% delta para a frequência anterior)
Médios 400 - 2.000 Hz
(+) | médios equilibrados - apenas 4.2% longe da mediana
(+) | médios são lineares (5.2% delta para frequência anterior)
Altos 2 - 16 kHz
(+) | agudos equilibrados - apenas 4.1% longe da mediana
(+) | os máximos são lineares (3.5% delta da frequência anterior)
Geral 100 - 16.000 Hz
(±) | a linearidade do som geral é média (21.9% diferença em relação à mediana)
Comparado com a mesma classe
» 68% de todos os dispositivos testados nesta classe foram melhores, 5% semelhantes, 27% piores
» O melhor teve um delta de 7%, a média foi 20%, o pior foi 129%
Comparado com todos os dispositivos testados
» 63% de todos os dispositivos testados foram melhores, 7% semelhantes, 30% piores
» O melhor teve um delta de 4%, a média foi 23%, o pior foi 134%
| desligado | |
| Ocioso | |
| Carga |
|
Key:
min: | |
| Lenovo Tab 3 10 Business TB3-X70L 7000 mAh | Huawei MediaPad M2 10 inch 6660 mAh | HP Pro Tablet 10 EE G1 mAh | Samsung Galaxy Tab A 10.1 2016 SM-T585 7300 mAh | LG G Pad II 10.1 7400 mAh | |
|---|---|---|---|---|---|
| Power Consumption | 11% | -42% | 16% | -46% | |
| Idle Minimum * (Watt) | 1.7 | 1.6 6% | 3.5 -106% | 1.18 31% | 3.6 -112% |
| Idle Average * (Watt) | 4.4 | 4.13 6% | 5.5 -25% | 4.65 -6% | 6.2 -41% |
| Idle Maximum * (Watt) | 4.7 | 4.22 10% | 5.7 -21% | 4.74 -1% | 6.3 -34% |
| Load Average * (Watt) | 8.4 | 6.57 22% | 10.7 -27% | 5.75 32% | 10 -19% |
| Load Maximum * (Watt) | 9.2 | 8.32 10% | 12.2 -33% | 6.97 24% | 11.4 -24% |
* ... menor é melhor
| Lenovo Tab 3 10 Business TB3-X70L 7000 mAh | Huawei MediaPad M2 10 inch 6660 mAh | HP Pro Tablet 10 EE G1 mAh | Samsung Galaxy Tab A 10.1 2016 SM-T585 7300 mAh | LG G Pad II 10.1 7400 mAh | |
|---|---|---|---|---|---|
| Duração da bateria | 2% | -23% | 76% | 46% | |
| Reader / Idle (h) | 16.3 | 16.5 1% | 43.9 169% | 27.9 71% | |
| H.264 (h) | 9.8 | 10 2% | 14.9 52% | 17 73% | |
| WiFi v1.3 (h) | 10 | 11.6 16% | 7.7 -23% | 13.8 38% | 13 30% |
| Load (h) | 4.9 | 4.4 -10% | 7.1 45% | 5.4 10% |
Pro
Contra
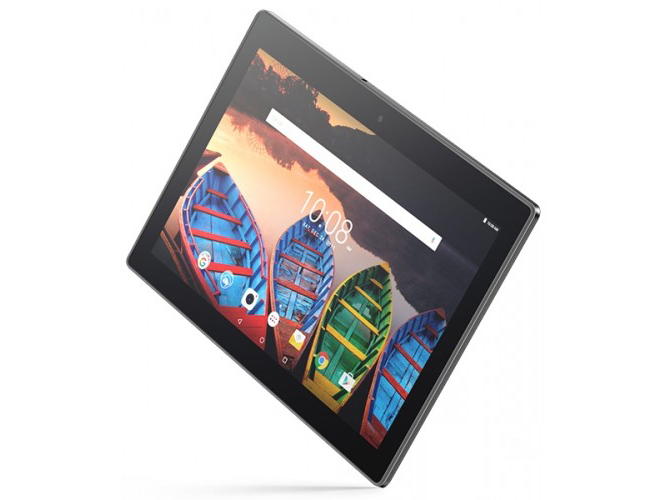
O Lenovo Tab 3 10 Business tem algumas grandes vantagens: a tela é ótima e oferece várias configurações. As temperaturas são muito boas e o WLAN ou Internet móvel é confiável. Sobre tudo: o tablet custa 300 Euros (~$328).
Há uma grande desvantagem: o desempenho do tablet é muito inferior que o dos aparelhos comparados. Jogar é difícil neste aparelho e inclusive a navegação pode ser lenta.
Felizmente a Lenovo não incluiu nenhum aplicativo bloatware e oferece boas câmeras e um módulo GPS confiável. O aparelho inclusive está certificado contra a poeira e respingos. É claro que este não é um tablet para trabalhos de construção, mas, pelo menos oferece alguma proteção. Se estiver procurando tal aparelho, recomendamos o Tablet reforçado da Panasonic ou o HP Pro Tablet 10.
O Lenovo Tab 3 10 Business é um bom e econômico tablet de escritório. Não muito desempenho, mas quase todos os recursos são incluídos.
Seu visual conservador é uma de suas melhores fortalezas. Os usuários privados, que gostam de navegar e de jogos, irão querer dar uma olhada no Samsung Galaxy Tab A 10.1.
Lenovo Tab 3 10 Business TB3-X70L
- 10/20/2016 v5.1 (old)
Florian Wimmer