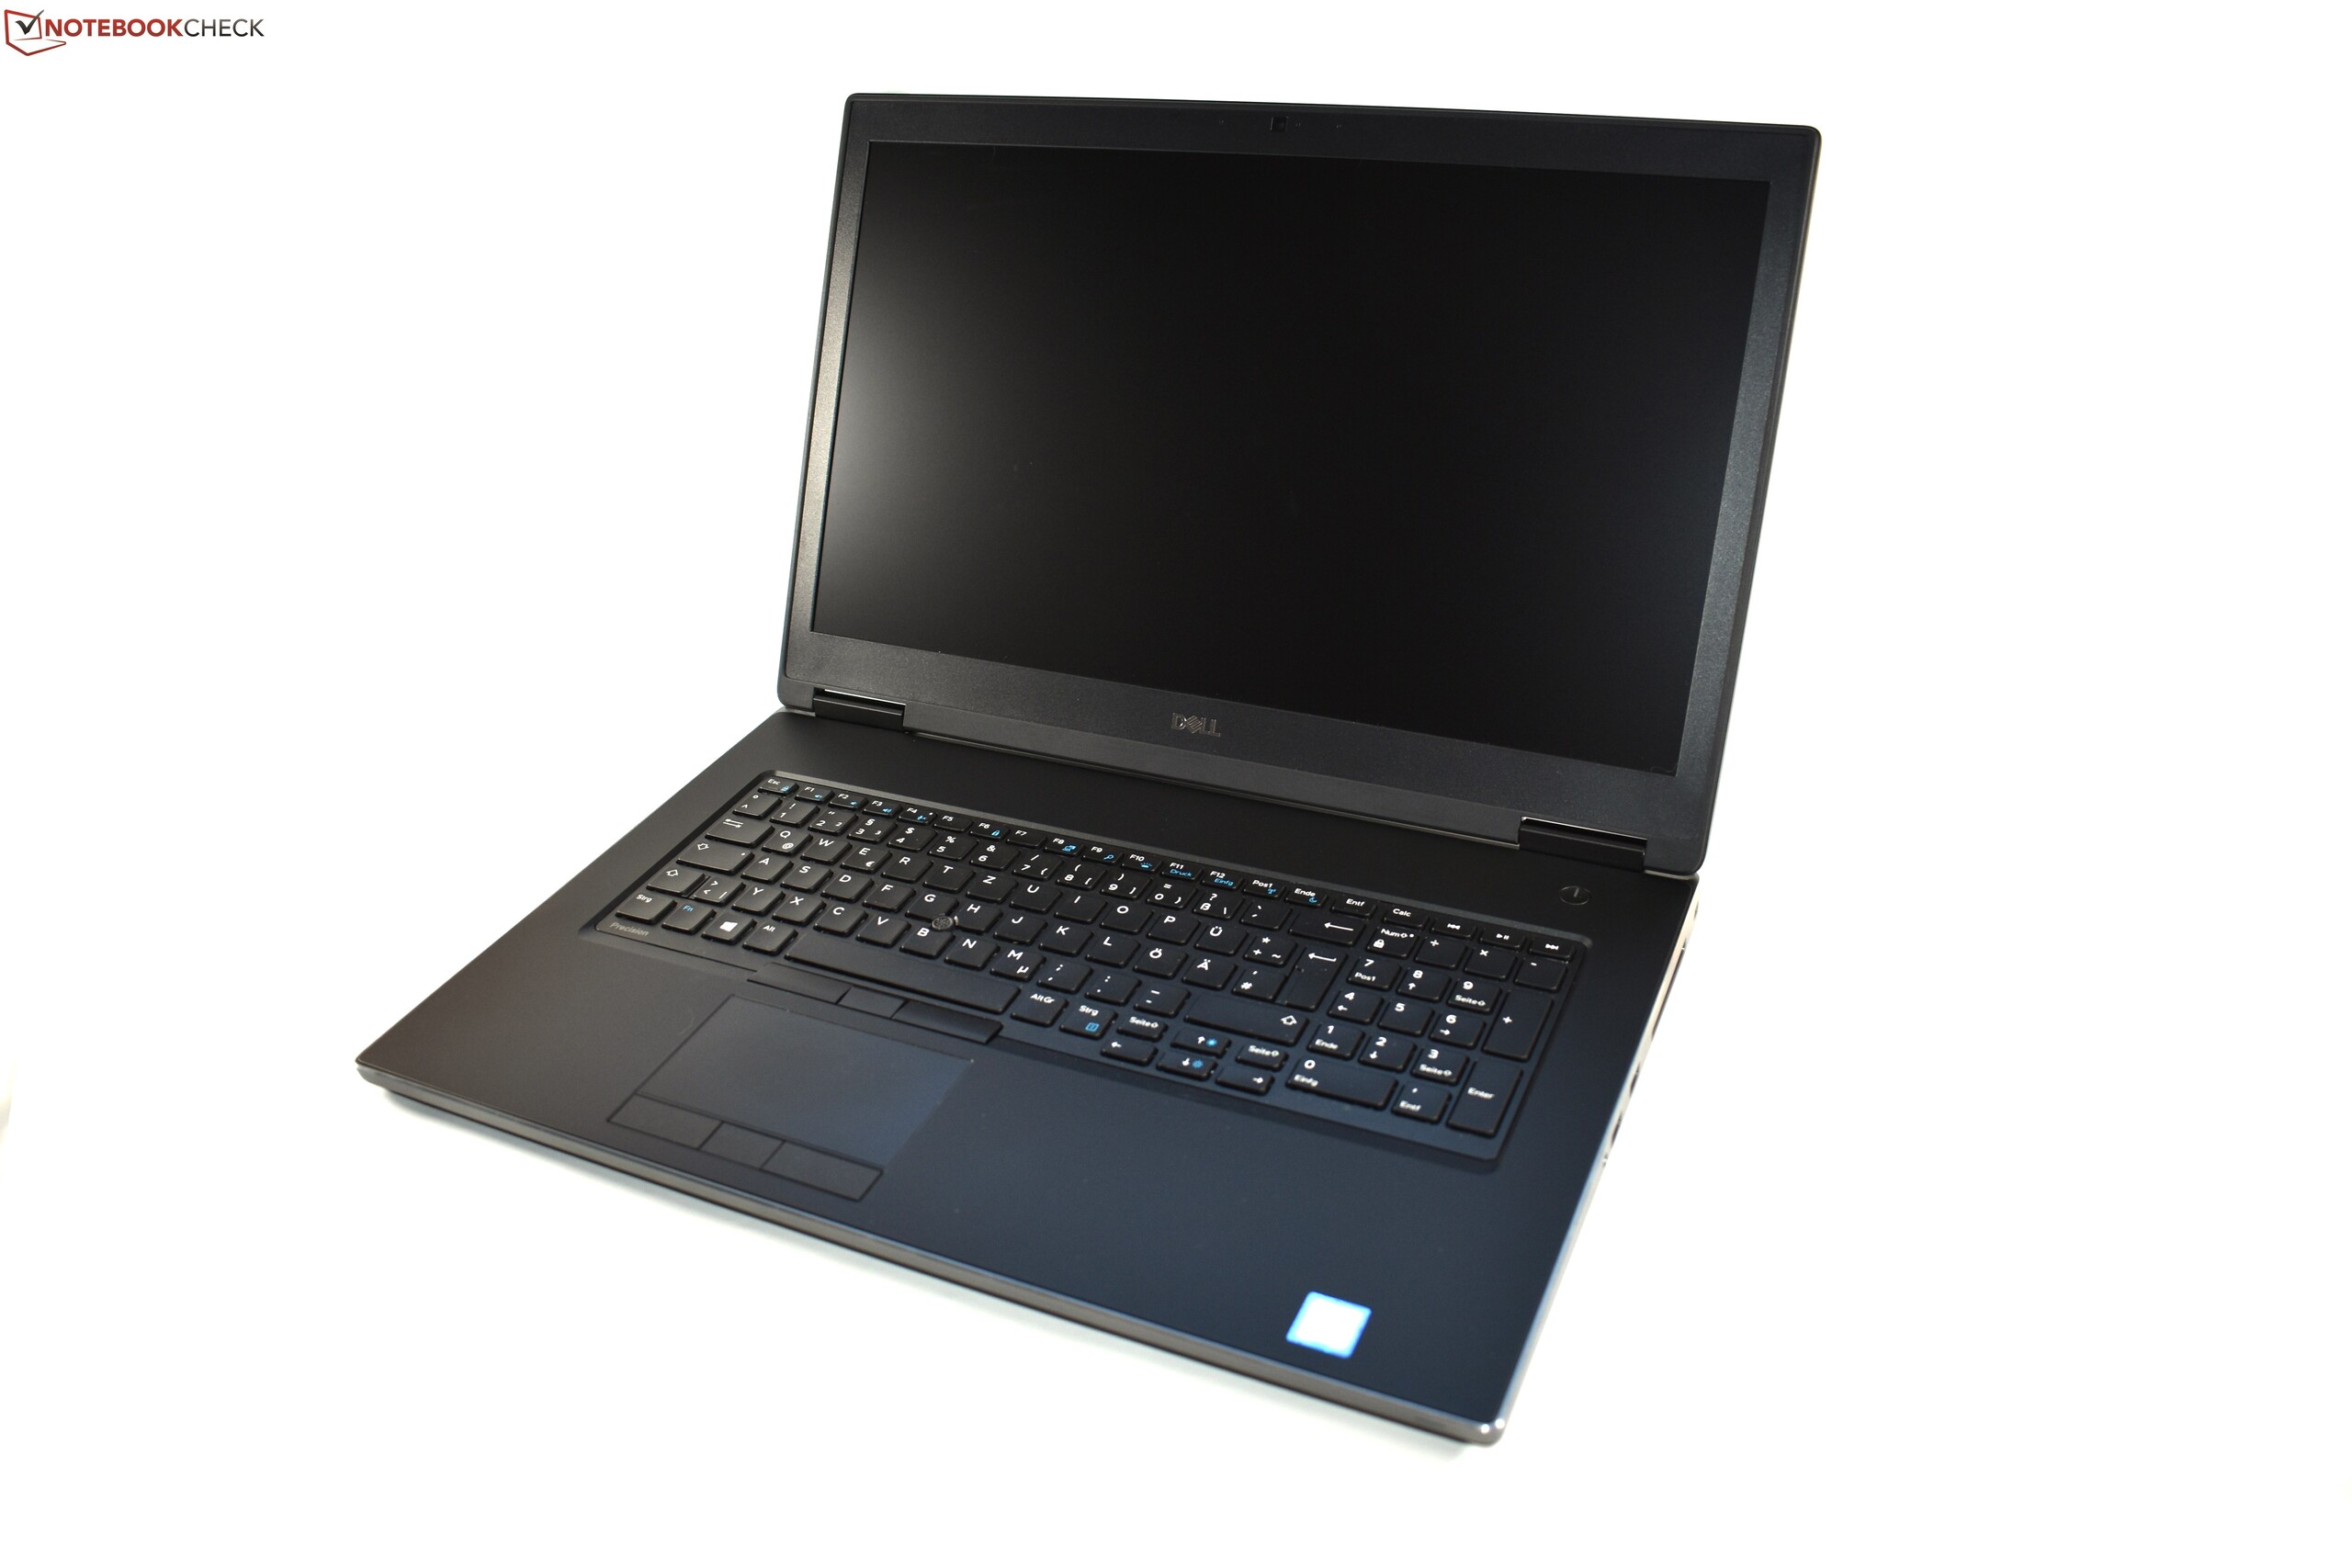
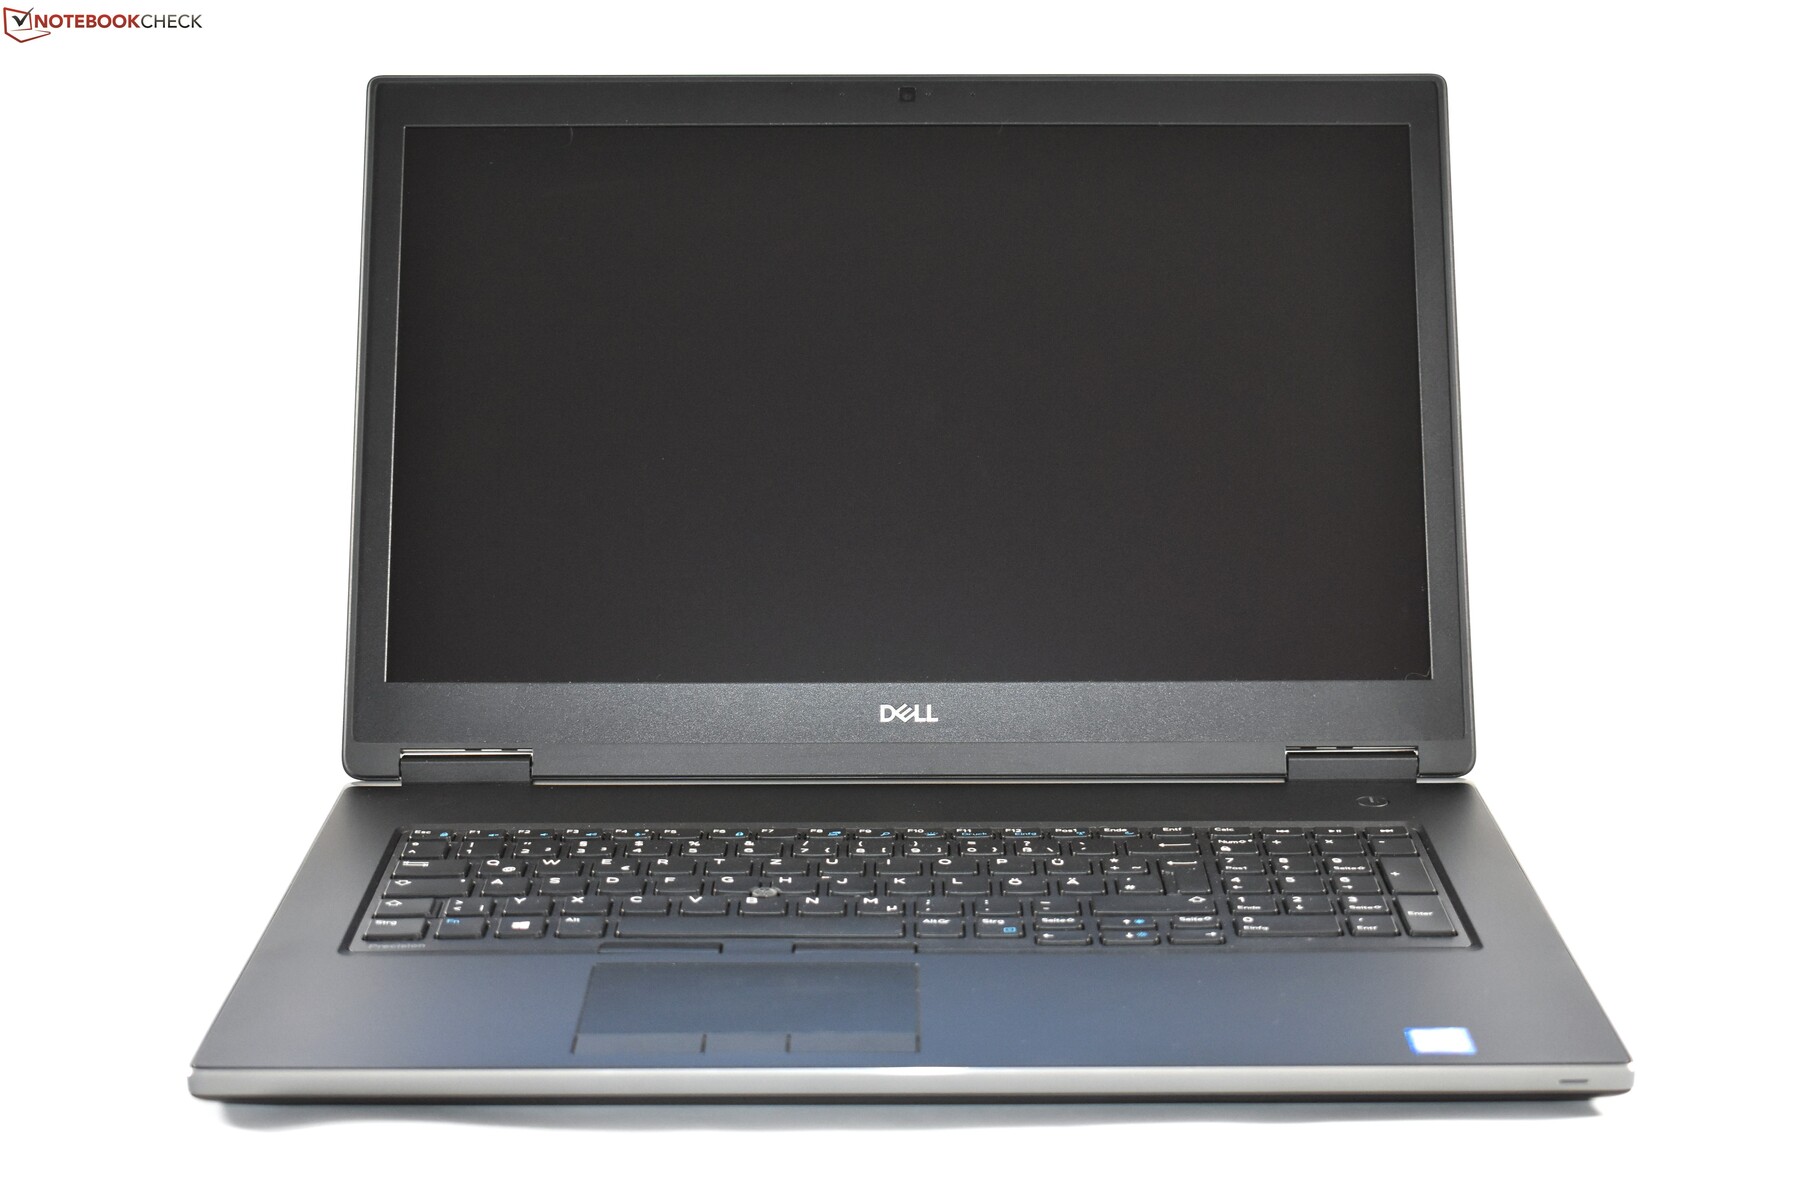
Breve Análise do Workstation Dell Precision 7730 (Core i7-8850H, Quadro P3200, FHD)
| SD Card Reader | |
| average JPG Copy Test (av. of 3 runs) | |
| Dell Precision 7730 (Toshiba Exceria Pro SDXC 64 GB UHS-II) | |
| Lenovo ThinkPad P72-20MB000EGE (Toshiba Exceria Pro SDXC 64 GB UHS-II) | |
| Fujitsu Celsius H980 (Toshiba Exceria Pro SDXC 64 GB UHS-II) | |
| Média da turma Workstation (49.6 - 681, n=14, últimos 2 anos) | |
| maximum AS SSD Seq Read Test (1GB) | |
| Média da turma Workstation (87.6 - 1455, n=14, últimos 2 anos) | |
| Dell Precision 7730 (Toshiba Exceria Pro SDXC 64 GB UHS-II) | |
| Lenovo ThinkPad P72-20MB000EGE (Toshiba Exceria Pro SDXC 64 GB UHS-II) | |
| Fujitsu Celsius H980 (Toshiba Exceria Pro SDXC 64 GB UHS-II) | |
| Networking | |
| iperf3 transmit AX12 | |
| Dell Precision 7730 | |
| Fujitsu Celsius H980 | |
| Lenovo ThinkPad P72-20MB000EGE | |
| Dell Precision 7720 | |
| iperf3 receive AX12 | |
| Fujitsu Celsius H980 | |
| Lenovo ThinkPad P72-20MB000EGE | |
| Dell Precision 7720 | |
| Dell Precision 7730 | |
| |||||||||||||||||||||||||
iluminação: 84 %
iluminação com acumulador: 322 cd/m²
Contraste: 1342:1 (Preto: 0.24 cd/m²)
ΔE ColorChecker Calman: 2.2 | ∀{0.5-29.43 Ø4.71}
calibrated: 1.9
ΔE Greyscale Calman: 1.6 | ∀{0.09-98 Ø4.96}
93.3% sRGB (Argyll 1.6.3 3D)
60.4% AdobeRGB 1998 (Argyll 1.6.3 3D)
66.3% AdobeRGB 1998 (Argyll 3D)
93.4% sRGB (Argyll 3D)
65% Display P3 (Argyll 3D)
Gamma: 2.19
CCT: 6621 K
| Dell Precision 7730 B173HAN01.3, , 1920x1080, 17.3" | Lenovo ThinkPad P72-20MB000EGE LP173WF4_SPF7, , 1920x1080, 17.3" | Fujitsu Celsius H980 LG Philips, LP173WF4-SPF5, , 1920x1080, 17.3" | Dell Precision 7720 SHP1446 (LQ173D1), , 3840x2160, 17.3" | |
|---|---|---|---|---|
| Display | -4% | -4% | 31% | |
| Display P3 Coverage (%) | 65 | 67.4 4% | 67.3 4% | 87.6 35% |
| sRGB Coverage (%) | 93.4 | 85 -9% | 85 -9% | 100 7% |
| AdobeRGB 1998 Coverage (%) | 66.3 | 62.2 -6% | 62.2 -6% | 99.2 50% |
| Response Times | 14% | 26% | -32% | |
| Response Time Grey 50% / Grey 80% * (ms) | 48.8 ? | 40.8 ? 16% | 38 ? 22% | 60 ? -23% |
| Response Time Black / White * (ms) | 32.8 ? | 28.8 ? 12% | 23.2 ? 29% | 46.4 ? -41% |
| PWM Frequency (Hz) | 120500 ? | 1020 ? | ||
| Screen | -35% | -64% | -21% | |
| Brightness middle (cd/m²) | 322 | 338 5% | 400 24% | 464 44% |
| Brightness (cd/m²) | 316 | 317 0% | 394 25% | 441 40% |
| Brightness Distribution (%) | 84 | 86 2% | 92 10% | 89 6% |
| Black Level * (cd/m²) | 0.24 | 0.28 -17% | 0.51 -113% | 0.45 -88% |
| Contrast (:1) | 1342 | 1207 -10% | 784 -42% | 1031 -23% |
| Colorchecker dE 2000 * | 2.2 | 4.3 -95% | 5.3 -141% | 3.2 -45% |
| Colorchecker dE 2000 max. * | 4.6 | 10.2 -122% | 9.3 -102% | 6.1 -33% |
| Colorchecker dE 2000 calibrated * | 1.9 | 3.7 -95% | 3.8 -100% | |
| Greyscale dE 2000 * | 1.6 | 2.2 -38% | 5.5 -244% | 4.2 -163% |
| Gamma | 2.19 100% | 2.17 101% | 2.17 101% | 2.01 109% |
| CCT | 6621 98% | 6621 98% | 6686 97% | 6736 96% |
| Color Space (Percent of AdobeRGB 1998) (%) | 60.4 | 55.8 -8% | 55.8 -8% | 88.1 46% |
| Color Space (Percent of sRGB) (%) | 93.3 | 84.7 -9% | 84.9 -9% | 100 7% |
| Média Total (Programa/Configurações) | -8% /
-23% | -14% /
-41% | -7% /
-12% |
* ... menor é melhor
Exibir tempos de resposta
| ↔ Tempo de resposta preto para branco | ||
|---|---|---|
| 32.8 ms ... ascensão ↗ e queda ↘ combinadas | ↗ 18.8 ms ascensão | 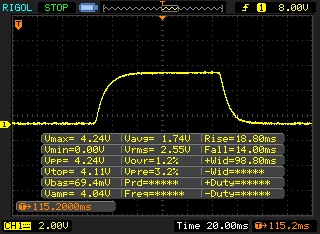 |
| ↘ 14 ms queda | ||
| A tela mostra taxas de resposta lentas em nossos testes e será insatisfatória para os jogadores. Em comparação, todos os dispositivos testados variam de 0.1 (mínimo) a 240 (máximo) ms. » 88 % de todos os dispositivos são melhores. Isso significa que o tempo de resposta medido é pior que a média de todos os dispositivos testados (19.8 ms). | ||
| ↔ Tempo de resposta 50% cinza a 80% cinza | ||
| 48.8 ms ... ascensão ↗ e queda ↘ combinadas | ↗ 24.4 ms ascensão | 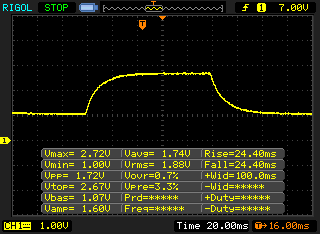 |
| ↘ 24.4 ms queda | ||
| A tela mostra taxas de resposta lentas em nossos testes e será insatisfatória para os jogadores. Em comparação, todos os dispositivos testados variam de 0.165 (mínimo) a 636 (máximo) ms. » 84 % de todos os dispositivos são melhores. Isso significa que o tempo de resposta medido é pior que a média de todos os dispositivos testados (31 ms). | ||
Cintilação da tela / PWM (modulação por largura de pulso)
| Tela tremeluzindo / PWM não detectado | 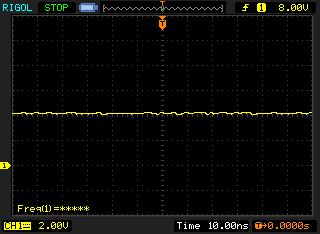 | ||
[pwm_comparison] Em comparação: 52 % de todos os dispositivos testados não usam PWM para escurecer a tela. Se PWM foi detectado, uma média de 7754 (mínimo: 5 - máximo: 343500) Hz foi medida. | |||
| Cinebench R15 | |
| CPU Single 64Bit | |
| Média da turma Workstation (191.4 - 328, n=23, últimos 2 anos) | |
| Lenovo ThinkPad P72-20MB000EGE | |
| Dell Precision 7730 | |
| Média Intel Core i7-8850H (176 - 185, n=10) | |
| Dell Precision 7720 | |
| Fujitsu Celsius H980 | |
| CPU Multi 64Bit | |
| Média da turma Workstation (2489 - 5810, n=23, últimos 2 anos) | |
| Dell Precision 7730 | |
| Lenovo ThinkPad P72-20MB000EGE | |
| Lenovo ThinkPad P72-20MB000EGE | |
| Média Intel Core i7-8850H (929 - 1276, n=15) | |
| Fujitsu Celsius H980 | |
| Dell Precision 7720 | |
| PCMark 10 | |
| Score | |
| Média da turma Workstation (6563 - 10409, n=19, últimos 2 anos) | |
| Dell Precision 7730 | |
| Média Intel Core i7-8850H, NVIDIA Quadro P3200 (5287 - 5401, n=3) | |
| Lenovo ThinkPad P72-20MB000EGE | |
| Dell Precision 7720 | |
| Fujitsu Celsius H980 | |
| Essentials | |
| Média da turma Workstation (9622 - 11157, n=19, últimos 2 anos) | |
| Dell Precision 7730 | |
| Média Intel Core i7-8850H, NVIDIA Quadro P3200 (9121 - 9251, n=2) | |
| Lenovo ThinkPad P72-20MB000EGE | |
| Dell Precision 7720 | |
| Fujitsu Celsius H980 | |
| Productivity | |
| Média da turma Workstation (8789 - 20616, n=19, últimos 2 anos) | |
| Dell Precision 7720 | |
| Lenovo ThinkPad P72-20MB000EGE | |
| Média Intel Core i7-8850H, NVIDIA Quadro P3200 (7278 - 7459, n=2) | |
| Dell Precision 7730 | |
| Fujitsu Celsius H980 | |
| Digital Content Creation | |
| Média da turma Workstation (8108 - 15631, n=19, últimos 2 anos) | |
| Fujitsu Celsius H980 | |
| Dell Precision 7720 | |
| Dell Precision 7730 | |
| Média Intel Core i7-8850H, NVIDIA Quadro P3200 (6058 - 6353, n=2) | |
| Lenovo ThinkPad P72-20MB000EGE | |
| PCMark 8 | |
| Home Score Accelerated v2 | |
| Dell Precision 7730 | |
| Lenovo ThinkPad P72-20MB000EGE | |
| Média Intel Core i7-8850H, NVIDIA Quadro P3200 (4332 - 4657, n=3) | |
| Fujitsu Celsius H980 | |
| Dell Precision 7720 | |
| Work Score Accelerated v2 | |
| Lenovo ThinkPad P72-20MB000EGE | |
| Dell Precision 7730 | |
| Média Intel Core i7-8850H, NVIDIA Quadro P3200 (5276 - 5503, n=3) | |
| Fujitsu Celsius H980 | |
| Dell Precision 7720 | |
| PCMark 8 Home Score Accelerated v2 | 4657 pontos | |
| PCMark 8 Work Score Accelerated v2 | 5450 pontos | |
| PCMark 10 Score | 5401 pontos | |
Ajuda | ||
| Dell Precision 7730 Samsung SSD PM981 MZVLB512HAJQ | Dell Precision 7720 Toshiba NVMe THNSN5512GPU7 | Lenovo ThinkPad P72-20MB000EGE Lenovo LENSE20256GMSP34MEAT2TA | Fujitsu Celsius H980 Samsung SSD PM981 MZVLB512HAJQ | Média Samsung SSD PM981 MZVLB512HAJQ | |
|---|---|---|---|---|---|
| CrystalDiskMark 5.2 / 6 | 8% | -4% | -5% | 9% | |
| Write 4K (MB/s) | 103.2 | 169.2 64% | 101 -2% | 111.8 8% | 126.7 ? 23% |
| Read 4K (MB/s) | 41.39 | 46.03 11% | 45.37 10% | 32.02 -23% | 44 ? 6% |
| Write Seq (MB/s) | 1880 | 1234 -34% | 1409 -25% | 1539 -18% | 1617 ? -14% |
| Read Seq (MB/s) | 2350 | 1854 -21% | 2129 -9% | 1252 -47% | 1716 ? -27% |
| Write 4K Q32T1 (MB/s) | 282.3 | 364.8 29% | 320.3 13% | 355.4 26% | 413 ? 46% |
| Read 4K Q32T1 (MB/s) | 314.3 | 552 76% | 348.3 11% | 408.7 30% | 420 ? 34% |
| Write Seq Q32T1 (MB/s) | 1881 | 1088 -42% | 1529 -19% | 1913 2% | 2076 ? 10% |
| Read Seq Q32T1 (MB/s) | 3216 | 2582 -20% | 2957 -8% | 2530 -21% | 3130 ? -3% |

| 3DMark 11 - 1280x720 Performance GPU | |
| Média da turma Workstation (12535 - 69594, n=23, últimos 2 anos) | |
| Dell Precision 7720 | |
| Lenovo ThinkPad P72-20MB000EGE | |
| Fujitsu Celsius H980 | |
| Dell Precision 7730 | |
| Média NVIDIA Quadro P3200 (14673 - 17021, n=4) | |
| 3DMark | |
| 1280x720 Cloud Gate Standard Graphics | |
| Média da turma Workstation (58392 - 152418, n=14, últimos 2 anos) | |
| Dell Precision 7720 | |
| Lenovo ThinkPad P72-20MB000EGE | |
| Dell Precision 7730 | |
| Fujitsu Celsius H980 | |
| Média NVIDIA Quadro P3200 (57501 - 84059, n=4) | |
| 1920x1080 Fire Strike Graphics | |
| Média da turma Workstation (8293 - 52560, n=23, últimos 2 anos) | |
| Dell Precision 7720 | |
| Dell Precision 7730 | |
| Lenovo ThinkPad P72-20MB000EGE | |
| Fujitsu Celsius H980 | |
| Média NVIDIA Quadro P3200 (11316 - 12558, n=4) | |
| 2560x1440 Time Spy Graphics | |
| Média da turma Workstation (2725 - 24806, n=23, últimos 2 anos) | |
| Lenovo ThinkPad P72-20MB000EGE | |
| Fujitsu Celsius H980 | |
| Média NVIDIA Quadro P3200 (3732 - 4378, n=3) | |
| Dell Precision 7720 | |
| LuxMark v2.0 64Bit | |
| Room GPUs-only | |
| Média da turma Workstation (2952 - 6990, n=3, últimos 2 anos) | |
| Dell Precision 7720 | |
| Dell Precision 7730 | |
| Fujitsu Celsius H980 | |
| Média NVIDIA Quadro P3200 (1842 - 2206, n=5) | |
| Lenovo ThinkPad P72-20MB000EGE | |
| Sala GPUs-only | |
| Média da turma Workstation (6574 - 13967, n=3, últimos 2 anos) | |
| Fujitsu Celsius H980 | |
| Dell Precision 7730 | |
| Dell Precision 7720 | |
| Média NVIDIA Quadro P3200 (3612 - 4383, n=5) | |
| Lenovo ThinkPad P72-20MB000EGE | |
| 3DMark 11 Performance | 15079 pontos | |
| 3DMark Cloud Gate Standard Score | 34440 pontos | |
| 3DMark Fire Strike Score | 11058 pontos | |
Ajuda | ||
| The Witcher 3 - 1920x1080 Ultra Graphics & Postprocessing (HBAO+) | |
| Média da turma Workstation (n=1últimos 2 anos) | |
| Dell Precision 7720 | |
| Dell Precision 7730 | |
| Lenovo ThinkPad P72-20MB000EGE | |
| Média NVIDIA Quadro P3200 (41.6 - 46.4, n=4) | |
| baixo | média | alto | ultra | |
|---|---|---|---|---|
| BioShock Infinite (2013) | 306.9 | 265.1 | 246 | 114.2 |
| The Witcher 3 (2015) | 218.6 | 148.2 | 82.2 | 46.4 |
| Dota 2 Reborn (2015) | 140 | 131 | 123 | 117 |
| Rise of the Tomb Raider (2016) | 181.7 | 146.3 | 84.6 | 71.1 |
| X-Plane 11.11 (2018) | 101 | 86 | 73 |
Barulho
| Ocioso |
| 29.7 / 29.7 / 29.7 dB |
| Carga |
| 31.4 / 44.2 dB |
 | ||
30 dB silencioso 40 dB(A) audível 50 dB(A) ruidosamente alto |
||
min: | ||
(-) A temperatura máxima no lado superior é 50 °C / 122 F, em comparação com a média de 38.2 °C / 101 F , variando de 22.2 a 69.8 °C para a classe Workstation.
(-) A parte inferior aquece até um máximo de 59.8 °C / 140 F, em comparação com a média de 41.1 °C / 106 F
(+) Em uso inativo, a temperatura média para o lado superior é 26.4 °C / 80 F, em comparação com a média do dispositivo de 32 °C / ### class_avg_f### F.
(±) Jogando The Witcher 3, a temperatura média para o lado superior é 34.4 °C / 94 F, em comparação com a média do dispositivo de 32 °C / ## #class_avg_f### F.
(+) Os apoios para as mãos e o touchpad são mais frios que a temperatura da pele, com um máximo de 29.9 °C / 85.8 F e, portanto, são frios ao toque.
(-) A temperatura média da área do apoio para as mãos de dispositivos semelhantes foi 27.8 °C / 82 F (-2.1 °C / -3.8 F).
Dell Precision 7730 análise de áudio
(±) | o volume do alto-falante é médio, mas bom (###valor### dB)
Graves 100 - 315Hz
(-) | quase nenhum baixo - em média 16.7% menor que a mediana
(±) | a linearidade dos graves é média (11.6% delta para a frequência anterior)
Médios 400 - 2.000 Hz
(±) | médios reduzidos - em média 5.4% menor que a mediana
(+) | médios são lineares (5.4% delta para frequência anterior)
Altos 2 - 16 kHz
(+) | agudos equilibrados - apenas 4% longe da mediana
(+) | os máximos são lineares (5.8% delta da frequência anterior)
Geral 100 - 16.000 Hz
(±) | a linearidade do som geral é média (17% diferença em relação à mediana)
Comparado com a mesma classe
» 49% de todos os dispositivos testados nesta classe foram melhores, 10% semelhantes, 41% piores
» O melhor teve um delta de 7%, a média foi 17%, o pior foi 35%
Comparado com todos os dispositivos testados
» 31% de todos os dispositivos testados foram melhores, 8% semelhantes, 61% piores
» O melhor teve um delta de 4%, a média foi 23%, o pior foi 134%
Lenovo ThinkPad P72-20MB000EGE análise de áudio
(-) | alto-falantes não muito altos (###valor### dB)
Graves 100 - 315Hz
(-) | quase nenhum baixo - em média 17.4% menor que a mediana
(±) | a linearidade dos graves é média (13.5% delta para a frequência anterior)
Médios 400 - 2.000 Hz
(±) | médios mais altos - em média 7.2% maior que a mediana
(±) | a linearidade dos médios é média (8.7% delta para frequência anterior)
Altos 2 - 16 kHz
(+) | agudos equilibrados - apenas 4.4% longe da mediana
(±) | a linearidade dos máximos é média (12.7% delta para frequência anterior)
Geral 100 - 16.000 Hz
(-) | o som geral não é linear (30.7% diferença em relação à mediana)
Comparado com a mesma classe
» 97% de todos os dispositivos testados nesta classe foram melhores, 1% semelhantes, 1% piores
» O melhor teve um delta de 7%, a média foi 17%, o pior foi 35%
Comparado com todos os dispositivos testados
» 89% de todos os dispositivos testados foram melhores, 3% semelhantes, 8% piores
» O melhor teve um delta de 4%, a média foi 23%, o pior foi 134%
| desligado | |
| Ocioso | |
| Carga |
|
Key:
min: | |
| Dell Precision 7730 i7-8850H, Quadro P3200, Samsung SSD PM981 MZVLB512HAJQ, IPS LED, 1920x1080, 17.3" | Dell Precision 7720 E3-1535M v6, Quadro P5000, Toshiba NVMe THNSN5512GPU7, IGZO, 3840x2160, 17.3" | Lenovo ThinkPad P72-20MB000EGE i7-8850H, Quadro P3200, Lenovo LENSE20256GMSP34MEAT2TA, IPS, 1920x1080, 17.3" | Fujitsu Celsius H980 i7-8750H, Quadro P3200, Samsung SSD PM981 MZVLB512HAJQ, IPS, 1920x1080, 17.3" | Média NVIDIA Quadro P3200 | Média da turma Workstation | |
|---|---|---|---|---|---|---|
| Power Consumption | -6% | 28% | -17% | -0% | 9% | |
| Idle Minimum * (Watt) | 10.1 | 9.6 5% | 4.6 54% | 14.8 -47% | 10.9 ? -8% | 9.11 ? 10% |
| Idle Average * (Watt) | 18 | 20.5 -14% | 12.2 32% | 20.4 -13% | 17.1 ? 5% | 13.8 ? 23% |
| Idle Maximum * (Watt) | 19.7 | 22.9 -16% | 15.4 22% | 21.5 -9% | 19.6 ? 1% | 17.9 ? 9% |
| Load Average * (Watt) | 89.6 | 96.8 -8% | 79.6 11% | 98.4 -10% | 95.1 ? -6% | 96 ? -7% |
| Witcher 3 ultra * (Watt) | 134 | 86 36% | ||||
| Load Maximum * (Watt) | 204 | 202.1 1% | 176 14% | 213.5 -5% | 191.3 ? 6% | 180.3 ? 12% |
* ... menor é melhor
| Dell Precision 7730 i7-8850H, Quadro P3200, 92 Wh | Dell Precision 7720 E3-1535M v6, Quadro P5000, 91 Wh | Lenovo ThinkPad P72-20MB000EGE i7-8850H, Quadro P3200, 99 Wh | Fujitsu Celsius H980 i7-8750H, Quadro P3200, 96 Wh | Média da turma Workstation | |
|---|---|---|---|---|---|
| Duração da bateria | 3% | 66% | 14% | 41% | |
| H.264 (h) | 5.8 | 6.8 17% | 12.3 112% | 5.9 2% | 10.1 ? 74% |
| WiFi v1.3 (h) | 5.6 | 6.3 13% | 11.2 100% | 8.3 48% | 8.55 ? 53% |
| Load (h) | 1.5 | 1.2 -20% | 1.3 -13% | 1.4 -7% | 1.441 ? -4% |
| Reader / Idle (h) | 11.4 | 28.3 | 13.5 | 26.1 ? |
Pro
Contra
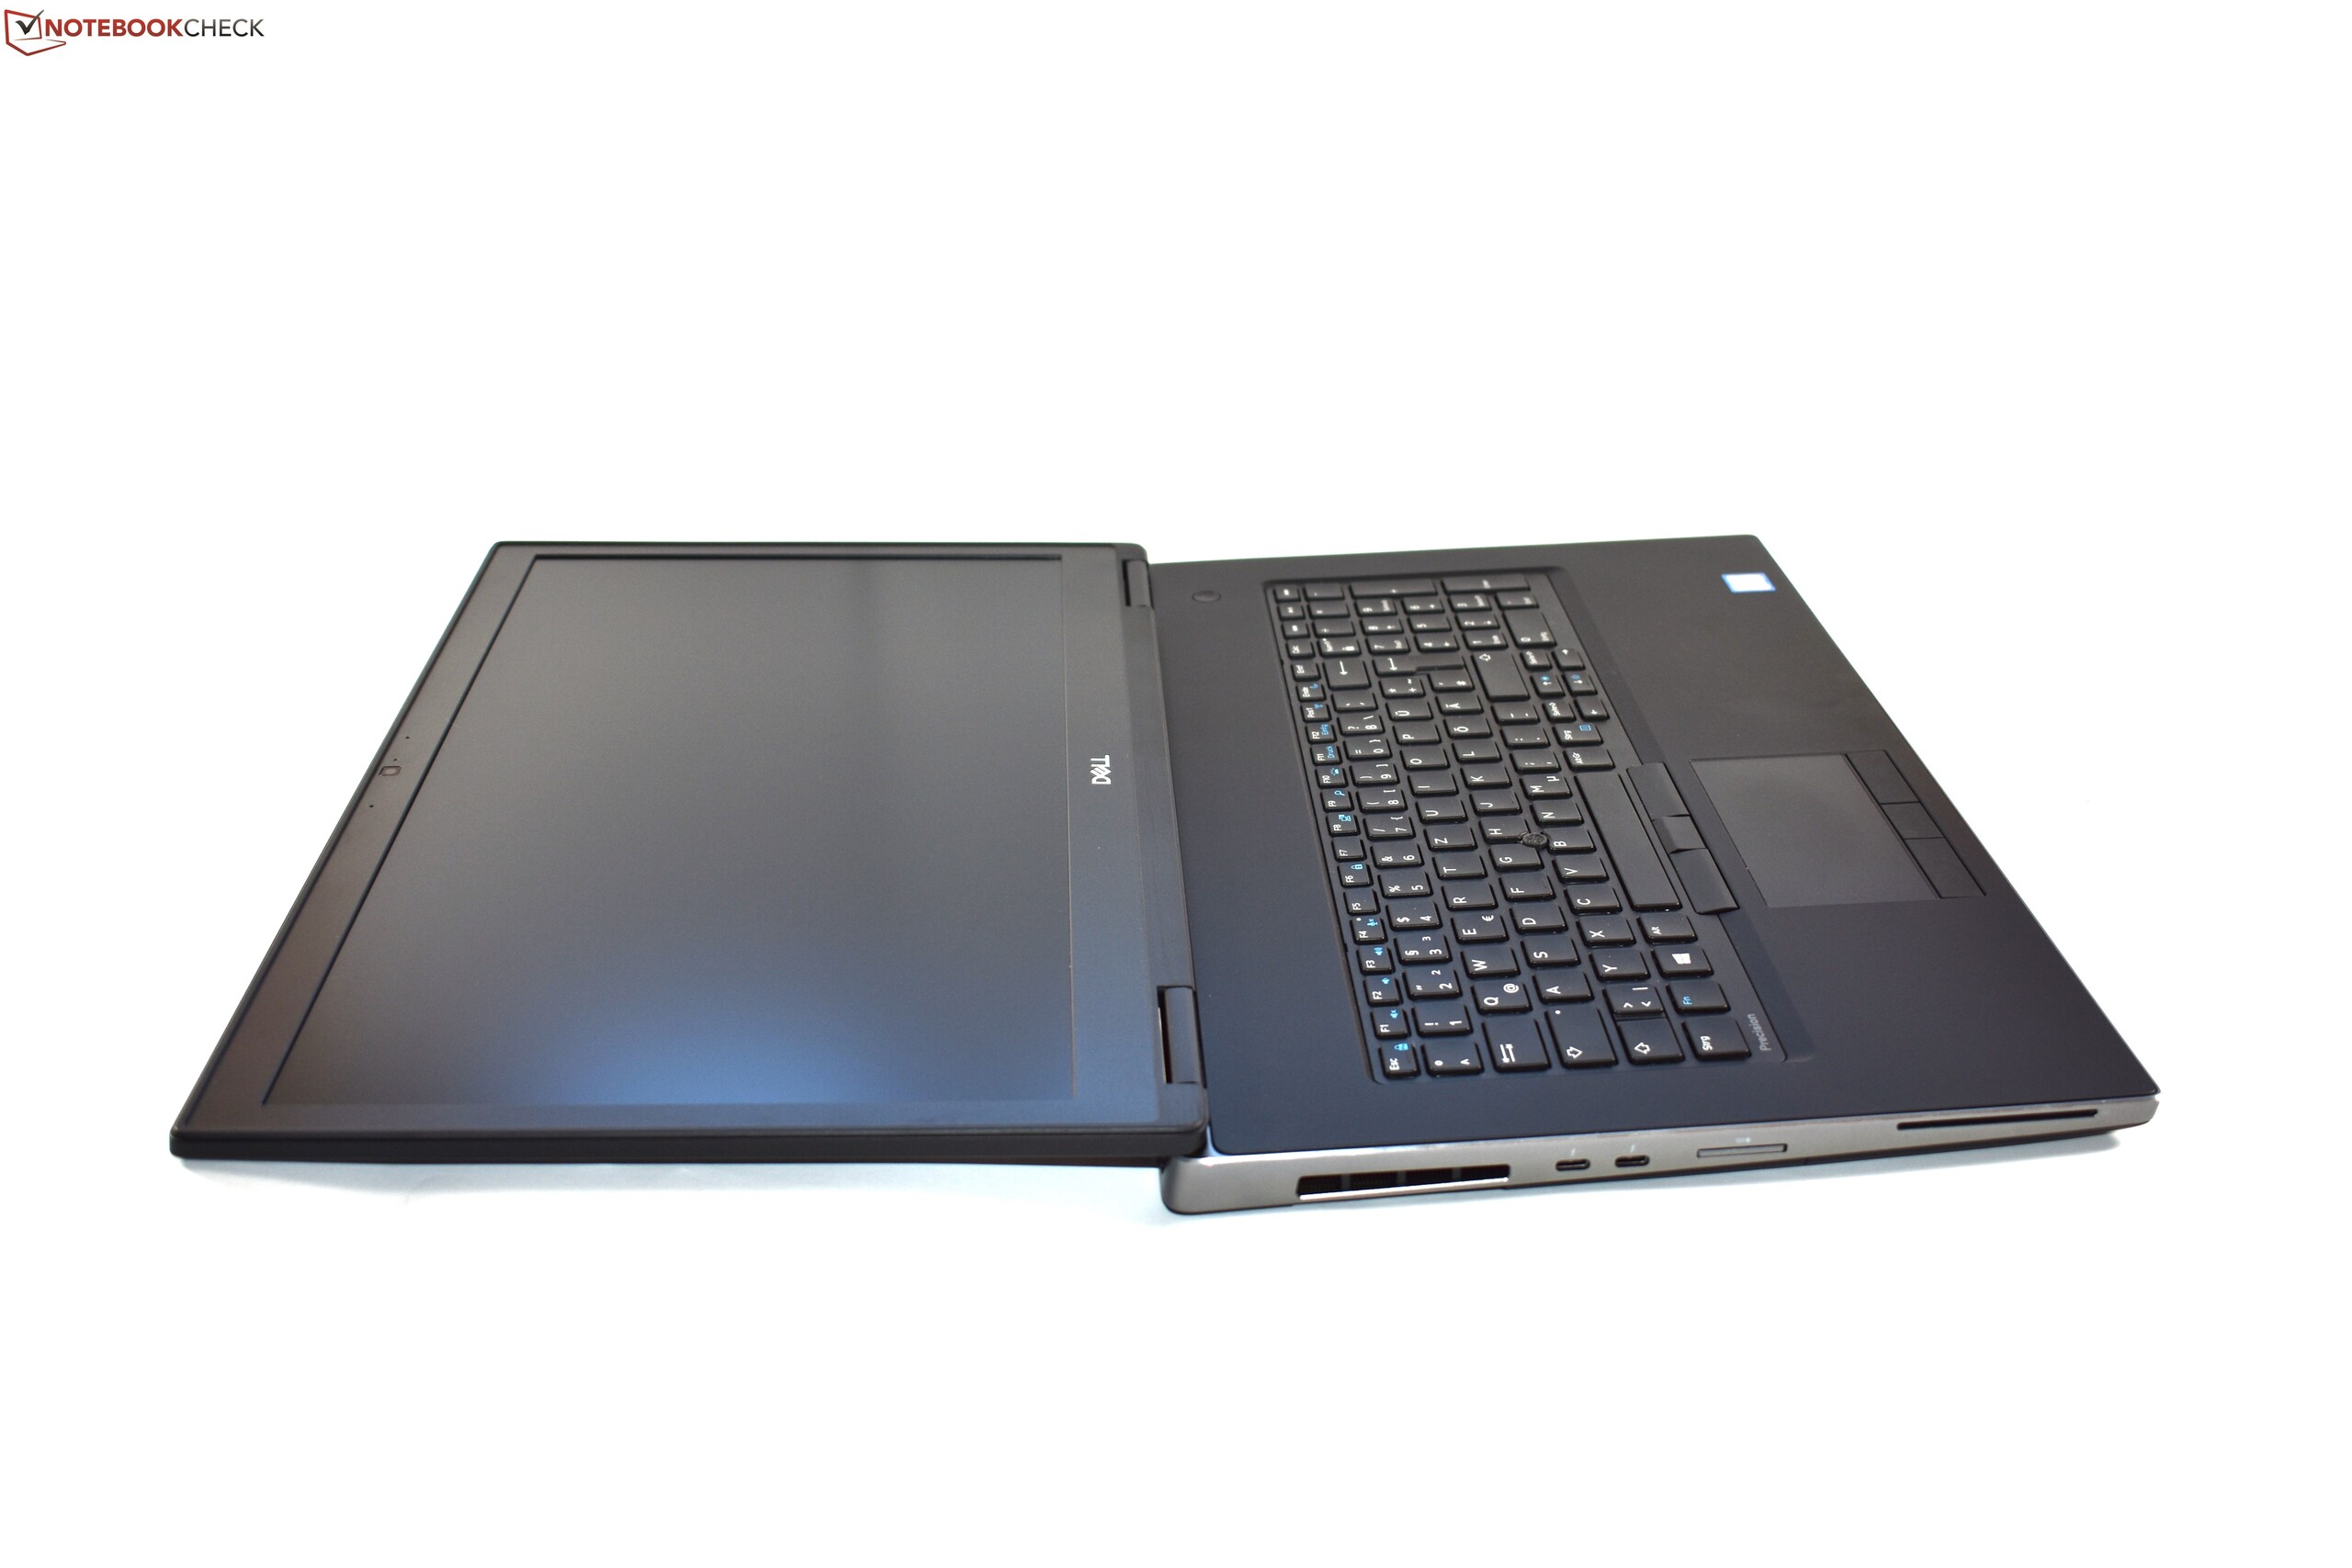
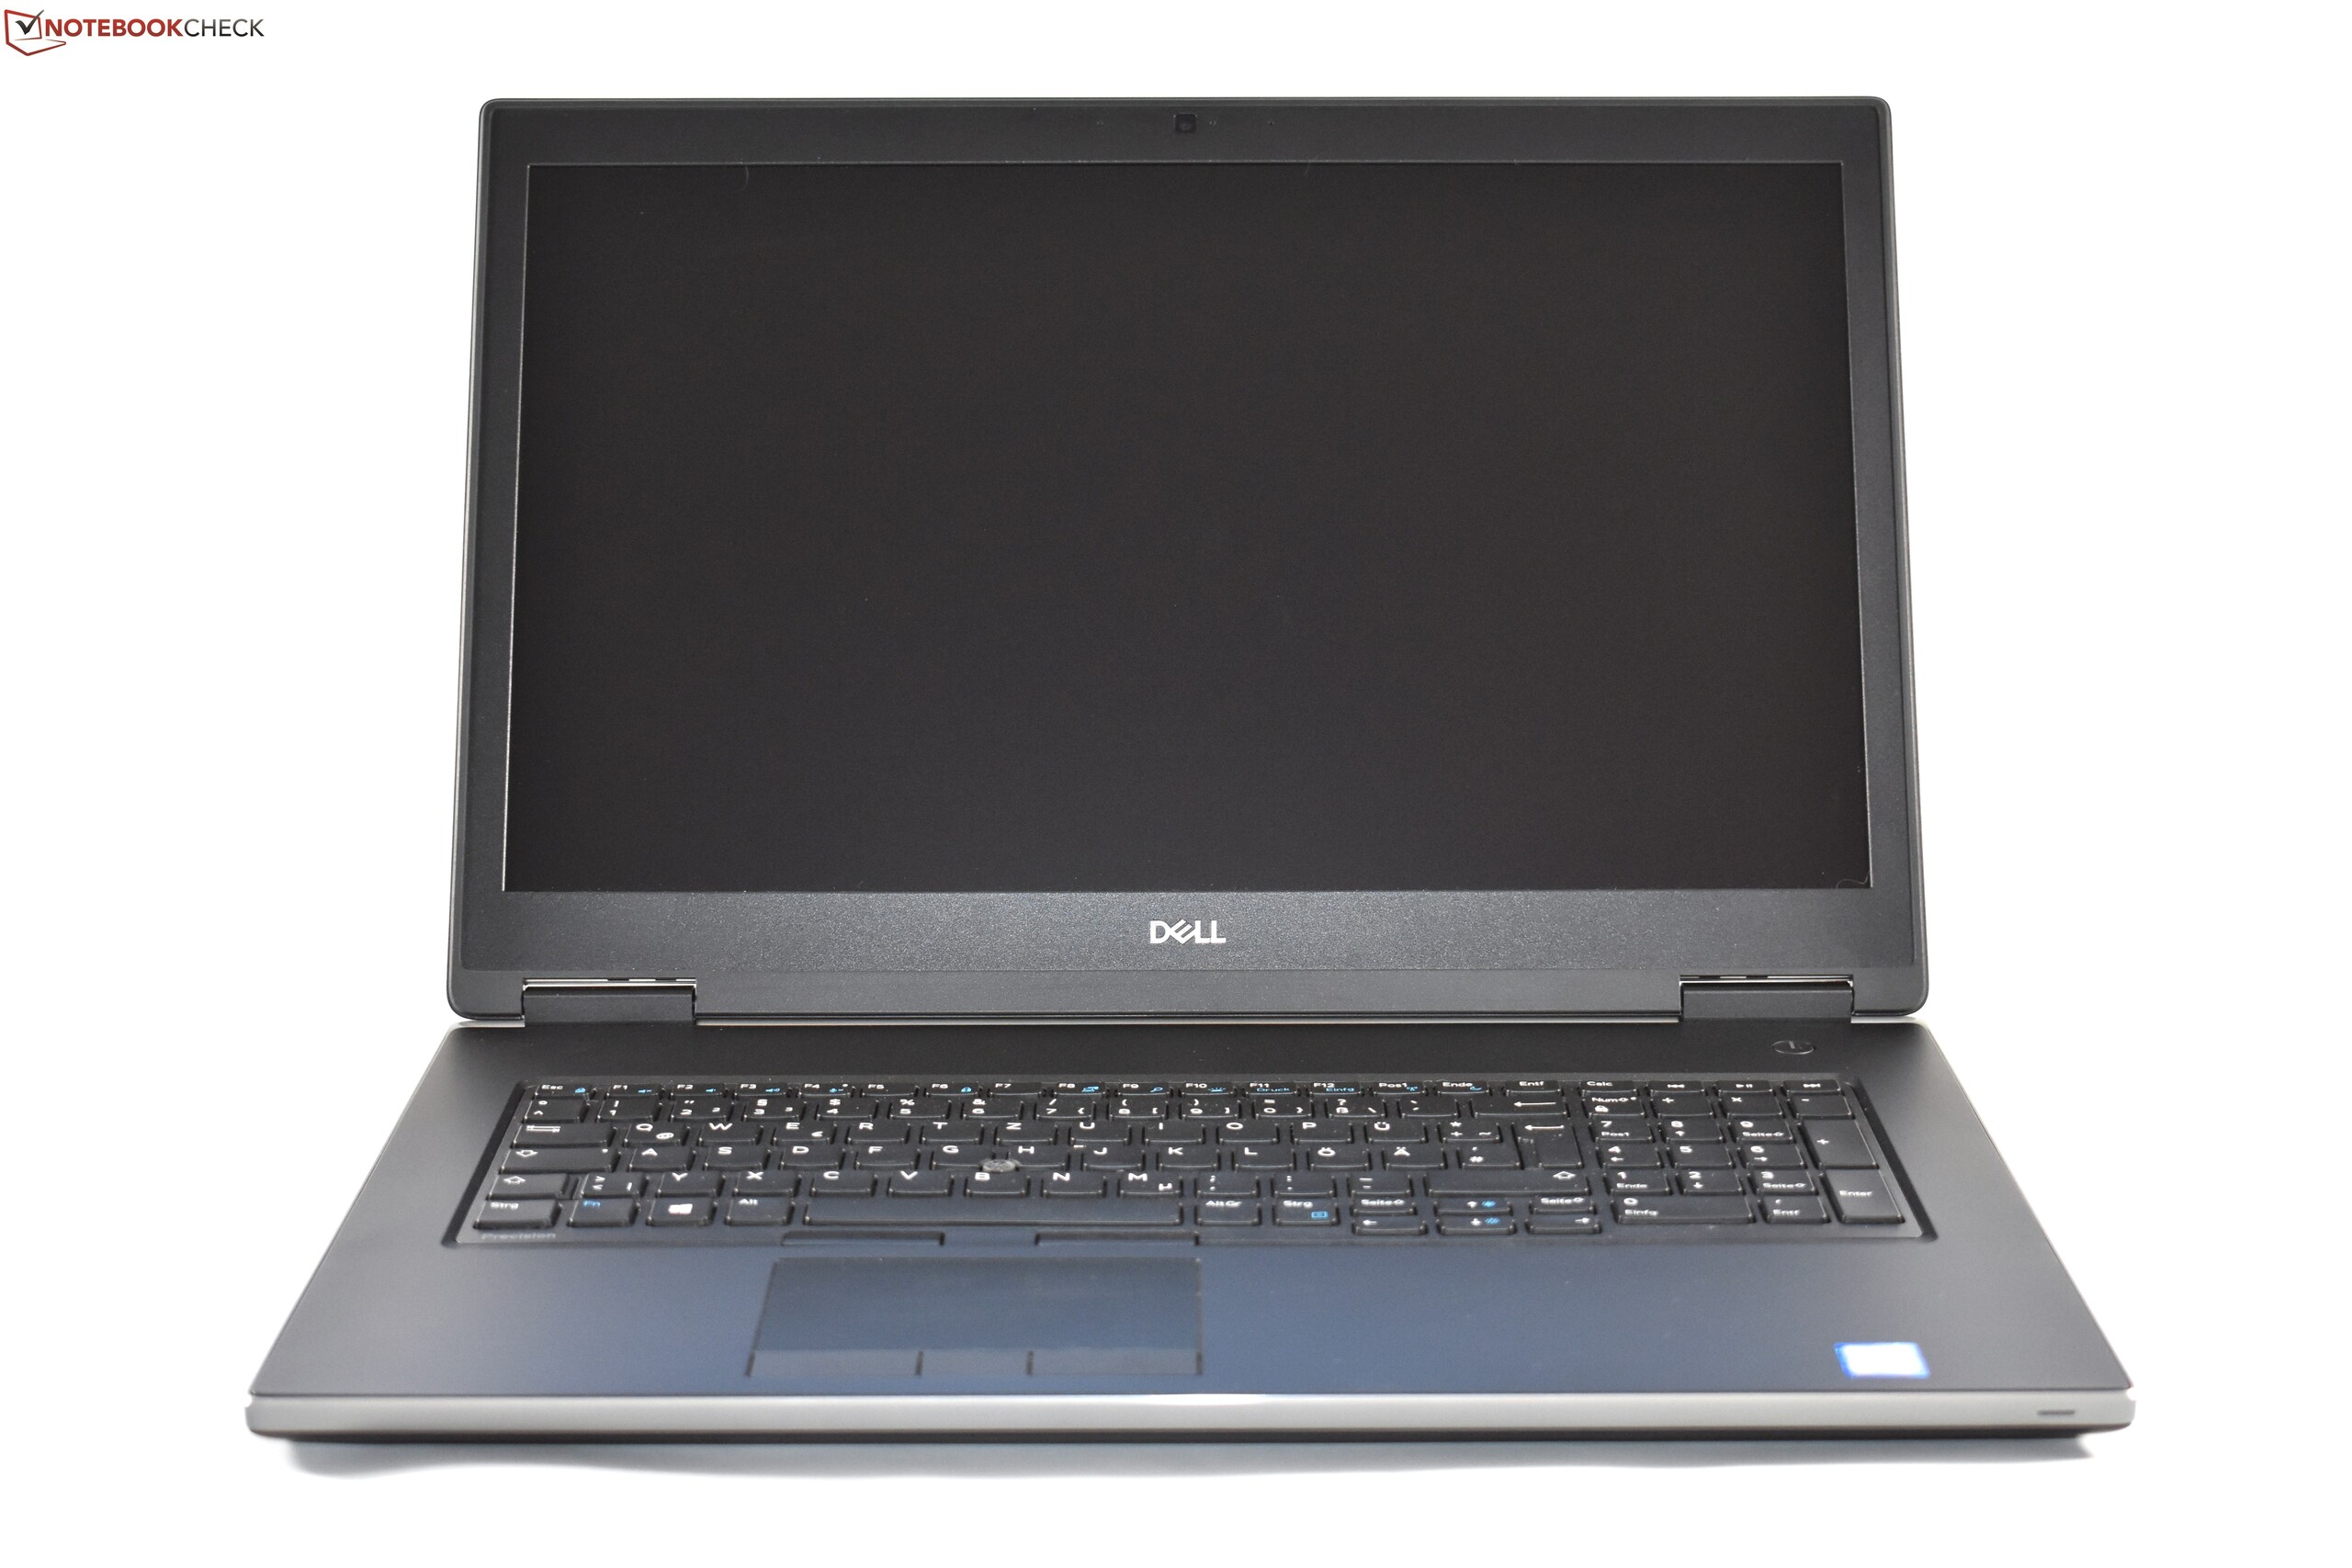
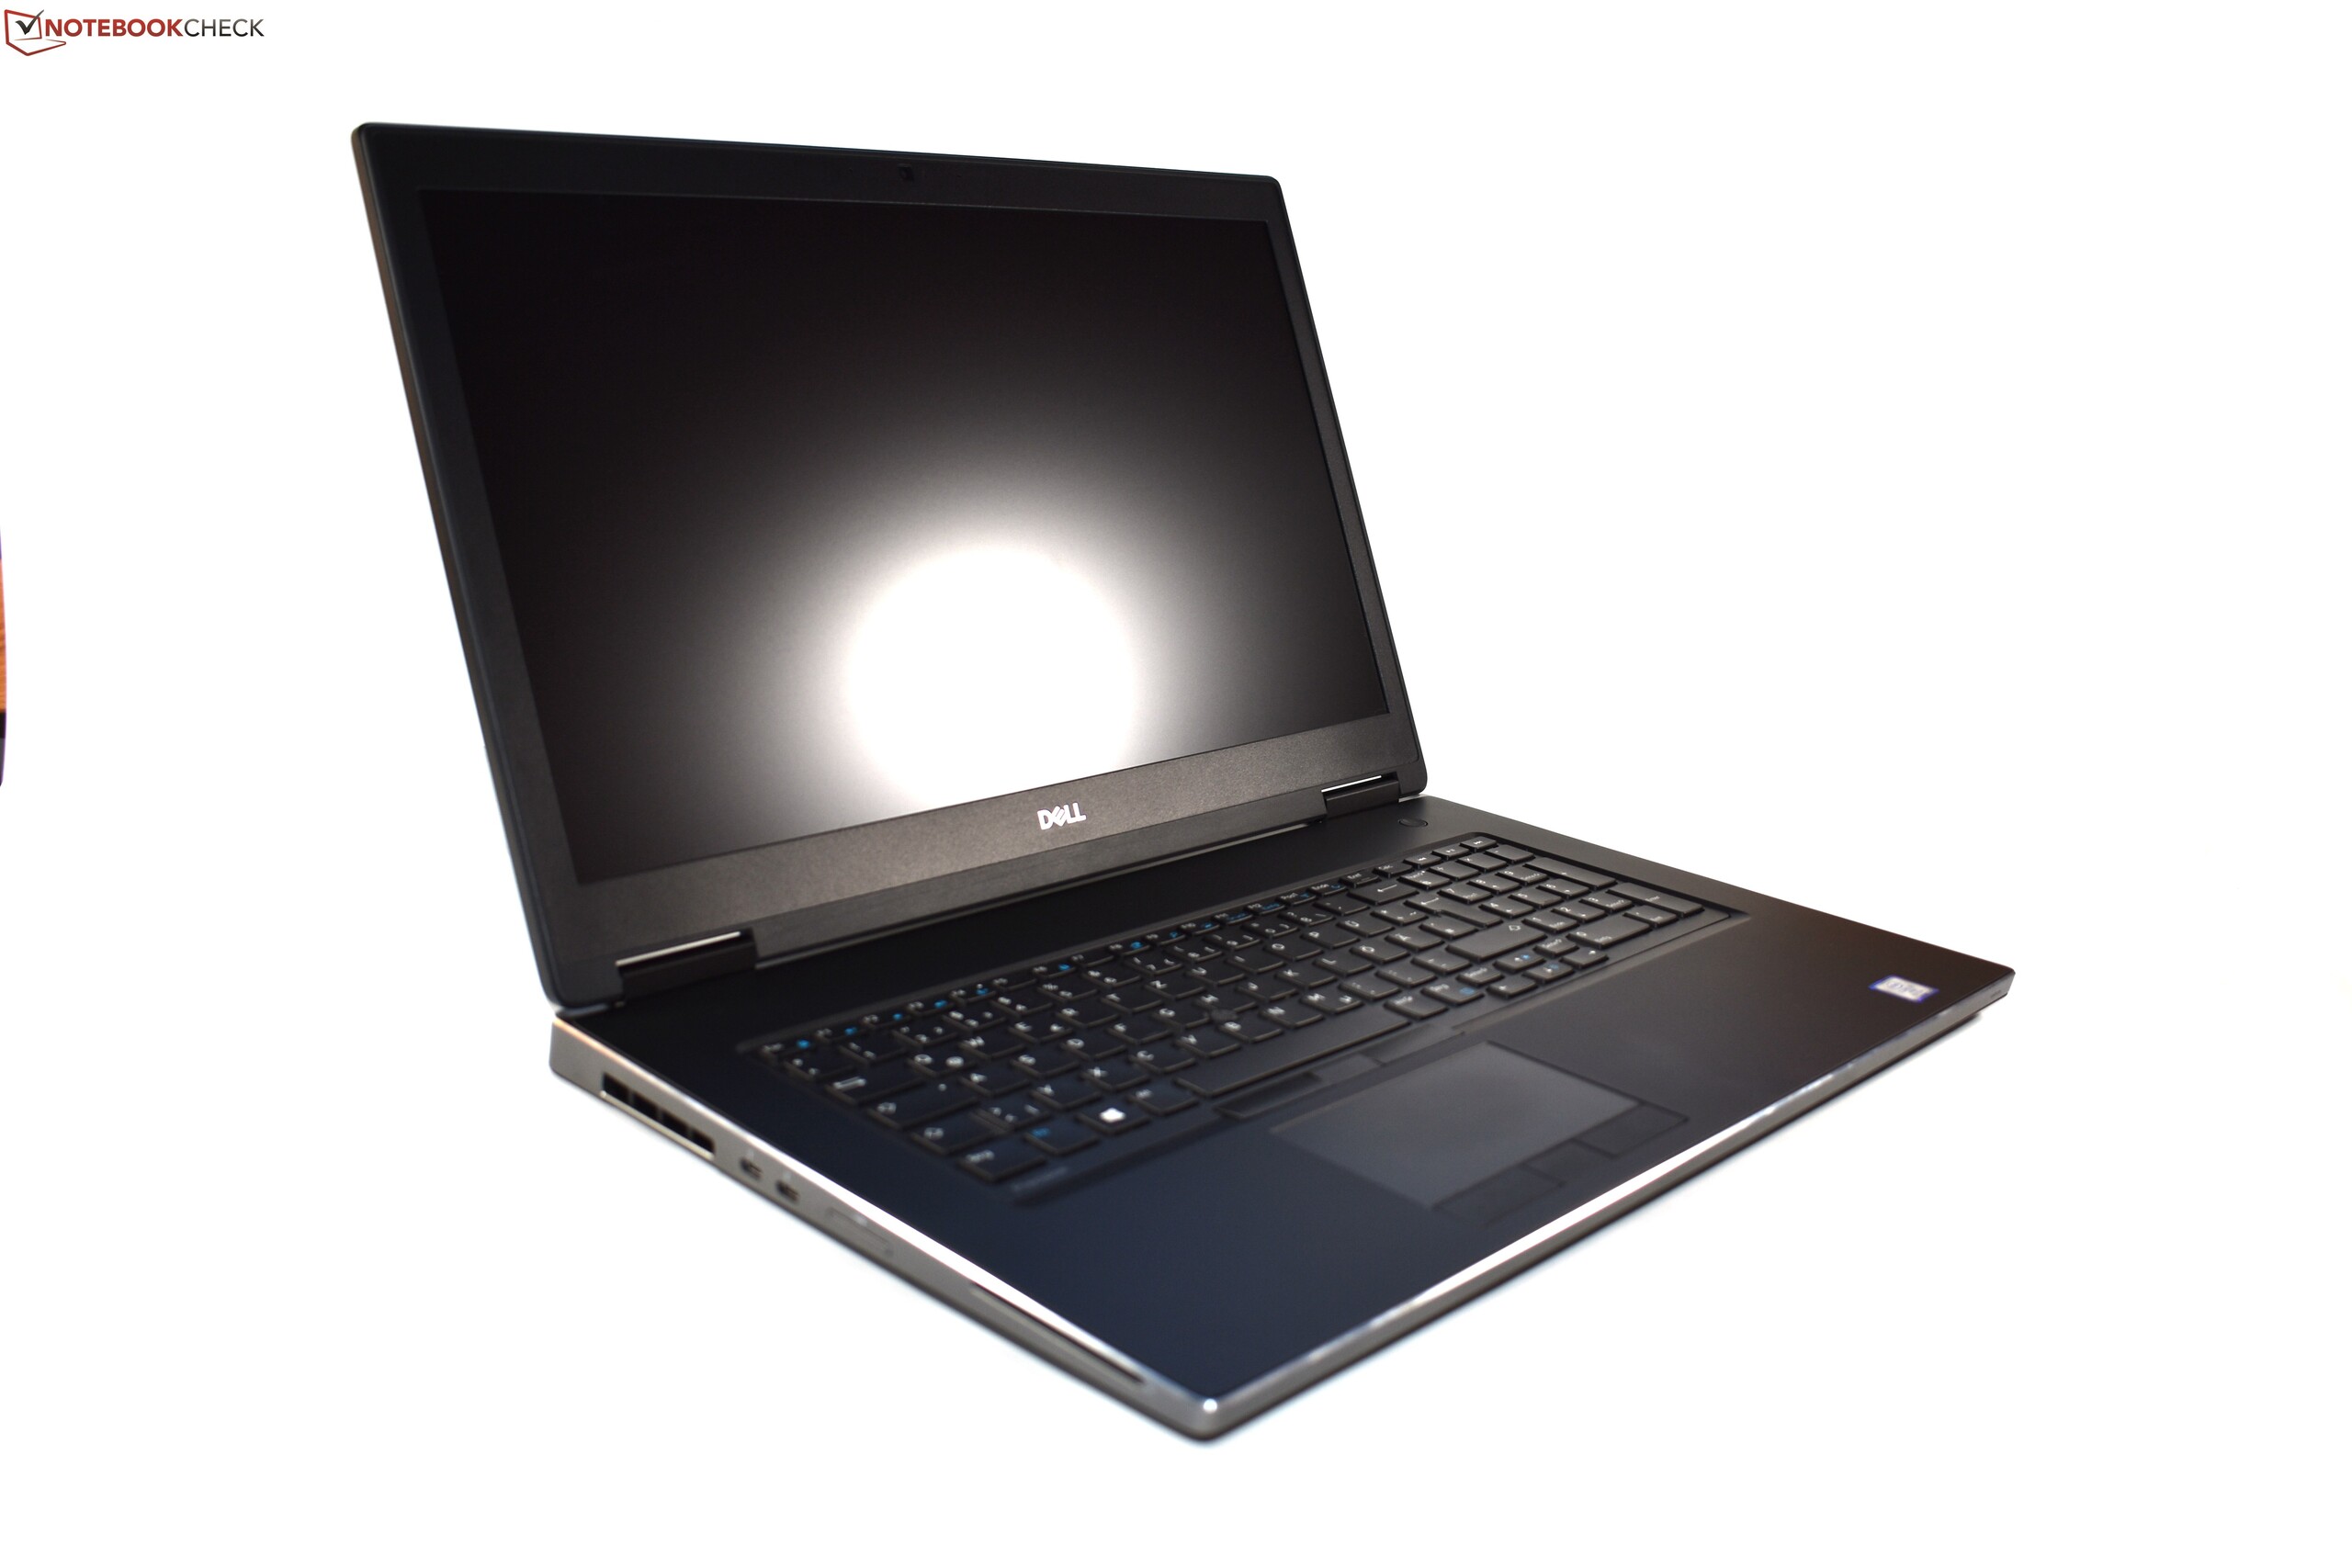
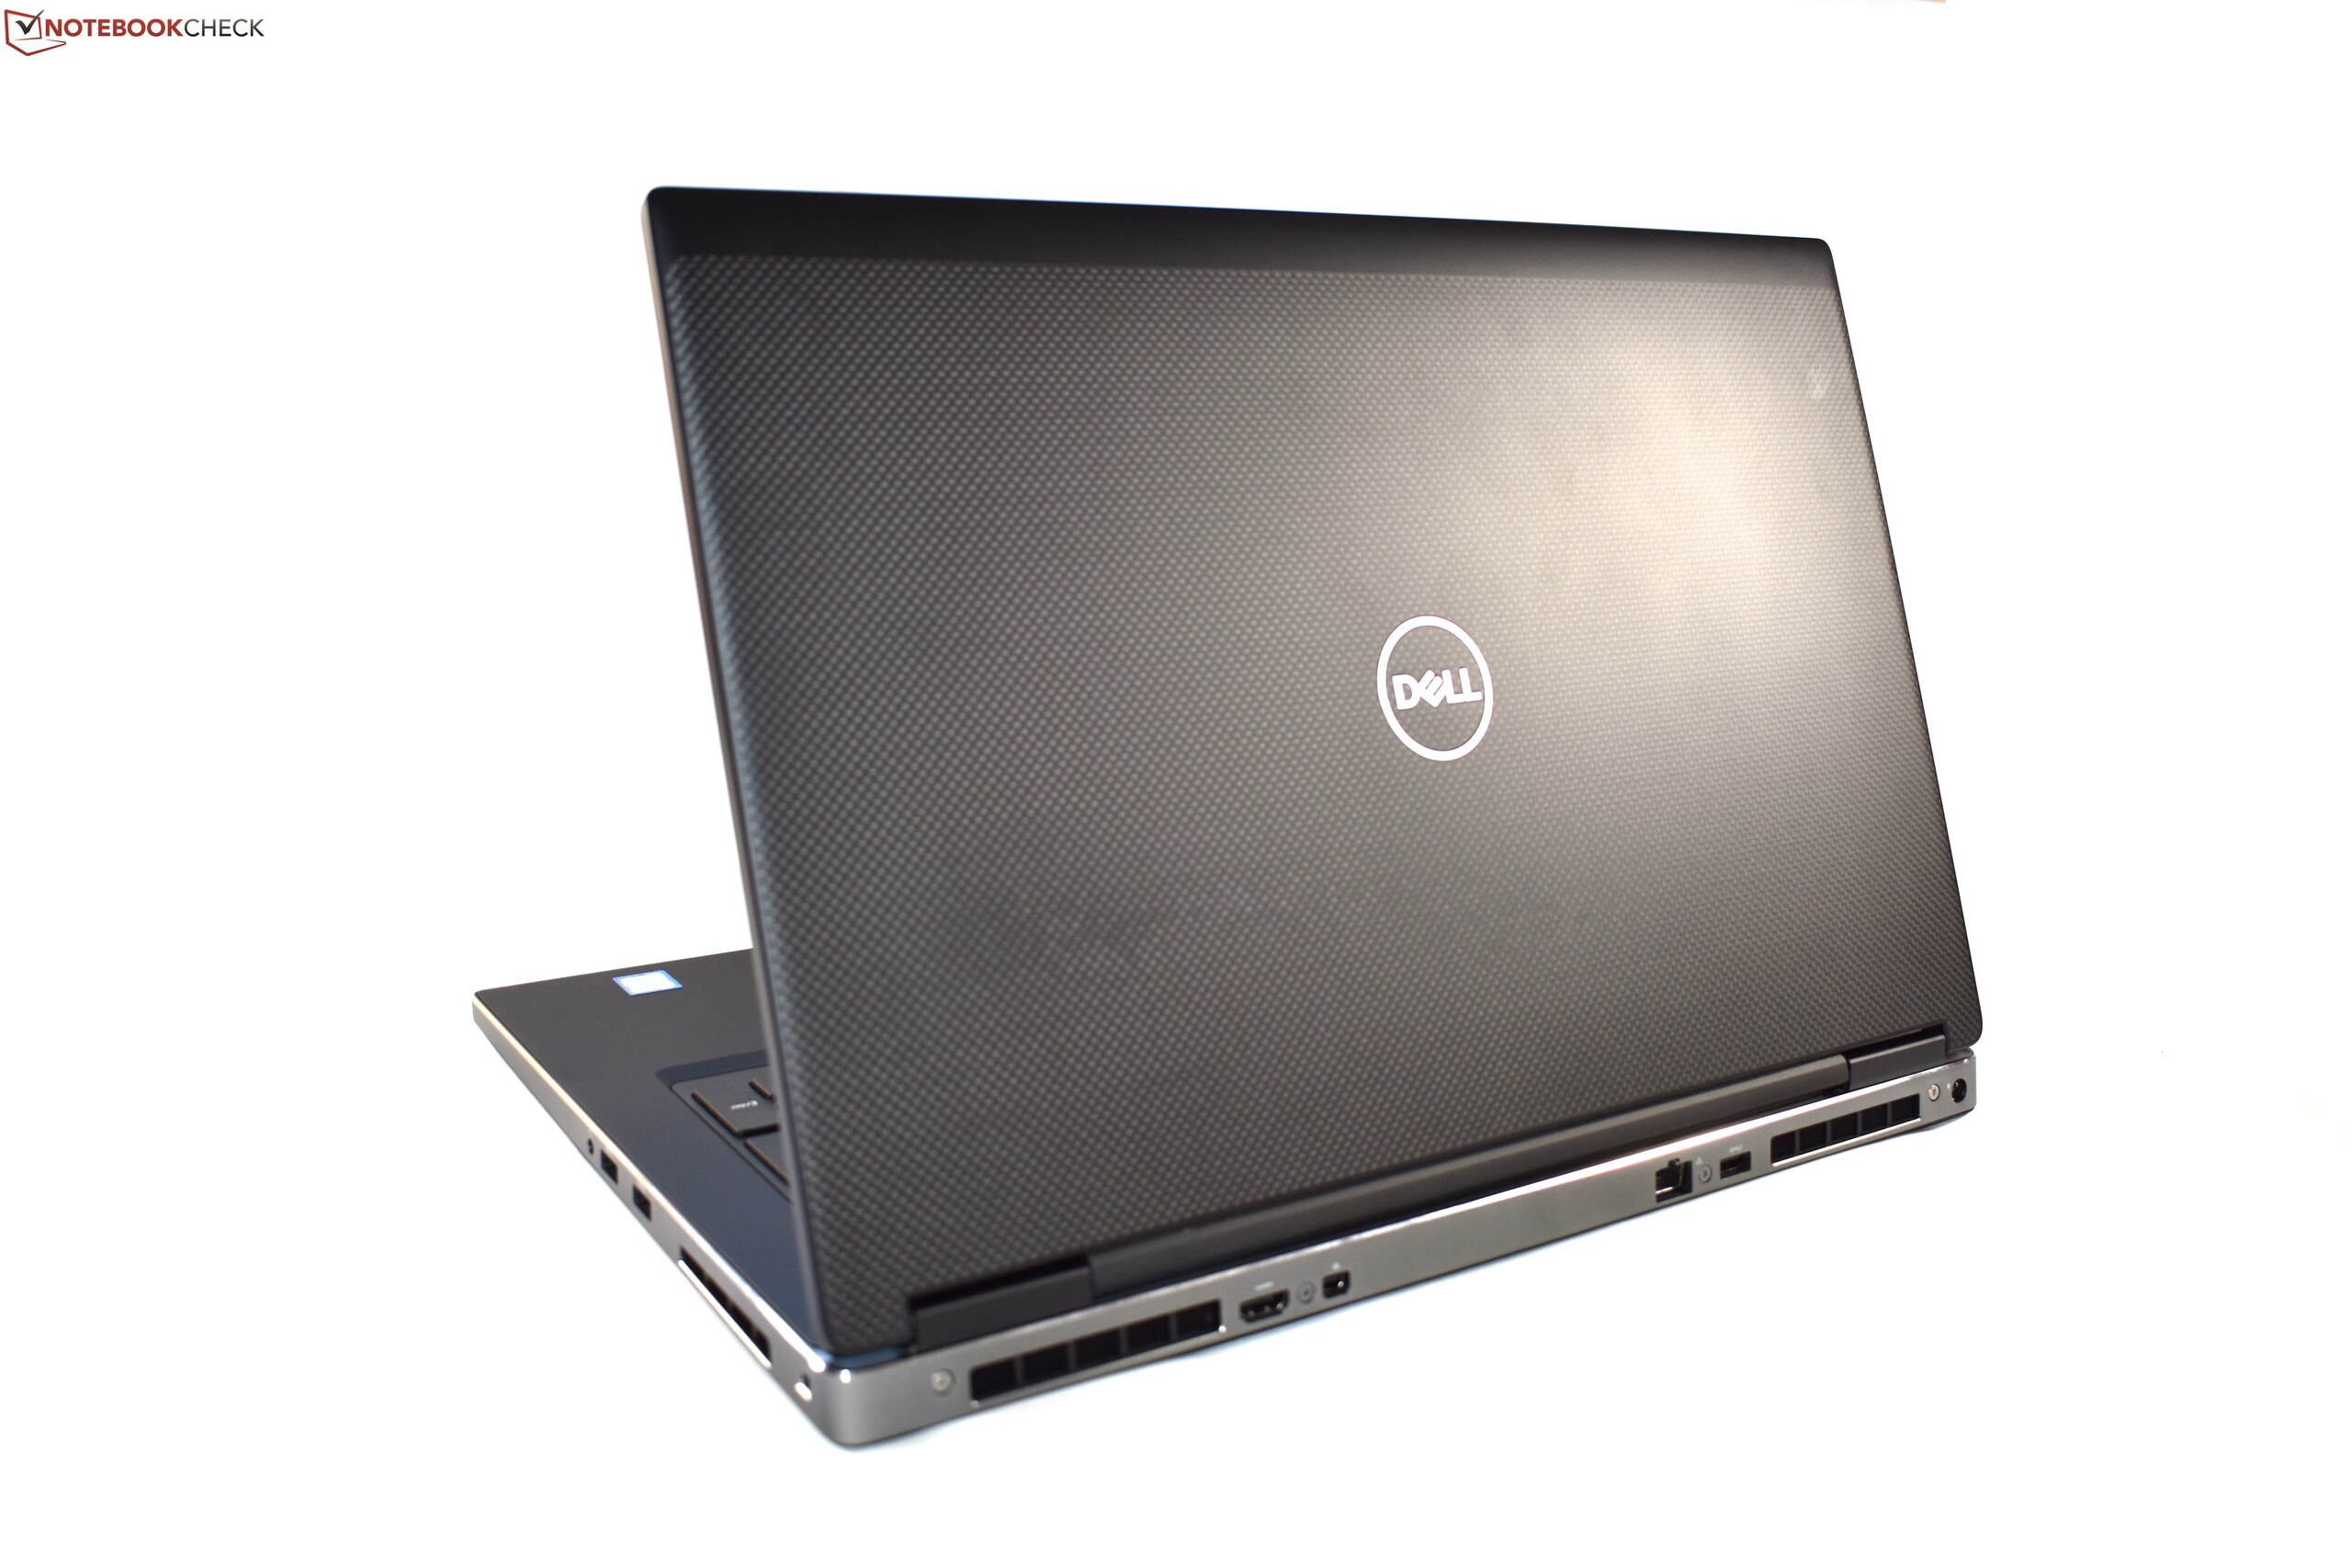
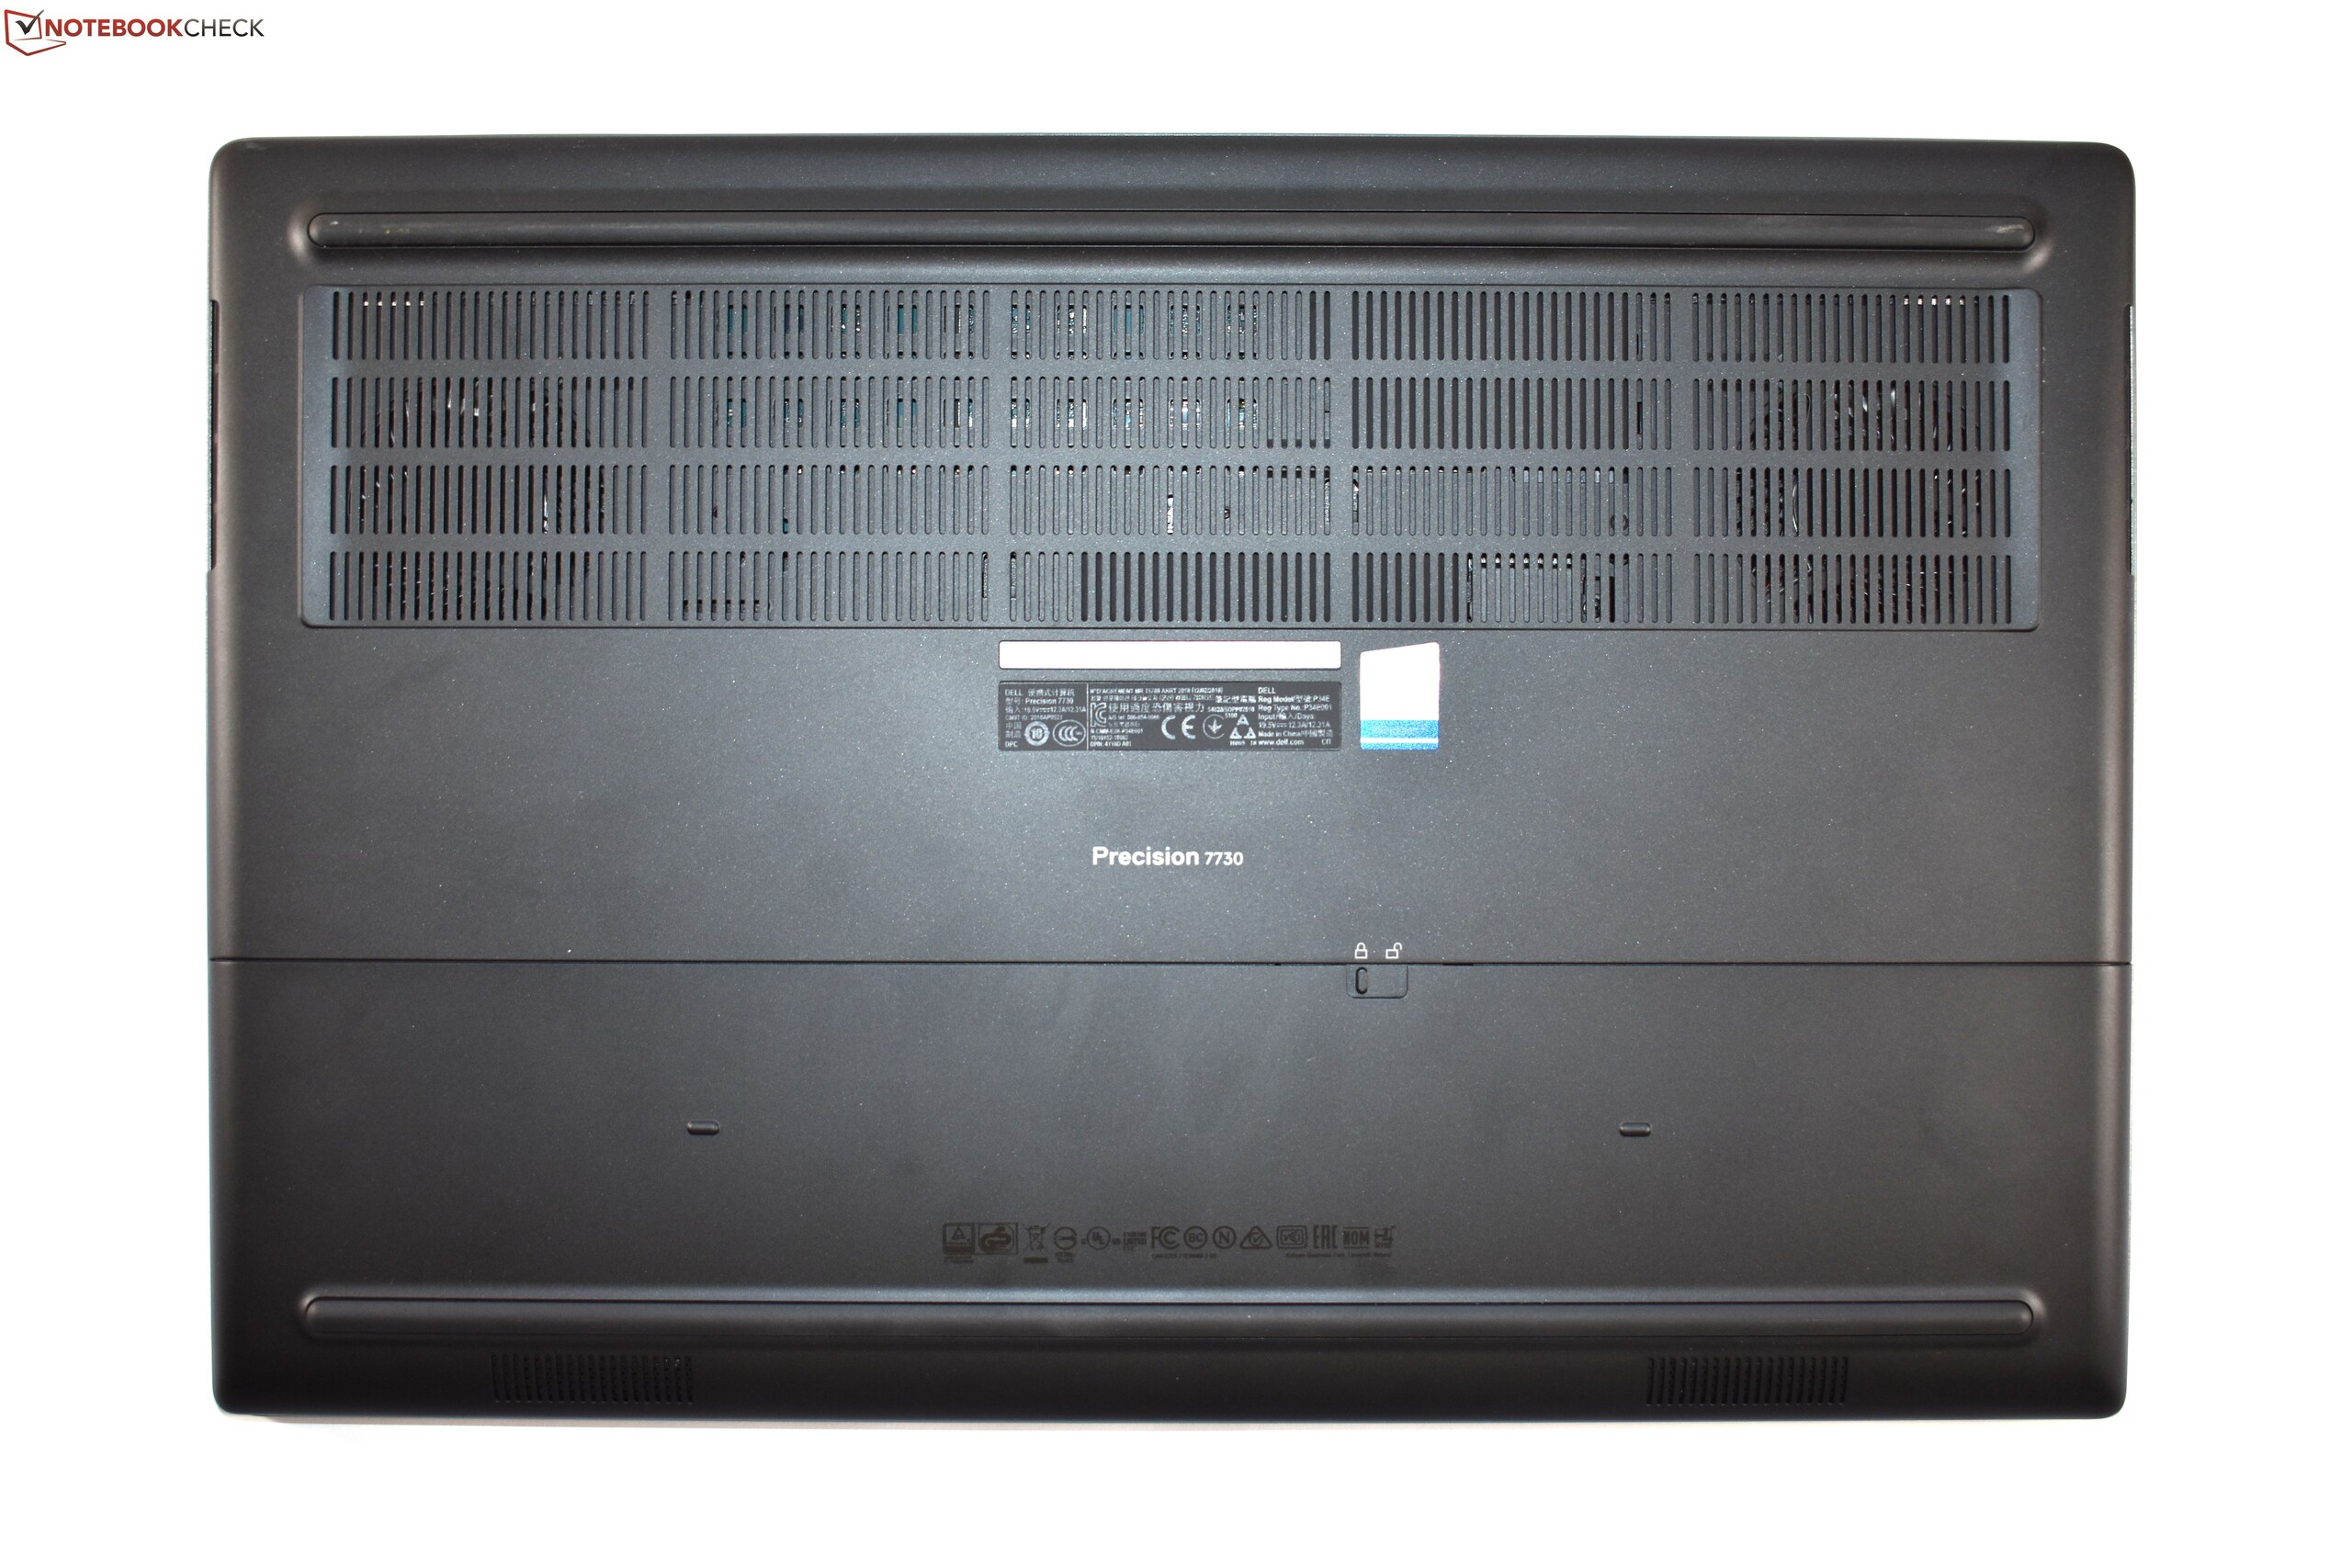
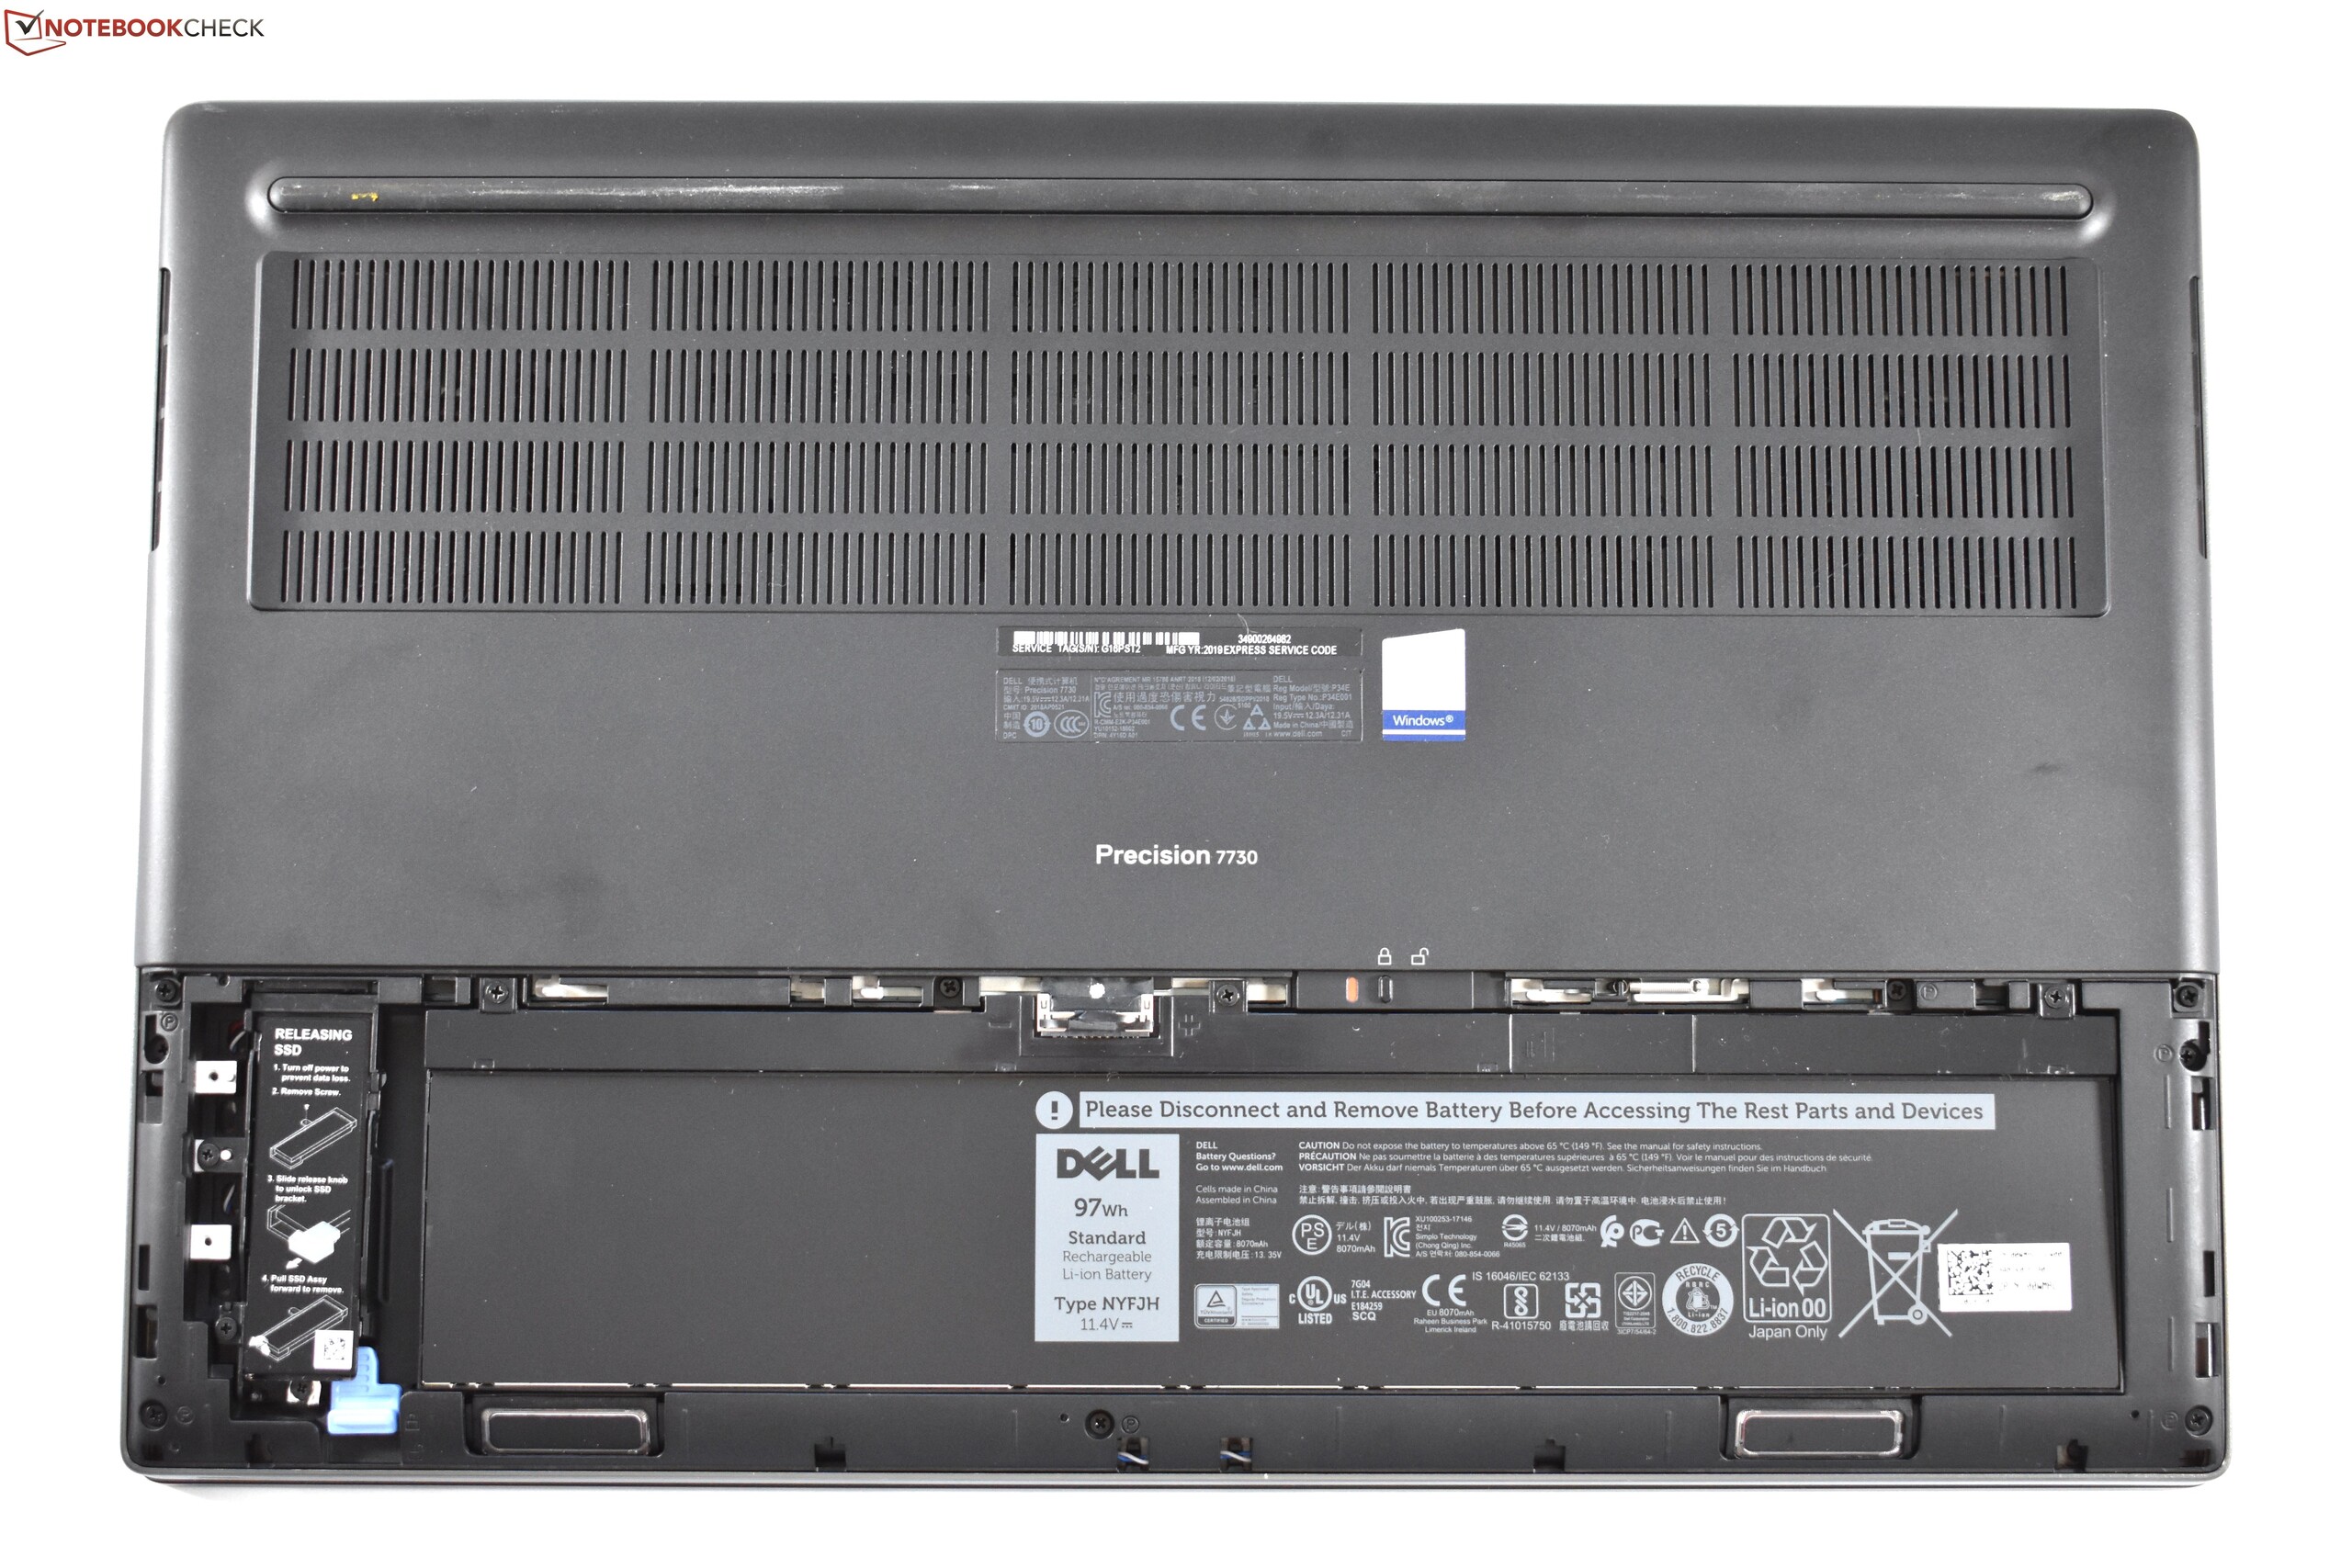
Você seria perdoado por pensar que pouco mudou com o novo portátil Precision 7700. A Dell tornou o Precision 7730 mais compacto do que seu antecessor, mas ainda é feito dos mesmos materiais.
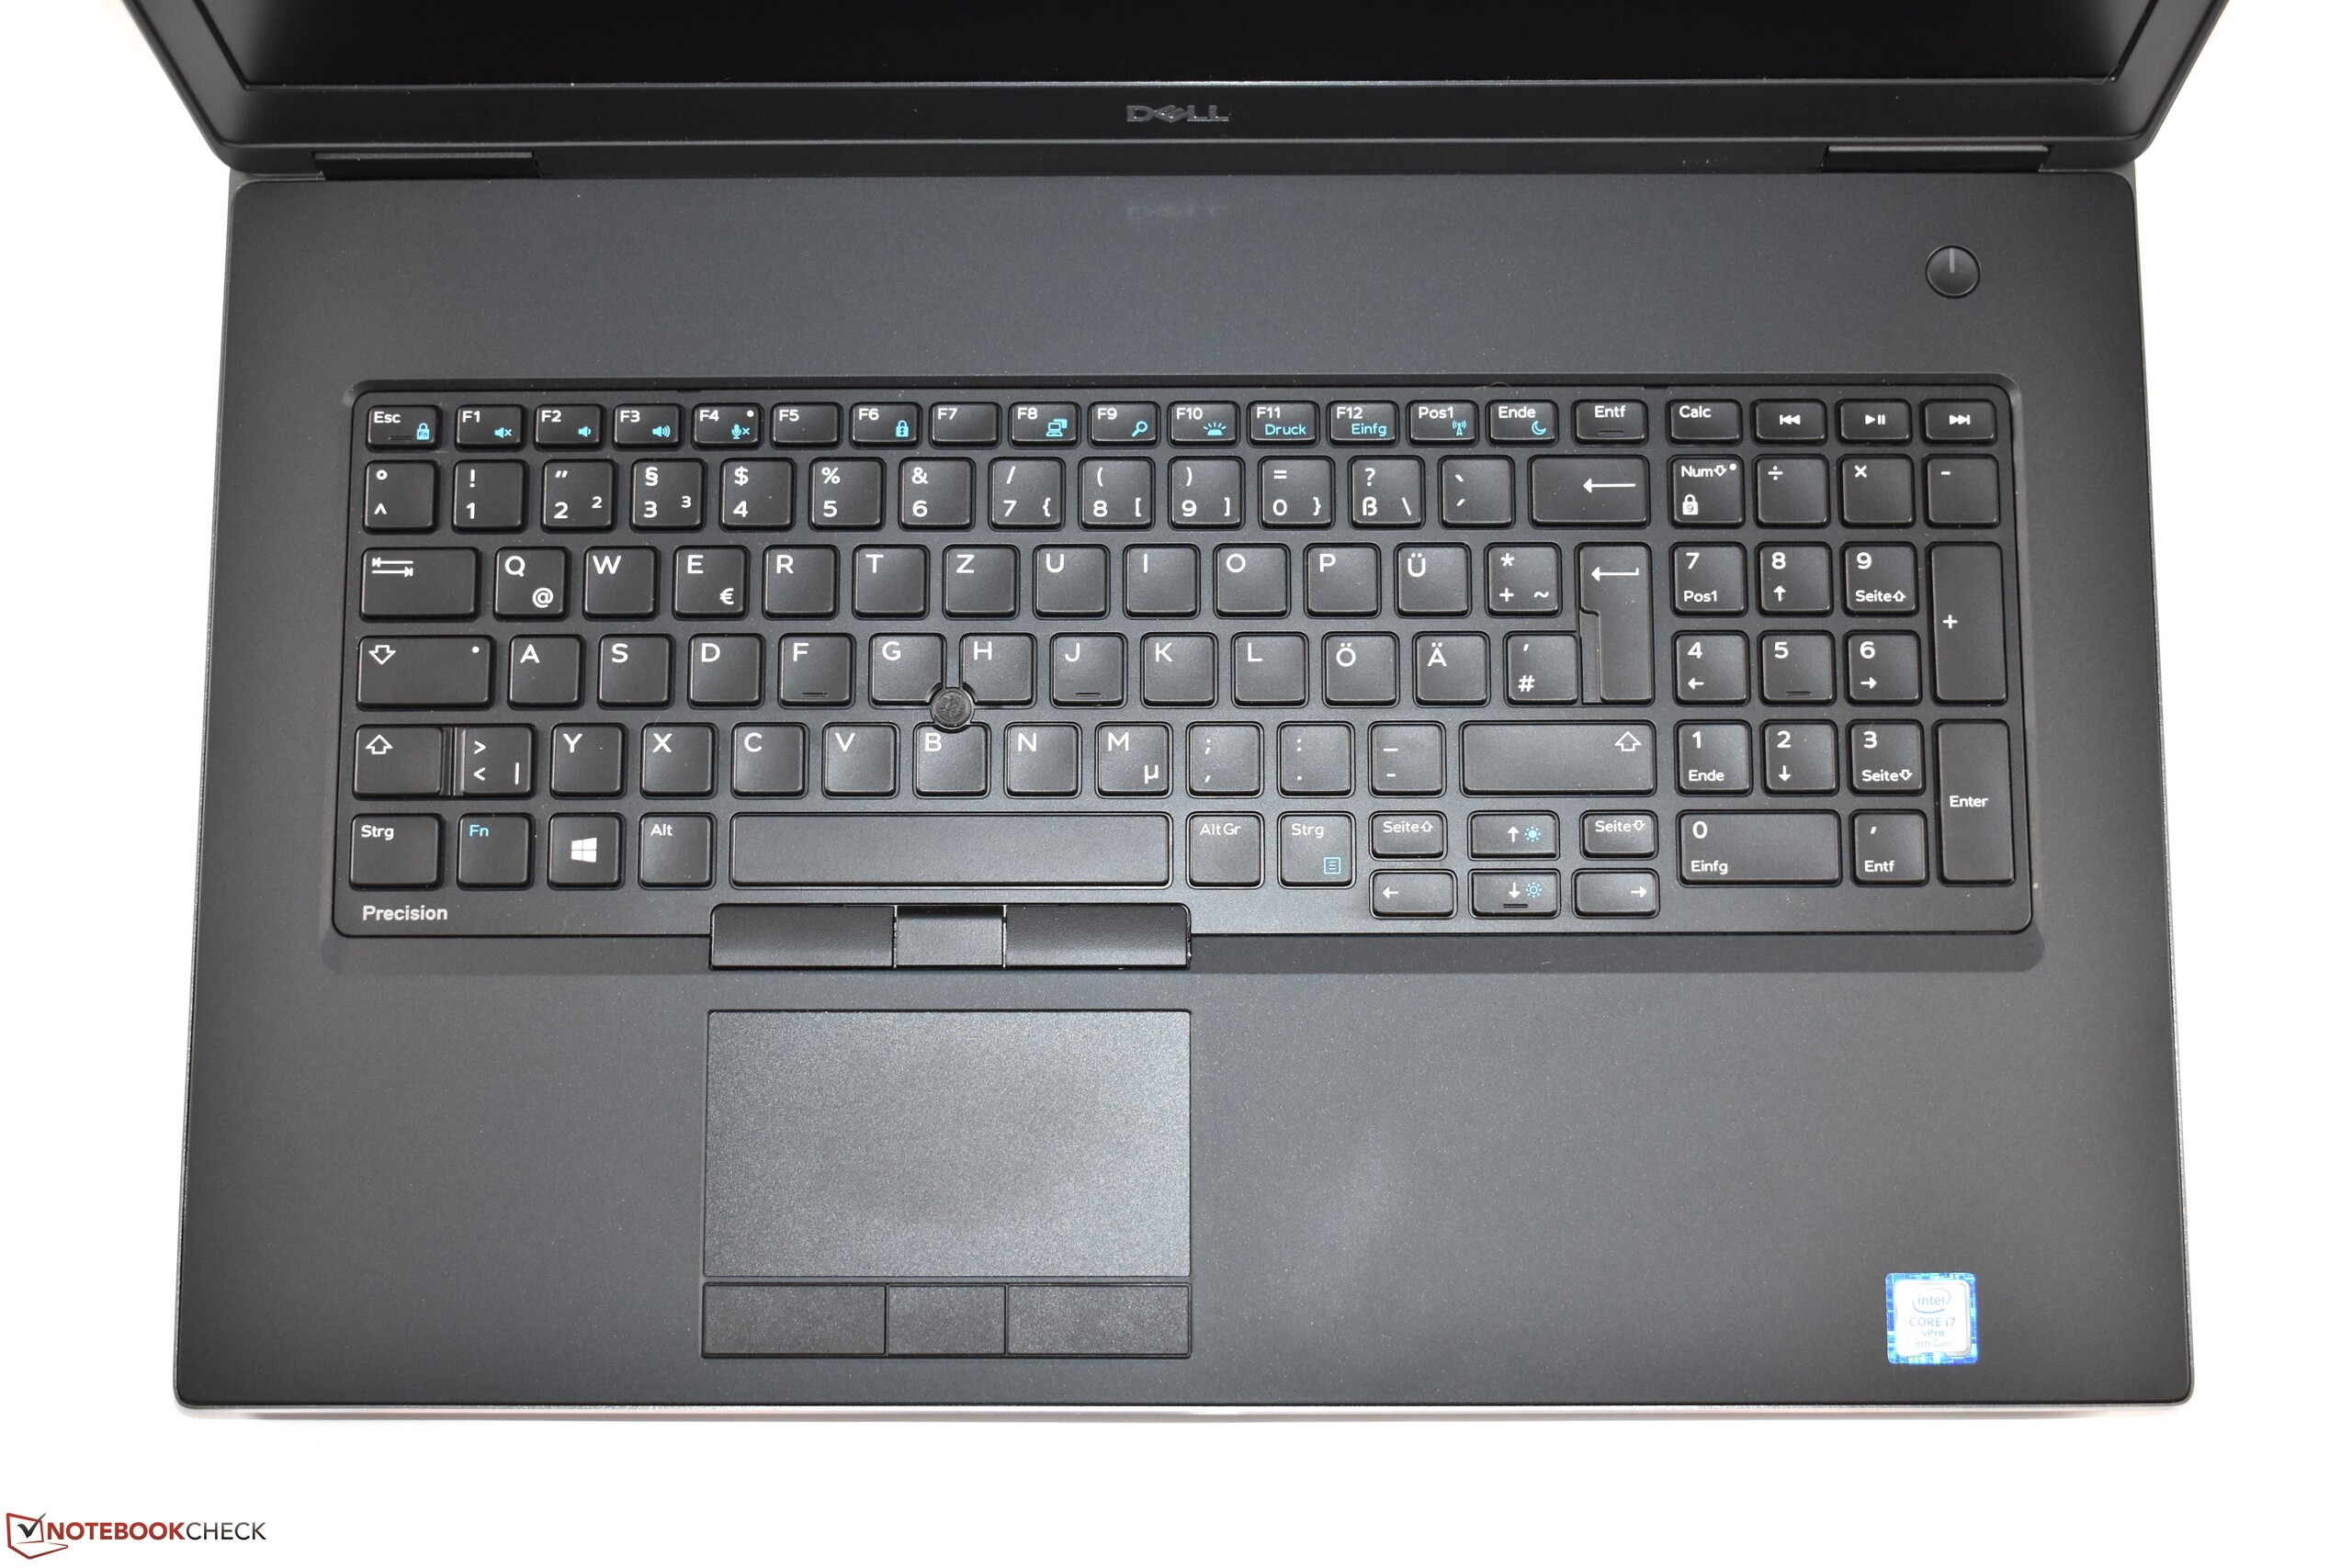
O Precision 7730 ainda tem um bom teclado, além de uma carcaça robusta e diversas portas. Além disso, a Dell oferece mais opções de configuração do que seus concorrentes, o que torna o Precision 7730 uma opção mais flexível para as pessoas aos nossos olhos. Nossa unidade de análise também possui excelente desempenho de CPU e GPU, como é frequentemente em workstations, enquanto nós damos boas-vindas à inclusão de opções de telas mate. A Dell também equipou o Precision 7730 com um leitor de cartões SD impressionantemente rápido e inclui uma garantia de 36 meses como padrão, e gostamos dos dois.
O Dell Precision 7730 é um excelente workstation que é prejudicado pela sua decepcionante duração de bateria.
O maior problema com o Precision 7730 é a sua duração de bateria horrível. Enquanto a maioria das pessoas deixará o workstation em carga devido ao seu tamanho, o ThinkPad P72 continua a ser uma opção melhor para aqueles que ocasionalmente precisam usar seu dispositivo longe de uma tomada elétrica. Da mesma forma, nossa unidade de teste tem temperaturas de superfície inaceitavelmente altas, enquanto também afoga fortemente sua CPU e GPU com a bateria.
É uma pena ver um workstation afetado pelo bleeding da luz de fundo. Além disso, não podemos entender por que a Dell removeu o leitor de digitais incluído no Precision 7720.
No final, ainda recomendamos a compra do Precision 7730 se você estiver no mercado procurando um workstation. Deixando a duração da bateria de lado, o Precision 7730 oferece tudo o que você poderia querer de um workstation. Você sempre precisará ter seu carregador com você, se você planeja usar o dispositivo em movimento, mas provavelmente é muito volumoso para usar como um workstation móvel de qualquer maneira, e é por isso que ainda recomendamos considera-lo sobre outros workstations.
Dell Precision 7730
- 01/08/2020 v7 (old)
Benjamin Herzig
Price comparison
