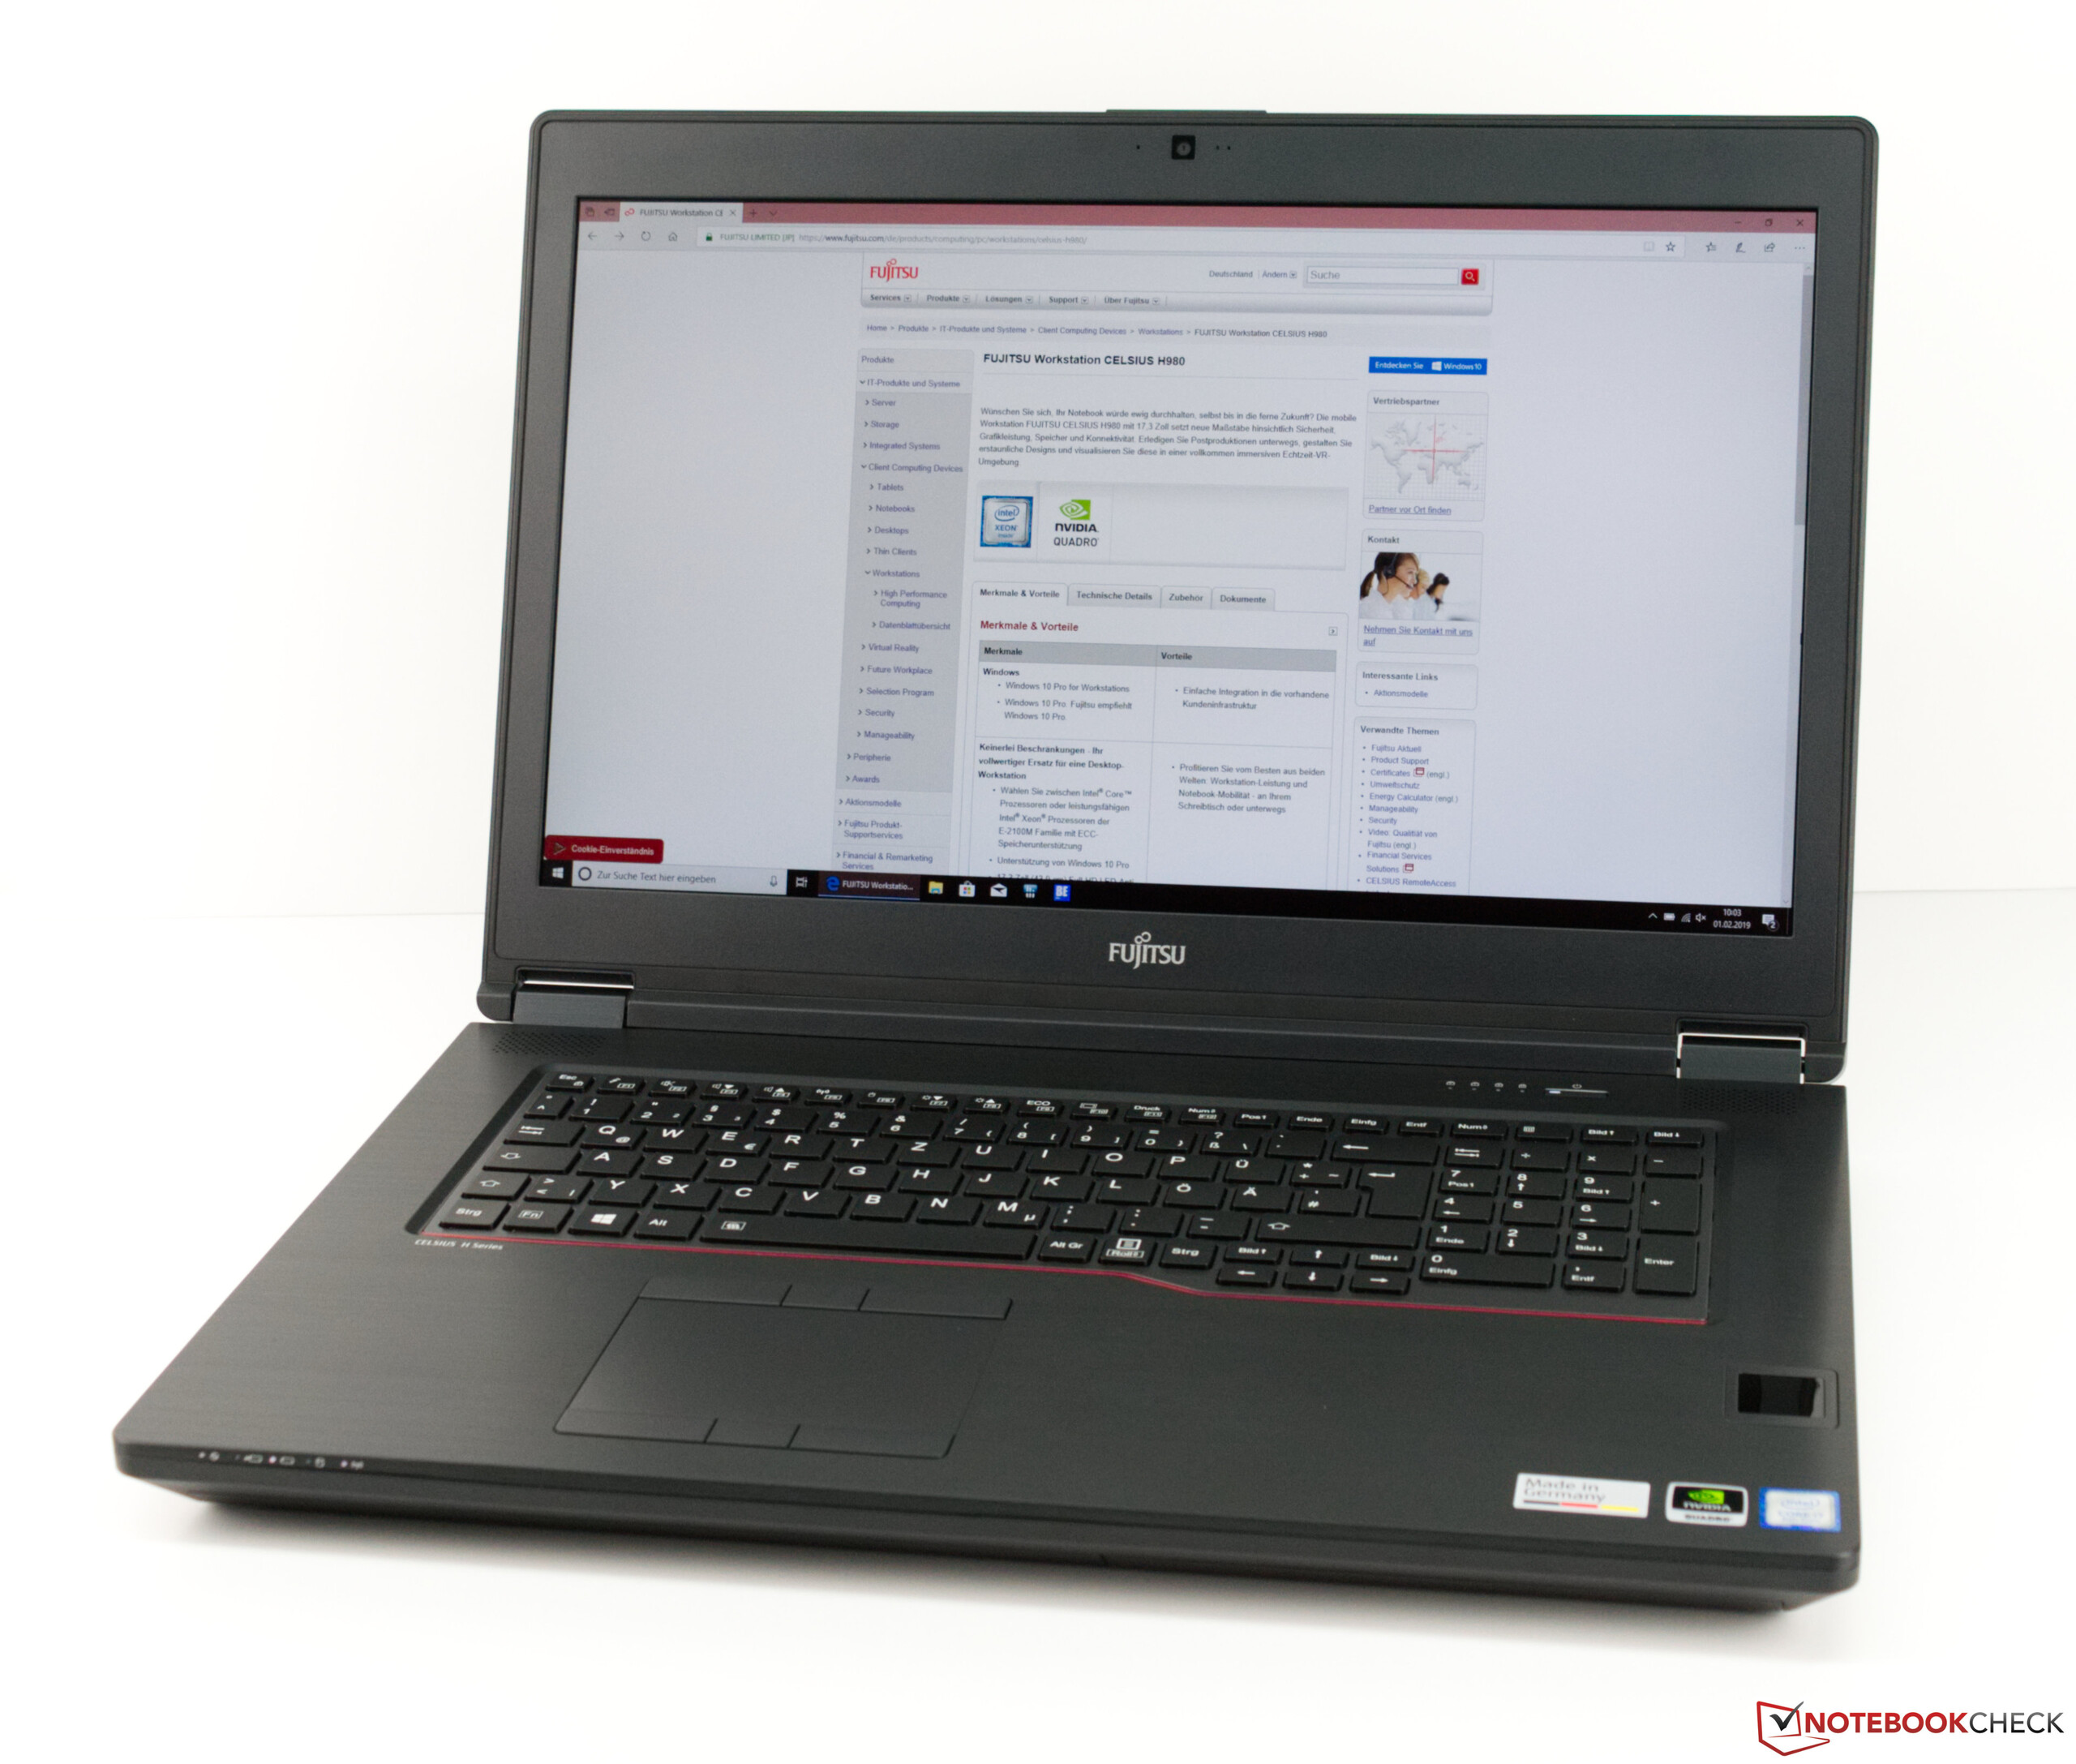
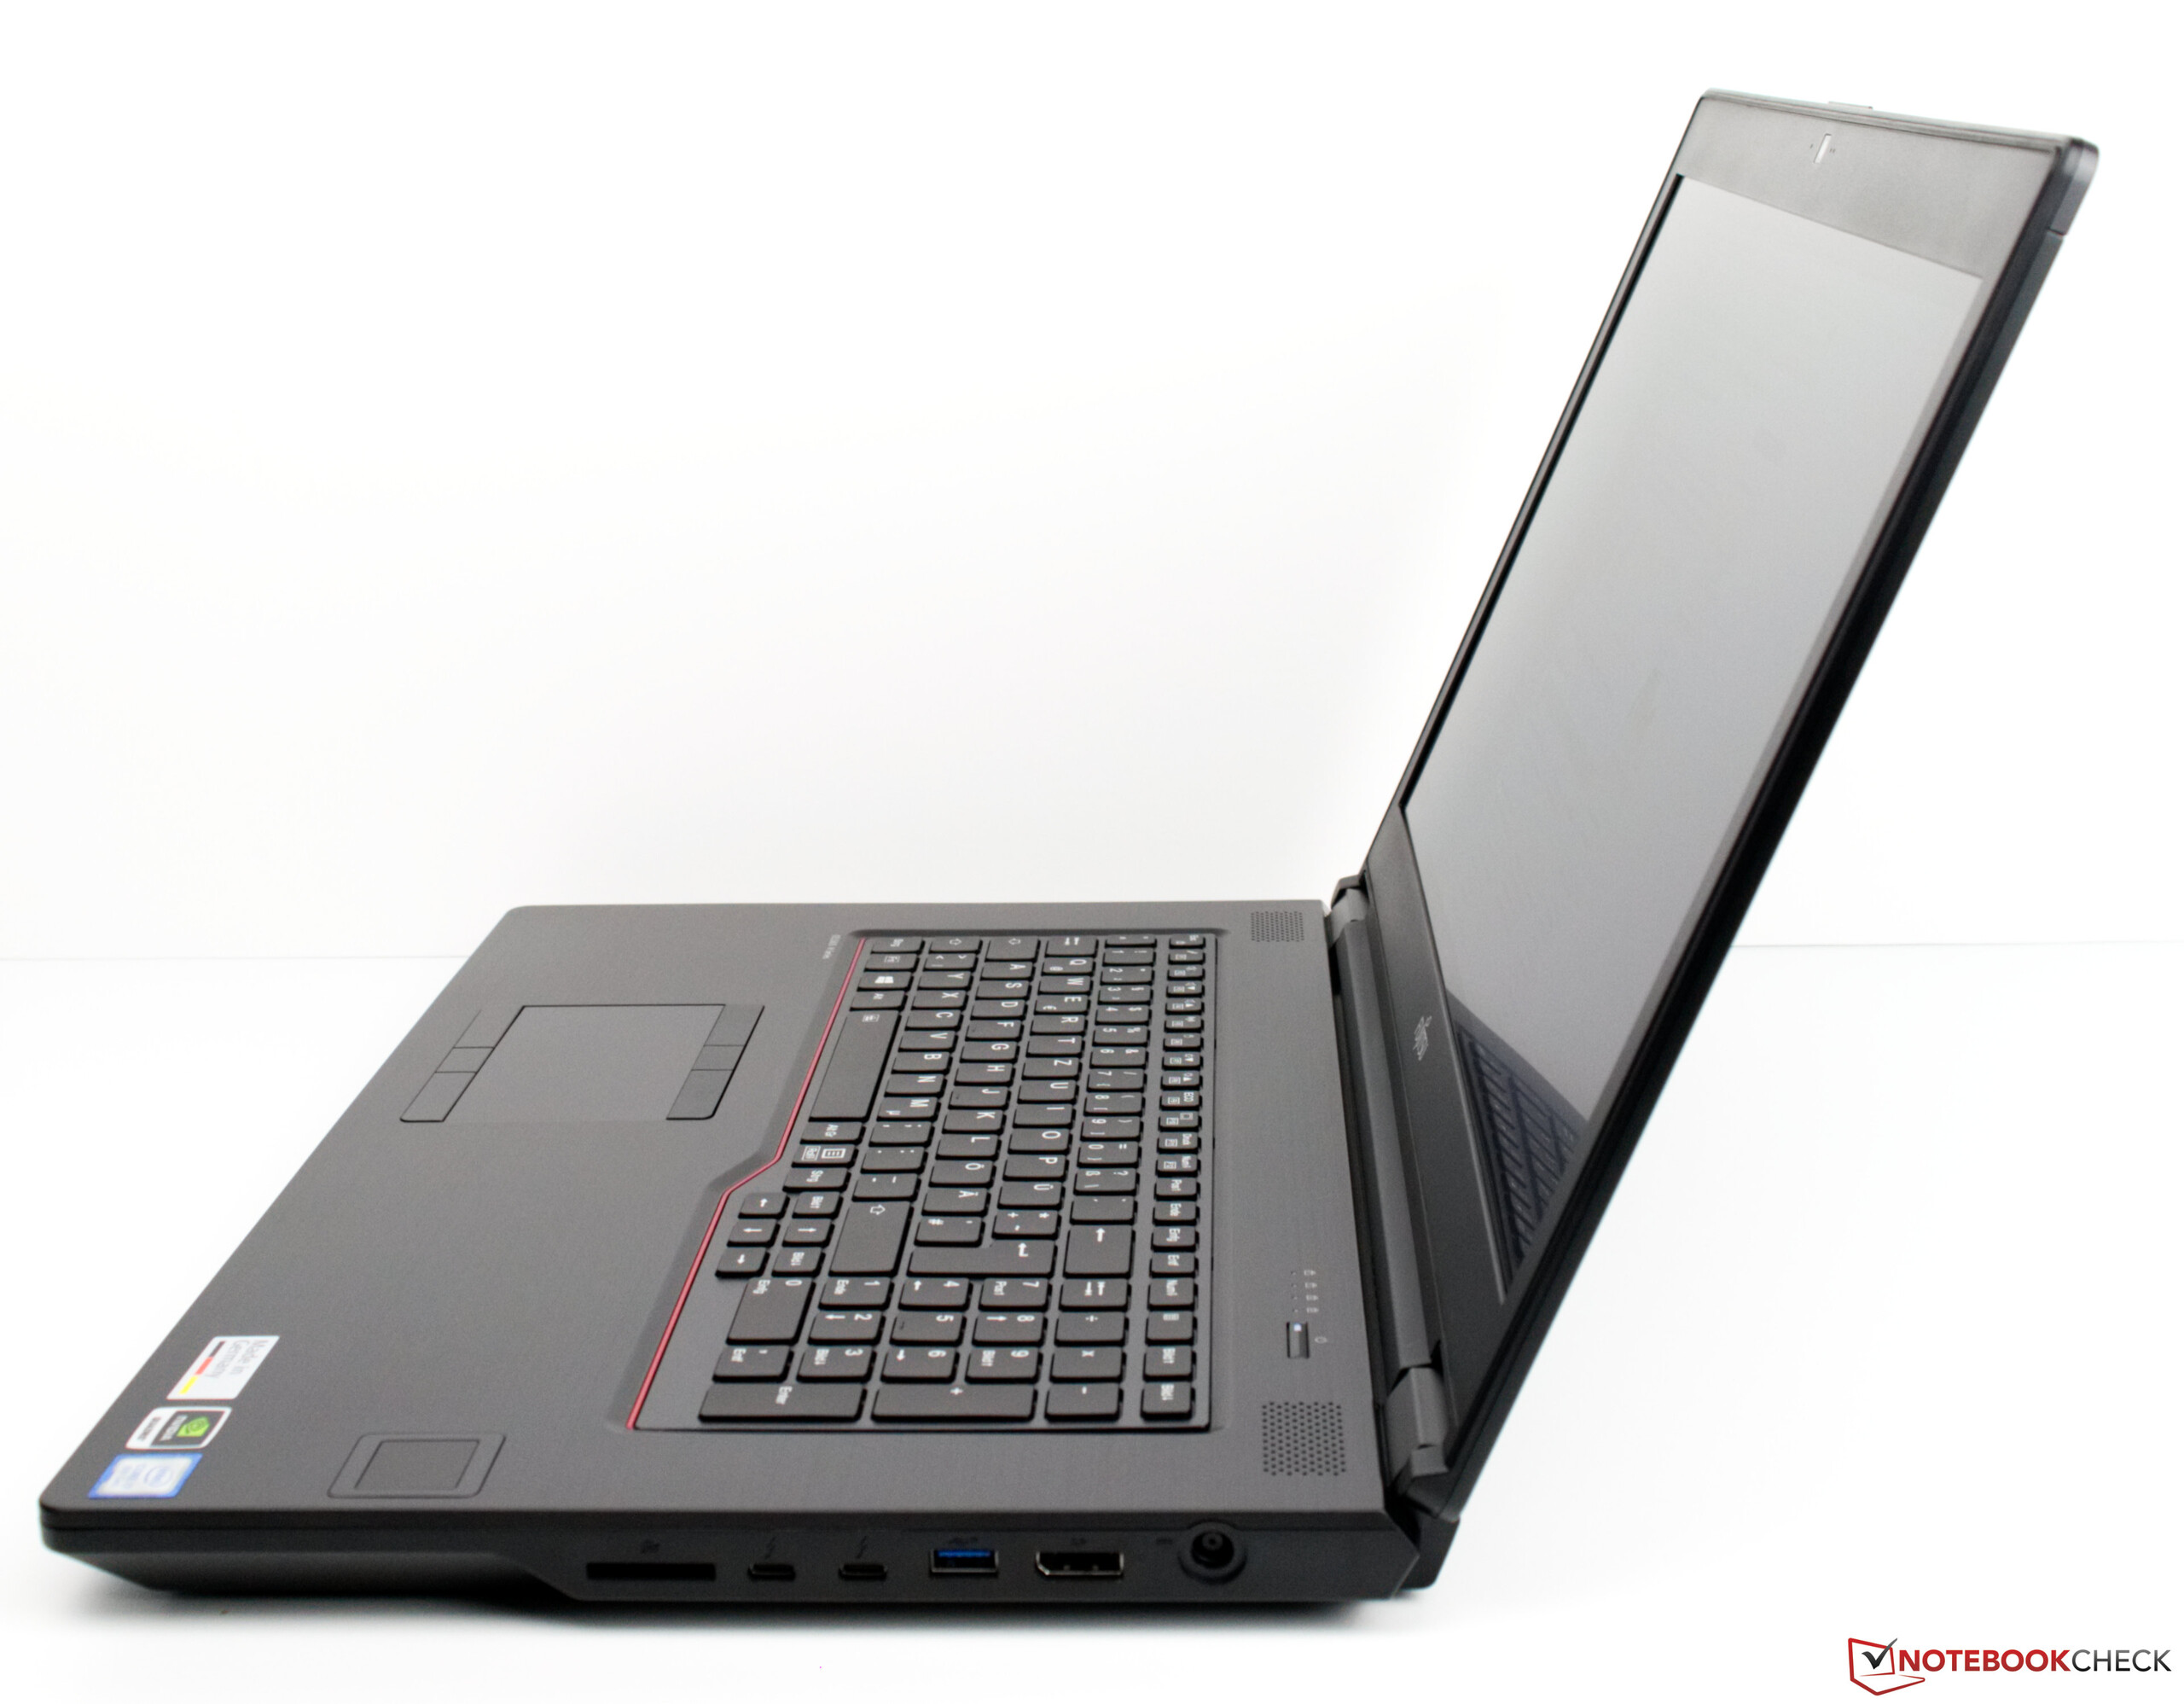
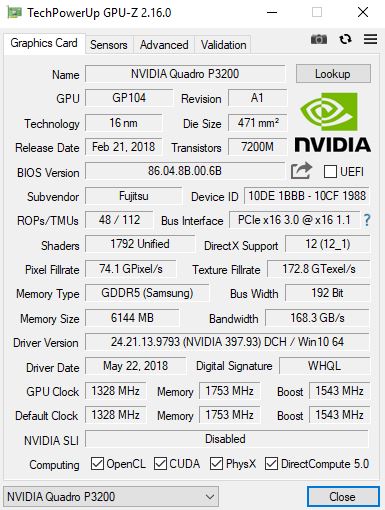
Breve Análise do Workstation Fujitsu Celsius H980 (Core i7-8750H, NVIDIA Quadro P3200)
| SD Card Reader | |
| average JPG Copy Test (av. of 3 runs) | |
| HP ZBook 17 G5-2ZC48EA (Toshiba Exceria Pro SDXC 64 GB UHS-II) | |
| Lenovo ThinkPad P72-20MB000EGE (Toshiba Exceria Pro SDXC 64 GB UHS-II) | |
| Fujitsu Celsius H980 (Toshiba Exceria Pro SDXC 64 GB UHS-II) | |
| Média da turma Workstation (49.6 - 681, n=14, últimos 2 anos) | |
| Fujitsu Celsius H970 (Toshiba Exceria Pro SDXC 64 GB UHS-II) | |
| maximum AS SSD Seq Read Test (1GB) | |
| Média da turma Workstation (87.6 - 1455, n=14, últimos 2 anos) | |
| Lenovo ThinkPad P72-20MB000EGE (Toshiba Exceria Pro SDXC 64 GB UHS-II) | |
| HP ZBook 17 G5-2ZC48EA (Toshiba Exceria Pro SDXC 64 GB UHS-II) | |
| Fujitsu Celsius H980 (Toshiba Exceria Pro SDXC 64 GB UHS-II) | |
| Fujitsu Celsius H970 (Toshiba Exceria Pro SDXC 64 GB UHS-II) | |
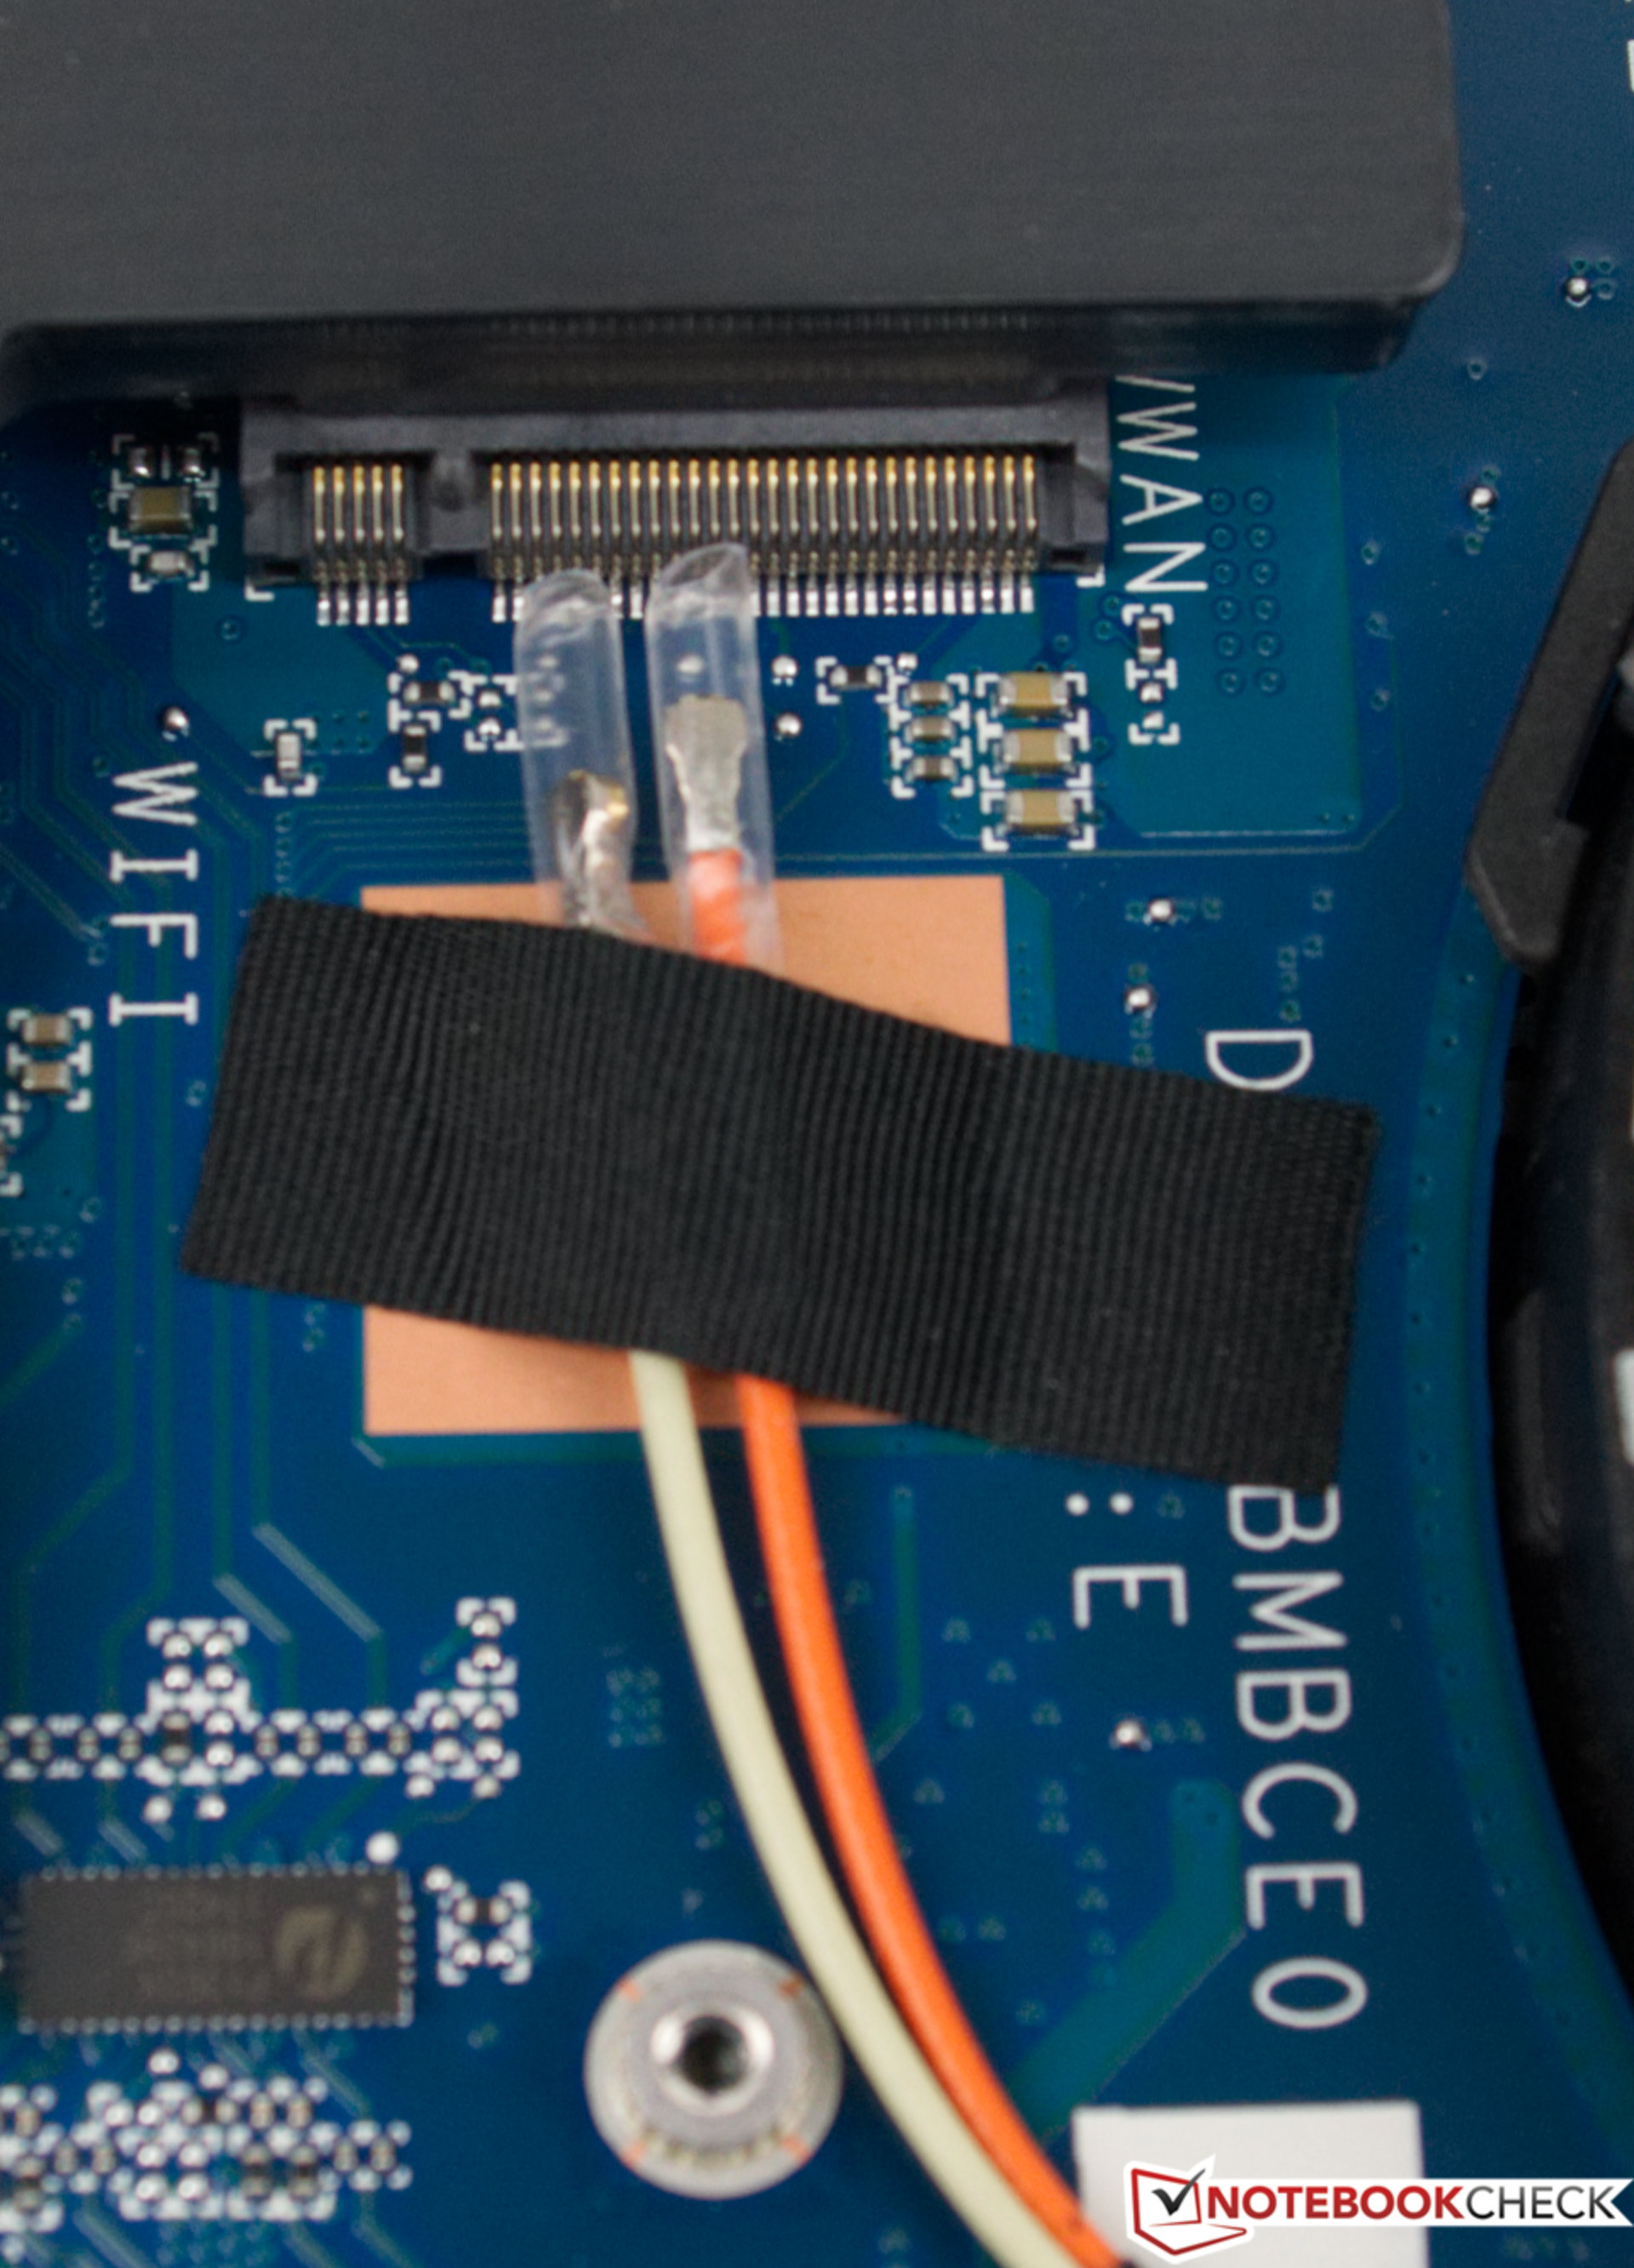
| Networking | |
| iperf3 transmit AX12 | |
| HP ZBook 17 G5-2ZC48EA | |
| Fujitsu Celsius H980 | |
| Lenovo ThinkPad P72-20MB000EGE | |
| Dell Precision 7720 | |
| Fujitsu Celsius H970 | |
| iperf3 receive AX12 | |
| Fujitsu Celsius H980 | |
| Lenovo ThinkPad P72-20MB000EGE | |
| Fujitsu Celsius H970 | |
| HP ZBook 17 G5-2ZC48EA | |
| Dell Precision 7720 | |
| |||||||||||||||||||||||||
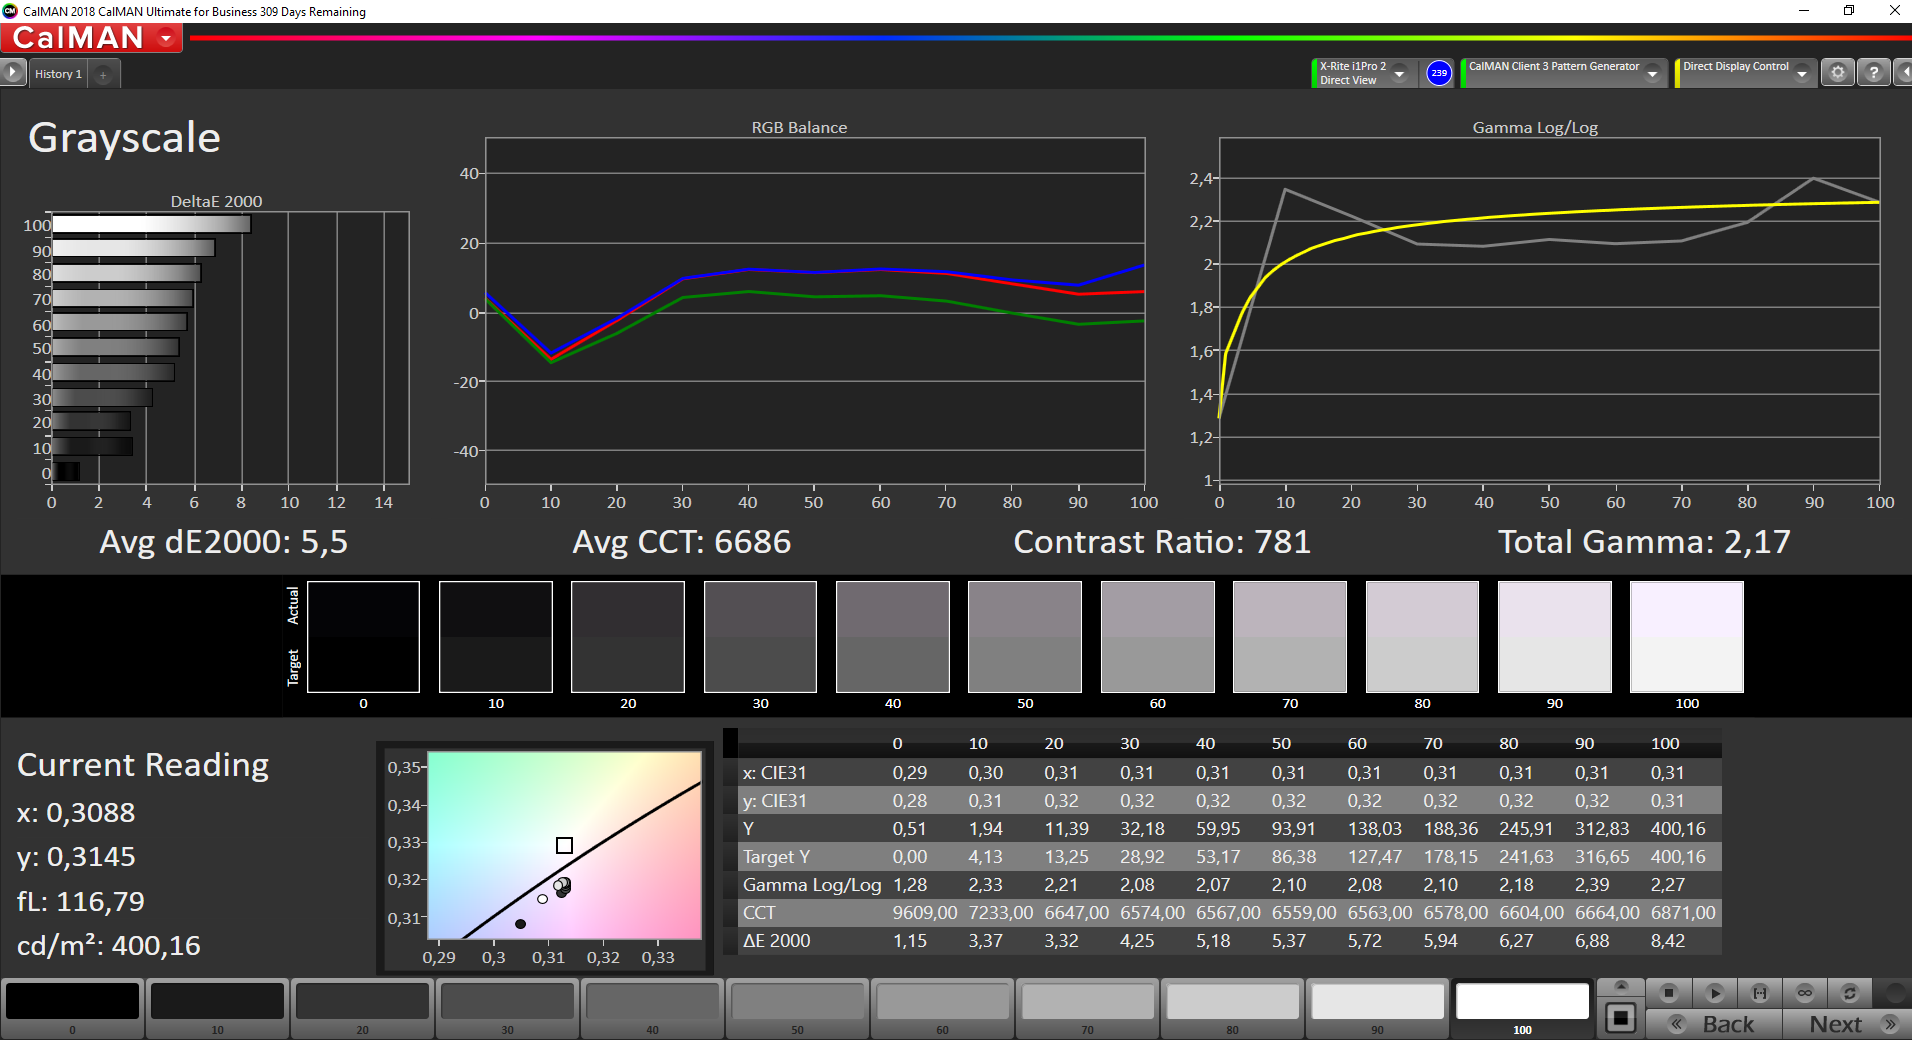
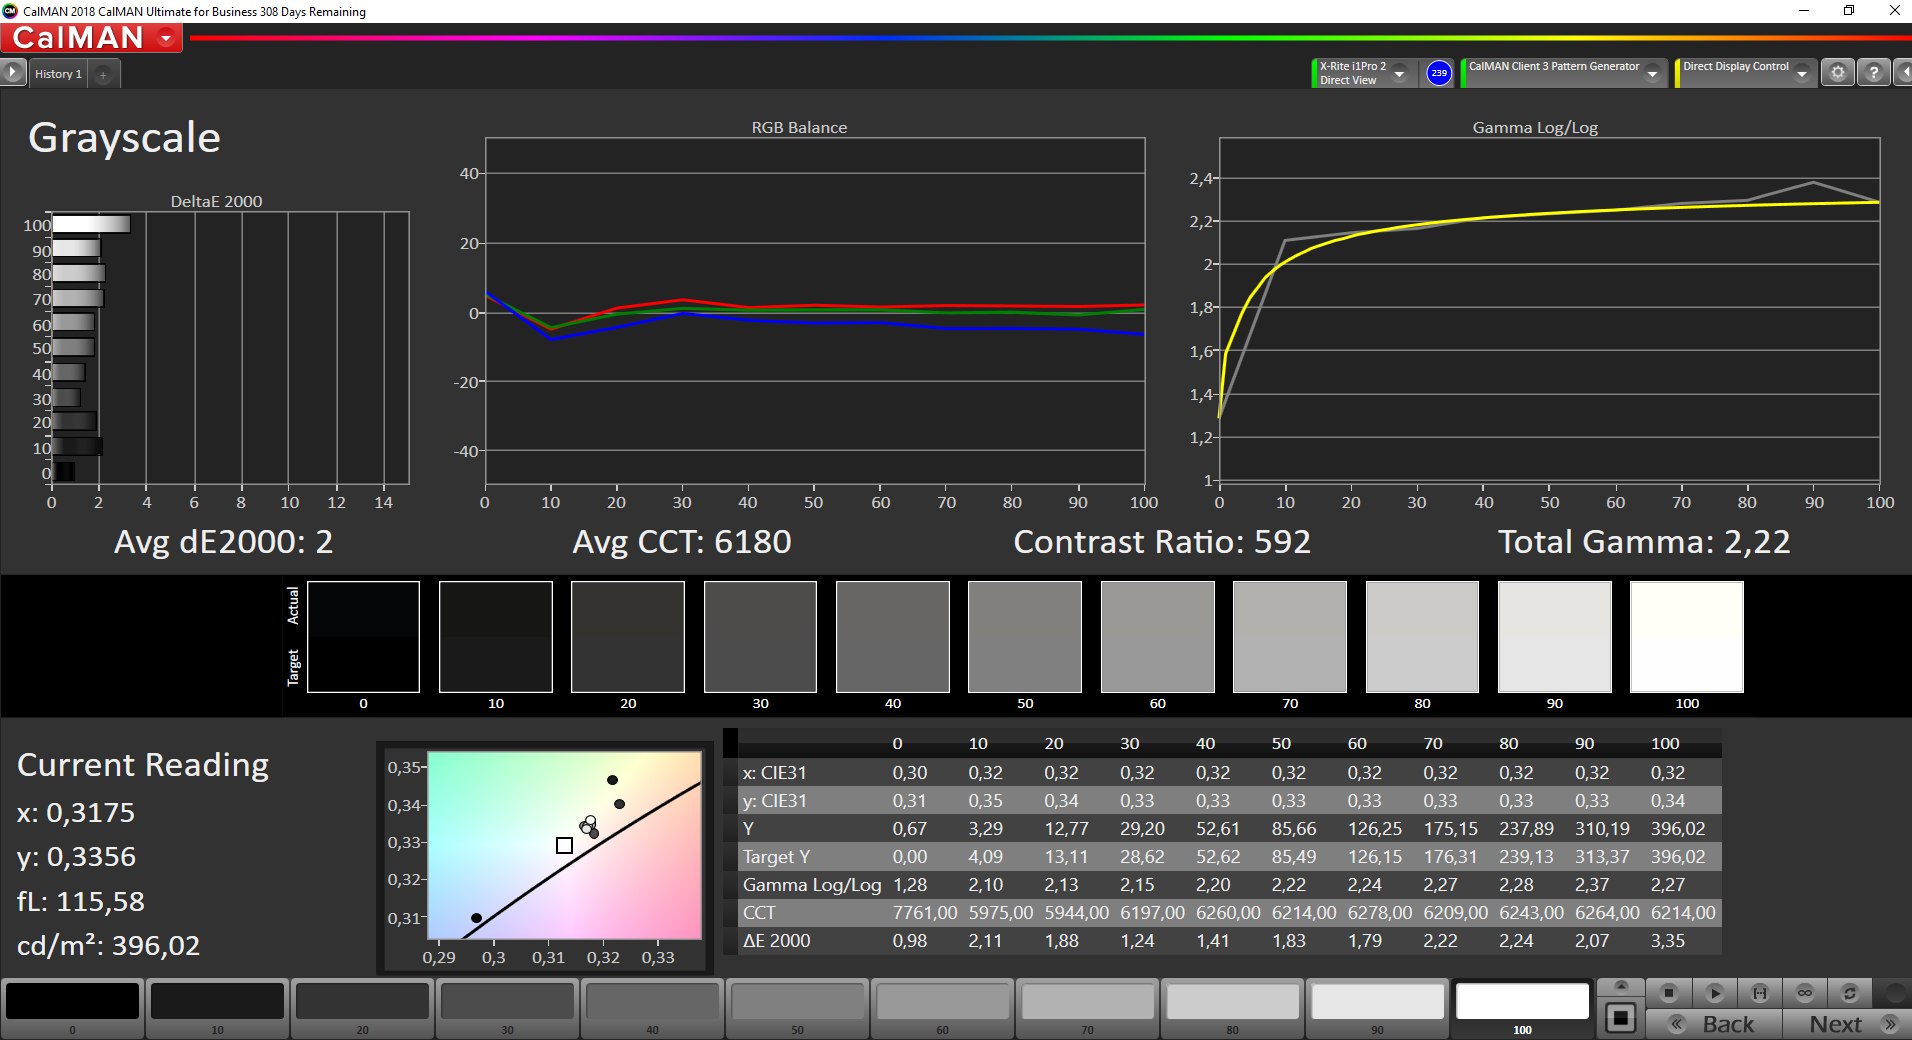
iluminação: 92 %
iluminação com acumulador: 401 cd/m²
Contraste: 784:1 (Preto: 0.51 cd/m²)
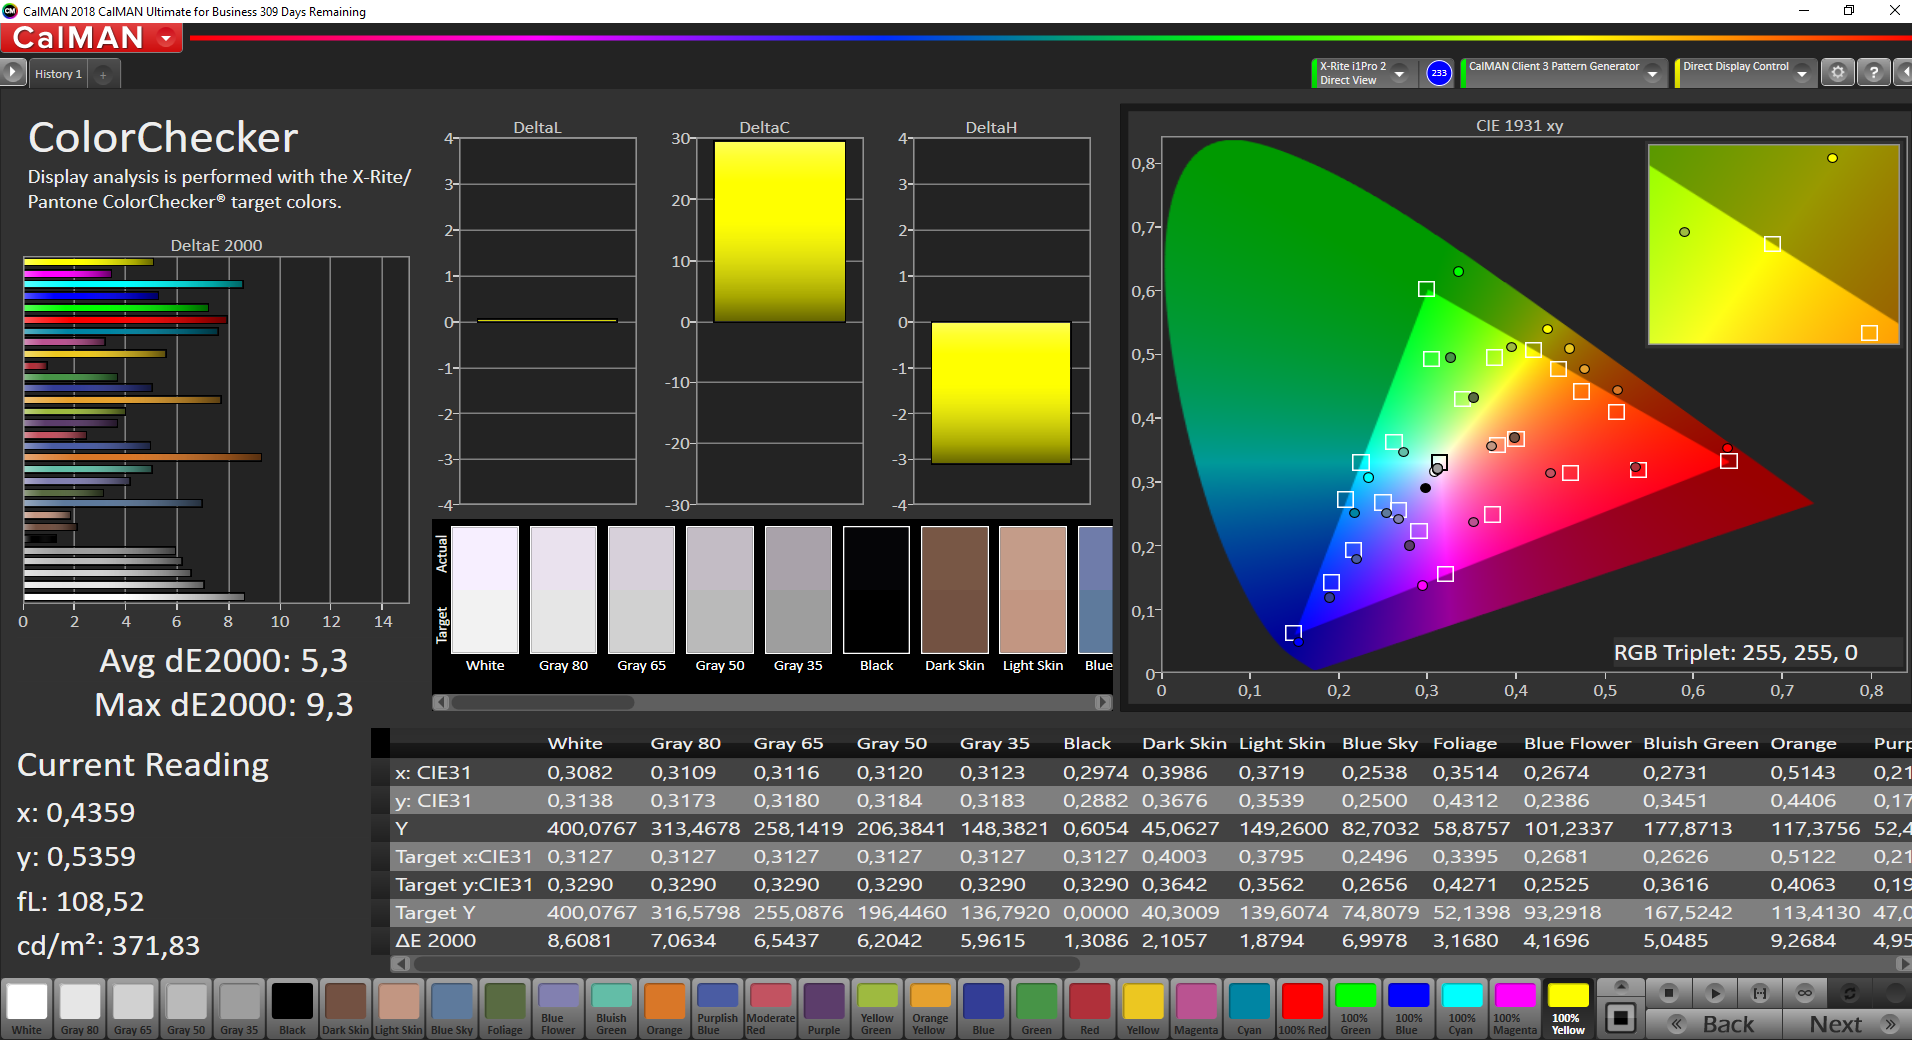
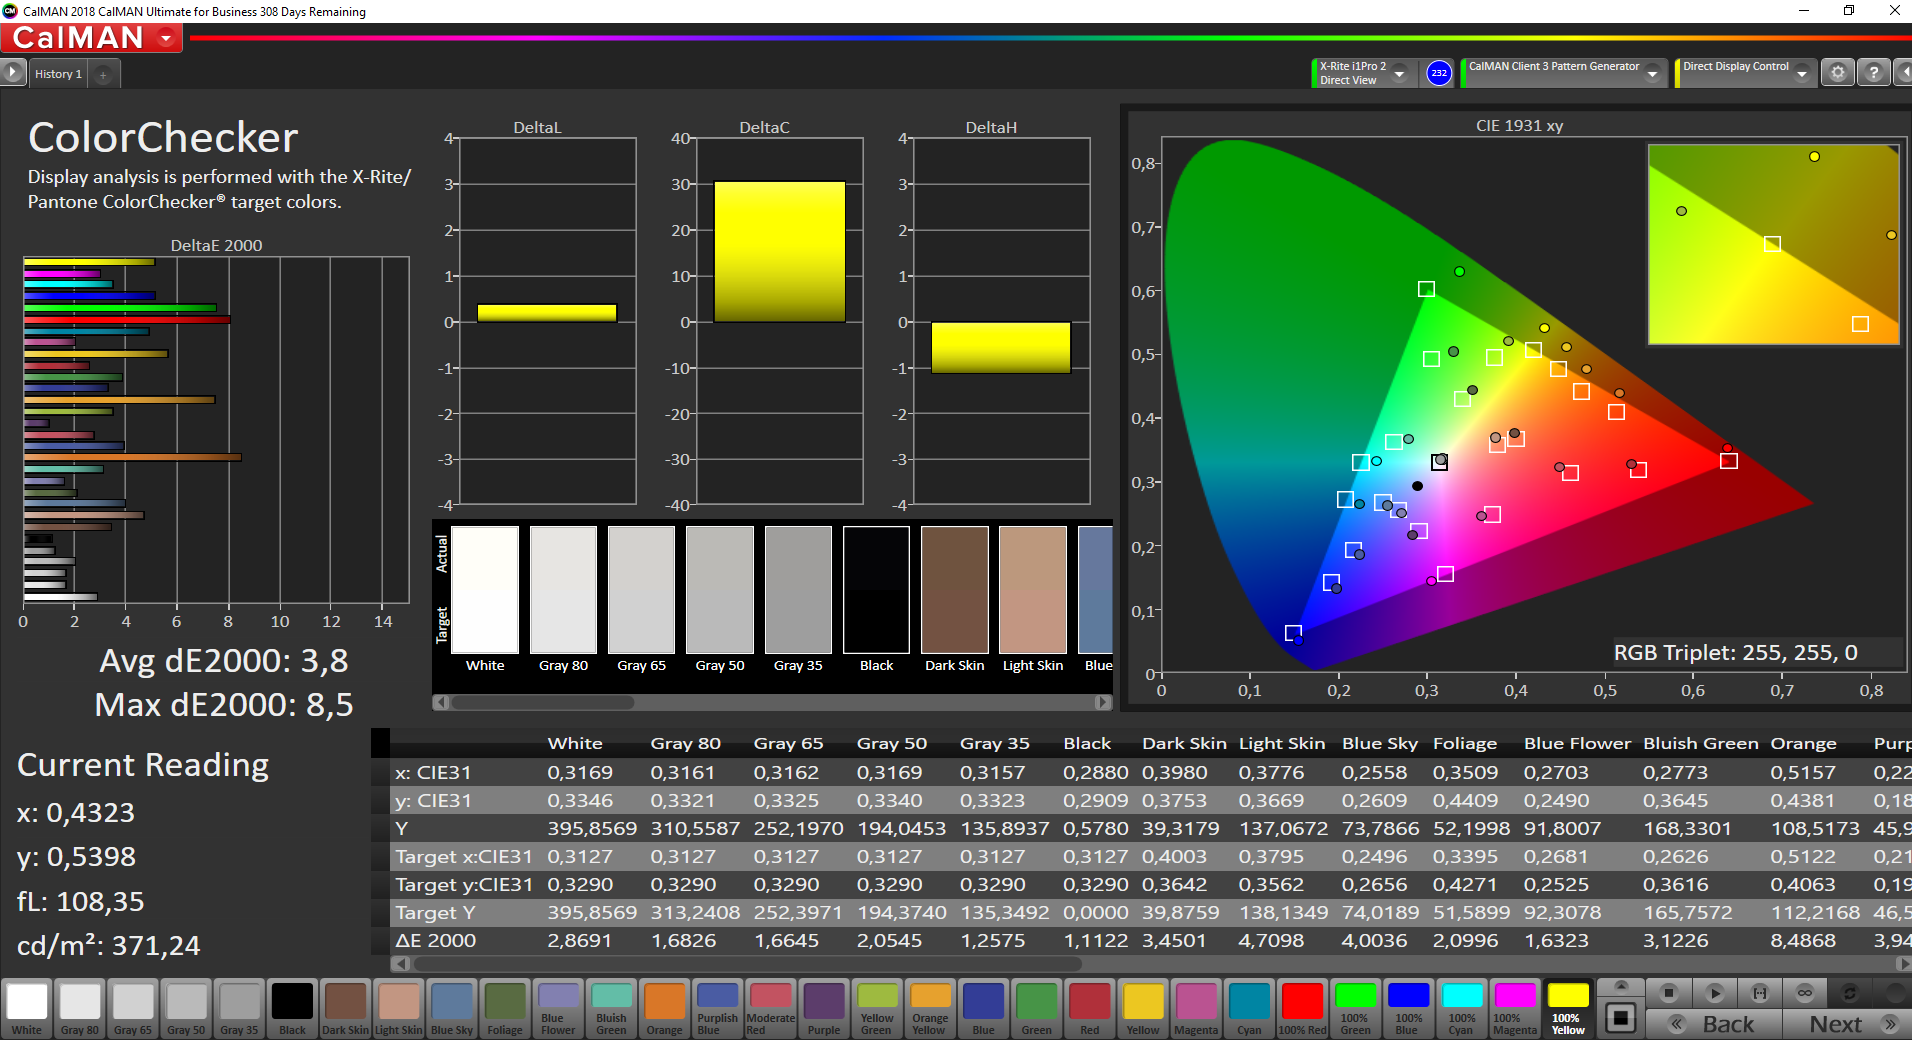
ΔE ColorChecker Calman: 5.3 | ∀{0.5-29.43 Ø4.71}
calibrated: 3.8
ΔE Greyscale Calman: 5.5 | ∀{0.09-98 Ø4.96}
84.9% sRGB (Argyll 1.6.3 3D)
55.8% AdobeRGB 1998 (Argyll 1.6.3 3D)
62.2% AdobeRGB 1998 (Argyll 3D)
85% sRGB (Argyll 3D)
67.3% Display P3 (Argyll 3D)
Gamma: 2.17
CCT: 6686 K
| Fujitsu Celsius H980 LG Philips, LP173WF4-SPF5, IPS, 1920x1080, 17.3" | Fujitsu Celsius H970 LP173WF4-SPF3, IPS LED, 1920x1080, 17.3" | Dell Precision 7720 SHP1446 (LQ173D1), IGZO, 3840x2160, 17.3" | Lenovo ThinkPad P72-20MB000EGE LP173WF4_SPF7, IPS, 1920x1080, 17.3" | HP ZBook 17 G5-2ZC48EA AUO B173HW01 V0, , 1920x1080, 17.3" | |
|---|---|---|---|---|---|
| Display | -1% | 36% | 0% | 3% | |
| Display P3 Coverage (%) | 67.3 | 66.8 -1% | 87.6 30% | 67.4 0% | 66.3 -1% |
| sRGB Coverage (%) | 85 | 84.6 0% | 100 18% | 85 0% | 89.9 6% |
| AdobeRGB 1998 Coverage (%) | 62.2 | 61.8 -1% | 99.2 59% | 62.2 0% | |
| Response Times | 1% | -79% | -16% | -17% | |
| Response Time Grey 50% / Grey 80% * (ms) | 38 ? | 32 ? 16% | 60 ? -58% | 40.8 ? -7% | 42.4 ? -12% |
| Response Time Black / White * (ms) | 23.2 ? | 26.4 ? -14% | 46.4 ? -100% | 28.8 ? -24% | 28.4 ? -22% |
| PWM Frequency (Hz) | 120500 ? | 1020 ? | |||
| Screen | 2% | 24% | 12% | 14% | |
| Brightness middle (cd/m²) | 400 | 368 -8% | 464 16% | 338 -15% | 335 -16% |
| Brightness (cd/m²) | 394 | 360 -9% | 441 12% | 317 -20% | 326 -17% |
| Brightness Distribution (%) | 92 | 91 -1% | 89 -3% | 86 -7% | 92 0% |
| Black Level * (cd/m²) | 0.51 | 0.3 41% | 0.45 12% | 0.28 45% | 0.22 57% |
| Contrast (:1) | 784 | 1227 57% | 1031 32% | 1207 54% | 1523 94% |
| Colorchecker dE 2000 * | 5.3 | 6.4 -21% | 3.2 40% | 4.3 19% | 4.7 11% |
| Colorchecker dE 2000 max. * | 9.3 | 10.1 -9% | 6.1 34% | 10.2 -10% | 8.7 6% |
| Colorchecker dE 2000 calibrated * | 3.8 | 3.7 3% | 2.7 29% | ||
| Greyscale dE 2000 * | 5.5 | 7.2 -31% | 4.2 24% | 2.2 60% | 6.5 -18% |
| Gamma | 2.17 101% | 2.02 109% | 2.01 109% | 2.17 101% | 2.23 99% |
| CCT | 6686 97% | 6882 94% | 6736 96% | 6621 98% | 6108 106% |
| Color Space (Percent of AdobeRGB 1998) (%) | 55.8 | 55.5 -1% | 88.1 58% | 55.8 0% | 58.7 5% |
| Color Space (Percent of sRGB) (%) | 84.9 | 84.4 -1% | 100 18% | 84.7 0% | 89.7 6% |
| Média Total (Programa/Configurações) | 1% /
1% | -6% /
13% | -1% /
6% | 0% /
9% |
* ... menor é melhor
Exibir tempos de resposta
| ↔ Tempo de resposta preto para branco | ||
|---|---|---|
| 23.2 ms ... ascensão ↗ e queda ↘ combinadas | ↗ 10 ms ascensão | 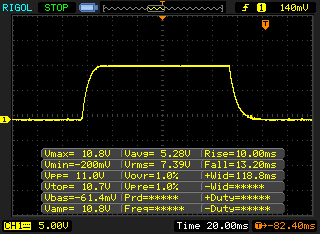 |
| ↘ 13.2 ms queda | ||
| A tela mostra boas taxas de resposta em nossos testes, mas pode ser muito lenta para jogadores competitivos. Em comparação, todos os dispositivos testados variam de 0.1 (mínimo) a 240 (máximo) ms. » 53 % de todos os dispositivos são melhores. Isso significa que o tempo de resposta medido é pior que a média de todos os dispositivos testados (19.8 ms). | ||
| ↔ Tempo de resposta 50% cinza a 80% cinza | ||
| 38 ms ... ascensão ↗ e queda ↘ combinadas | ↗ 19.2 ms ascensão | 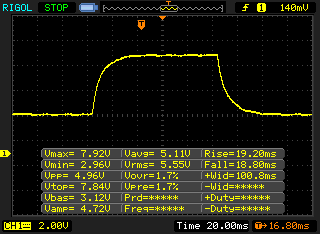 |
| ↘ 18.8 ms queda | ||
| A tela mostra taxas de resposta lentas em nossos testes e será insatisfatória para os jogadores. Em comparação, todos os dispositivos testados variam de 0.165 (mínimo) a 636 (máximo) ms. » 55 % de todos os dispositivos são melhores. Isso significa que o tempo de resposta medido é pior que a média de todos os dispositivos testados (30.9 ms). | ||
Cintilação da tela / PWM (modulação por largura de pulso)
| Tela tremeluzindo/PWM detectado | 120500 Hz | ≤ 99 % configuração de brilho | 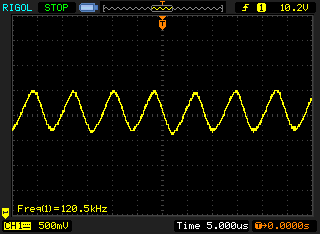 |
A luz de fundo da tela pisca em 120500 Hz (pior caso, por exemplo, utilizando PWM) Cintilação detectada em uma configuração de brilho de 99 % e abaixo. Não deve haver cintilação ou PWM acima desta configuração de brilho. A frequência de 120500 Hz é bastante alta, então a maioria dos usuários sensíveis ao PWM não deve notar nenhuma oscilação. [pwm_comparison] Em comparação: 52 % de todos os dispositivos testados não usam PWM para escurecer a tela. Se PWM foi detectado, uma média de 7748 (mínimo: 5 - máximo: 343500) Hz foi medida. | |||

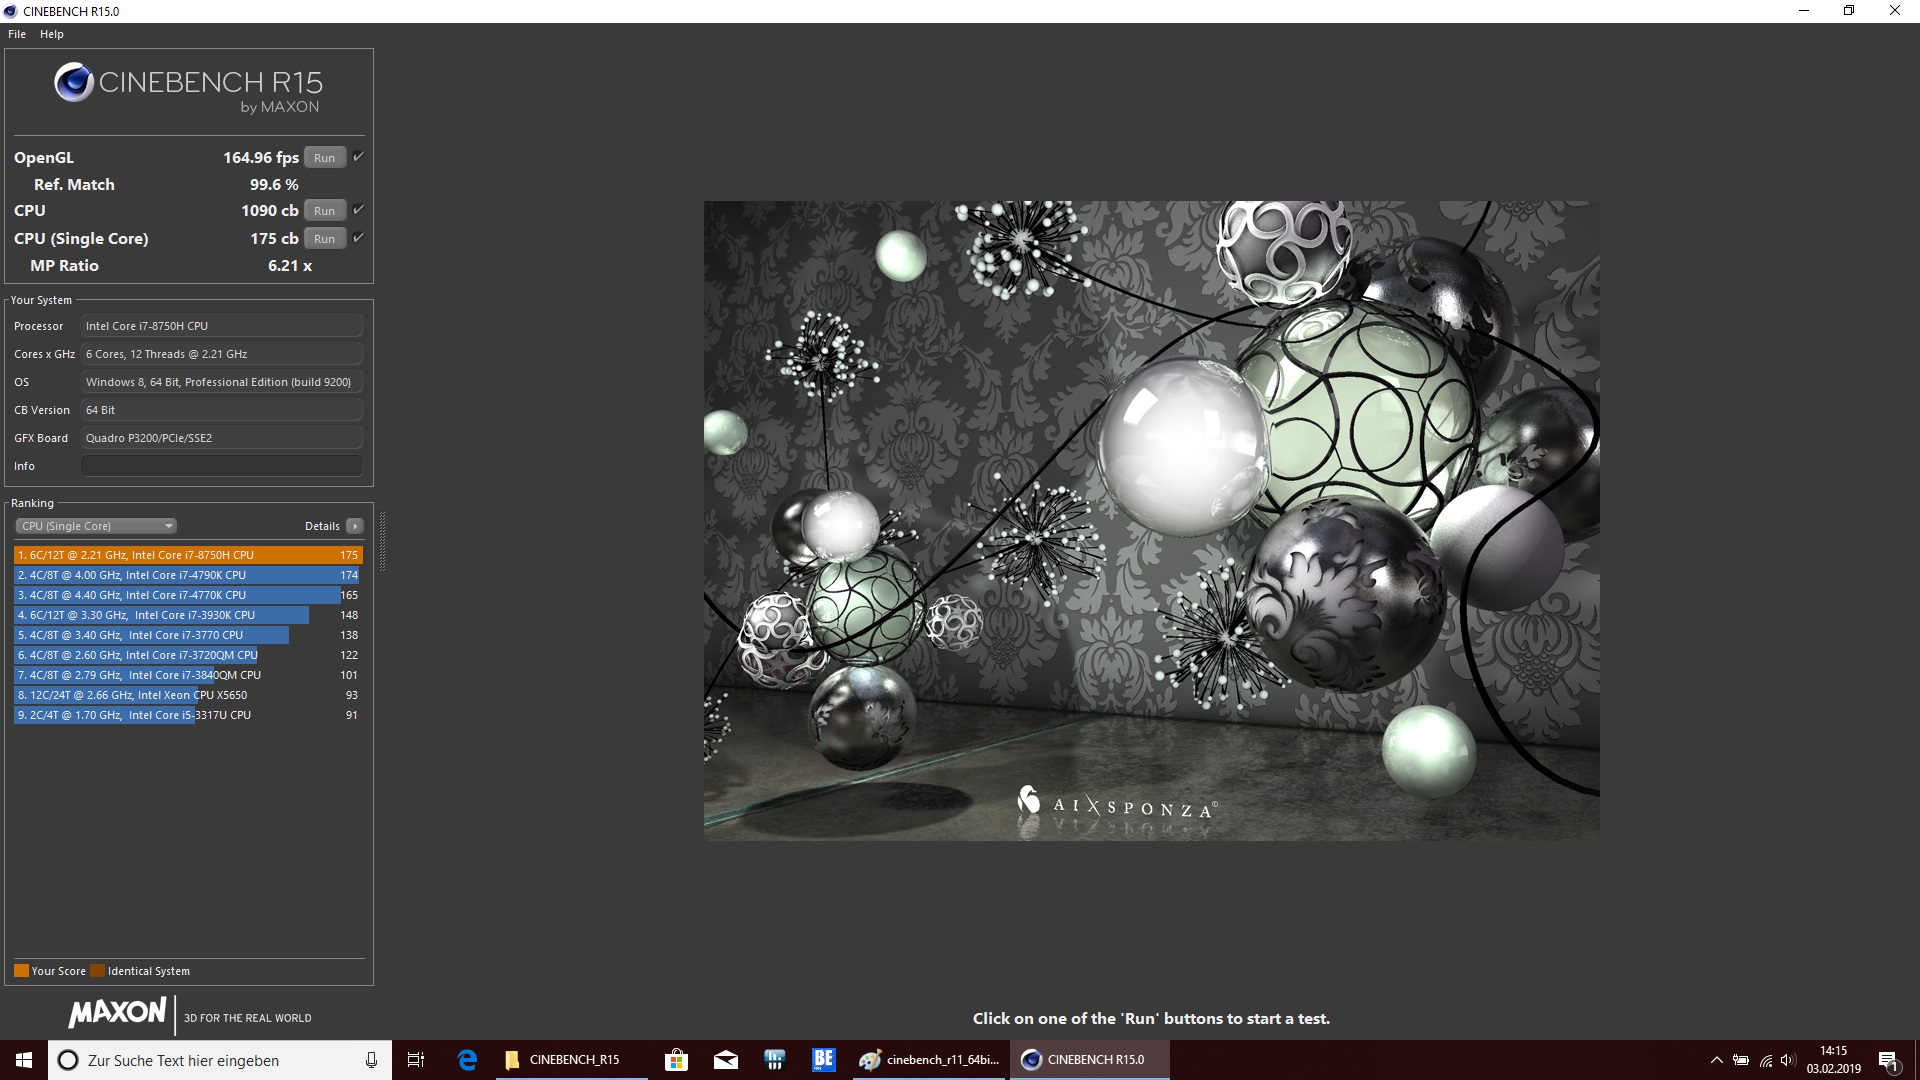
| Cinebench R15 | |
| CPU Single 64Bit | |
| Média da turma Workstation (191.4 - 328, n=23, últimos 2 anos) | |
| Eurocom Tornado F7W | |
| Lenovo ThinkPad P72-20MB000EGE | |
| HP ZBook 17 G5-2ZC48EA | |
| Dell Precision 7720 | |
| Fujitsu Celsius H980 | |
| Média Intel Core i7-8750H (163 - 177, n=86) | |
| Fujitsu Celsius H970 | |
| CPU Multi 64Bit | |
| Média da turma Workstation (2489 - 5810, n=23, últimos 2 anos) | |
| Eurocom Tornado F7W | |
| Lenovo ThinkPad P72-20MB000EGE | |
| Lenovo ThinkPad P72-20MB000EGE | |
| HP ZBook 17 G5-2ZC48EA | |
| Média Intel Core i7-8750H (863 - 1251, n=93) | |
| Fujitsu Celsius H980 | |
| Dell Precision 7720 | |
| Fujitsu Celsius H970 | |
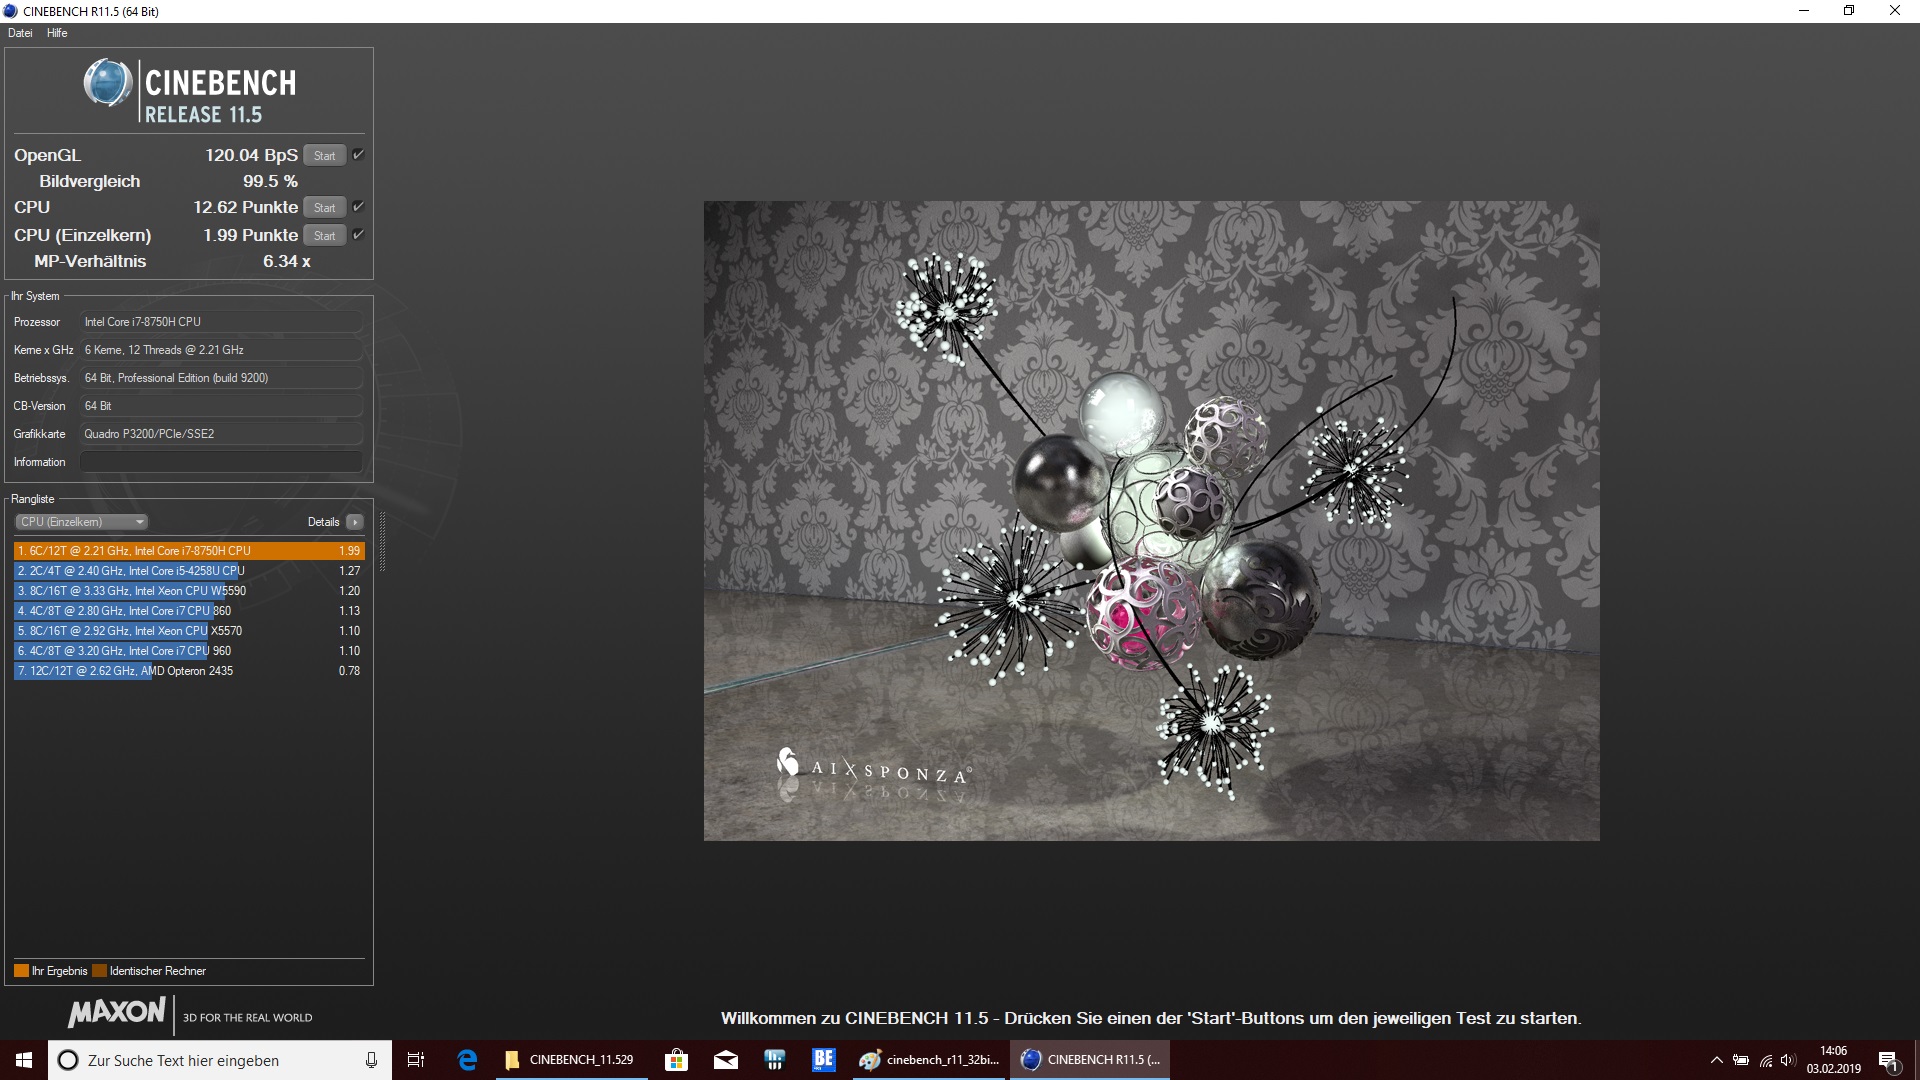
| Cinebench R11.5 | |
| CPU Single 64Bit | |
| Média da turma Workstation (n=1últimos 2 anos) | |
| Eurocom Tornado F7W | |
| Fujitsu Celsius H980 | |
| Média Intel Core i7-8750H (1.89 - 2, n=40) | |
| Fujitsu Celsius H970 | |
| CPU Multi 64Bit | |
| Média da turma Workstation (n=1últimos 2 anos) | |
| Eurocom Tornado F7W | |
| Lenovo ThinkPad P72-20MB000EGE | |
| Fujitsu Celsius H980 | |
| Média Intel Core i7-8750H (9.54 - 13.5, n=41) | |
| Fujitsu Celsius H970 | |
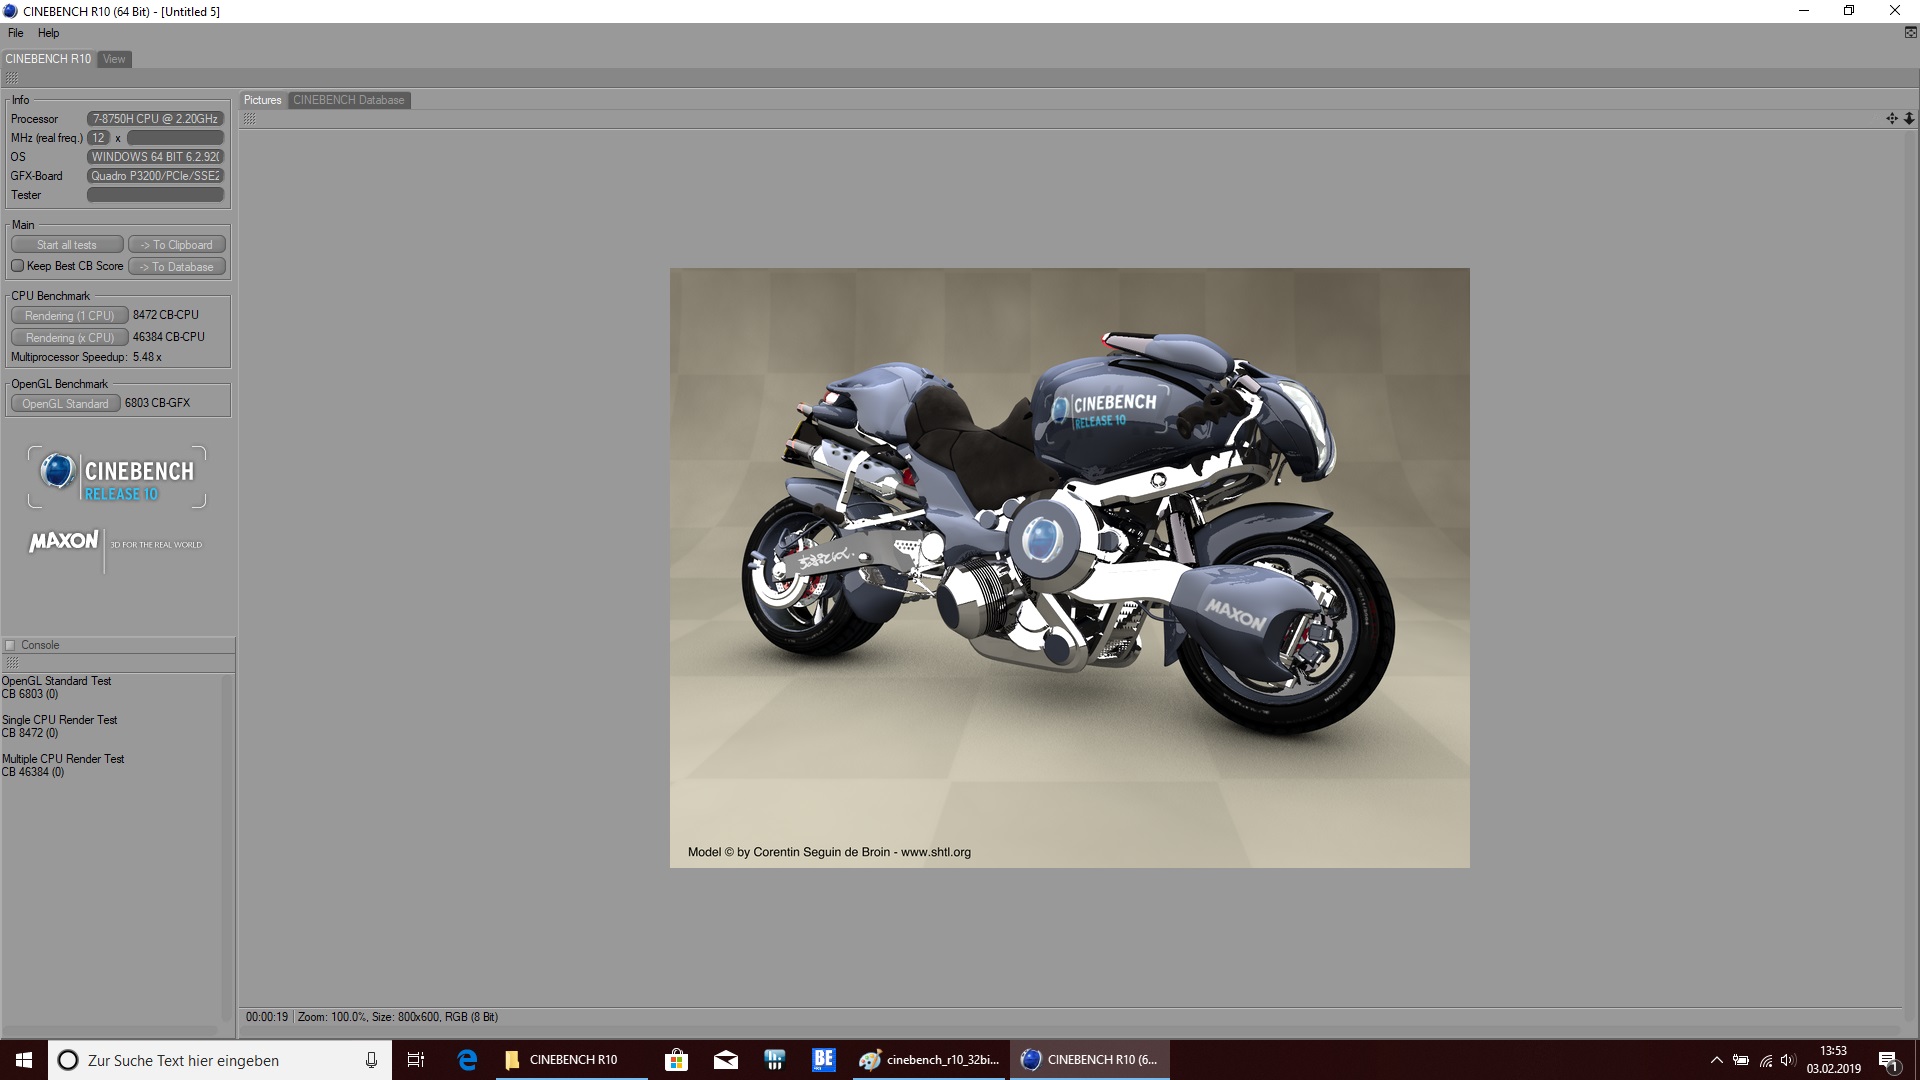
| Cinebench R10 | |
| Rendering Single CPUs 64Bit | |
| Média da turma Workstation (n=1últimos 2 anos) | |
| Média Intel Core i7-8750H (8472 - 8665, n=5) | |
| Fujitsu Celsius H980 | |
| Fujitsu Celsius H970 | |
| Rendering Multiple CPUs 64Bit | |
| Média da turma Workstation (n=1últimos 2 anos) | |
| Fujitsu Celsius H980 | |
| Média Intel Core i7-8750H (33944 - 46384, n=5) | |
| Fujitsu Celsius H970 | |
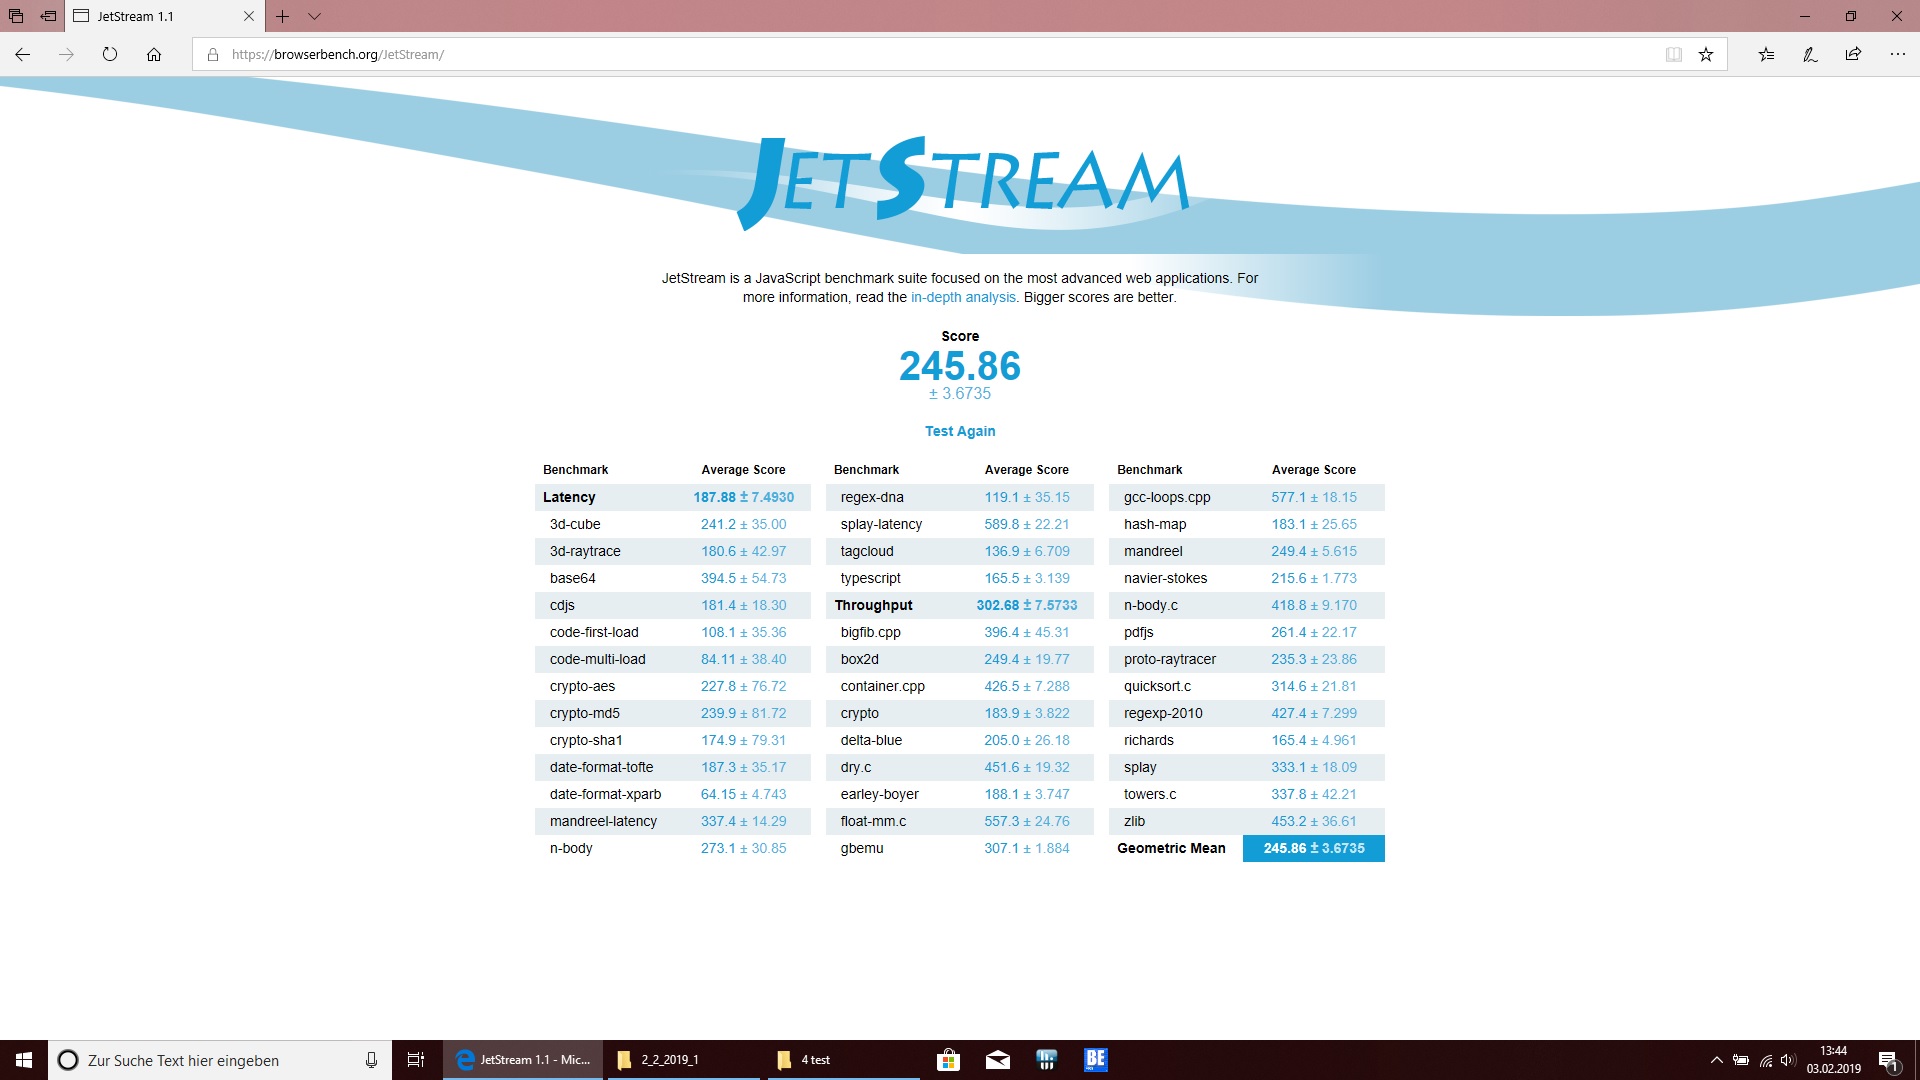
| JetStream 1.1 - 1.1 Total | |
| Eurocom Tornado F7W | |
| Dell Precision 7720 | |
| Fujitsu Celsius H970 | |
| HP ZBook 17 G5-2ZC48EA | |
| Lenovo ThinkPad P72-20MB000EGE | |
| Média Intel Core i7-8750H (205 - 299, n=49) | |
| Fujitsu Celsius H980 | |
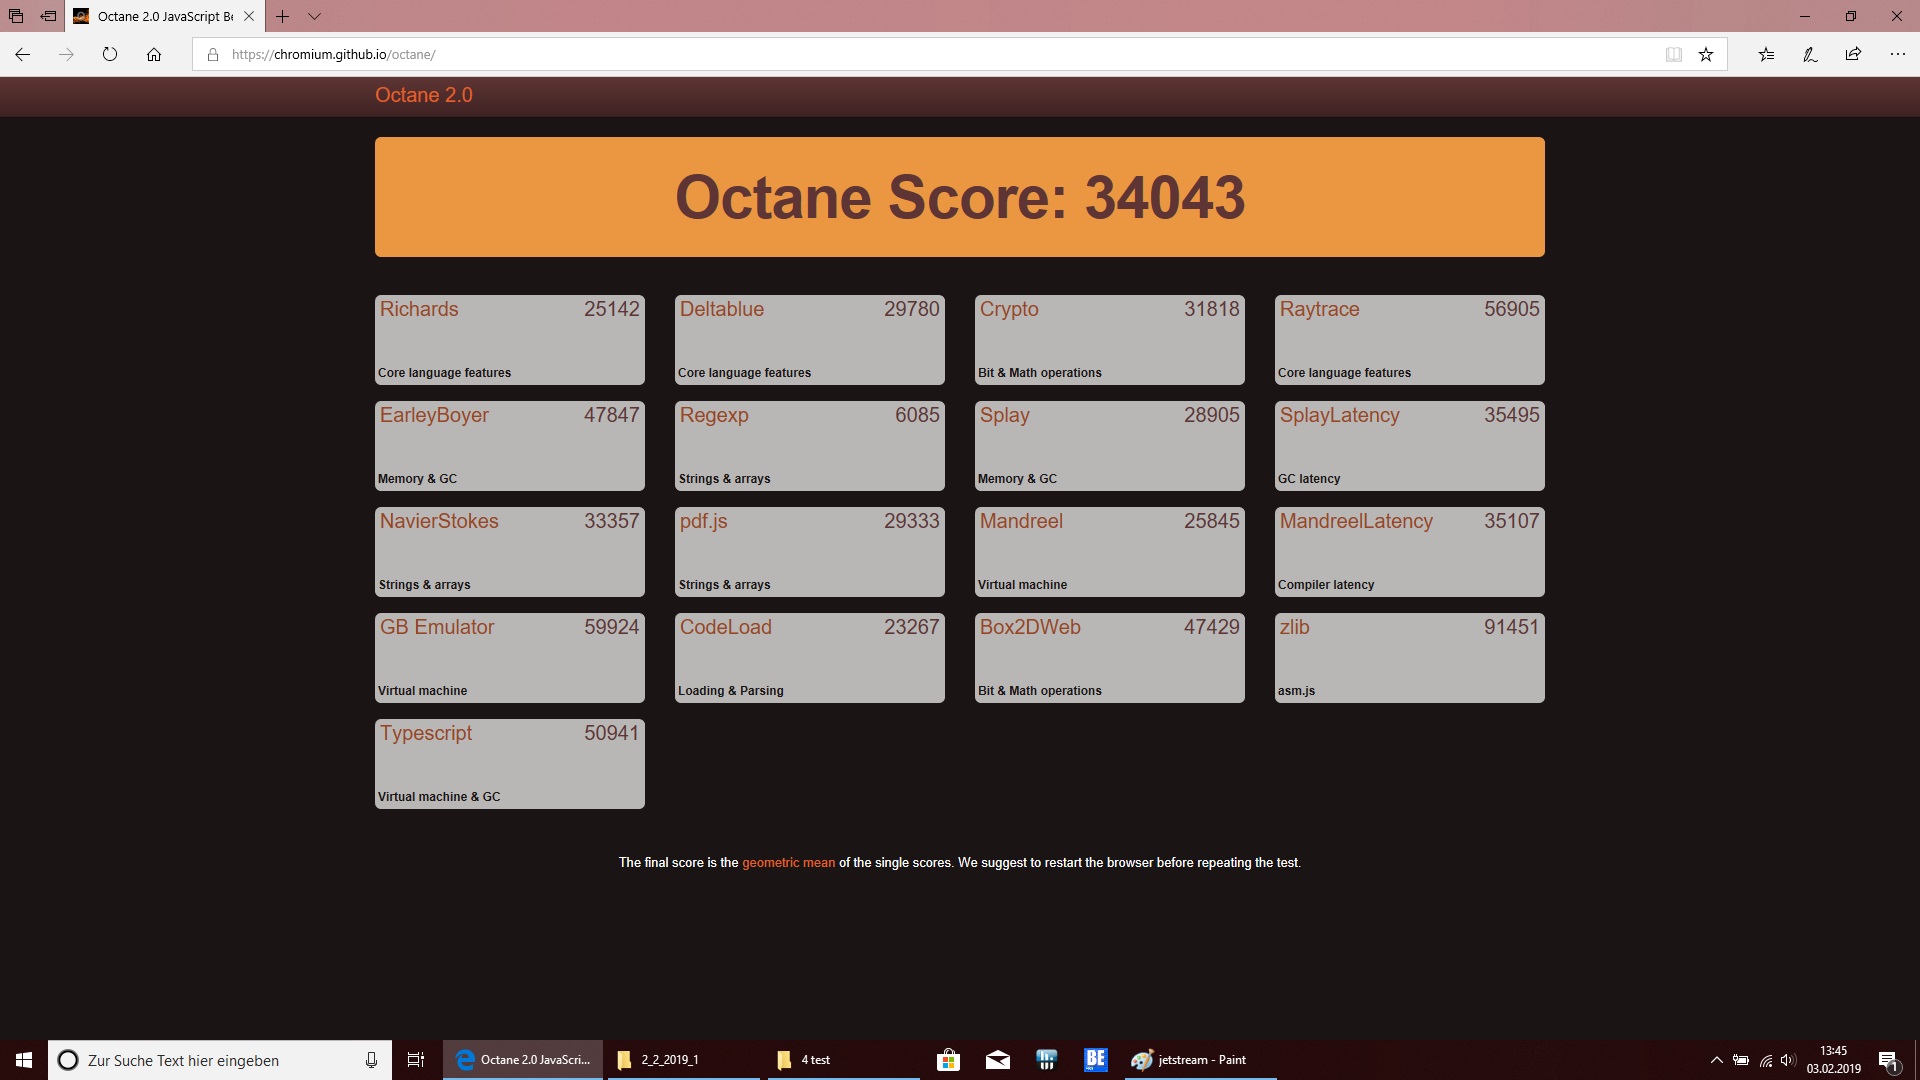
| Octane V2 - Total Score | |
| Média da turma Workstation (112382 - 129420, n=3, últimos 2 anos) | |
| Fujitsu Celsius H970 | |
| Dell Precision 7720 | |
| HP ZBook 17 G5-2ZC48EA | |
| Lenovo ThinkPad P72-20MB000EGE | |
| Média Intel Core i7-8750H (27460 - 44549, n=47) | |
| Fujitsu Celsius H980 | |
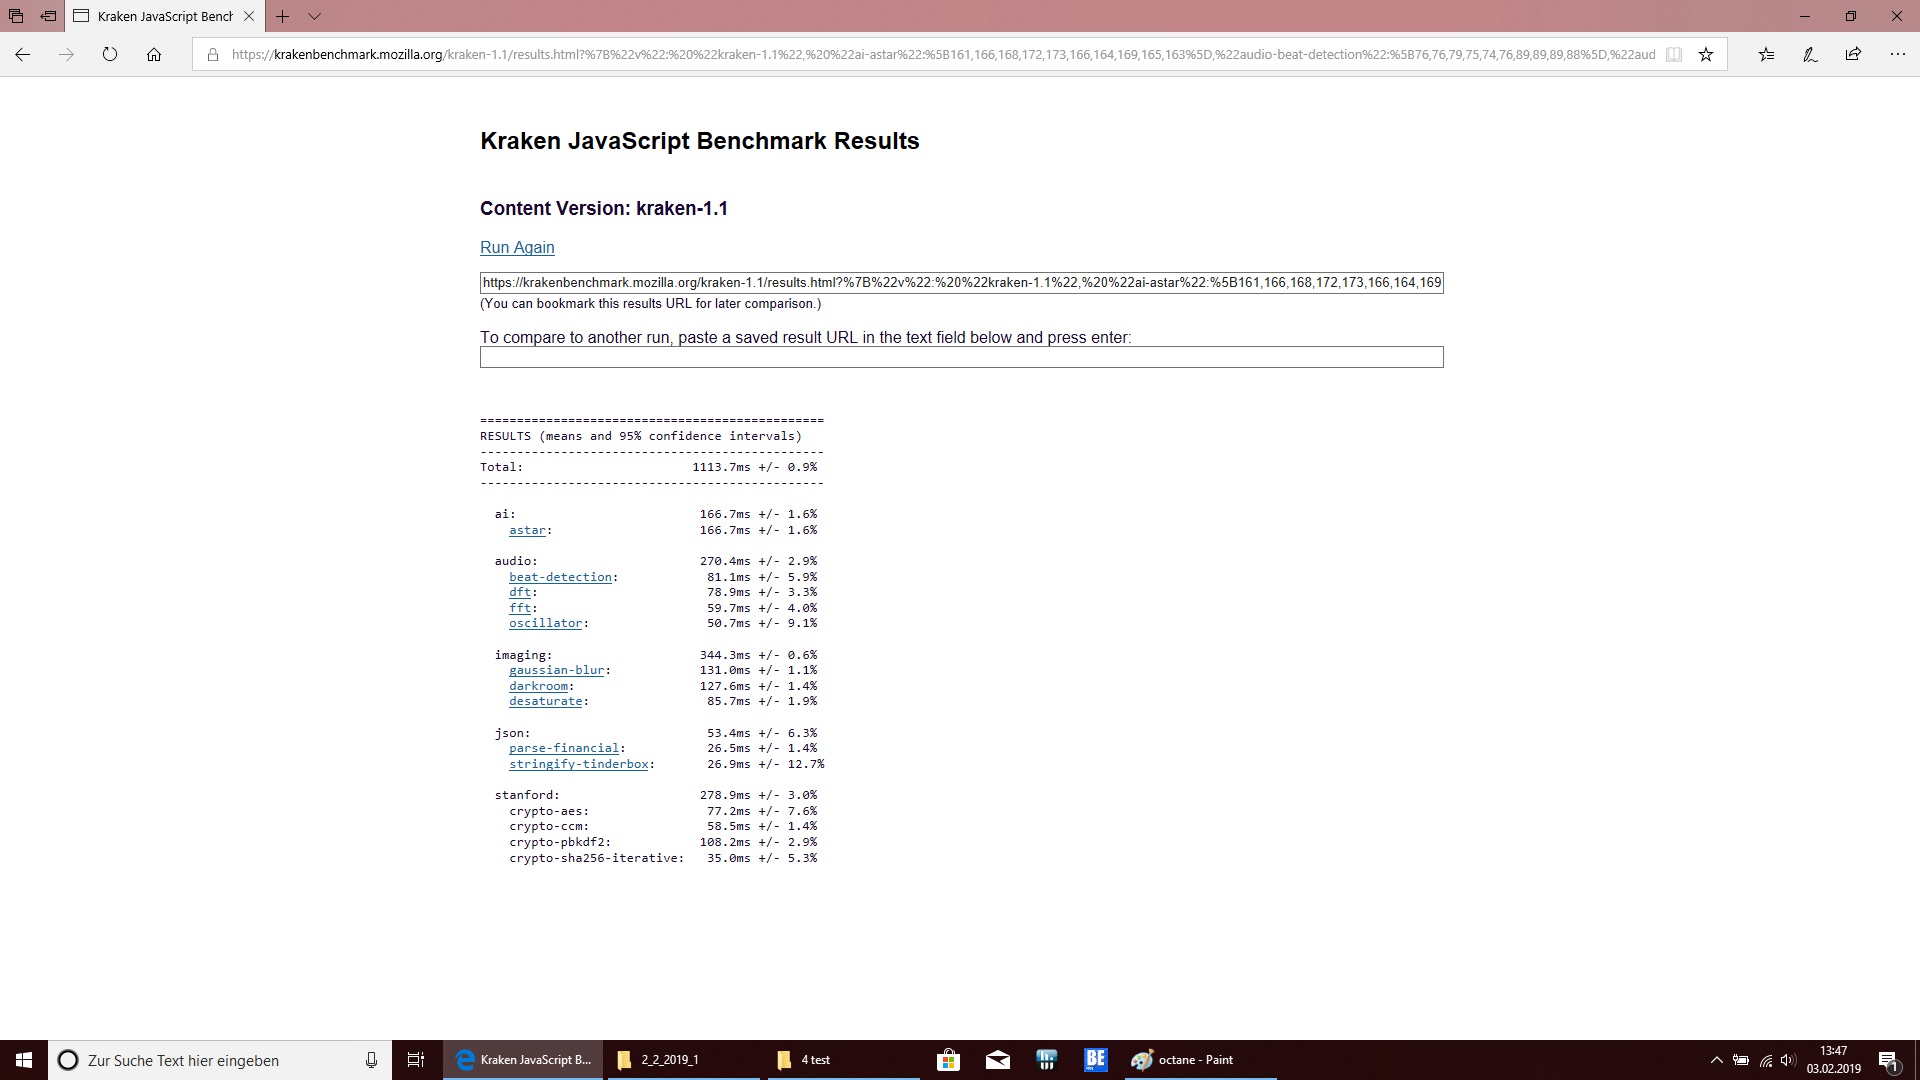
| Mozilla Kraken 1.1 - Total | |
| Lenovo ThinkPad P72-20MB000EGE | |
| Fujitsu Celsius H980 | |
| Média Intel Core i7-8750H (695 - 1272, n=50) | |
| HP ZBook 17 G5-2ZC48EA | |
| Fujitsu Celsius H970 | |
| Dell Precision 7720 | |
| Média da turma Workstation (411 - 538, n=23, últimos 2 anos) | |
| Blender - v2.79 BMW27 CPU | |
| Média Intel Core i7-8750H (396 - 486, n=6) | |
| Fujitsu Celsius H980 | |
| Eurocom Tornado F7W | |
| Média da turma Workstation (91 - 222, n=23, últimos 2 anos) | |
* ... menor é melhor
| PCMark 10 | |
| Score | |
| Média da turma Workstation (6563 - 10409, n=19, últimos 2 anos) | |
| Eurocom Tornado F7W | |
| Lenovo ThinkPad P72-20MB000EGE | |
| HP ZBook 17 G5-2ZC48EA | |
| Dell Precision 7720 | |
| Fujitsu Celsius H980 | |
| Média Intel Core i7-8750H, NVIDIA Quadro P3200 (n=1) | |
| Fujitsu Celsius H970 | |
| Essentials | |
| Média da turma Workstation (9622 - 11157, n=19, últimos 2 anos) | |
| Eurocom Tornado F7W | |
| Lenovo ThinkPad P72-20MB000EGE | |
| Fujitsu Celsius H970 | |
| Dell Precision 7720 | |
| Fujitsu Celsius H980 | |
| Média Intel Core i7-8750H, NVIDIA Quadro P3200 (n=1) | |
| Productivity | |
| Média da turma Workstation (8789 - 20616, n=19, últimos 2 anos) | |
| Eurocom Tornado F7W | |
| Fujitsu Celsius H970 | |
| Dell Precision 7720 | |
| Lenovo ThinkPad P72-20MB000EGE | |
| Fujitsu Celsius H980 | |
| Média Intel Core i7-8750H, NVIDIA Quadro P3200 (n=1) | |
| Digital Content Creation | |
| Média da turma Workstation (8108 - 15631, n=19, últimos 2 anos) | |
| Eurocom Tornado F7W | |
| Fujitsu Celsius H980 | |
| Média Intel Core i7-8750H, NVIDIA Quadro P3200 (n=1) | |
| Dell Precision 7720 | |
| Lenovo ThinkPad P72-20MB000EGE | |
| Fujitsu Celsius H970 | |
| PCMark 8 | |
| Home Score Accelerated v2 | |
| Eurocom Tornado F7W | |
| Lenovo ThinkPad P72-20MB000EGE | |
| Fujitsu Celsius H980 | |
| Média Intel Core i7-8750H, NVIDIA Quadro P3200 (n=1) | |
| HP ZBook 17 G5-2ZC48EA | |
| Dell Precision 7720 | |
| Work Score Accelerated v2 | |
| Lenovo ThinkPad P72-20MB000EGE | |
| Fujitsu Celsius H970 | |
| HP ZBook 17 G5-2ZC48EA | |
| Fujitsu Celsius H980 | |
| Média Intel Core i7-8750H, NVIDIA Quadro P3200 (n=1) | |
| Dell Precision 7720 | |
| PCMark 8 Home Score Accelerated v2 | 4376 pontos | |
| PCMark 8 Work Score Accelerated v2 | 5132 pontos | |
| PCMark 10 Score | 5206 pontos | |
Ajuda | ||
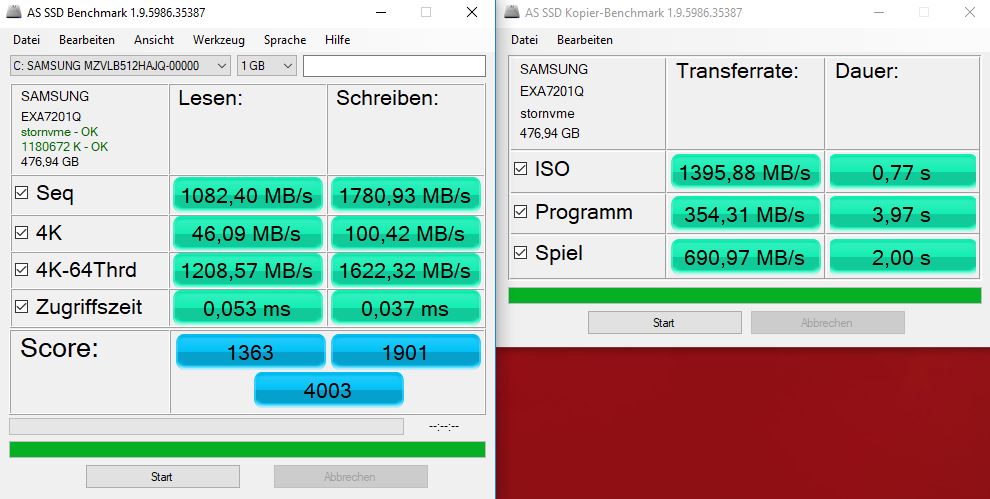
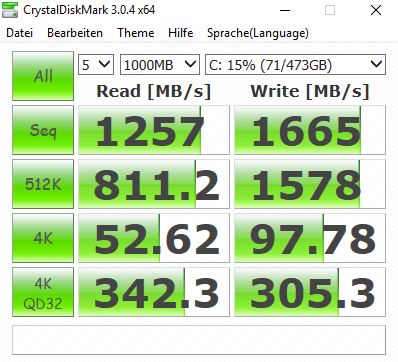
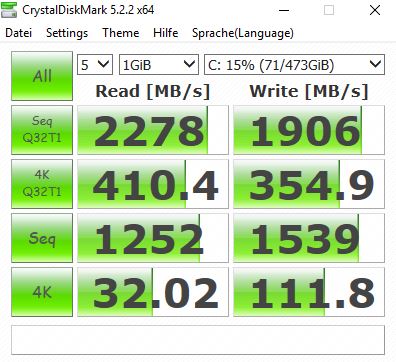
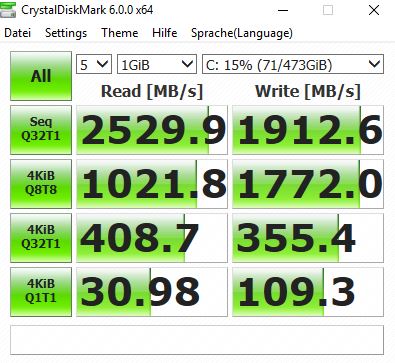
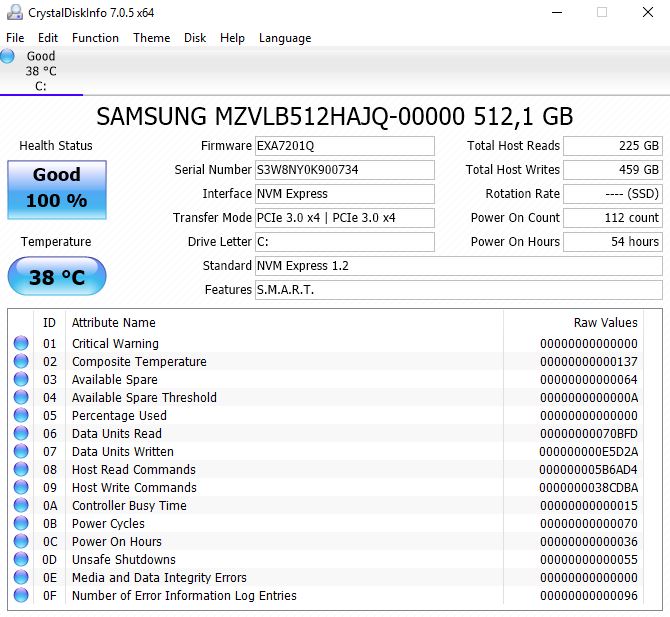
| Fujitsu Celsius H980 Samsung SSD PM981 MZVLB512HAJQ | Fujitsu Celsius H970 Samsung SM961 MZVKW512HMJP m.2 PCI-e | Dell Precision 7720 Toshiba NVMe THNSN5512GPU7 | Lenovo ThinkPad P72-20MB000EGE Lenovo LENSE20256GMSP34MEAT2TA | HP ZBook 17 G5-2ZC48EA Toshiba XG5 KXG50ZNV256G | Média Samsung SSD PM981 MZVLB512HAJQ | |
|---|---|---|---|---|---|---|
| CrystalDiskMark 5.2 / 6 | 33% | 15% | 8% | 13% | ||
| Write 4K (MB/s) | 111.8 | 176.1 58% | 169.2 51% | 101 -10% | 126.7 ? 13% | |
| Read 4K (MB/s) | 32.02 | 44.53 39% | 46.03 44% | 45.37 42% | 44 ? 37% | |
| Write Seq (MB/s) | 1539 | 1637 6% | 1234 -20% | 1409 -8% | 1617 ? 5% | |
| Read Seq (MB/s) | 1252 | 1714 37% | 1854 48% | 2129 70% | 1716 ? 37% | |
| Write 4K Q32T1 (MB/s) | 355.4 | 534 50% | 364.8 3% | 320.3 -10% | 413 ? 16% | |
| Read 4K Q32T1 (MB/s) | 408.7 | 635 55% | 552 35% | 348.3 -15% | 420 ? 3% | |
| Write Seq Q32T1 (MB/s) | 1913 | 1632 -15% | 1088 -43% | 1529 -20% | 2076 ? 9% | |
| Read Seq Q32T1 (MB/s) | 2530 | 3310 31% | 2582 2% | 2957 17% | 3130 ? 24% | |
| Write 4K Q8T8 (MB/s) | 1772 | 1264 ? -29% | ||||
| Read 4K Q8T8 (MB/s) | 1022 | 1193 ? 17% | ||||
| AS SSD | 3% | 2% | 5% | |||
| Seq Read (MB/s) | 1082 | 2726 152% | 2935 171% | 1976 ? 83% | ||
| Seq Write (MB/s) | 1781 | 1609 -10% | 1451 -19% | 1637 ? -8% | ||
| 4K Read (MB/s) | 46.09 | 38.88 -16% | 46.64 1% | 50.5 ? 10% | ||
| 4K Write (MB/s) | 100.4 | 78.1 -22% | 105.8 5% | 112 ? 12% | ||
| 4K-64 Read (MB/s) | 1209 | 1246 3% | 704 -42% | 1203 ? 0% | ||
| 4K-64 Write (MB/s) | 1622 | 971 -40% | 540 -67% | 1504 ? -7% | ||
| Access Time Read * (ms) | 0.053 | 0.05 6% | 0.044 17% | 0.05092 ? 4% | ||
| Access Time Write * (ms) | 0.037 | 0.048 -30% | 0.037 -0% | 0.08337 ? -125% | ||
| Score Read (Points) | 1363 | 1557 14% | 1044 -23% | 1451 ? 6% | ||
| Score Write (Points) | 1901 | 1210 -36% | 791 -58% | 1780 ? -6% | ||
| Score Total (Points) | 4003 | 3509 -12% | 2305 -42% | 3966 ? -1% | ||
| Copy ISO MB/s (MB/s) | 1396 | 1722 23% | 1545 11% | 1755 ? 26% | ||
| Copy Program MB/s (MB/s) | 354.3 | 297.5 -16% | 520 47% | 454 ? 28% | ||
| Copy Game MB/s (MB/s) | 691 | 839 21% | 909 32% | 1057 ? 53% | ||
| Média Total (Programa/Configurações) | 18% /
14% | 15% /
15% | 5% /
5% | 9% /
9% |
* ... menor é melhor

| 3DMark 11 - 1280x720 Performance GPU | |
| Média da turma Workstation (12535 - 69594, n=23, últimos 2 anos) | |
| Dell Precision 7720 | |
| Lenovo ThinkPad P72-20MB000EGE | |
| Fujitsu Celsius H980 | |
| Média NVIDIA Quadro P3200 (14673 - 17021, n=4) | |
| Fujitsu Celsius H970 | |
| 3DMark | |
| 1280x720 Cloud Gate Standard Graphics | |
| Média da turma Workstation (58392 - 152418, n=14, últimos 2 anos) | |
| Dell Precision 7720 | |
| Lenovo ThinkPad P72-20MB000EGE | |
| Fujitsu Celsius H980 | |
| Média NVIDIA Quadro P3200 (57501 - 84059, n=4) | |
| Fujitsu Celsius H970 | |
| 1920x1080 Fire Strike Graphics | |
| Média da turma Workstation (8293 - 52560, n=23, últimos 2 anos) | |
| Dell Precision 7720 | |
| Lenovo ThinkPad P72-20MB000EGE | |
| Fujitsu Celsius H980 | |
| Fujitsu Celsius H970 | |
| Média NVIDIA Quadro P3200 (11316 - 12558, n=4) | |
| 2560x1440 Time Spy Graphics | |
| Média da turma Workstation (2725 - 24806, n=23, últimos 2 anos) | |
| Lenovo ThinkPad P72-20MB000EGE | |
| Fujitsu Celsius H980 | |
| Média NVIDIA Quadro P3200 (3732 - 4378, n=3) | |
| Fujitsu Celsius H970 | |
| Dell Precision 7720 | |
| LuxMark v2.0 64Bit | |
| Room GPUs-only | |
| Média da turma Workstation (2952 - 6990, n=3, últimos 2 anos) | |
| Dell Precision 7720 | |
| Fujitsu Celsius H980 | |
| Média NVIDIA Quadro P3200 (1842 - 2206, n=5) | |
| Lenovo ThinkPad P72-20MB000EGE | |
| Fujitsu Celsius H970 | |
| HP ZBook 17 G5-2ZC48EA | |
| Sala GPUs-only | |
| Média da turma Workstation (6574 - 13967, n=3, últimos 2 anos) | |
| Fujitsu Celsius H980 | |
| Dell Precision 7720 | |
| Média NVIDIA Quadro P3200 (3612 - 4383, n=5) | |
| Lenovo ThinkPad P72-20MB000EGE | |
| HP ZBook 17 G5-2ZC48EA | |
| Fujitsu Celsius H970 | |
| Unigine Heaven 4.0 | |
| Extreme Preset OpenGL | |
| Média da turma Workstation (87 - 185.3, n=3, últimos 2 anos) | |
| Dell Precision 7720 | |
| Fujitsu Celsius H980 | |
| Média NVIDIA Quadro P3200 (70.3 - 73, n=3) | |
| Lenovo ThinkPad P72-20MB000EGE | |
| HP ZBook 17 G5-2ZC48EA | |
| Extreme Preset DX11 | |
| Média da turma Workstation (92.7 - 222, n=3, últimos 2 anos) | |
| Dell Precision 7720 | |
| Fujitsu Celsius H980 | |
| HP ZBook 17 G5-2ZC48EA | |
| Lenovo ThinkPad P72-20MB000EGE | |
| Média NVIDIA Quadro P3200 (71.4 - 77.2, n=4) | |
| Unigine Valley 1.0 | |
| 1920x1080 Extreme HD DirectX AA:x8 | |
| Dell Precision 7720 | |
| Lenovo ThinkPad P72-20MB000EGE | |
| Média NVIDIA Quadro P3200 (57.1 - 63, n=3) | |
| Fujitsu Celsius H980 | |
| HP ZBook 17 G5-2ZC48EA | |
| 1920x1080 Extreme HD Preset OpenGL AA:x8 | |
| Dell Precision 7720 | |
| Fujitsu Celsius H980 | |
| HP ZBook 17 G5-2ZC48EA | |
| Média NVIDIA Quadro P3200 (49.3 - 50.2, n=3) | |
| Lenovo ThinkPad P72-20MB000EGE | |
| SiSoft Sandra 2016 | |
| Image Processing | |
| Fujitsu Celsius H980 | |
| Lenovo ThinkPad P72-20MB000EGE | |
| Média NVIDIA Quadro P3200 (691 - 830, n=4) | |
| Dell Precision 7720 | |
| HP ZBook 17 G5-2ZC48EA | |
| GP Cryptography (Higher Security AES256+SHA2-512) | |
| Dell Precision 7720 | |
| Lenovo ThinkPad P72-20MB000EGE | |
| Fujitsu Celsius H980 | |
| Média NVIDIA Quadro P3200 (28.1 - 30.2, n=4) | |
| HP ZBook 17 G5-2ZC48EA | |
| GP Financial Analysis (FP High/Double Precision) | |
| Dell Precision 7720 | |
| Fujitsu Celsius H980 | |
| Lenovo ThinkPad P72-20MB000EGE | |
| Média NVIDIA Quadro P3200 (84.5 - 86.6, n=4) | |
| HP ZBook 17 G5-2ZC48EA | |
| 3DMark 11 Performance | 15178 pontos | |
| 3DMark Ice Storm Standard Score | 90781 pontos | |
| 3DMark Cloud Gate Standard Score | 34178 pontos | |
| 3DMark Fire Strike Score | 11114 pontos | |
| 3DMark Fire Strike Extreme Score | 5856 pontos | |
| 3DMark Time Spy Score | 4593 pontos | |
Ajuda | ||
| baixo | média | alto | ultra | |
|---|---|---|---|---|
| BioShock Infinite (2013) | 284.9 | 246.5 | 231.5 | 112.3 |
| Dota 2 Reborn (2015) | 129.6 | 121.2 | 114.7 | 107.8 |
| Rise of the Tomb Raider (2016) | 182 | 144 | 86 | 73 |
| X-Plane 11.11 (2018) | 100 | 86 | 72 | |
| Far Cry 5 (2018) | 120 | 79 | 74 | 70 |
Barulho
| Ocioso |
| 29.6 / 32.5 / 32.5 dB |
| Carga |
| 34.9 / 49.1 dB |
 | ||
30 dB silencioso 40 dB(A) audível 50 dB(A) ruidosamente alto |
||
min: | ||
| Fujitsu Celsius H980 Quadro P3200, i7-8750H, Samsung SSD PM981 MZVLB512HAJQ | Fujitsu Celsius H970 Quadro P4000, E3-1535M v6, Samsung SM961 MZVKW512HMJP m.2 PCI-e | Dell Precision 7720 Quadro P5000, E3-1535M v6, Toshiba NVMe THNSN5512GPU7 | Lenovo ThinkPad P72-20MB000EGE Quadro P3200, i7-8850H, Lenovo LENSE20256GMSP34MEAT2TA | HP ZBook 17 G5-2ZC48EA Quadro P3200, i7-8850H, Toshiba XG5 KXG50ZNV256G | |
|---|---|---|---|---|---|
| Noise | -6% | 4% | 10% | 5% | |
| desligado / ambiente * (dB) | 29.6 | 30.2 -2% | 29.5 -0% | 28.6 3% | 28.7 3% |
| Idle Minimum * (dB) | 29.6 | 30.2 -2% | 29.5 -0% | 28.6 3% | 28.7 3% |
| Idle Average * (dB) | 32.5 | 32.8 -1% | 29.5 9% | 28.6 12% | 28.7 12% |
| Idle Maximum * (dB) | 32.5 | 32.8 -1% | 29.5 9% | 28.6 12% | 30.9 5% |
| Load Average * (dB) | 34.9 | 47.3 -36% | 35 -0% | 31.9 9% | 37.3 -7% |
| Load Maximum * (dB) | 49.1 | 47.3 4% | 47.8 3% | 37.7 23% | 41.4 16% |
| Witcher 3 ultra * (dB) | 41 | 35.7 | 41.1 |
* ... menor é melhor
(±) A temperatura máxima no lado superior é 41.8 °C / 107 F, em comparação com a média de 38.2 °C / 101 F , variando de 22.2 a 69.8 °C para a classe Workstation.
(-) A parte inferior aquece até um máximo de 46.2 °C / 115 F, em comparação com a média de 41.1 °C / 106 F
(+) Em uso inativo, a temperatura média para o lado superior é 24.1 °C / 75 F, em comparação com a média do dispositivo de 32 °C / ### class_avg_f### F.
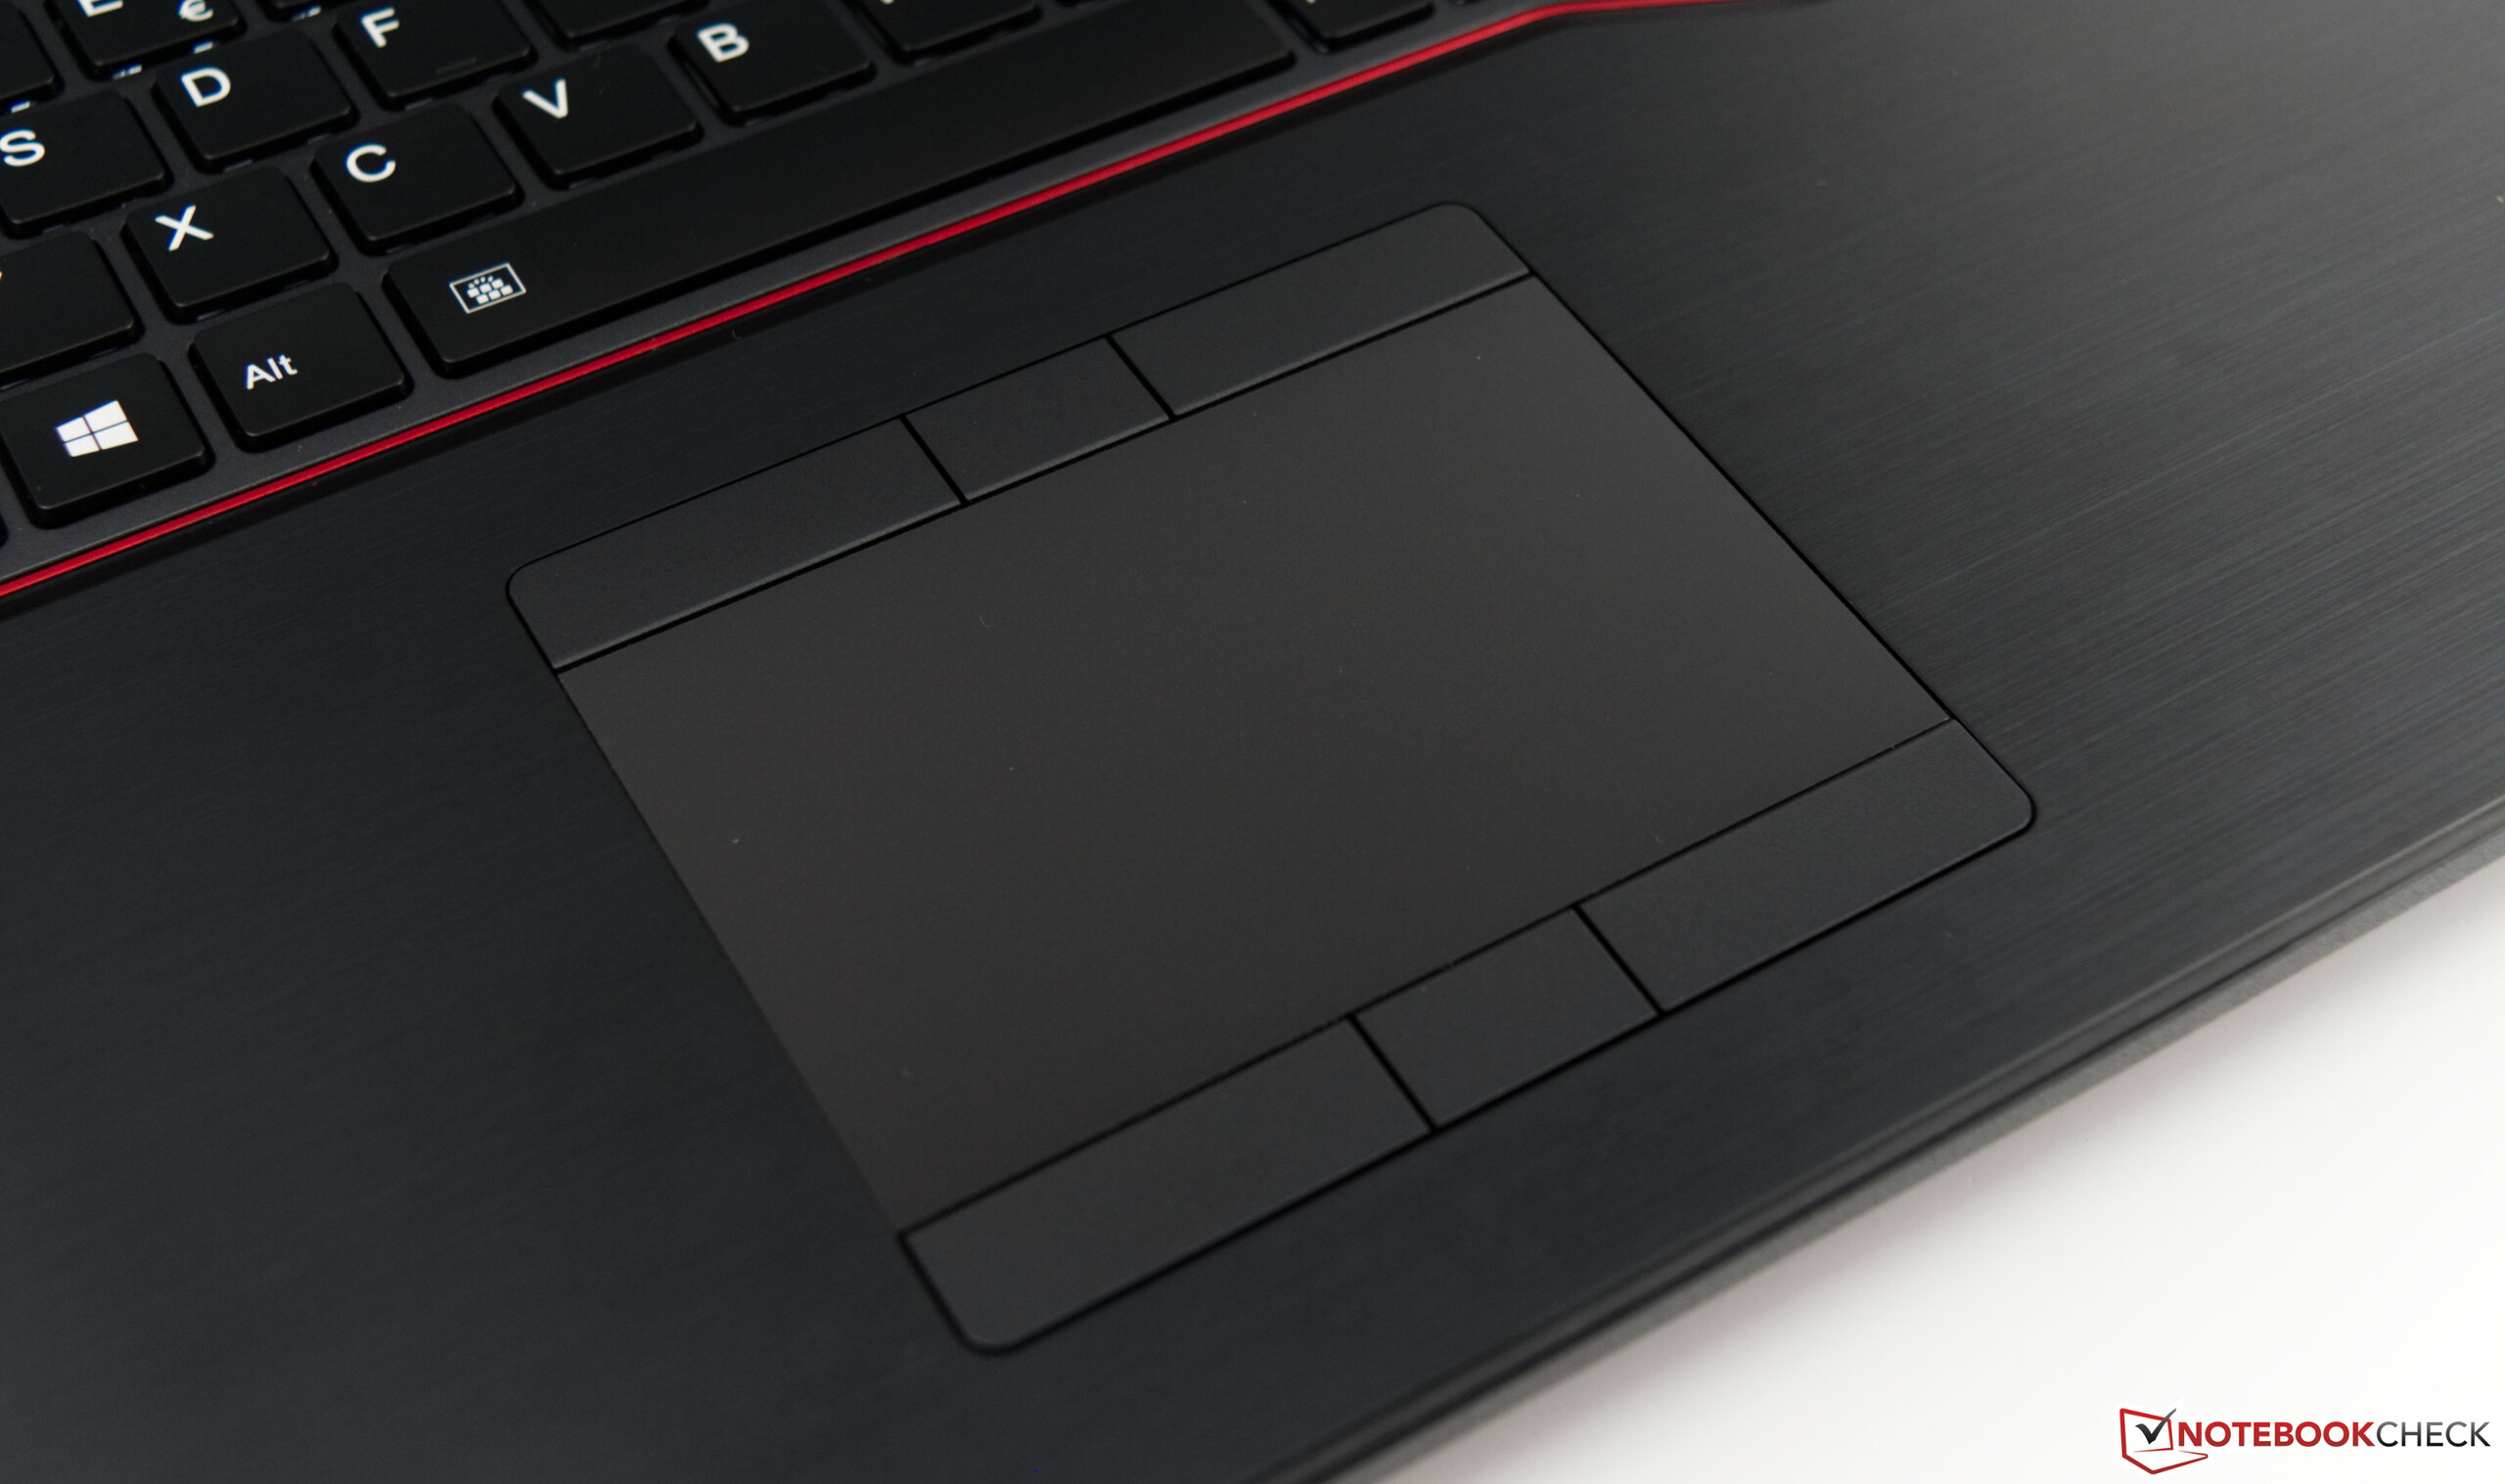
(+) Os apoios para as mãos e o touchpad são mais frios que a temperatura da pele, com um máximo de 23.8 °C / 74.8 F e, portanto, são frios ao toque.
(+) A temperatura média da área do apoio para as mãos de dispositivos semelhantes foi 27.8 °C / 82 F (+4 °C / 7.2 F).
| Fujitsu Celsius H980 Quadro P3200, i7-8750H, Samsung SSD PM981 MZVLB512HAJQ | Fujitsu Celsius H970 Quadro P4000, E3-1535M v6, Samsung SM961 MZVKW512HMJP m.2 PCI-e | Dell Precision 7720 Quadro P5000, E3-1535M v6, Toshiba NVMe THNSN5512GPU7 | Lenovo ThinkPad P72-20MB000EGE Quadro P3200, i7-8850H, Lenovo LENSE20256GMSP34MEAT2TA | HP ZBook 17 G5-2ZC48EA Quadro P3200, i7-8850H, Toshiba XG5 KXG50ZNV256G | |
|---|---|---|---|---|---|
| Heat | -1% | -1% | 9% | 2% | |
| Maximum Upper Side * (°C) | 41.8 | 41.4 1% | 42.3 -1% | 42.8 -2% | 42.9 -3% |
| Maximum Bottom * (°C) | 46.2 | 48.7 -5% | 44.9 3% | 39.5 15% | 46.3 -0% |
| Idle Upper Side * (°C) | 25.6 | 26.2 -2% | 26.1 -2% | 23.1 10% | 24.8 3% |
| Idle Bottom * (°C) | 26.6 | 26.4 1% | 27.9 -5% | 23.5 12% | 24.9 6% |
* ... menor é melhor
Fujitsu Celsius H980 análise de áudio
(-) | alto-falantes não muito altos (###valor### dB)
Graves 100 - 315Hz
(-) | quase nenhum baixo - em média 26.5% menor que a mediana
(+) | o baixo é linear (4.7% delta para a frequência anterior)
Médios 400 - 2.000 Hz
(±) | médios reduzidos - em média 6.2% menor que a mediana
(±) | a linearidade dos médios é média (10.8% delta para frequência anterior)
Altos 2 - 16 kHz
(+) | agudos equilibrados - apenas 3.7% longe da mediana
(±) | a linearidade dos máximos é média (10% delta para frequência anterior)
Geral 100 - 16.000 Hz
(-) | o som geral não é linear (32.2% diferença em relação à mediana)
Comparado com a mesma classe
» 99% de todos os dispositivos testados nesta classe foram melhores, 1% semelhantes, 1% piores
» O melhor teve um delta de 7%, a média foi 17%, o pior foi 35%
Comparado com todos os dispositivos testados
» 91% de todos os dispositivos testados foram melhores, 2% semelhantes, 7% piores
» O melhor teve um delta de 4%, a média foi 23%, o pior foi 134%
Lenovo ThinkPad P72-20MB000EGE análise de áudio
(-) | alto-falantes não muito altos (###valor### dB)
Graves 100 - 315Hz
(-) | quase nenhum baixo - em média 17.4% menor que a mediana
(±) | a linearidade dos graves é média (13.5% delta para a frequência anterior)
Médios 400 - 2.000 Hz
(±) | médios mais altos - em média 7.2% maior que a mediana
(±) | a linearidade dos médios é média (8.7% delta para frequência anterior)
Altos 2 - 16 kHz
(+) | agudos equilibrados - apenas 4.4% longe da mediana
(±) | a linearidade dos máximos é média (12.7% delta para frequência anterior)
Geral 100 - 16.000 Hz
(-) | o som geral não é linear (30.7% diferença em relação à mediana)
Comparado com a mesma classe
» 97% de todos os dispositivos testados nesta classe foram melhores, 1% semelhantes, 1% piores
» O melhor teve um delta de 7%, a média foi 17%, o pior foi 35%
Comparado com todos os dispositivos testados
» 89% de todos os dispositivos testados foram melhores, 3% semelhantes, 8% piores
» O melhor teve um delta de 4%, a média foi 23%, o pior foi 134%
| desligado | |
| Ocioso | |
| Carga |
|
Key:
min: | |
| Fujitsu Celsius H980 i7-8750H, Quadro P3200, Samsung SSD PM981 MZVLB512HAJQ, IPS, 1920x1080, 17.3" | Fujitsu Celsius H970 E3-1535M v6, Quadro P4000, Samsung SM961 MZVKW512HMJP m.2 PCI-e, IPS LED, 1920x1080, 17.3" | Dell Precision 7720 E3-1535M v6, Quadro P5000, Toshiba NVMe THNSN5512GPU7, IGZO, 3840x2160, 17.3" | Lenovo ThinkPad P72-20MB000EGE i7-8850H, Quadro P3200, Lenovo LENSE20256GMSP34MEAT2TA, IPS, 1920x1080, 17.3" | HP ZBook 17 G5-2ZC48EA i7-8850H, Quadro P3200, Toshiba XG5 KXG50ZNV256G, , 1920x1080, 17.3" | Média NVIDIA Quadro P3200 | Média da turma Workstation | |
|---|---|---|---|---|---|---|---|
| Power Consumption | 22% | 7% | 35% | 23% | 13% | 21% | |
| Idle Minimum * (Watt) | 14.8 | 10.7 28% | 9.6 35% | 4.6 69% | 9.3 37% | 10.9 ? 26% | 9.11 ? 38% |
| Idle Average * (Watt) | 20.4 | 15.8 23% | 20.5 -0% | 12.2 40% | 14.4 29% | 17.1 ? 16% | 13.8 ? 32% |
| Idle Maximum * (Watt) | 21.5 | 17.8 17% | 22.9 -7% | 15.4 28% | 15.8 27% | 19.6 ? 9% | 17.9 ? 17% |
| Load Average * (Watt) | 98.4 | 92 7% | 96.8 2% | 79.6 19% | 89.2 9% | 95.1 ? 3% | 96 ? 2% |
| Load Maximum * (Watt) | 213.5 | 137 36% | 202.1 5% | 176 18% | 189 11% | 191.3 ? 10% | 180.3 ? 16% |
| Witcher 3 ultra * (Watt) | 86 | 123 |
* ... menor é melhor
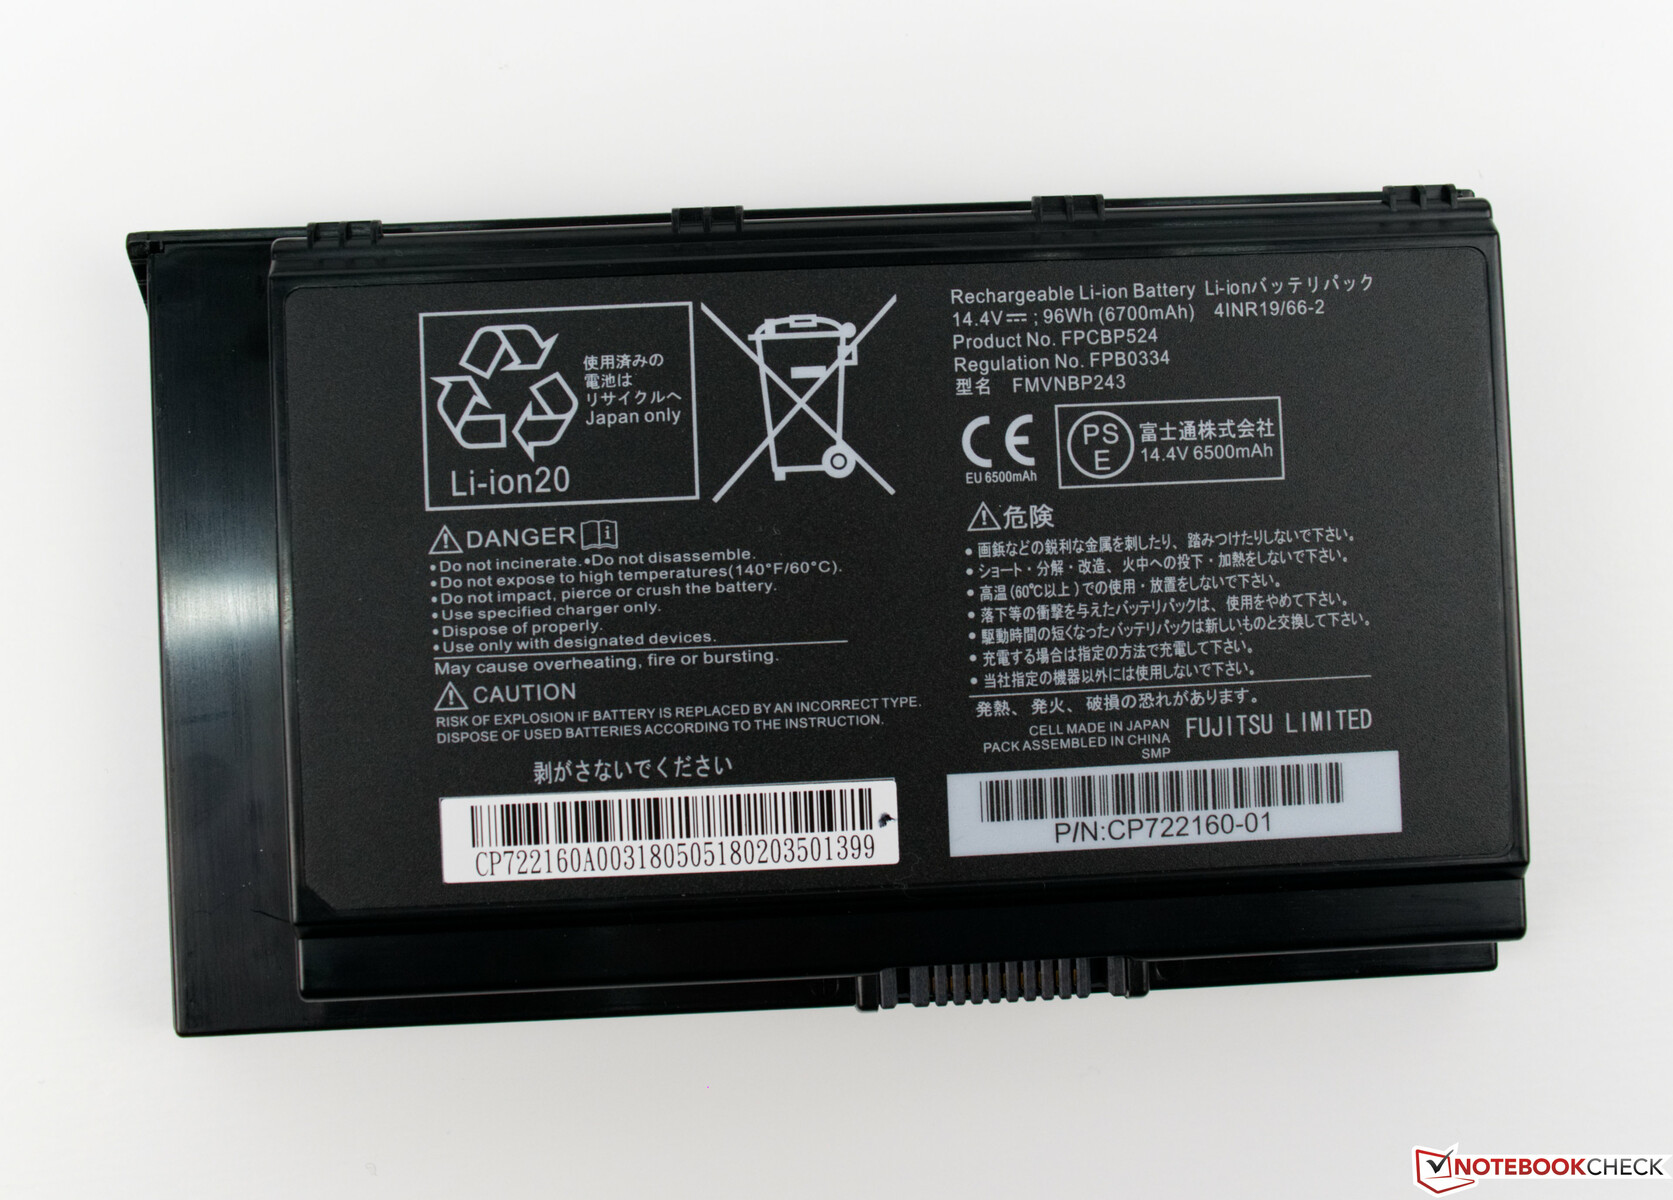
| Fujitsu Celsius H980 i7-8750H, Quadro P3200, 96 Wh | Fujitsu Celsius H970 E3-1535M v6, Quadro P4000, 96 Wh | Dell Precision 7720 E3-1535M v6, Quadro P5000, 91 Wh | Lenovo ThinkPad P72-20MB000EGE i7-8850H, Quadro P3200, 99 Wh | HP ZBook 17 G5-2ZC48EA i7-8850H, Quadro P3200, Wh | Média da turma Workstation | |
|---|---|---|---|---|---|---|
| Duração da bateria | 20% | -10% | 62% | 56% | 43% | |
| Reader / Idle (h) | 13.5 | 16.7 24% | 11.4 -16% | 28.3 110% | 21.9 62% | 26.1 ? 93% |
| H.264 (h) | 5.9 | 9.6 63% | 6.8 15% | 12.3 108% | 9.2 56% | 10.1 ? 71% |
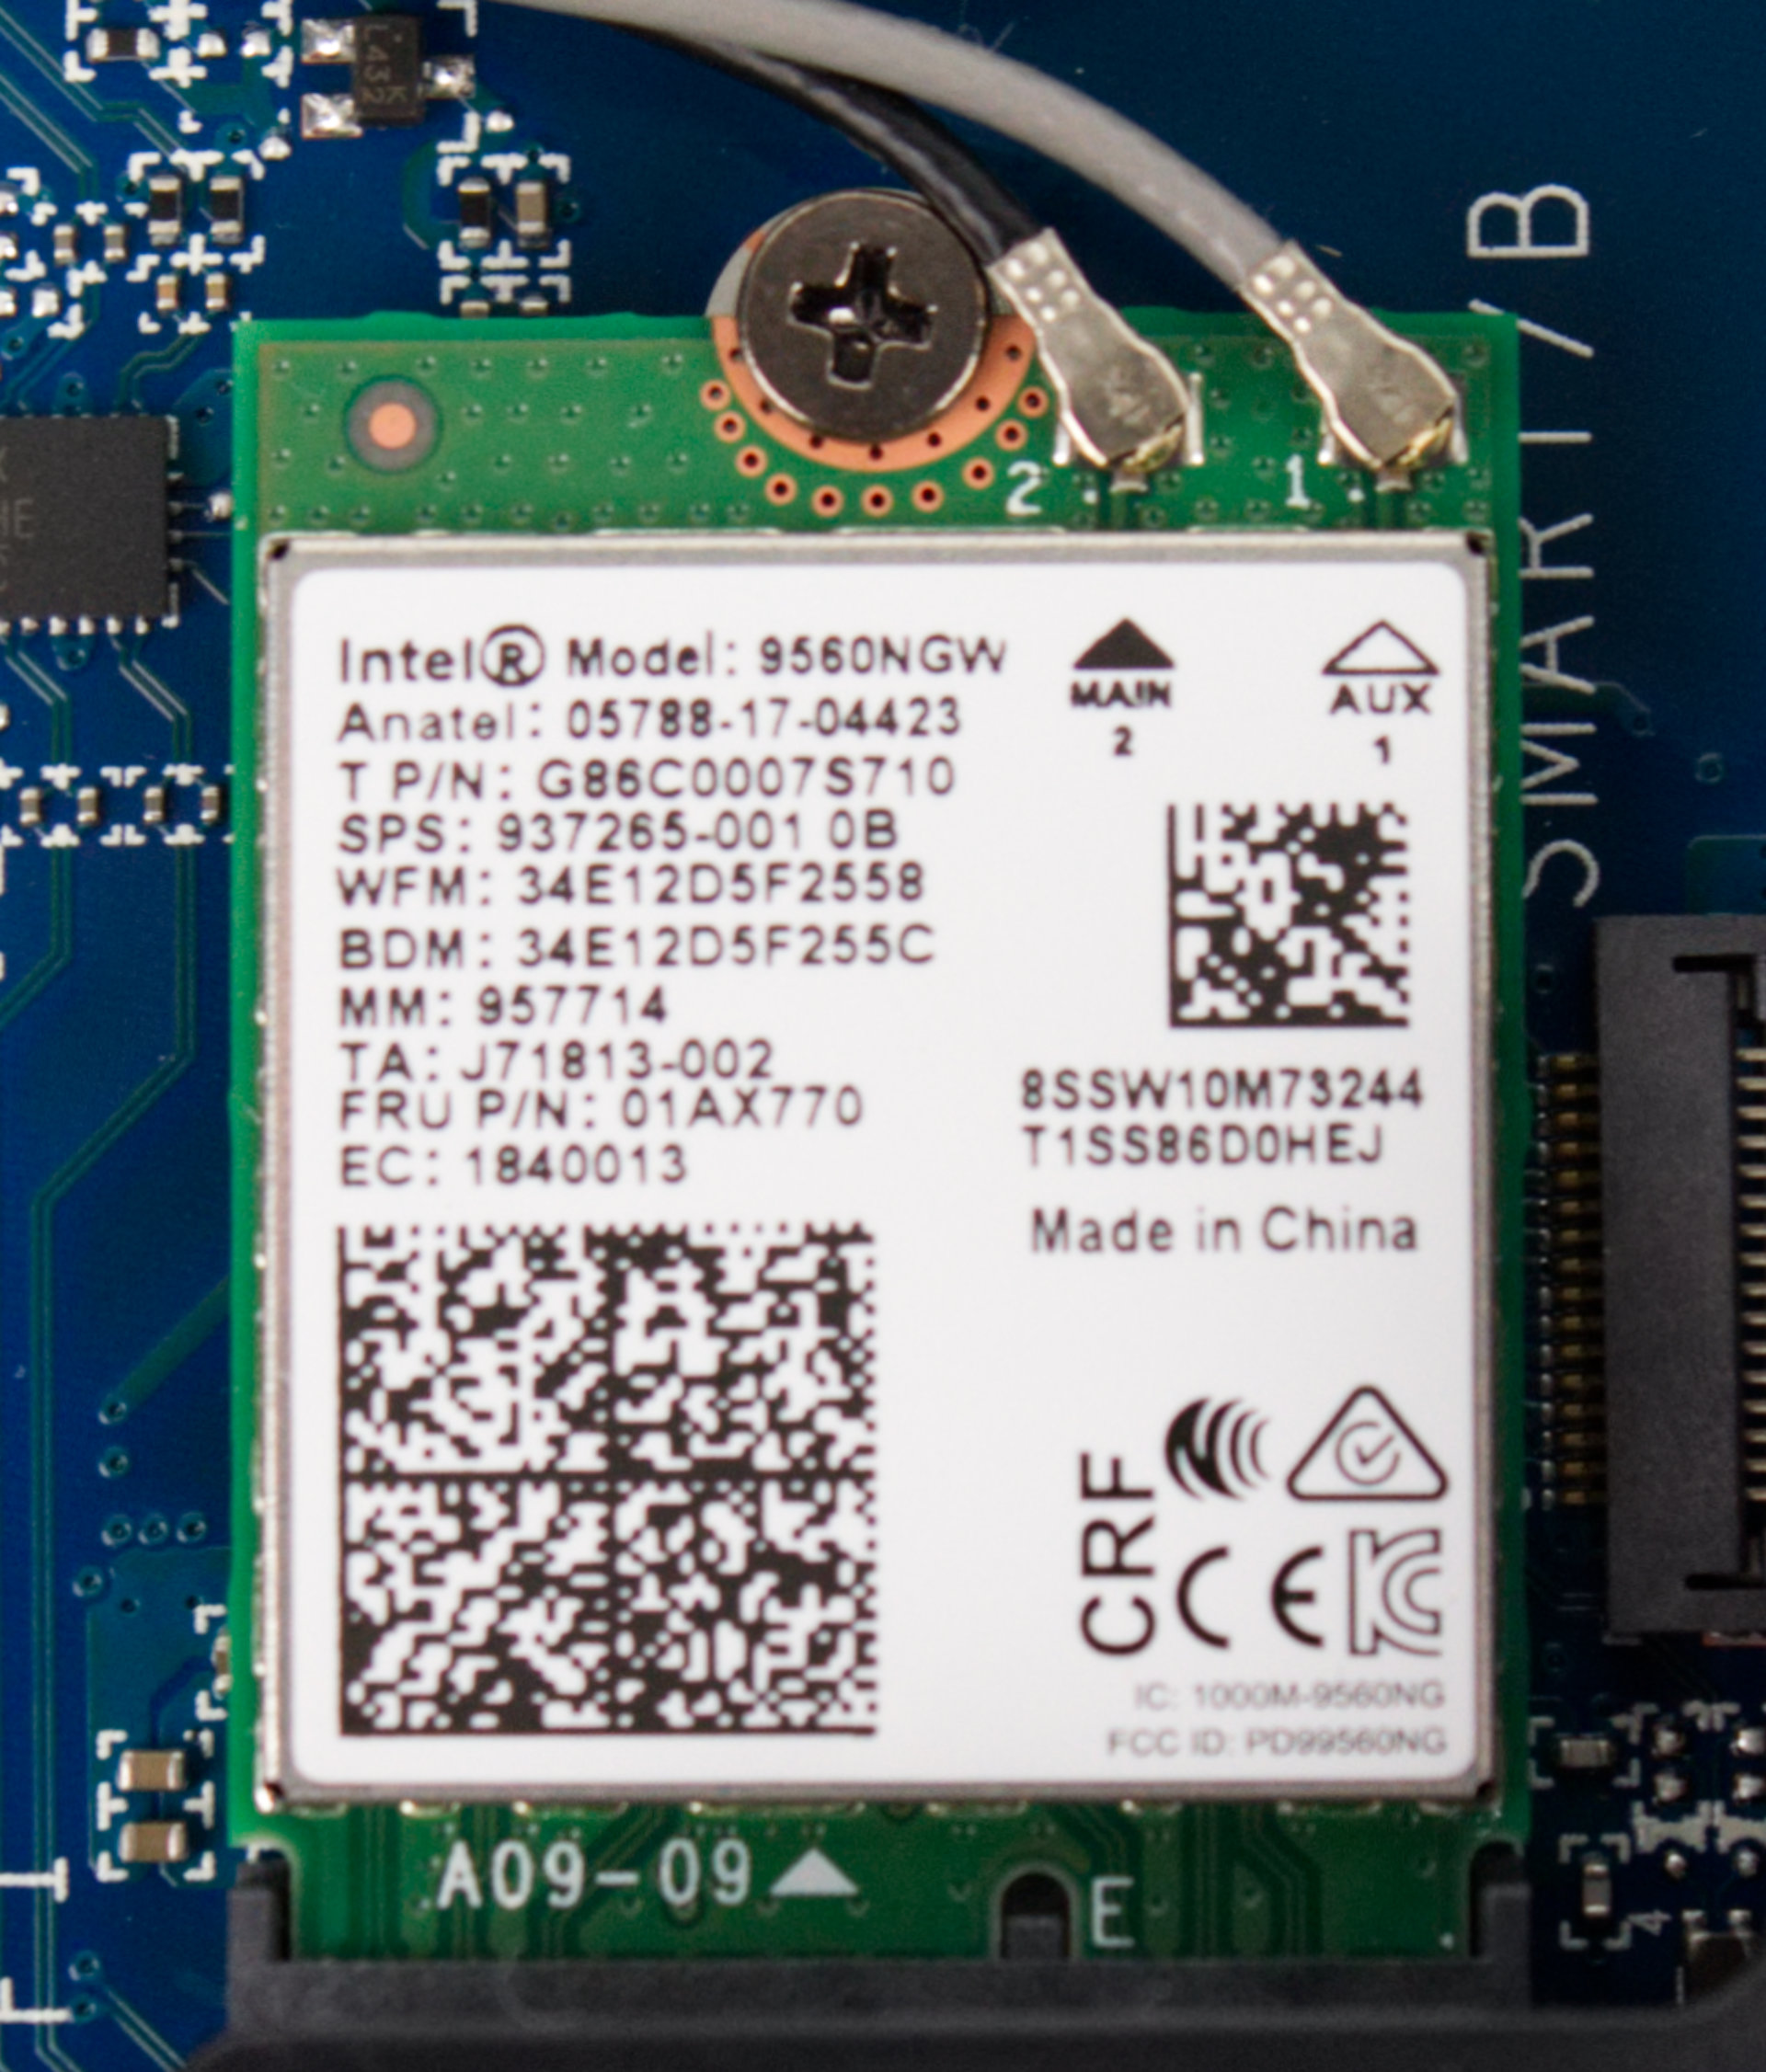
| WiFi v1.3 (h) | 8.3 | 9 8% | 6.3 -24% | 11.2 35% | 8.55 ? 3% | |
| Load (h) | 1.4 | 1.2 -14% | 1.2 -14% | 1.3 -7% | 2.1 50% | 1.441 ? 3% |
Pro
Contra
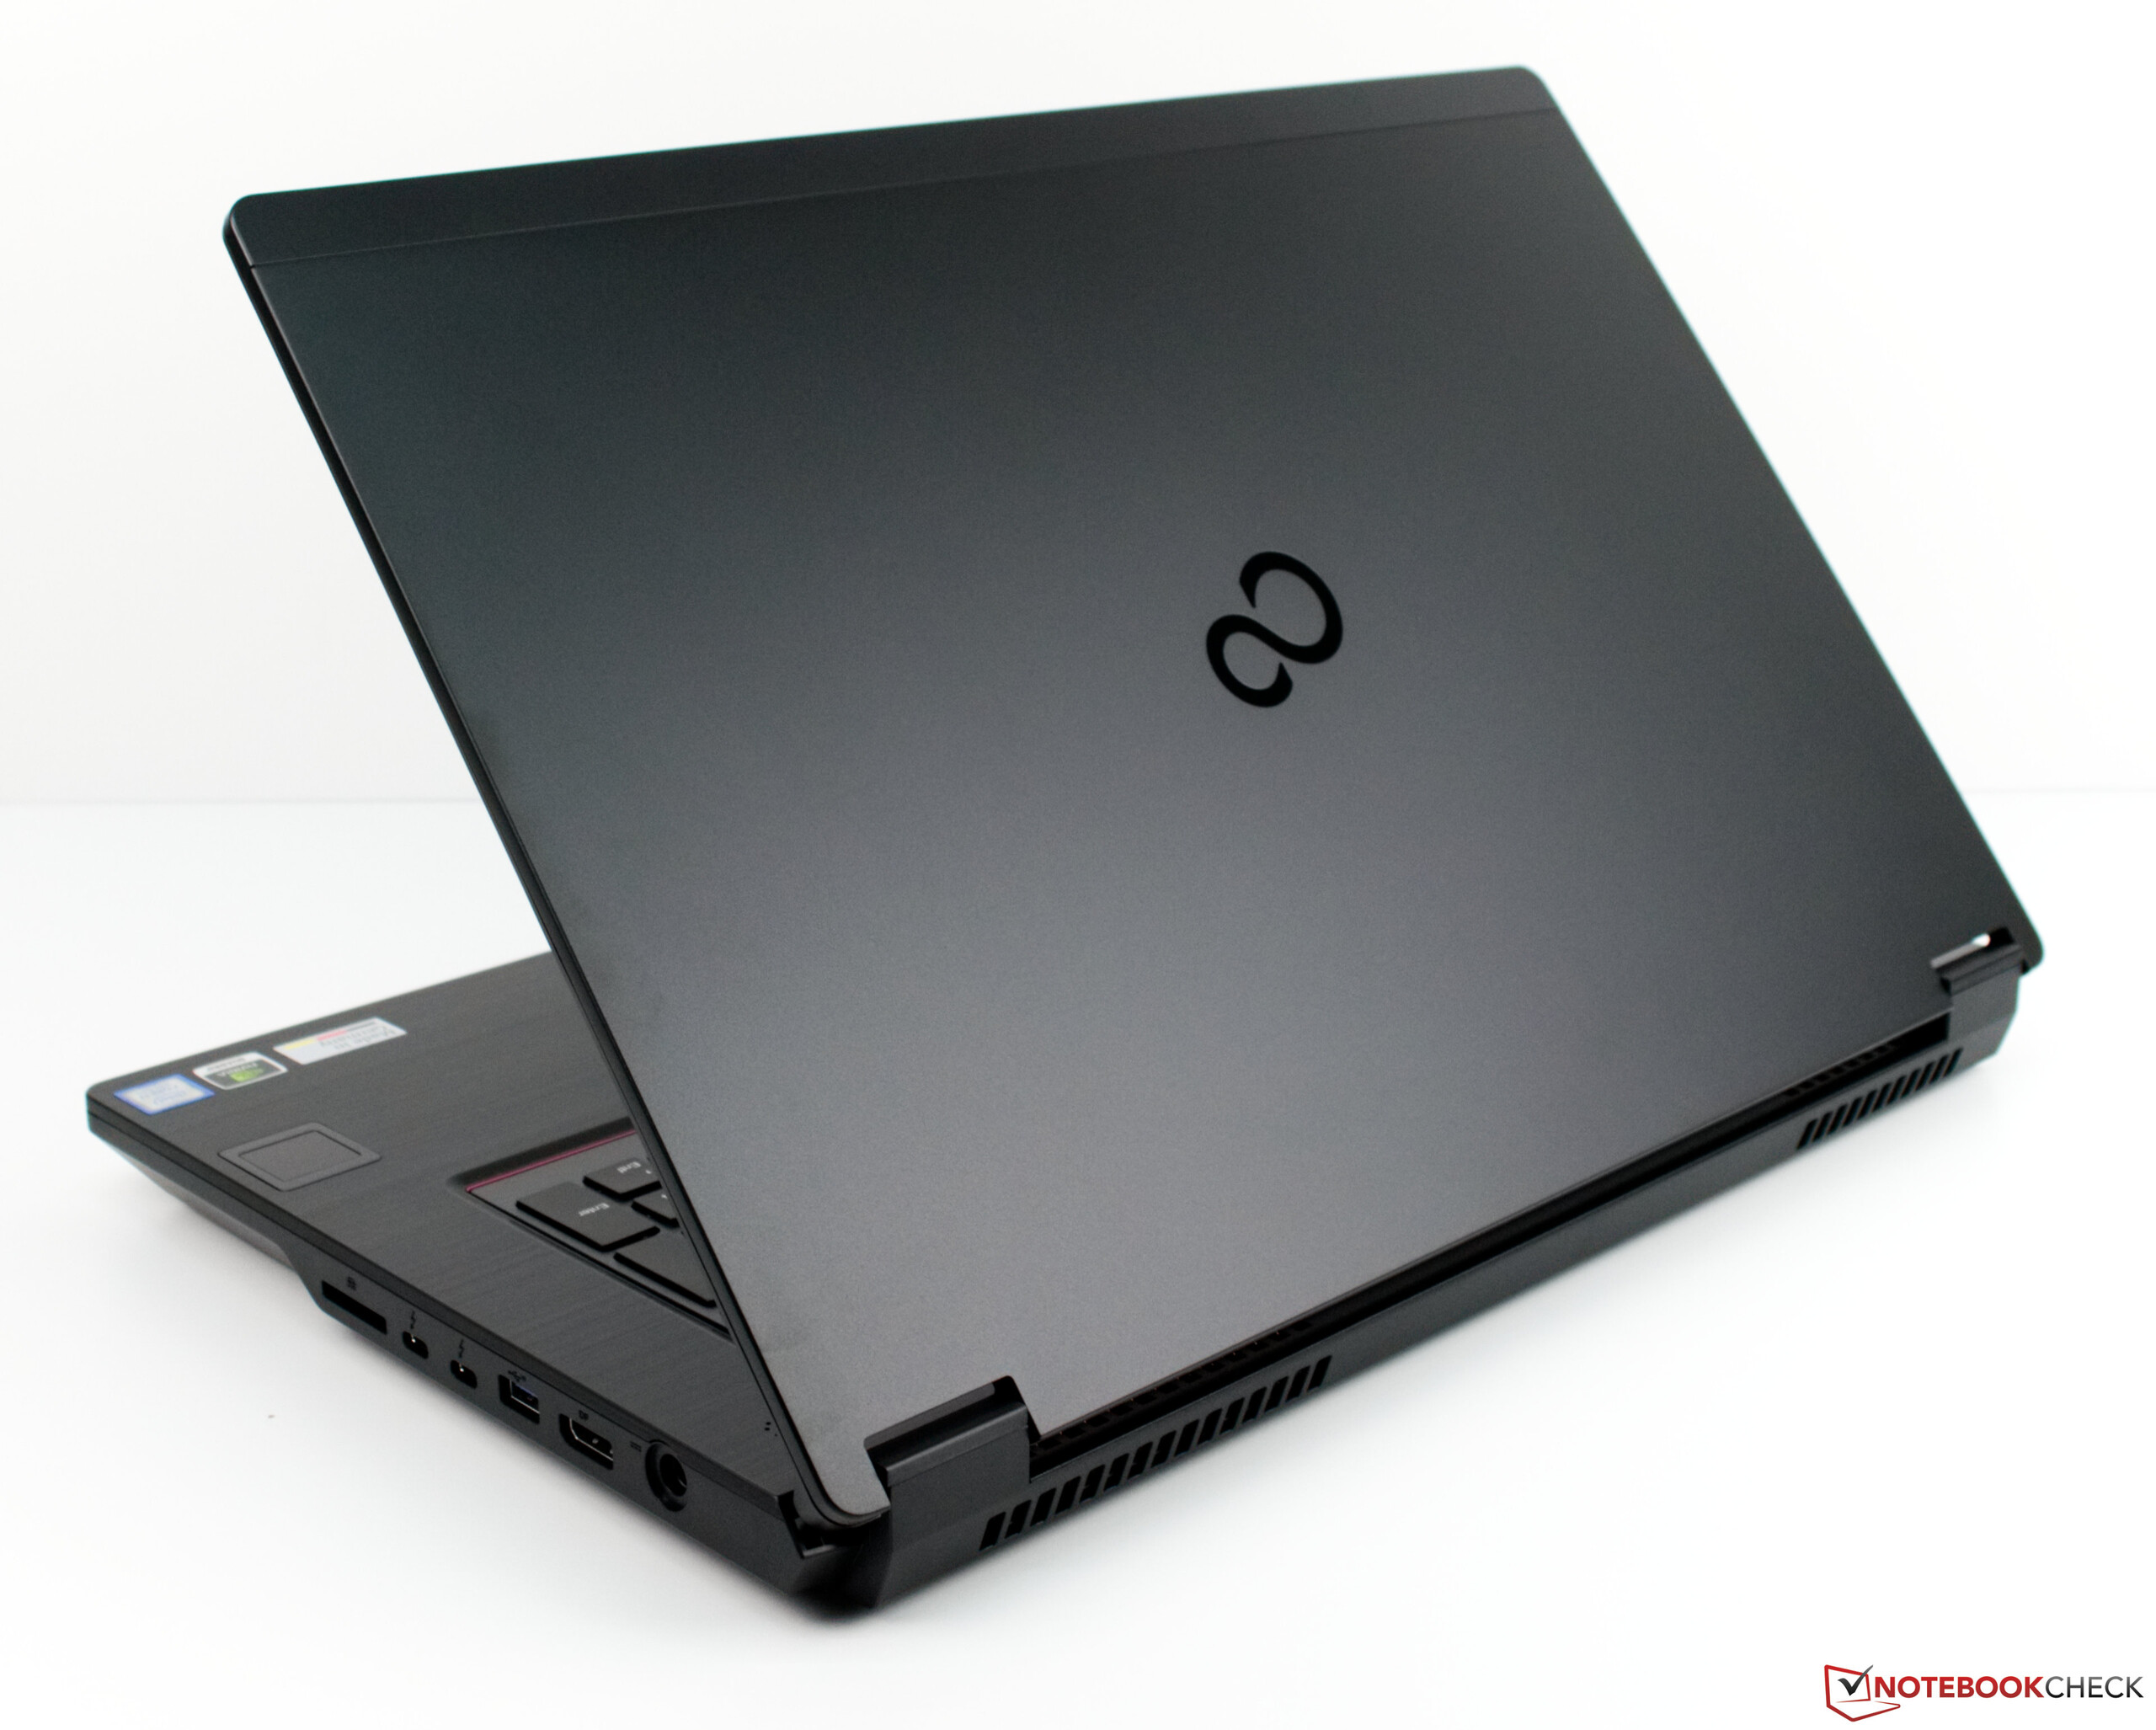
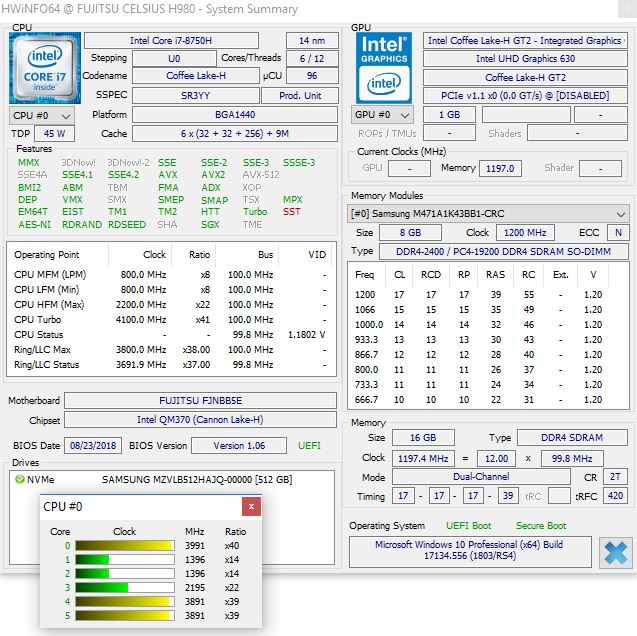
O mercado de workstations é pequeno, com apenas alguns OEMs atualmente produzindo dispositivos que atendem às necessidades de um workstation. A Fujitsu é um fabricante que sabe o que faz um workstation bom, graças aos seus anos de experiência. O Celsius pode explorar o potencial do seu processador hexa-core, particularmente em aplicações multi-threaded, sem limitação térmica, o que é excelente. No entanto, o Core i7-8750H em nossa unidade de teste é a CPU menos potente que a Fujitsu oferece para o Celsius H980, por isso gostaríamos de saber se ele pode obter o melhor do Intel Xeon E-2186M sem superaquecer.
O Celsius H970 teve um resfriamento de GPU efetivo e, felizmente, ele permaneceu inalterado com o H980. Em suma, a NVIDIA Quadro P3200 teve um bom desempenho em nossos testes e é uma boa combinação com o Core i7-8750H.
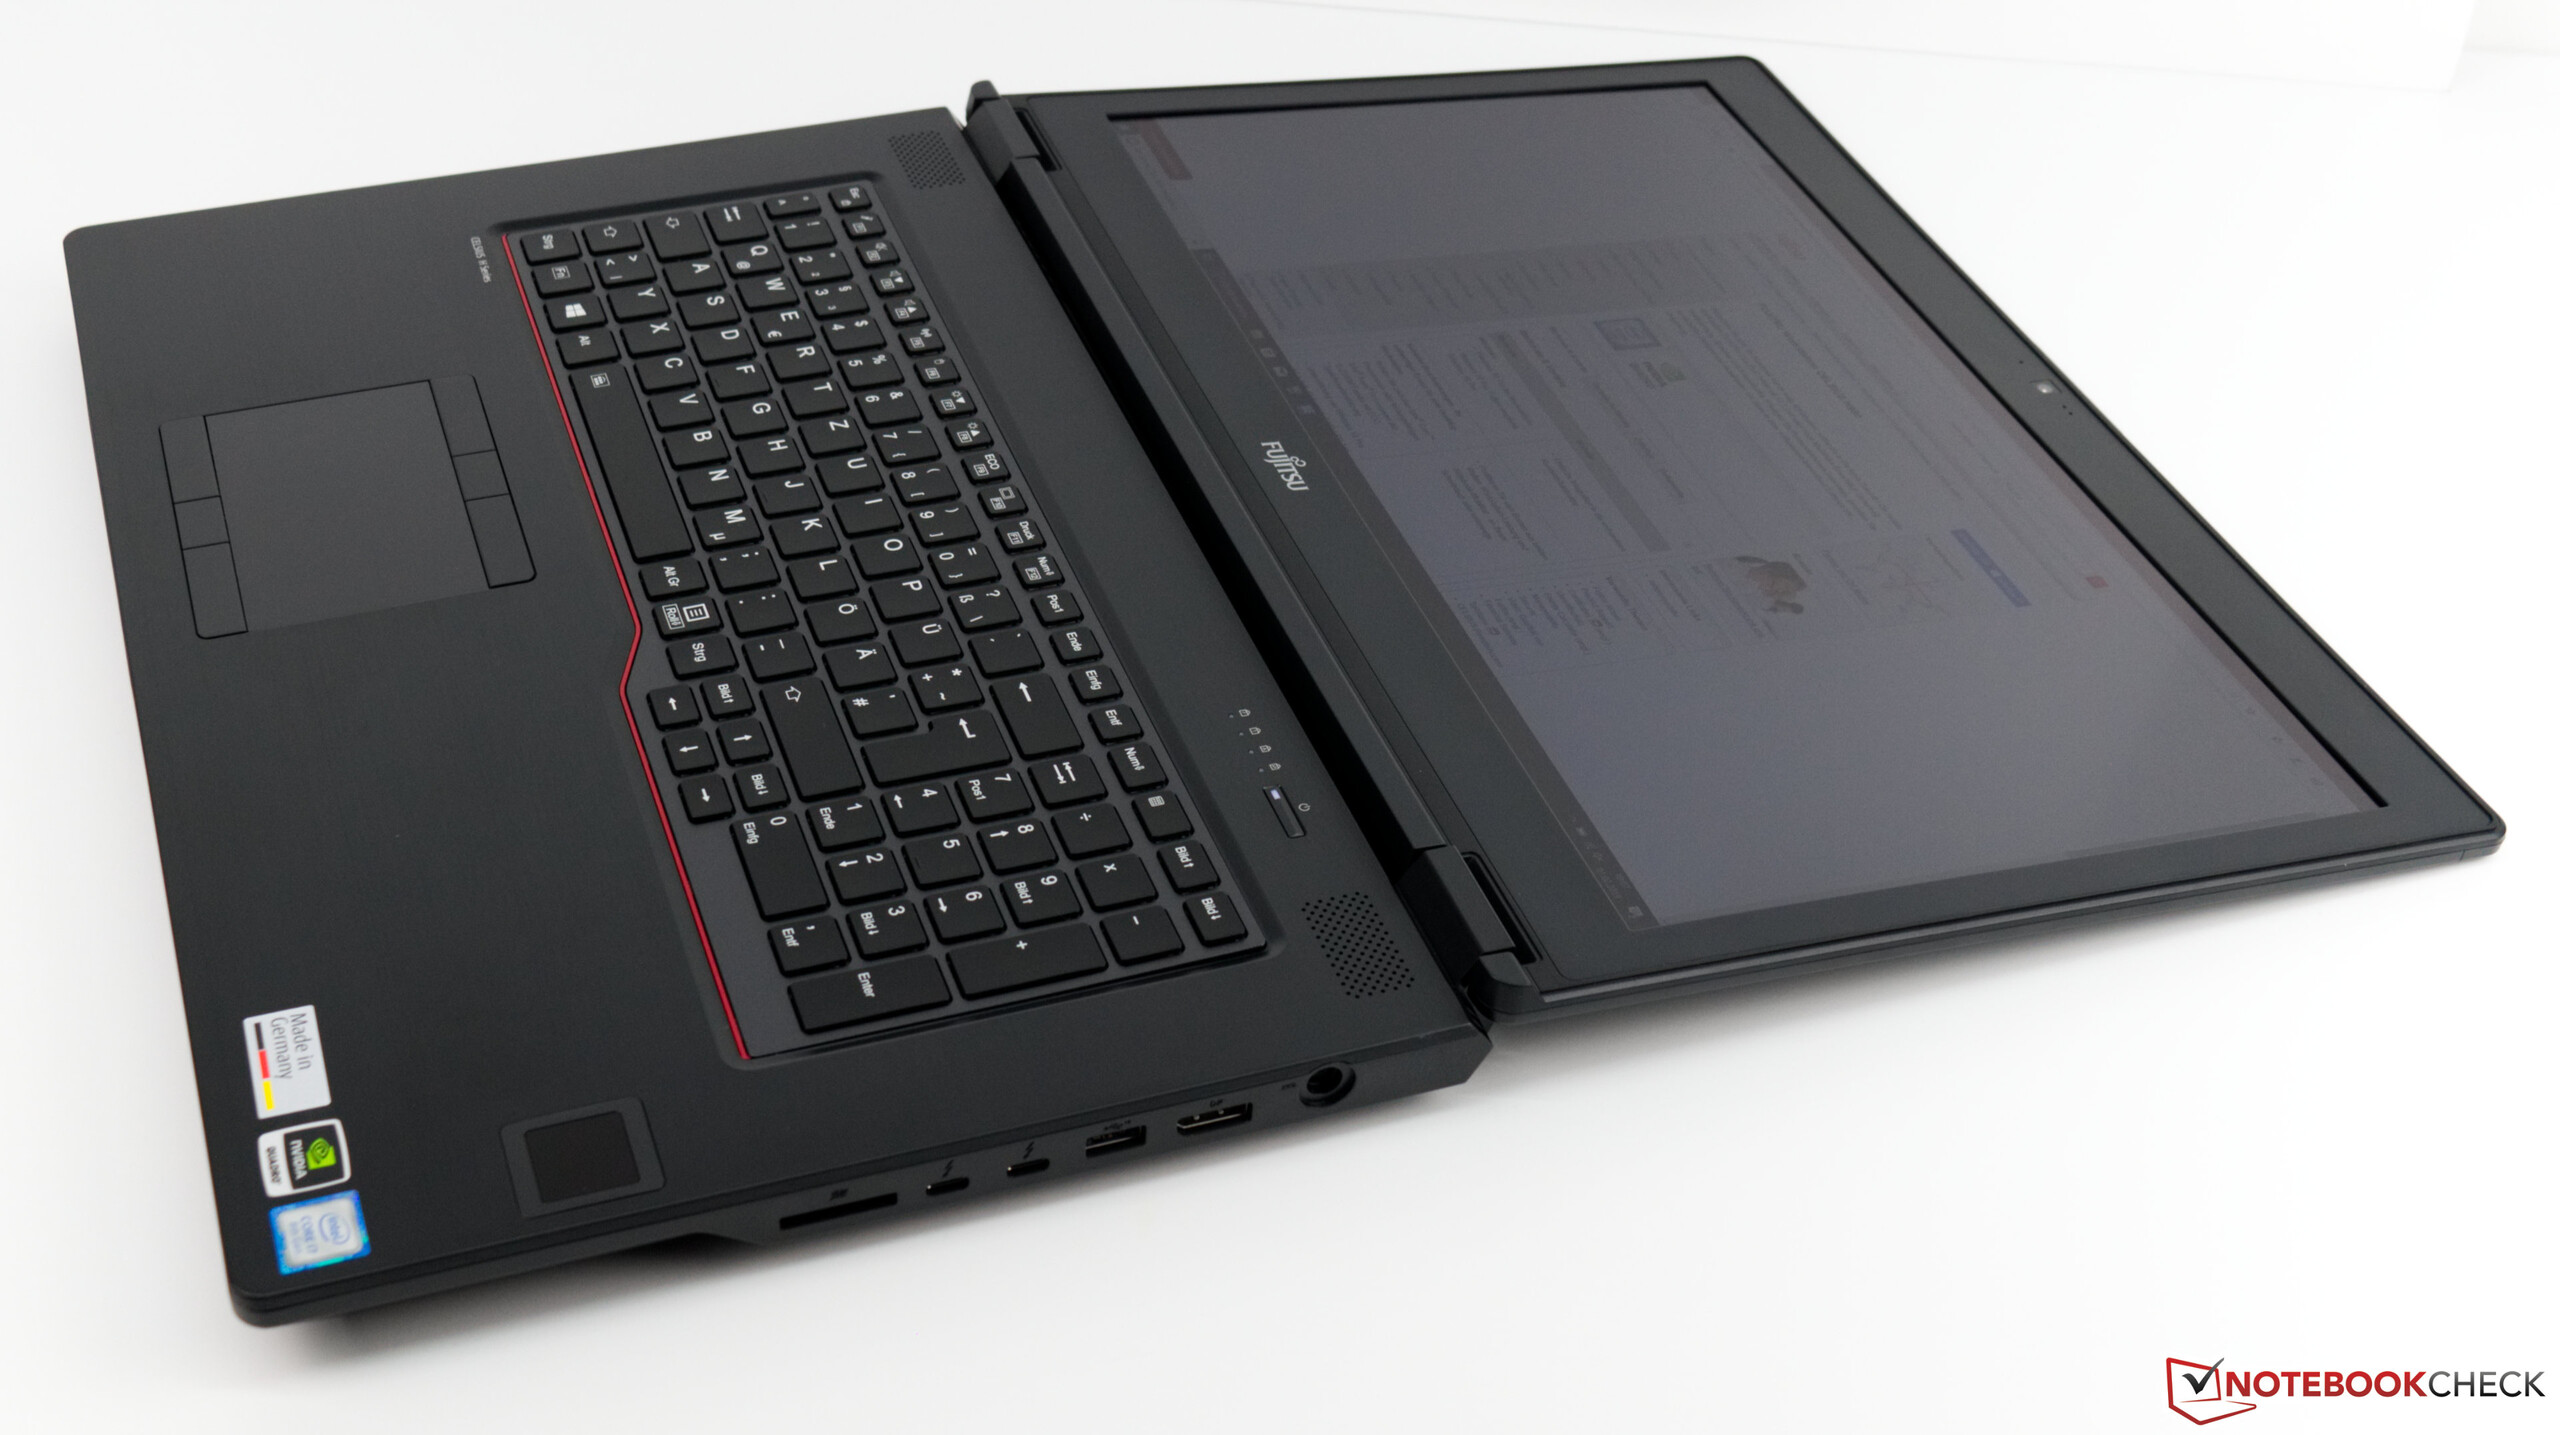
O Fujitsu Celsius H980 tem melhor desempenho de sistema e resfriamento de CPU do que seu antecessor, mas sua tela de 1080p não pode competir com a resolução ou precisão de cores de concorrentes como o Dell Precision 7720.
O Celsius H980 é um dispositivo volumoso e faminto por energia, mas como são muitos outros workstations. O dispositivo conseguiu entregar um excelente desempenho do sistema e lidou com nossos benchmarks de workstations com facilidade. Além disso, enquanto a tela de 17,3 polegadas é brilhante e tem um acabamento mate, que será útil ao usar o Celsius H980 em exteriores, falta a precisão das cores de seus concorrentes. Nossa unidade de análise obteve coberturas de espaço de cor muito baixas e desvios DeltaE muito altos para o nosso gosto. Pior ainda, a Fujitsu oferece o Celsius H980 apenas com uma tela 1080p, o que coloca o dispositivo em desvantagem com os concorrentes que possuem painéis 4K opcionais, como o Dell Precision 7720.
Essas desvantagens farão do Celsius H980 uma venda difícil, apesar de seu bom desempenho de CPU e GPU, particularmente porque enfrenta uma forte concorrência do Dell Precision 7720, do HP ZBook 17 G5 e do Lenovo ThinkPad P72.
Também é importante ter em mente que o Celsius H980 também tem uma duração de bateria pior do que seu predecessor, mas suspeitamos que isso importará pouco para a maioria das pessoas que usam workstations, já que as máquinas tendem a ser usadas em uma mesa em vez de em movimento. No geral, o Fujitsu Celsius H980 é um excelente workstation que só é restrito pela sua tela com cor imprecisa.
Fujitsu Celsius H980
- 01/08/2020 v7 (old)
Sebastian Bade
Price comparison
