Breve Análise do Workstation Fujitsu Celsius H970 (E3-1535M v6, P4000)

| SD Card Reader | |
| average JPG Copy Test (av. of 3 runs) | |
| Dell Precision 7710 | |
| Lenovo ThinkPad P71-20HK0004GE | |
| Fujitsu Celsius H970 | |
| HP ZBook 17 G3 TZV66eA | |
| maximum AS SSD Seq Read Test (1GB) | |
| Lenovo ThinkPad P71-20HK0004GE | |
| HP ZBook 17 G3 TZV66eA | |
| Fujitsu Celsius H970 | |
| Dell Precision 7710 | |
| Networking | |
| iperf3 transmit AX12 | |
| Lenovo ThinkPad P71-20HK0004GE | |
| Fujitsu Celsius H970 | |
| MSI WE72 7RJ | |
| iperf3 receive AX12 | |
| Fujitsu Celsius H970 | |
| Lenovo ThinkPad P71-20HK0004GE | |
| MSI WE72 7RJ | |
| |||||||||||||||||||||||||
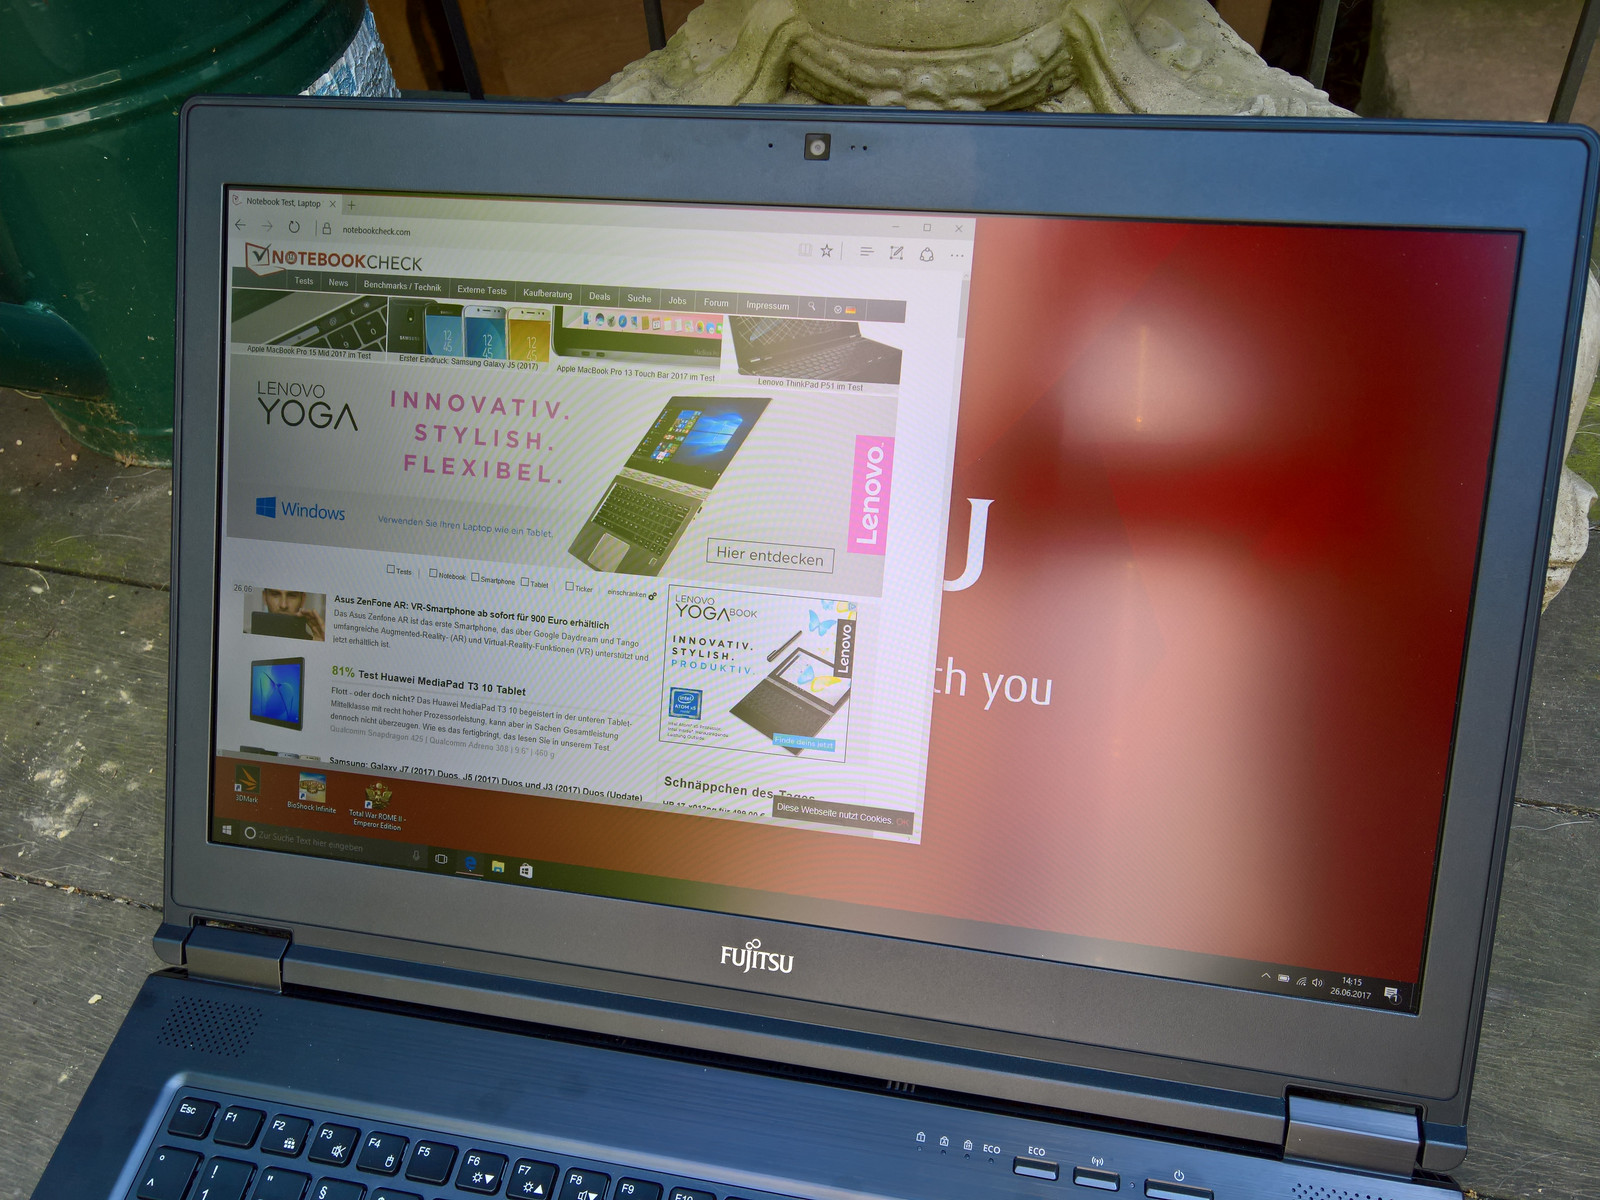
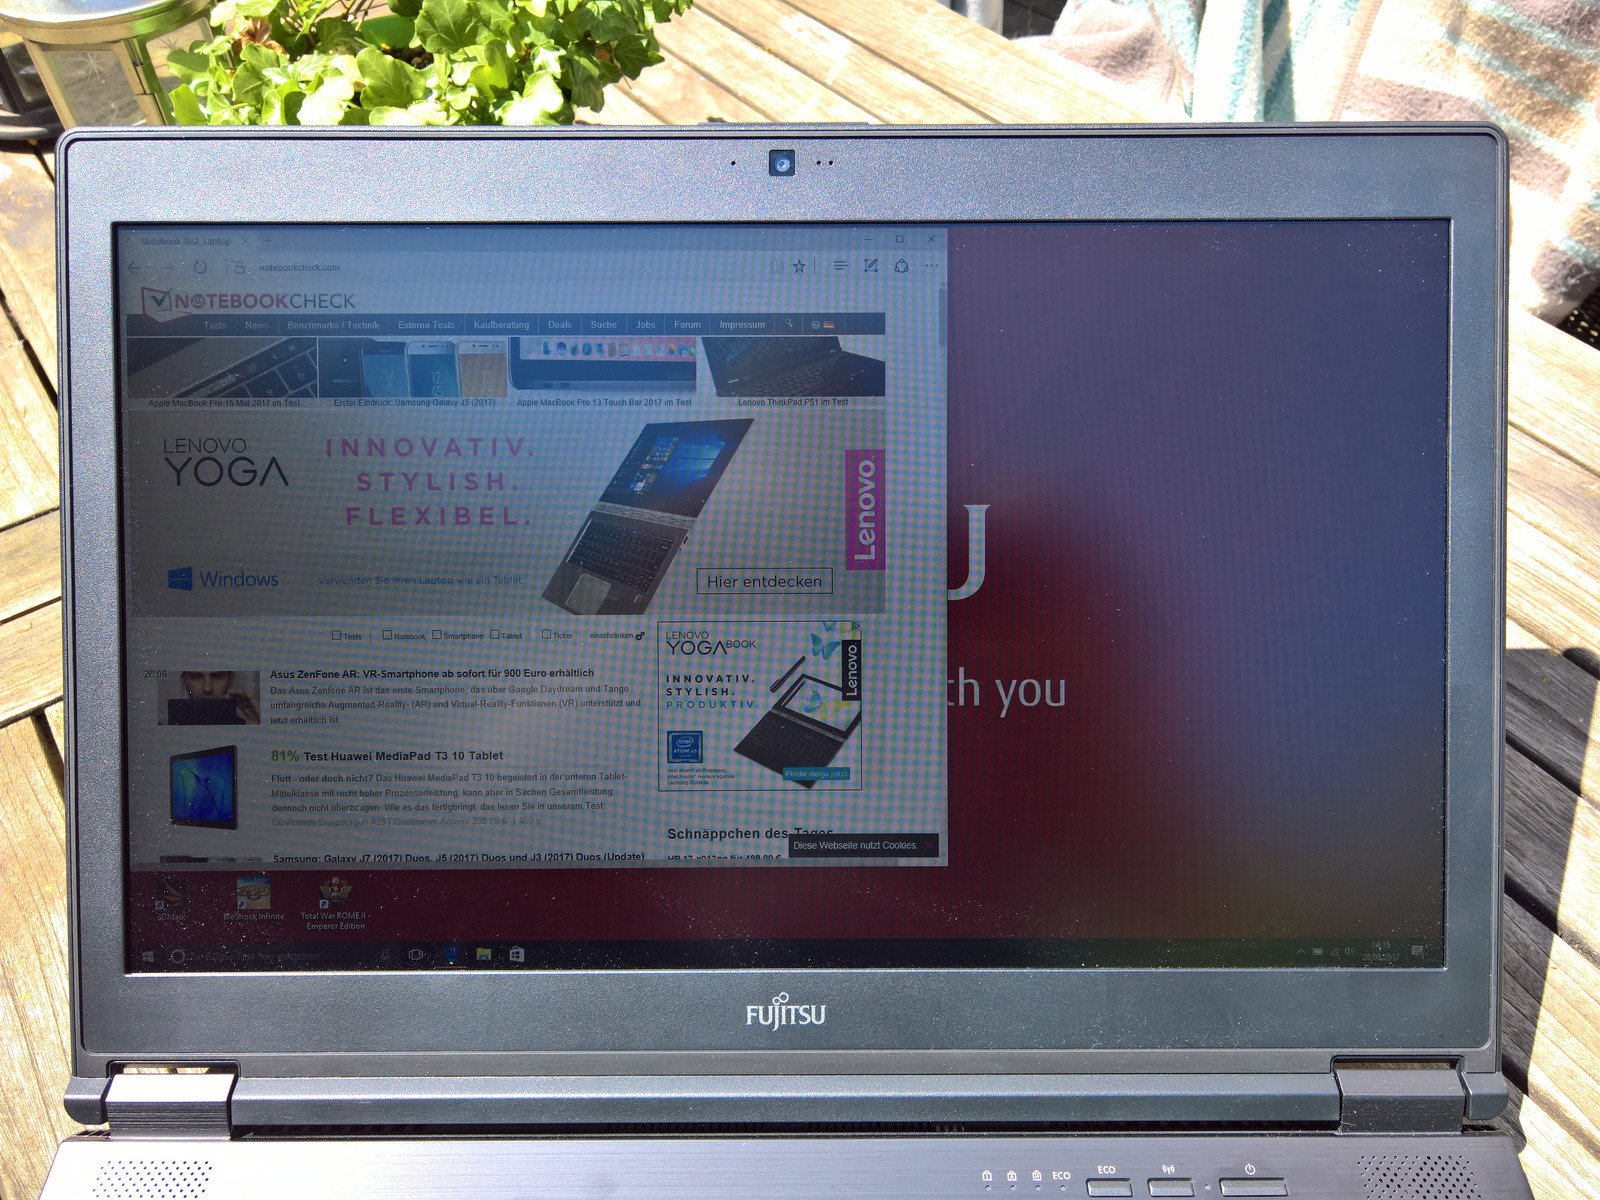
iluminação: 91 %
iluminação com acumulador: 373 cd/m²
Contraste: 1227:1 (Preto: 0.3 cd/m²)
ΔE ColorChecker Calman: 6.4 | ∀{0.5-29.43 Ø4.71}
ΔE Greyscale Calman: 7.2 | ∀{0.09-98 Ø4.96}
84.4% sRGB (Argyll 1.6.3 3D)
55.5% AdobeRGB 1998 (Argyll 1.6.3 3D)
61.8% AdobeRGB 1998 (Argyll 3D)
84.6% sRGB (Argyll 3D)
66.8% Display P3 (Argyll 3D)
Gamma: 2.02
CCT: 6882 K
| Fujitsu Celsius H970 LP173WF4-SPF3, , 1920x1080, 17.3" | Lenovo ThinkPad P71-20HK0004GE LEN4123, VVX17P051J00, , 3840x2160, 17.3" | HP ZBook 17 G3 TZV66eA SDC3854, , 1920x1080, 17.3" | Dell Precision 7710 SDC8151, VHN17_173HL, , 1920x1080, 17.3" | MSI WE72 7RJ LP173WF4-SPF1, , 1920x1080, 17.3" | Schenker W706 LP173WF4-SPD1, LGD046C, , 1920x1080, 17.3" | |
|---|---|---|---|---|---|---|
| Display | 9% | 9% | 1% | -0% | ||
| Display P3 Coverage (%) | 66.8 | 67.3 1% | 66.6 0% | 67.4 1% | 66.2 -1% | |
| sRGB Coverage (%) | 84.6 | 95.9 13% | 96.9 15% | 85.3 1% | 84.2 0% | |
| AdobeRGB 1998 Coverage (%) | 61.8 | 69 12% | 68.6 11% | 62.4 1% | 61.5 0% | |
| Response Times | -6% | -33% | -46% | -21% | -25% | |
| Response Time Grey 50% / Grey 80% * (ms) | 32 ? | 39.2 ? -23% | 50.4 ? -58% | 50 ? -56% | 45.2 ? -41% | 44 ? -38% |
| Response Time Black / White * (ms) | 26.4 ? | 23.2 ? 12% | 28.4 ? -8% | 36 ? -36% | 26.4 ? -0% | 29.2 ? -11% |
| PWM Frequency (Hz) | 1412 ? | 200 ? | 198 ? | |||
| Screen | 23% | 18% | 7% | -6% | -4% | |
| Brightness middle (cd/m²) | 368 | 358 -3% | 252 -32% | 332 -10% | 302 -18% | 356 -3% |
| Brightness (cd/m²) | 360 | 338 -6% | 243 -32% | 307 -15% | 306 -15% | 331 -8% |
| Brightness Distribution (%) | 91 | 83 -9% | 86 -5% | 83 -9% | 93 2% | 86 -5% |
| Black Level * (cd/m²) | 0.3 | 0.31 -3% | 0.21 30% | 0.33 -10% | 0.31 -3% | 0.48 -60% |
| Contrast (:1) | 1227 | 1155 -6% | 1200 -2% | 1006 -18% | 974 -21% | 742 -40% |
| Colorchecker dE 2000 * | 6.4 | 2.1 67% | 2.2 66% | 3 53% | 6.2 3% | 4.64 28% |
| Colorchecker dE 2000 max. * | 10.1 | 3.6 64% | 3.8 62% | 10.6 -5% | ||
| Greyscale dE 2000 * | 7.2 | 2 72% | 2.7 62% | 4 44% | 7.3 -1% | 3.65 49% |
| Gamma | 2.02 109% | 2.16 102% | 2.28 96% | 2 110% | 2.08 106% | 2.02 109% |
| CCT | 6882 94% | 6216 105% | 6686 97% | 7089 92% | 7020 93% | 6393 102% |
| Color Space (Percent of AdobeRGB 1998) (%) | 55.5 | 77 39% | 62 12% | 62 12% | 56 1% | 55 -1% |
| Color Space (Percent of sRGB) (%) | 84.4 | 99.97 18% | 96 14% | 97 15% | 85.2 1% | 84 0% |
| Média Total (Programa/Configurações) | 9% /
19% | -2% /
9% | -10% /
-0% | -9% /
-6% | -10% /
-6% |
* ... menor é melhor
Exibir tempos de resposta
| ↔ Tempo de resposta preto para branco | ||
|---|---|---|
| 26.4 ms ... ascensão ↗ e queda ↘ combinadas | ↗ 14.8 ms ascensão | 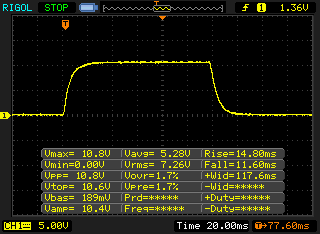 |
| ↘ 11.6 ms queda | ||
| A tela mostra taxas de resposta relativamente lentas em nossos testes e pode ser muito lenta para os jogadores. Em comparação, todos os dispositivos testados variam de 0.1 (mínimo) a 240 (máximo) ms. » 66 % de todos os dispositivos são melhores. Isso significa que o tempo de resposta medido é pior que a média de todos os dispositivos testados (19.8 ms). | ||
| ↔ Tempo de resposta 50% cinza a 80% cinza | ||
| 32 ms ... ascensão ↗ e queda ↘ combinadas | ↗ 14.8 ms ascensão | 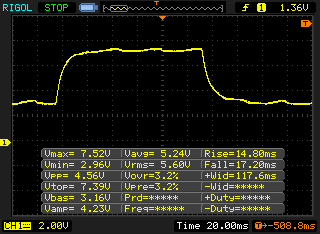 |
| ↘ 17.2 ms queda | ||
| A tela mostra taxas de resposta lentas em nossos testes e será insatisfatória para os jogadores. Em comparação, todos os dispositivos testados variam de 0.165 (mínimo) a 636 (máximo) ms. » 43 % de todos os dispositivos são melhores. Isso significa que o tempo de resposta medido é semelhante à média de todos os dispositivos testados (31 ms). | ||
Cintilação da tela / PWM (modulação por largura de pulso)
| Tela tremeluzindo / PWM não detectado |  | ||
[pwm_comparison] Em comparação: 52 % de todos os dispositivos testados não usam PWM para escurecer a tela. Se PWM foi detectado, uma média de 7754 (mínimo: 5 - máximo: 343500) Hz foi medida. | |||
| Cinebench R15 | |
| CPU Single 64Bit | |
| Fujitsu Celsius H970 | |
| Lenovo ThinkPad P71-20HK0004GE | |
| Dell Precision 7710 | |
| MSI WE72 7RJ | |
| HP ZBook 17 G3 TZV66eA | |
| Schenker W706 | |
| CPU Multi 64Bit | |
| Lenovo ThinkPad P71-20HK0004GE | |
| Dell Precision 7710 | |
| Schenker W706 | |
| MSI WE72 7RJ | |
| HP ZBook 17 G3 TZV66eA | |
| Fujitsu Celsius H970 | |
| PCMark 8 | |
| Work Score Accelerated v2 | |
| Dell Precision 7710 | |
| Fujitsu Celsius H970 | |
| HP ZBook 17 G3 TZV66eA | |
| Schenker W706 | |
| MSI WE72 7RJ | |
| Creative Score Accelerated v2 | |
| Fujitsu Celsius H970 | |
| Schenker W706 | |
| Lenovo ThinkPad P71-20HK0004GE | |
| Dell Precision 7710 | |
| HP ZBook 17 G3 TZV66eA | |
| PCMark 8 Creative Score Accelerated v2 | 7135 pontos | |
| PCMark 8 Work Score Accelerated v2 | 5277 pontos | |
| PCMark 10 Score | 5041 pontos | |
Ajuda | ||
| Fujitsu Celsius H970 Samsung SM961 MZVKW512HMJP m.2 PCI-e | HP ZBook 17 G3 TZV66eA Samsung SM951 MZVPV256HDGL m.2 PCI-e | MSI WE72 7RJ Samsung SM961 MZVPW256 m.2 PCI-e | Lenovo ThinkPad P71-20HK0004GE Samsung PM961 NVMe MZVLW512HMJP | Dell Precision 7710 Samsung SM951 MZVPV256HDGL m.2 PCI-e | Schenker W706 Samsung SM951 MZVPV512HDGL m.2 PCI-e | |
|---|---|---|---|---|---|---|
| AS SSD | -15% | 18% | 14% | -7% | -2% | |
| Seq Read (MB/s) | 2726 | 1596 -41% | 2586 -5% | 2447 -10% | 1886 -31% | 1915 -30% |
| Seq Write (MB/s) | 1609 | 703 -56% | 1441 -10% | 1596 -1% | 626 -61% | 1511 -6% |
| 4K Read (MB/s) | 38.88 | 51.1 31% | 53 36% | 53.3 37% | 51 31% | 49.71 28% |
| 4K Write (MB/s) | 78.1 | 148.2 90% | 148.1 90% | 144.1 85% | 179 129% | 146.2 87% |
| 4K-64 Read (MB/s) | 1246 | 1037 -17% | 1517 22% | 1362 9% | 1064 -15% | 1115 -11% |
| 4K-64 Write (MB/s) | 971 | 230.4 -76% | 826 -15% | 740 -24% | 275 -72% | 375 -61% |
| Score Total (Points) | 3509 | 2302 -34% | 3831 9% | 3517 0% | 2435 -31% | 2712 -23% |

| 3DMark 11 - 1280x720 Performance GPU | |
| Fujitsu Celsius H970 | |
| Schenker W706 | |
| Lenovo ThinkPad P71-20HK0004GE | |
| Lenovo ThinkPad P70-20ER000XUS | |
| Dell Precision 7710 | |
| HP ZBook 17 G3 TZV66eA | |
| MSI WE72 7RJ | |
| 3DMark | |
| 1280x720 Cloud Gate Standard Graphics | |
| Schenker W706 | |
| Lenovo ThinkPad P71-20HK0004GE | |
| Fujitsu Celsius H970 | |
| HP ZBook 17 G3 TZV66eA | |
| Lenovo ThinkPad P70-20ER000XUS | |
| Dell Precision 7710 | |
| MSI WE72 7RJ | |
| 1920x1080 Fire Strike Graphics | |
| Fujitsu Celsius H970 | |
| Schenker W706 | |
| Lenovo ThinkPad P71-20HK0004GE | |
| Lenovo ThinkPad P70-20ER000XUS | |
| Dell Precision 7710 | |
| HP ZBook 17 G3 TZV66eA | |
| MSI WE72 7RJ | |
| LuxMark v2.0 64Bit | |
| Room GPUs-only | |
| Fujitsu Celsius H970 | |
| Lenovo ThinkPad P71-20HK0004GE | |
| Schenker W706 | |
| HP ZBook 17 G3 TZV66eA | |
| MSI WE72 7RJ | |
| Dell Precision 7710 | |
| Sala GPUs-only | |
| Fujitsu Celsius H970 | |
| Lenovo ThinkPad P71-20HK0004GE | |
| HP ZBook 17 G3 TZV66eA | |
| Schenker W706 | |
| MSI WE72 7RJ | |
| Dell Precision 7710 | |
| ComputeMark v2.1 - 1024x600 Normal, Score | |
| Fujitsu Celsius H970 | |
| Lenovo ThinkPad P71-20HK0004GE | |
| Schenker W706 | |
| Lenovo ThinkPad P70-20ER000XUS | |
| MSI WE72 7RJ | |
| Dell Precision 7710 | |
| GFXBench | |
| 1920x1080 Car Chase Offscreen | |
| Fujitsu Celsius H970 | |
| Lenovo ThinkPad P71-20HK0004GE | |
| MSI WE72 7RJ | |
| on screen Car Chase Onscreen | |
| MSI WE72 7RJ | |
| Fujitsu Celsius H970 | |
| Lenovo ThinkPad P71-20HK0004GE | |
| 3DMark Vantage - 1280x1024 P Result | |
| Fujitsu Celsius H970 | |
| Lenovo ThinkPad P71-20HK0004GE | |
| Dell Precision 7710 | |
| MSI WE72 7RJ | |
| 3DMark 06 Standard Score | 29155 pontos | |
| 3DMark Vantage P Result | 36260 pontos | |
| 3DMark 11 Performance | 12346 pontos | |
| 3DMark Ice Storm Standard Score | 68394 pontos | |
| 3DMark Cloud Gate Standard Score | 18726 pontos | |
| 3DMark Fire Strike Score | 10158 pontos | |
| 3DMark Fire Strike Extreme Score | 5526 pontos | |
| 3DMark Time Spy Score | 3825 pontos | |
Ajuda | ||
| Rise of the Tomb Raider - 1920x1080 Very High Preset AA:FX AF:16x | |
| MSI GT62VR-6RE16H21 | |
| Fujitsu Celsius H970 | |
| Schenker XMG P507 | |
| Lenovo ThinkPad P71-20HK0004GE | |
| MSI GE72 7RE-046 | |
| MSI WE72 7RJ | |
| HP ZBook 17 G3 TZV66eA | |
| baixo | média | alto | ultra | |
|---|---|---|---|---|
| BioShock Infinite (2013) | 196.9 | 174.4 | 162.4 | 96 |
| Company of Heroes 2 (2013) | 67.6 | 61.1 | 59.7 | 44.94 |
| Total War: Rome II (2013) | 236.7 | 184.1 | 151.4 | 63.3 |
| GRID: Autosport (2014) | 153.8 | 106.3 | 96.9 | 84.5 |
| The Witcher 3 (2015) | 159.7 | 113.6 | 77.2 | 41.09 |
| Star Wars Battlefront (2015) | 122.5 | 116.4 | 89.2 | 85.7 |
| Rise of the Tomb Raider (2016) | 115.9 | 103.2 | 76.8 | 65.5 |
| Doom (2016) | 119.5 | 112.4 | 91 | 87.1 |
| Civilization 6 (2016) | 66.7 | 55.2 | 45.13 | 43.7 |
| Warhammer 40.000: Dawn of War III (2017) | 70.3 | 61.6 | 58.8 | 54 |
Barulho
| Ocioso |
| 30.2 / 32.8 / 32.8 dB |
| Carga |
| 47.3 / 47.3 dB |
 | ||
30 dB silencioso 40 dB(A) audível 50 dB(A) ruidosamente alto |
||
min: | ||
(±) A temperatura máxima no lado superior é 41.4 °C / 107 F, em comparação com a média de 38.2 °C / 101 F , variando de 22.2 a 69.8 °C para a classe Workstation.
(-) A parte inferior aquece até um máximo de 48.7 °C / 120 F, em comparação com a média de 41.1 °C / 106 F
(+) Em uso inativo, a temperatura média para o lado superior é 25.9 °C / 79 F, em comparação com a média do dispositivo de 32 °C / ### class_avg_f### F.
(+) Os apoios para as mãos e o touchpad são mais frios que a temperatura da pele, com um máximo de 26.6 °C / 79.9 F e, portanto, são frios ao toque.
(±) A temperatura média da área do apoio para as mãos de dispositivos semelhantes foi 27.8 °C / 82 F (+1.2 °C / 2.1 F).
Fujitsu Celsius H970 análise de áudio
(±) | o volume do alto-falante é médio, mas bom (###valor### dB)
Graves 100 - 315Hz
(-) | quase nenhum baixo - em média 26.7% menor que a mediana
(+) | o baixo é linear (5.1% delta para a frequência anterior)
Médios 400 - 2.000 Hz
(±) | médios reduzidos - em média 5.4% menor que a mediana
(±) | a linearidade dos médios é média (8.3% delta para frequência anterior)
Altos 2 - 16 kHz
(+) | agudos equilibrados - apenas 4.1% longe da mediana
(+) | os máximos são lineares (6.2% delta da frequência anterior)
Geral 100 - 16.000 Hz
(±) | a linearidade do som geral é média (29.1% diferença em relação à mediana)
Comparado com a mesma classe
» 96% de todos os dispositivos testados nesta classe foram melhores, 1% semelhantes, 3% piores
» O melhor teve um delta de 7%, a média foi 17%, o pior foi 35%
Comparado com todos os dispositivos testados
» 87% de todos os dispositivos testados foram melhores, 2% semelhantes, 11% piores
» O melhor teve um delta de 4%, a média foi 23%, o pior foi 134%
Lenovo ThinkPad P71-20HK0004GE análise de áudio
(-) | alto-falantes não muito altos (###valor### dB)
Graves 100 - 315Hz
(±) | graves reduzidos - em média 12.4% menor que a mediana
(±) | a linearidade dos graves é média (10.5% delta para a frequência anterior)
Médios 400 - 2.000 Hz
(±) | médios mais altos - em média 5.9% maior que a mediana
(+) | médios são lineares (6.4% delta para frequência anterior)
Altos 2 - 16 kHz
(±) | máximos reduzidos - em média 5% menor que a mediana
(±) | a linearidade dos máximos é média (13.6% delta para frequência anterior)
Geral 100 - 16.000 Hz
(±) | a linearidade do som geral é média (26.6% diferença em relação à mediana)
Comparado com a mesma classe
» 90% de todos os dispositivos testados nesta classe foram melhores, 4% semelhantes, 6% piores
» O melhor teve um delta de 7%, a média foi 17%, o pior foi 35%
Comparado com todos os dispositivos testados
» 82% de todos os dispositivos testados foram melhores, 3% semelhantes, 15% piores
» O melhor teve um delta de 4%, a média foi 23%, o pior foi 134%
| desligado | |
| Ocioso | |
| Carga |
|
Key:
min: | |
| Fujitsu Celsius H970 E3-1535M v6, Quadro P4000, Samsung SM961 MZVKW512HMJP m.2 PCI-e, IPS LED, 1920x1080, 17.3" | HP ZBook 17 G3 TZV66eA E3-1535M v5, Quadro M3000M, Samsung SM951 MZVPV256HDGL m.2 PCI-e, IPS, 1920x1080, 17.3" | Dell Precision 7710 E3-1535M v5, FirePro W7170M, Samsung SM951 MZVPV256HDGL m.2 PCI-e, IPS LED, 1920x1080, 17.3" | MSI WE72 7RJ i7-7700HQ, Quadro M2200, Samsung SM961 MZVPW256 m.2 PCI-e, IPS, 1920x1080, 17.3" | Schenker W706 6700, Quadro M5000M, Samsung SM951 MZVPV512HDGL m.2 PCI-e, IPS LED, 1920x1080, 17.3" | Lenovo ThinkPad P71-20HK0004GE i7-7820HQ, Quadro P3000, Samsung PM961 NVMe MZVLW512HMJP, IPS, 3840x2160, 17.3" | |
|---|---|---|---|---|---|---|
| Power Consumption | 6% | -29% | -17% | -74% | 0% | |
| Idle Minimum * (Watt) | 10.7 | 6.7 37% | 6.04 44% | 15 -40% | 25.9 -142% | 7.44 30% |
| Idle Average * (Watt) | 15.8 | 12.5 21% | 15.2 4% | 20.1 -27% | 31 -96% | 18 -14% |
| Idle Maximum * (Watt) | 17.8 | 13.2 26% | 42.3 -138% | 23.8 -34% | 31.9 -79% | 21.8 -22% |
| Load Average * (Watt) | 92 | 128.2 -39% | 112.8 -23% | 85.6 7% | 104.7 -14% | 77.1 16% |
| Load Maximum * (Watt) | 137 | 158.9 -16% | 182.2 -33% | 128 7% | 193 -41% | 150.5 -10% |
* ... menor é melhor
| Fujitsu Celsius H970 E3-1535M v6, Quadro P4000, 96 Wh | HP ZBook 17 G3 TZV66eA E3-1535M v5, Quadro M3000M, 96 Wh | Dell Precision 7710 E3-1535M v5, FirePro W7170M, 72 Wh | MSI WE72 7RJ i7-7700HQ, Quadro M2200, 51 Wh | Schenker W706 6700, Quadro M5000M, 82 Wh | Lenovo ThinkPad P71-20HK0004GE i7-7820HQ, Quadro P3000, 96 Wh | |
|---|---|---|---|---|---|---|
| Duração da bateria | -13% | -22% | -63% | -47% | -16% | |
| Reader / Idle (h) | 16.7 | 15.9 -5% | 12.9 -23% | 4.5 -73% | 3.4 -80% | 14.5 -13% |
| H.264 (h) | 9.6 | 5 -48% | 4.7 -51% | 3 -69% | 2.5 -74% | 8.6 -10% |
| WiFi v1.3 (h) | 9 | 4.8 -47% | 6.1 -32% | 3 -67% | 3 -67% | 6 -33% |
| Load (h) | 1.2 | 1.8 50% | 1.4 17% | 0.7 -42% | 1.6 33% | 1.1 -8% |
Pro
Contra
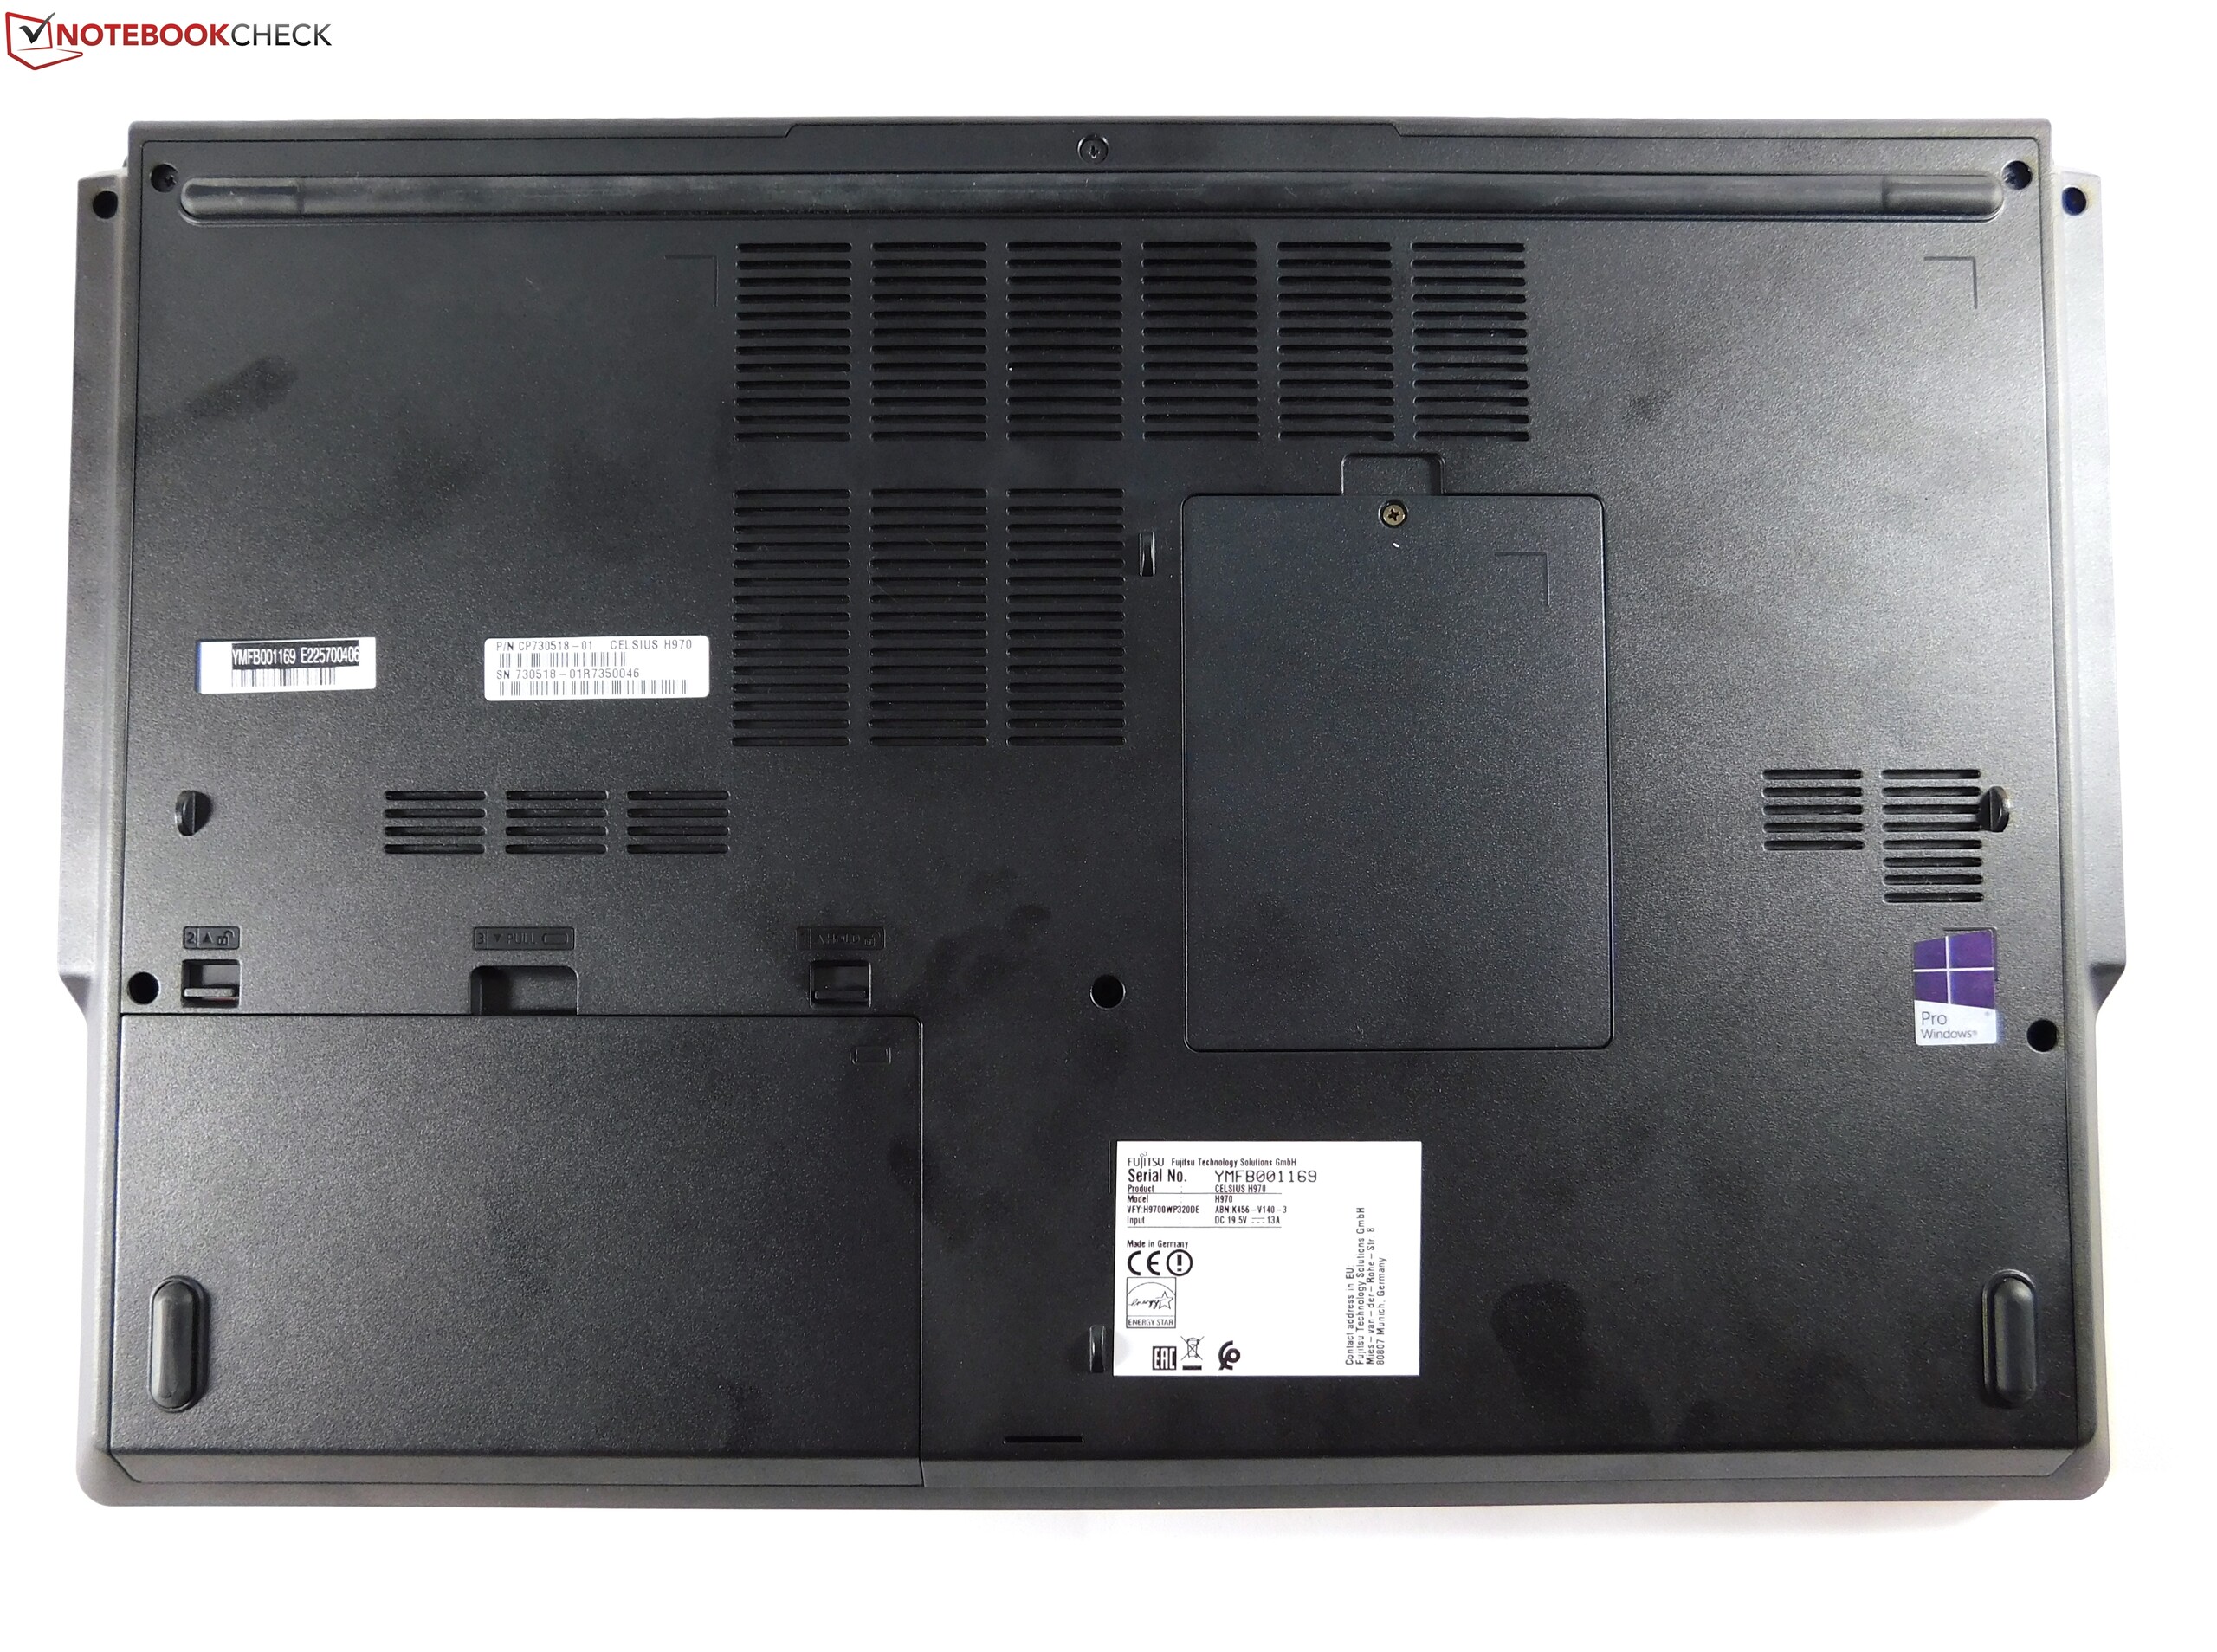
Não é fácil agradar no mercado dos workstations. Existem apenas alguns fabricantes com experiência e reputação suficientes para entrar neste jogo de classe "alta" de portáteis. A Fujitsu quer ser um desses fabricantes - pelo menos por enquanto. No entanto, o Fujitsu Celsius H970 não consegue nos convencer. A Fujitsu entrega um workstation móvel que é surpreendentemente bom em algumas áreas, mas muito fraco em outras. As boas áreas certamente incluem a duração da bateria, que é mais que decente para um workstation. Mostra-se aqui que, com as novas gerações de CPU mais eficientes, os processadores quad-core não precisam necessariamente ser um motivo para uma duração de bateria ruim. O brilho da tela também é atraente e, como a duração da bateria, o Celsius é o melhor da classe aqui. O desempenho da GPU é de primeira classe, o que se deve ao efetivo sistema de resfriamento da GPU. E, finalmente, precisamos mencionar a excelente capacidade de manutenção como uma das vantagens do Celsius. Ele é apenas um pouco prejudicado pelo fato de que você precisa de cabos especiais para inserir unidades de 2,5 polegadas.
A duração da bateria e o brilho da tela são os valores mais importantes para um portátil que você provavelmente só o moverá de um espaço de trabalho estacionário para outro, devido ao seu tamanho e peso? Provavelmente não! Infelizmente, a Fujitsu falha em lugares mais importantes, como no sistema de resfriamento da CPU. Onde o sistema de resfriamento da GPU é bem-sucedido, o sistema de resfriamento da CPU falha. É simplesmente muito pequeno. Isso torna o dispositivo muito barulhento, dado que a ventoinha tem que funcionar muito para resfriar a CPU. E, no entanto, apesar disso, o afogamento térmico não pode ser evitado. Isso já ocorre no teste Cinebench, que nem sequer fornece muita carga, de modo que, no cotidiano, o Celsius está longe de poder usar todo o potencial da CPU incorporada. Neste sentido, o caro Xeon E3-1535M V6, que é realmente a CPU móvel Kaby-Lake mais veloz, se trona o chip mais lento, em nossa comparação. Como se isso não fosse ruim o suficiente, a Fujitsu cometeu um grande erro com o teclado saltitante. E, embora a tela seja brilhante, as cores não são particularmente fortes e nem cobrem o espaço de cores sRGB. A Fujitsu não oferece uma tela com maior resolução e cobertura de espaço de cores.
Não passa: Enquanto o Fujitsu Celsius H970 tem suas qualidades, em particular o sistema de resfriamento de CPU deficiente está fora de lugar em um workstation móvel.
Devido a estes problemas, o Celsius tem dificuldades em enfrentar a concorrência estabelecida, como o ThinkPad P71, ZBook 17 G3, ou Precision 7710. O fator que ainda é suficiente para uma obter uma boa avaliação é p é o alto desempenho da nova placa de vídeo profissional.
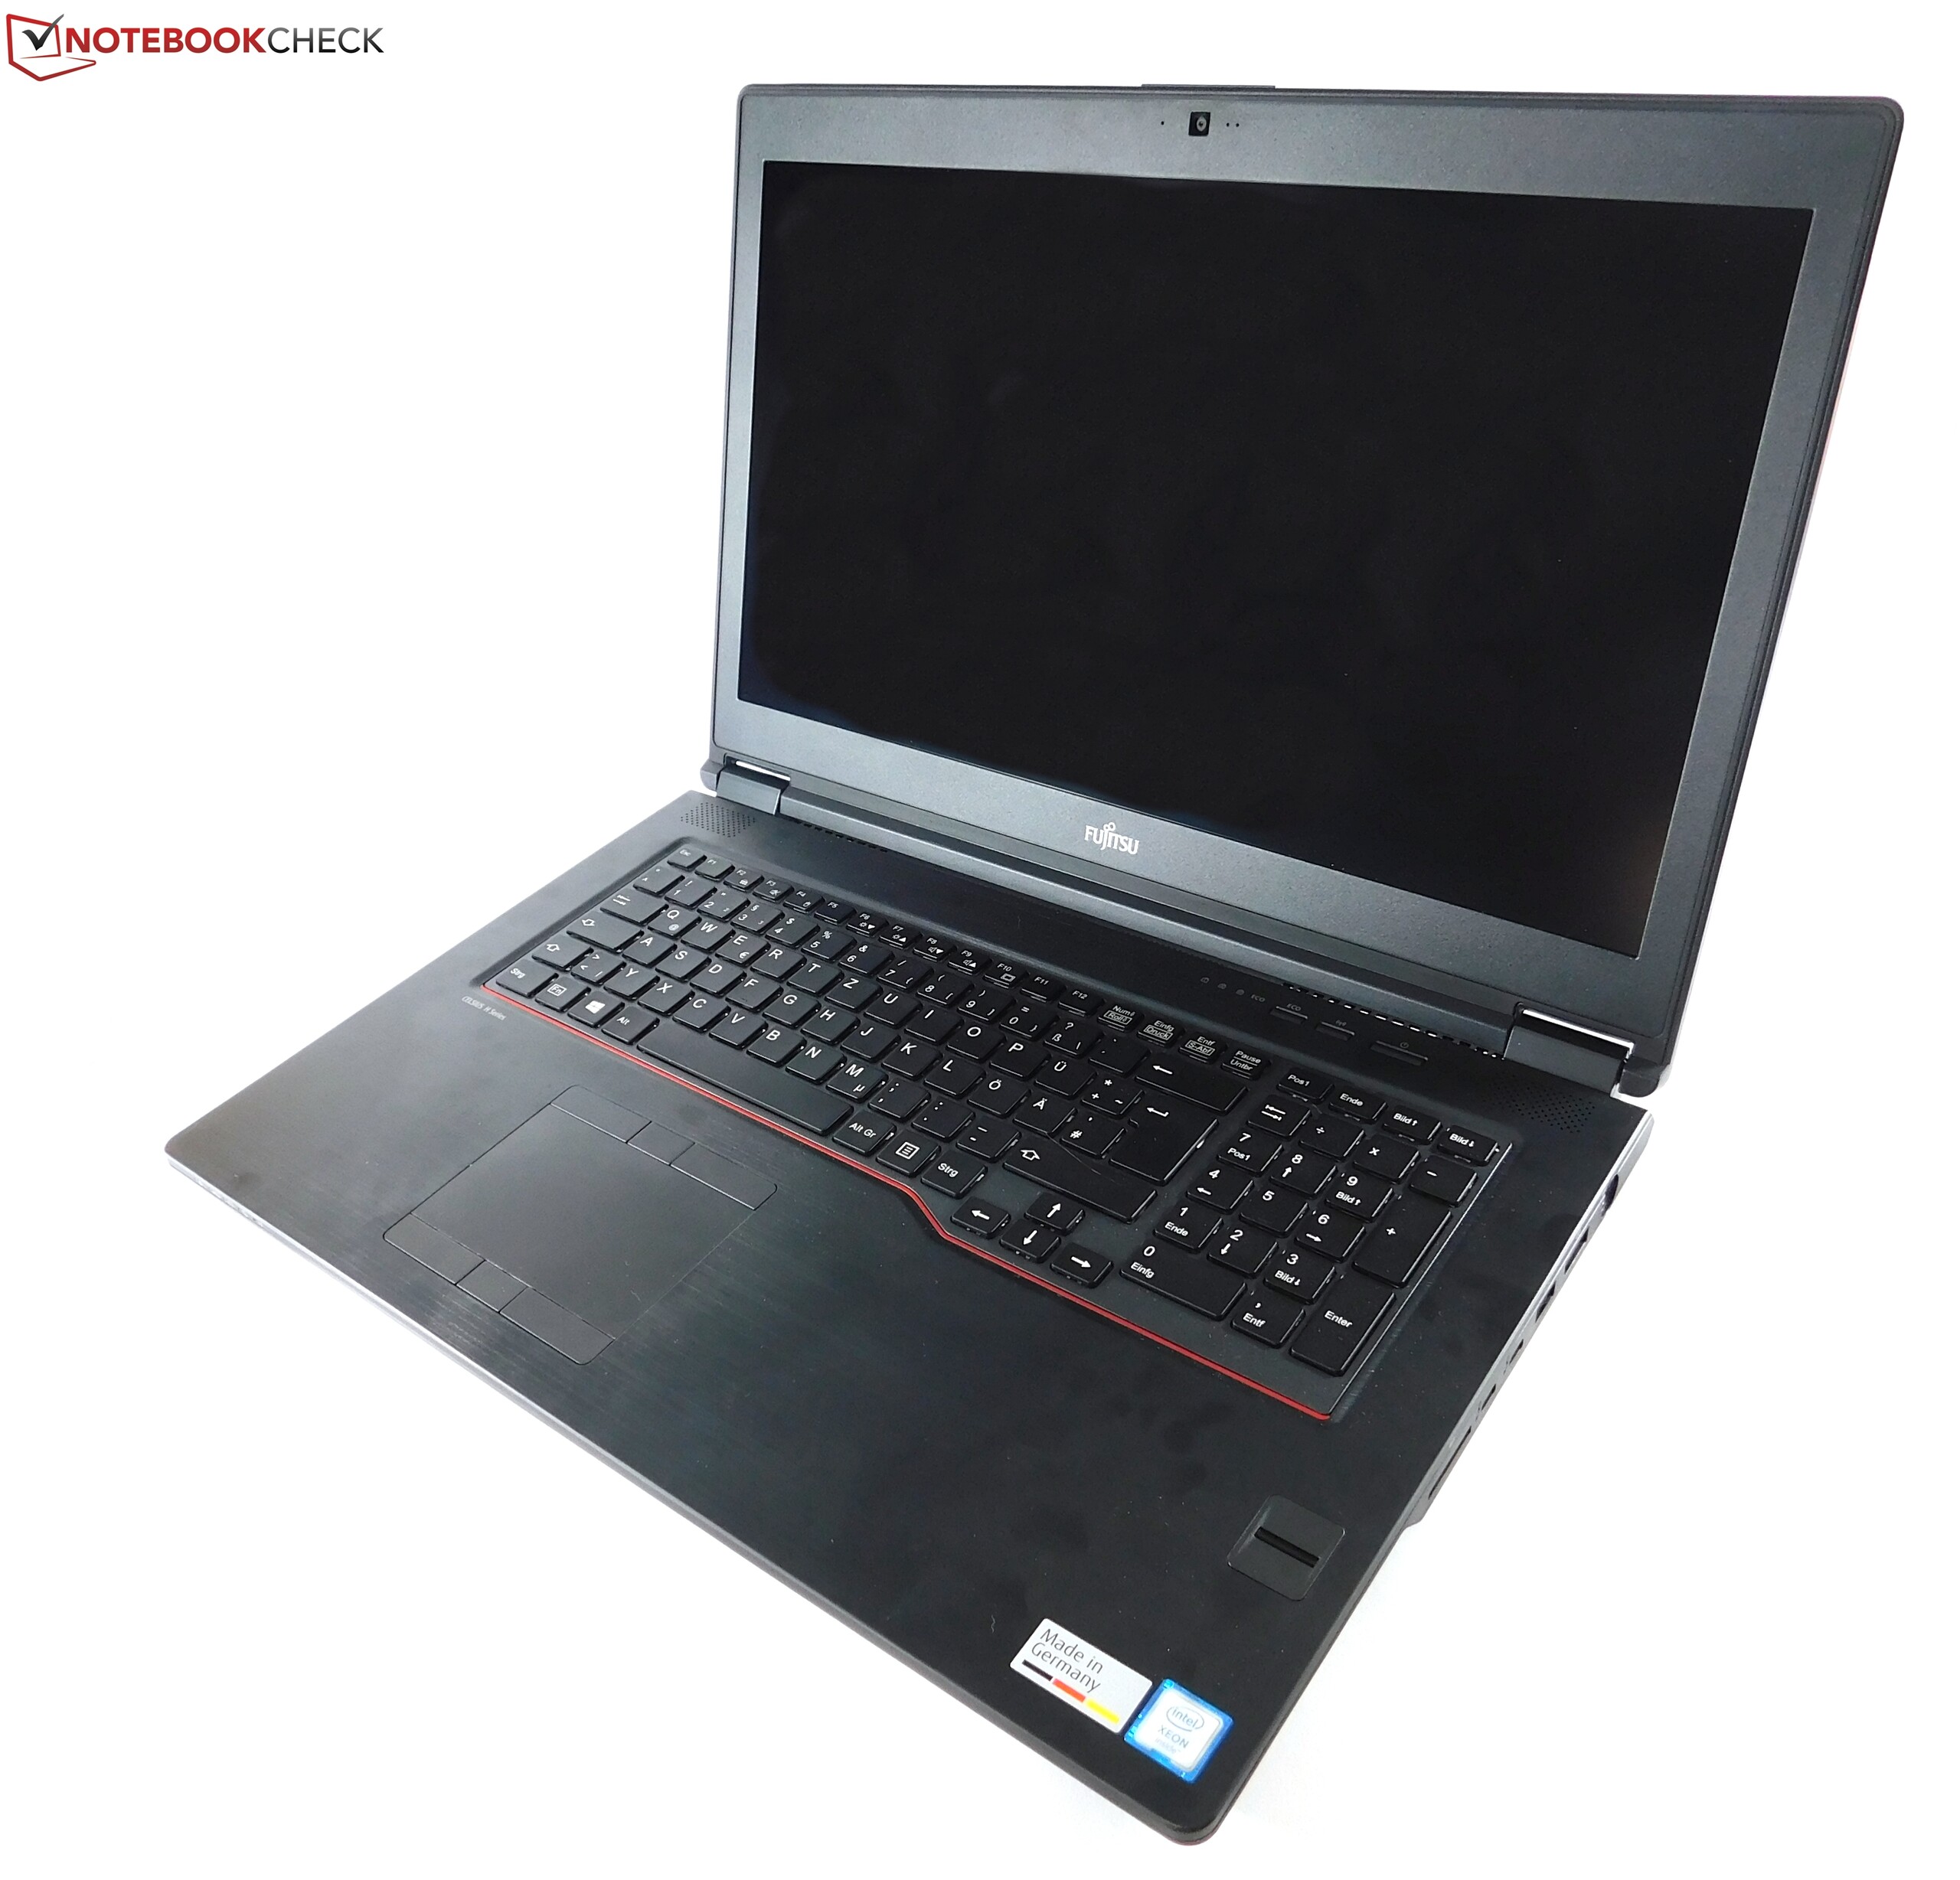
Fujitsu Celsius H970
- 07/07/2017 v6 (old)
Benjamin Herzig