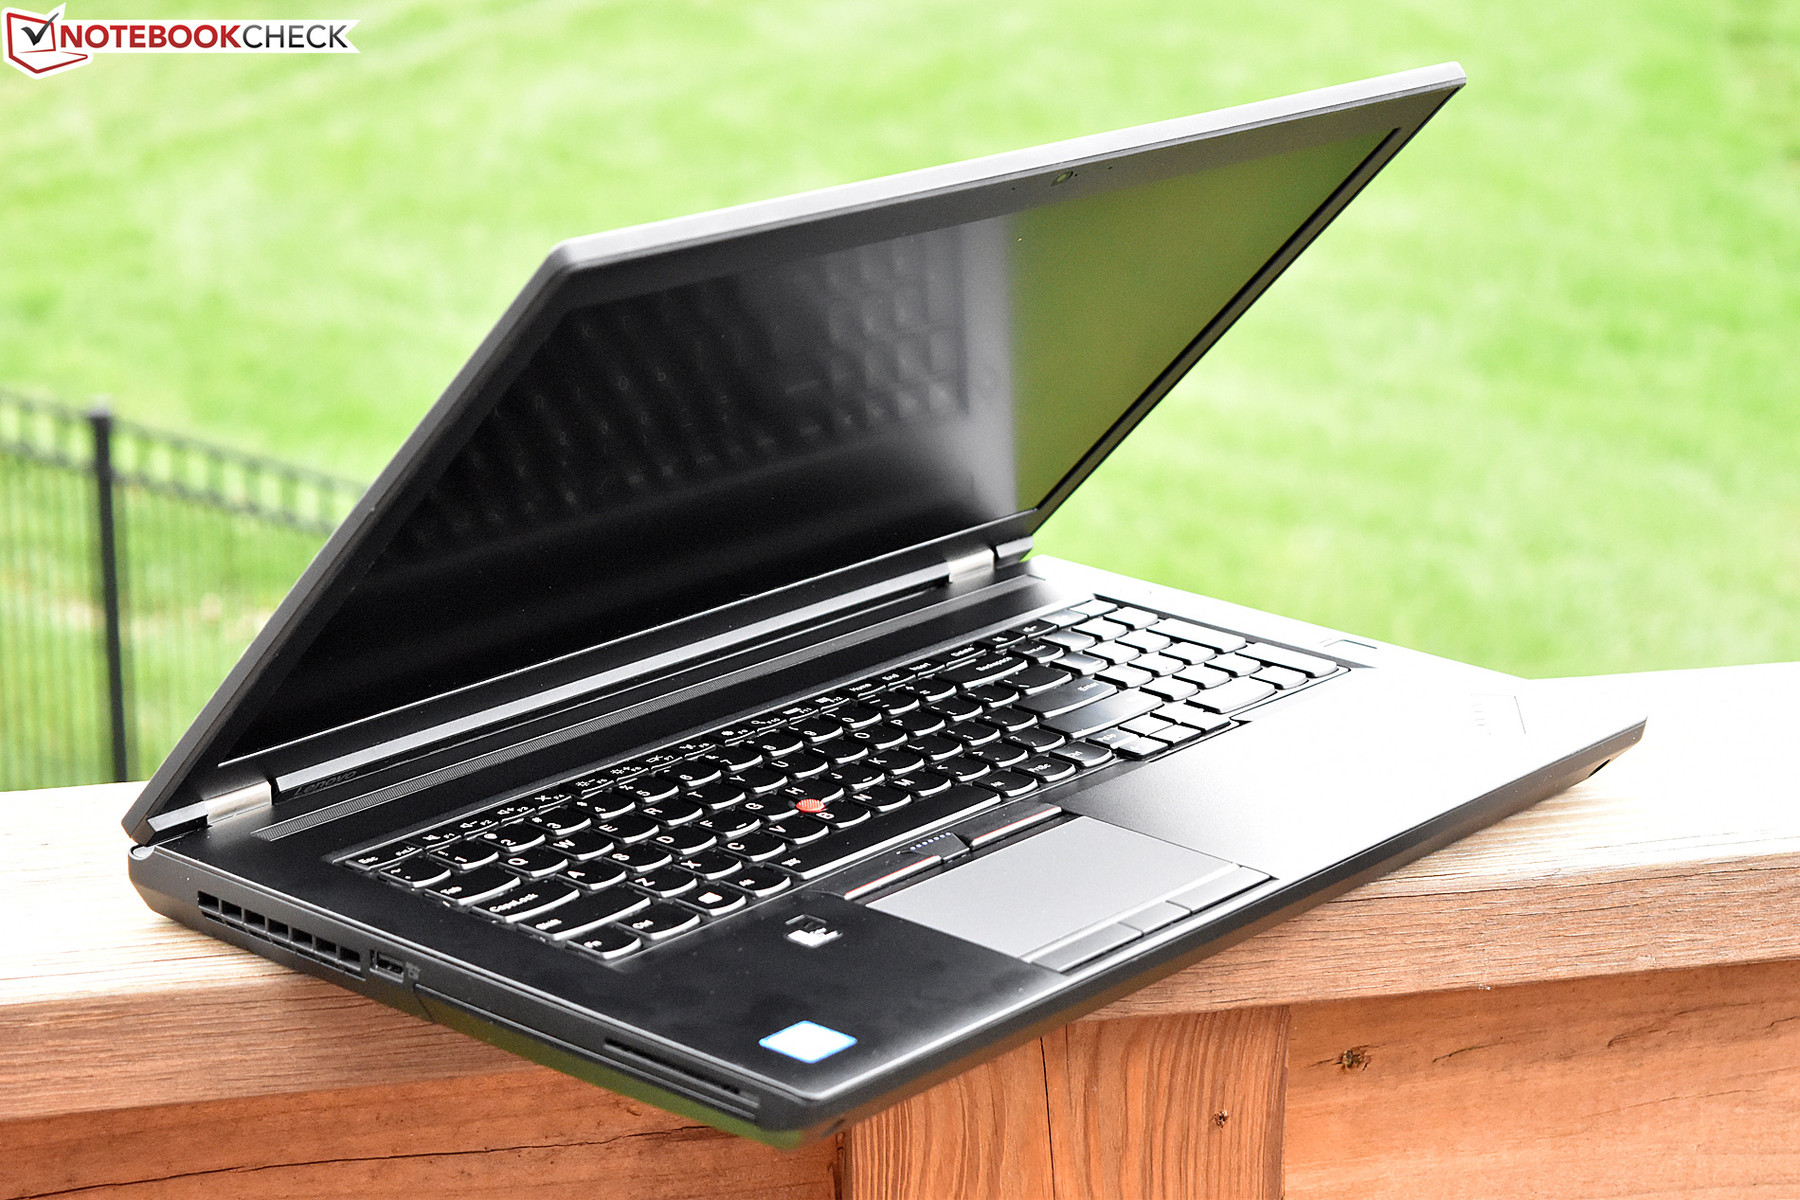
Breve Análise do Workstation Lenovo ThinkPad P70-20ER000XUS
| |||||||||||||||||||||||||
iluminação: 86 %
iluminação com acumulador: 332 cd/m²
Contraste: 836:1 (Preto: 0.397 cd/m²)
ΔE ColorChecker Calman: 3.15 | ∀{0.5-29.43 Ø4.71}
ΔE Greyscale Calman: 3.72 | ∀{0.09-98 Ø4.96}
100% sRGB (Argyll 1.6.3 3D)
74.3% AdobeRGB 1998 (Argyll 1.6.3 3D)
Gamma: 1.86
CCT: 6103 K
| Lenovo ThinkPad P70-20ER000XUS Panasonic VVX17P051J00 / LEN4123, IPS, 17.3", 3840x2160 | HP ZBook 17 G3 TZV66eA SDC3854, IPS, 17.3", 1920x1080 | Dell Precision 7710 SDC8151, VHN17_173HL, IPS LED, 17.3", 1920x1080 | Lenovo ThinkPad P70 LEN4123, IPS, 17.3", 3840x2160 | MSI WT72-6QM LG Philips LP173WF4-SPF1, IPS, 17.3", 1920x1080 | |
|---|---|---|---|---|---|
| Display | |||||
| Display P3 Coverage (%) | 67.3 | 66.6 | 90.8 | 67.3 | |
| sRGB Coverage (%) | 95.9 | 96.9 | 100 | 85.4 | |
| AdobeRGB 1998 Coverage (%) | 69 | 68.6 | 85.4 | 62.5 | |
| Response Times | -26% | -39% | -15% | -9% | |
| Response Time Grey 50% / Grey 80% * (ms) | 34.8 ? | 50.4 ? -45% | 50 ? -44% | 44 ? -26% | 42 ? -21% |
| Response Time Black / White * (ms) | 26.8 ? | 28.4 ? -6% | 36 ? -34% | 27.6 ? -3% | 26 ? 3% |
| PWM Frequency (Hz) | 219.3 ? | 200 ? | 198 ? | 228 ? | 86 ? |
| Screen | 11% | 1% | -6% | -22% | |
| Brightness middle (cd/m²) | 332 | 252 -24% | 332 0% | 365 10% | 303 -9% |
| Brightness (cd/m²) | 317 | 243 -23% | 307 -3% | 341 8% | 298 -6% |
| Brightness Distribution (%) | 86 | 86 0% | 83 -3% | 85 -1% | 94 9% |
| Black Level * (cd/m²) | 0.397 | 0.21 47% | 0.33 17% | 0.4 -1% | 0.46 -16% |
| Contrast (:1) | 836 | 1200 44% | 1006 20% | 913 9% | 659 -21% |
| Colorchecker dE 2000 * | 3.15 | 2.2 30% | 3 5% | 3.8 -21% | 5.77 -83% |
| Colorchecker dE 2000 max. * | 5.55 | 3.8 32% | |||
| Greyscale dE 2000 * | 3.72 | 2.7 27% | 4 -8% | 6.09 -64% | 4.87 -31% |
| Gamma | 1.86 118% | 2.28 96% | 2 110% | 2.3 96% | 1.99 111% |
| CCT | 6103 107% | 6686 97% | 7089 92% | 6332 103% | 7363 88% |
| Color Space (Percent of AdobeRGB 1998) (%) | 74.3 | 62 -17% | 62 -17% | 76.01 2% | 56.04 -25% |
| Color Space (Percent of sRGB) (%) | 100 | 96 -4% | 97 -3% | 99.97 0% | 85.27 -15% |
| Média Total (Programa/Configurações) | -8% /
5% | -19% /
-6% | -11% /
-8% | -16% /
-20% |
* ... menor é melhor
Exibir tempos de resposta
| ↔ Tempo de resposta preto para branco | ||
|---|---|---|
| 26.8 ms ... ascensão ↗ e queda ↘ combinadas | ↗ 4 ms ascensão | 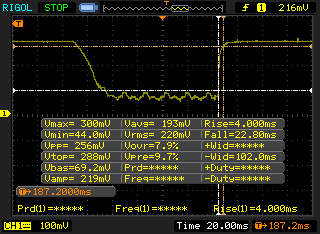 |
| ↘ 22.8 ms queda | ||
| A tela mostra taxas de resposta relativamente lentas em nossos testes e pode ser muito lenta para os jogadores. Em comparação, todos os dispositivos testados variam de 0.1 (mínimo) a 240 (máximo) ms. » 67 % de todos os dispositivos são melhores. Isso significa que o tempo de resposta medido é pior que a média de todos os dispositivos testados (19.8 ms). | ||
| ↔ Tempo de resposta 50% cinza a 80% cinza | ||
| 34.8 ms ... ascensão ↗ e queda ↘ combinadas | ↗ 15.2 ms ascensão | 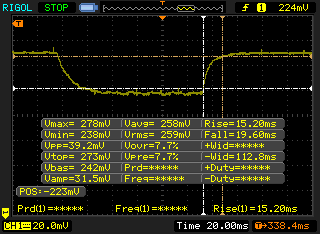 |
| ↘ 19.6 ms queda | ||
| A tela mostra taxas de resposta lentas em nossos testes e será insatisfatória para os jogadores. Em comparação, todos os dispositivos testados variam de 0.165 (mínimo) a 636 (máximo) ms. » 49 % de todos os dispositivos são melhores. Isso significa que o tempo de resposta medido é pior que a média de todos os dispositivos testados (30.9 ms). | ||
Cintilação da tela / PWM (modulação por largura de pulso)
| Tela tremeluzindo/PWM detectado | 219.3 Hz | ≤ 99 % configuração de brilho | 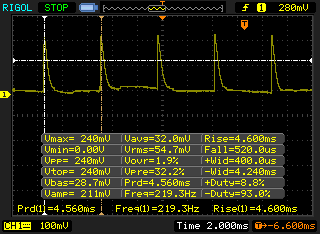 |
A luz de fundo da tela pisca em 219.3 Hz (pior caso, por exemplo, utilizando PWM) Cintilação detectada em uma configuração de brilho de 99 % e abaixo. Não deve haver cintilação ou PWM acima desta configuração de brilho. A frequência de 219.3 Hz é relativamente baixa, portanto, usuários sensíveis provavelmente notarão cintilação e sentirão fadiga ocular na configuração de brilho indicada e abaixo. [pwm_comparison] Em comparação: 52 % de todos os dispositivos testados não usam PWM para escurecer a tela. Se PWM foi detectado, uma média de 7748 (mínimo: 5 - máximo: 343500) Hz foi medida. | |||
| wPrime 2.10 - 1024m | |
| Lenovo ThinkPad P70-20ER000XUS | |
| Lenovo ThinkPad P70 | |
| Dell Precision 7710 | |
| Super Pi Mod 1.5 XS 32M - 32M | |
| Lenovo ThinkPad P70 | |
| Lenovo ThinkPad P70-20ER000XUS | |
| MSI WT72-6QM | |
| Dell Precision 7710 | |
* ... menor é melhor
| PCMark 8 | |
| Home Score Accelerated v2 | |
| Dell Precision 7710 | |
| MSI WT72-6QM | |
| HP ZBook 17 G3 TZV66eA | |
| Lenovo ThinkPad P70-20ER000XUS | |
| Lenovo ThinkPad P70 | |
| Work Score Accelerated v2 | |
| MSI WT72-6QM | |
| Dell Precision 7710 | |
| HP ZBook 17 G3 TZV66eA | |
| Lenovo ThinkPad P70 | |
| Lenovo ThinkPad P70-20ER000XUS | |
| Creative Score Accelerated v2 | |
| Lenovo ThinkPad P70-20ER000XUS | |
| Dell Precision 7710 | |
| HP ZBook 17 G3 TZV66eA | |
| PCMark 8 Home Score Accelerated v2 | 4062 pontos | |
| PCMark 8 Creative Score Accelerated v2 | 6007 pontos | |
| PCMark 8 Work Score Accelerated v2 | 4307 pontos | |
Ajuda | ||
| Lenovo ThinkPad P70-20ER000XUS Quadro M4000M, E3-1505M v5, Samsung SSD SM951a 512GB M.2 PCIe 3.0 x4 NVMe (MZVKV512) | HP ZBook 17 G3 TZV66eA Quadro M3000M, E3-1535M v5, Samsung SM951 MZVPV256HDGL m.2 PCI-e | Dell Precision 7710 FirePro W7170M, E3-1535M v5, Samsung SM951 MZVPV256HDGL m.2 PCI-e | Lenovo ThinkPad P70 Quadro M3000M, 6820HQ, Samsung SSD PM871 MZNLN512HCJH | MSI WT72-6QM Quadro M5000M, E3-1505M v5, Toshiba NVMe THNSN5256GPU7 | |
|---|---|---|---|---|---|
| AS SSD | -11% | -10% | -60% | -19% | |
| Seq Read (MB/s) | 2104 | 1596 -24% | 1886 -10% | 477.8 -77% | 2638 25% |
| Seq Write (MB/s) | 1458 | 703 -52% | 626 -57% | 458.1 -69% | 810 -44% |
| 4K Read (MB/s) | 48.38 | 51.1 6% | 51 5% | 22.61 -53% | 37.5 -22% |
| 4K Write (MB/s) | 131.9 | 148.2 12% | 179 36% | 82.7 -37% | 96.4 -27% |
| 4K-64 Read (MB/s) | 1082 | 1037 -4% | 1064 -2% | 341.7 -68% | 935 -14% |
| 4K-64 Write (MB/s) | 349.3 | 230.4 -34% | 275 -21% | 255.5 -27% | 473.5 36% |
| Access Time Read * (ms) | 0.047 | 0.041 13% | 0.069 -47% | 0.069 -47% | 0.092 -96% |
| Access Time Write * (ms) | 0.026 | 0.025 4% | 0.022 15% | 0.056 -115% | 0.04 -54% |
| Score Read (Points) | 1341 | 1248 -7% | 1304 -3% | 412 -69% | 1237 -8% |
| Score Write (Points) | 627 | 449 -28% | 517 -18% | 384 -39% | 651 4% |
| Score Total (Points) | 2630 | 2302 -12% | 2435 -7% | 1012 -62% | 2433 -7% |
* ... menor é melhor

| 3DMark 11 | |
| 1280x720 Performance GPU | |
| MSI WT72-6QM | |
| Lenovo ThinkPad P70-20ER000XUS | |
| Dell Precision 7710 | |
| HP ZBook 17 G3 TZV66eA | |
| Lenovo ThinkPad P70 | |
| 1280x720 Performance Combined | |
| MSI WT72-6QM | |
| HP ZBook 17 G3 TZV66eA | |
| Lenovo ThinkPad P70 | |
| Dell Precision 7710 | |
| Lenovo ThinkPad P70-20ER000XUS | |
| 3DMark | |
| 1280x720 Cloud Gate Standard Graphics | |
| MSI WT72-6QM | |
| HP ZBook 17 G3 TZV66eA | |
| Lenovo ThinkPad P70-20ER000XUS | |
| Dell Precision 7710 | |
| Lenovo ThinkPad P70 | |
| 1920x1080 Fire Strike Graphics | |
| MSI WT72-6QM | |
| Lenovo ThinkPad P70-20ER000XUS | |
| Dell Precision 7710 | |
| HP ZBook 17 G3 TZV66eA | |
| Lenovo ThinkPad P70 | |
| 1920x1080 Ice Storm Extreme Graphics | |
| MSI WT72-6QM | |
| Lenovo ThinkPad P70-20ER000XUS | |
| 3DMark 11 Performance | 9549 pontos | |
| 3DMark Ice Storm Standard Score | 121354 pontos | |
| 3DMark Cloud Gate Standard Score | 21920 pontos | |
| 3DMark Fire Strike Score | 6937 pontos | |
| 3DMark Fire Strike Extreme Score | 3694 pontos | |
Ajuda | ||
| BioShock Infinite | |
| 1366x768 Medium Preset (classificar por valor) | |
| Lenovo ThinkPad P70-20ER000XUS | |
| HP ZBook 17 G3 TZV66eA | |
| Dell Precision 7710 | |
| Lenovo ThinkPad P70 | |
| 1366x768 High Preset (classificar por valor) | |
| Lenovo ThinkPad P70-20ER000XUS | |
| HP ZBook 17 G3 TZV66eA | |
| Dell Precision 7710 | |
| Lenovo ThinkPad P70 | |
| 1920x1080 Ultra Preset, DX11 (DDOF) (classificar por valor) | |
| Lenovo ThinkPad P70-20ER000XUS | |
| HP ZBook 17 G3 TZV66eA | |
| Dell Precision 7710 | |
| Lenovo ThinkPad P70 | |
| Rise of the Tomb Raider | |
| 1366x768 Medium Preset AF:2x (classificar por valor) | |
| Lenovo ThinkPad P70-20ER000XUS | |
| HP ZBook 17 G3 TZV66eA | |
| 1920x1080 High Preset AA:FX AF:4x (classificar por valor) | |
| Lenovo ThinkPad P70-20ER000XUS | |
| HP ZBook 17 G3 TZV66eA | |
| 1920x1080 Very High Preset AA:FX AF:16x (classificar por valor) | |
| Lenovo ThinkPad P70-20ER000XUS | |
| HP ZBook 17 G3 TZV66eA | |
| 3840x2160 High Preset AA:FX AF:4x (classificar por valor) | |
| Lenovo ThinkPad P70-20ER000XUS | |
| baixo | média | alto | ultra | 4K | |
|---|---|---|---|---|---|
| BioShock Infinite (2013) | 196 | 181 | 85 | ||
| Rise of the Tomb Raider (2016) | 90 | 55 | 48 | 20 |
Barulho
| Ocioso |
| 28.8 / 28.8 / 28.8 dB |
| Carga |
| 40.5 / 45.7 dB |
 | ||
30 dB silencioso 40 dB(A) audível 50 dB(A) ruidosamente alto |
||
min: | ||
| Lenovo ThinkPad P70-20ER000XUS Quadro M4000M, E3-1505M v5, Samsung SSD SM951a 512GB M.2 PCIe 3.0 x4 NVMe (MZVKV512) | HP ZBook 17 G3 TZV66eA Quadro M3000M, E3-1535M v5, Samsung SM951 MZVPV256HDGL m.2 PCI-e | Dell Precision 7710 FirePro W7170M, E3-1535M v5, Samsung SM951 MZVPV256HDGL m.2 PCI-e | Lenovo ThinkPad P70 Quadro M3000M, 6820HQ, Samsung SSD PM871 MZNLN512HCJH | MSI WT72-6QM Quadro M5000M, E3-1505M v5, Toshiba NVMe THNSN5256GPU7 | |
|---|---|---|---|---|---|
| Noise | -7% | -4% | 1% | -6% | |
| desligado / ambiente * (dB) | 28.8 | 30 -4% | 30 -4% | 30 -4% | |
| Idle Minimum * (dB) | 28.8 | 30 -4% | 30 -4% | 30 -4% | 33.3 -16% |
| Idle Average * (dB) | 28.8 | 30 -4% | 30 -4% | 30 -4% | 33.4 -16% |
| Idle Maximum * (dB) | 28.8 | 30 -4% | 30 -4% | 30 -4% | 33.5 -16% |
| Load Average * (dB) | 40.5 | 48.9 -21% | 43.2 -7% | 36.5 10% | 38.8 4% |
| Load Maximum * (dB) | 45.7 | 48.9 -7% | 47.13 -3% | 40.8 11% | 40.2 12% |
* ... menor é melhor
(-) A temperatura máxima no lado superior é 52 °C / 126 F, em comparação com a média de 38.2 °C / 101 F , variando de 22.2 a 69.8 °C para a classe Workstation.
(-) A parte inferior aquece até um máximo de 51 °C / 124 F, em comparação com a média de 41.1 °C / 106 F
(±) Em uso inativo, a temperatura média para o lado superior é 33.9 °C / 93 F, em comparação com a média do dispositivo de 32 °C / ### class_avg_f### F.
(+) Os apoios para as mãos e o touchpad estão atingindo a temperatura máxima da pele (35.6 °C / 96.1 F) e, portanto, não estão quentes.
(-) A temperatura média da área do apoio para as mãos de dispositivos semelhantes foi 27.8 °C / 82 F (-7.8 °C / -14.1 F).
Lenovo ThinkPad P70-20ER000XUS análise de áudio
(±) | o volume do alto-falante é médio, mas bom (###valor### dB)
Graves 100 - 315Hz
(±) | graves reduzidos - em média 12.9% menor que a mediana
(±) | a linearidade dos graves é média (14.5% delta para a frequência anterior)
Médios 400 - 2.000 Hz
(±) | médios mais altos - em média 5.1% maior que a mediana
(+) | médios são lineares (6.1% delta para frequência anterior)
Altos 2 - 16 kHz
(+) | agudos equilibrados - apenas 4.6% longe da mediana
(±) | a linearidade dos máximos é média (14.5% delta para frequência anterior)
Geral 100 - 16.000 Hz
(±) | a linearidade do som geral é média (28.1% diferença em relação à mediana)
Comparado com a mesma classe
» 94% de todos os dispositivos testados nesta classe foram melhores, 2% semelhantes, 4% piores
» O melhor teve um delta de 7%, a média foi 17%, o pior foi 35%
Comparado com todos os dispositivos testados
» 85% de todos os dispositivos testados foram melhores, 3% semelhantes, 12% piores
» O melhor teve um delta de 4%, a média foi 23%, o pior foi 134%
Apple MacBook 12 (Early 2016) 1.1 GHz análise de áudio
(+) | os alto-falantes podem tocar relativamente alto (###valor### dB)
Graves 100 - 315Hz
(±) | graves reduzidos - em média 11.3% menor que a mediana
(±) | a linearidade dos graves é média (14.2% delta para a frequência anterior)
Médios 400 - 2.000 Hz
(+) | médios equilibrados - apenas 2.4% longe da mediana
(+) | médios são lineares (5.5% delta para frequência anterior)
Altos 2 - 16 kHz
(+) | agudos equilibrados - apenas 2% longe da mediana
(+) | os máximos são lineares (4.5% delta da frequência anterior)
Geral 100 - 16.000 Hz
(+) | o som geral é linear (10.2% diferença em relação à mediana)
Comparado com a mesma classe
» 7% de todos os dispositivos testados nesta classe foram melhores, 2% semelhantes, 90% piores
» O melhor teve um delta de 5%, a média foi 18%, o pior foi 53%
Comparado com todos os dispositivos testados
» 5% de todos os dispositivos testados foram melhores, 1% semelhantes, 94% piores
» O melhor teve um delta de 4%, a média foi 23%, o pior foi 134%
| desligado | |
| Ocioso | |
| Carga |
|
Key:
min: | |
| Lenovo ThinkPad P70-20ER000XUS E3-1505M v5, Quadro M4000M, Samsung SSD SM951a 512GB M.2 PCIe 3.0 x4 NVMe (MZVKV512), IPS, 3840x2160, 17.3" | HP ZBook 17 G3 TZV66eA E3-1535M v5, Quadro M3000M, Samsung SM951 MZVPV256HDGL m.2 PCI-e, IPS, 1920x1080, 17.3" | Dell Precision 7710 E3-1535M v5, FirePro W7170M, Samsung SM951 MZVPV256HDGL m.2 PCI-e, IPS LED, 1920x1080, 17.3" | Lenovo ThinkPad P70 6820HQ, Quadro M3000M, Samsung SSD PM871 MZNLN512HCJH, IPS, 3840x2160, 17.3" | MSI WT72-6QM E3-1505M v5, Quadro M5000M, Toshiba NVMe THNSN5256GPU7, IPS, 1920x1080, 17.3" | |
|---|---|---|---|---|---|
| Power Consumption | 39% | 19% | 32% | 0% | |
| Idle Minimum * (Watt) | 22.8 | 6.7 71% | 6.04 74% | 12.1 47% | 24.8 -9% |
| Idle Average * (Watt) | 29.7 | 12.5 58% | 15.2 49% | 19.7 34% | 29.7 -0% |
| Idle Maximum * (Watt) | 31.1 | 13.2 58% | 42.3 -36% | 20.5 34% | 30.1 3% |
| Load Average * (Watt) | 124.2 | 128.2 -3% | 112.8 9% | 94.3 24% | 105.2 15% |
| Load Maximum * (Watt) | 177.4 | 158.9 10% | 182.2 -3% | 139.6 21% | 192.2 -8% |
* ... menor é melhor
| Lenovo ThinkPad P70-20ER000XUS E3-1505M v5, Quadro M4000M, 96 Wh | HP ZBook 17 G3 TZV66eA E3-1535M v5, Quadro M3000M, 96 Wh | Dell Precision 7710 E3-1535M v5, FirePro W7170M, 72 Wh | Lenovo ThinkPad P70 6820HQ, Quadro M3000M, 96 Wh | MSI WT72-6QM E3-1505M v5, Quadro M5000M, Wh | |
|---|---|---|---|---|---|
| Duração da bateria | 125% | 103% | 56% | 38% | |
| Reader / Idle (h) | 4.9 | 15.9 224% | 12.9 163% | 7.7 57% | 6.9 41% |
| WiFi v1.3 (h) | 3.2 | 4.8 50% | 6.1 91% | 6 88% | 4.1 28% |
| Load (h) | 0.9 | 1.8 100% | 1.4 56% | 1.1 22% | 1.3 44% |
Pro
Contra
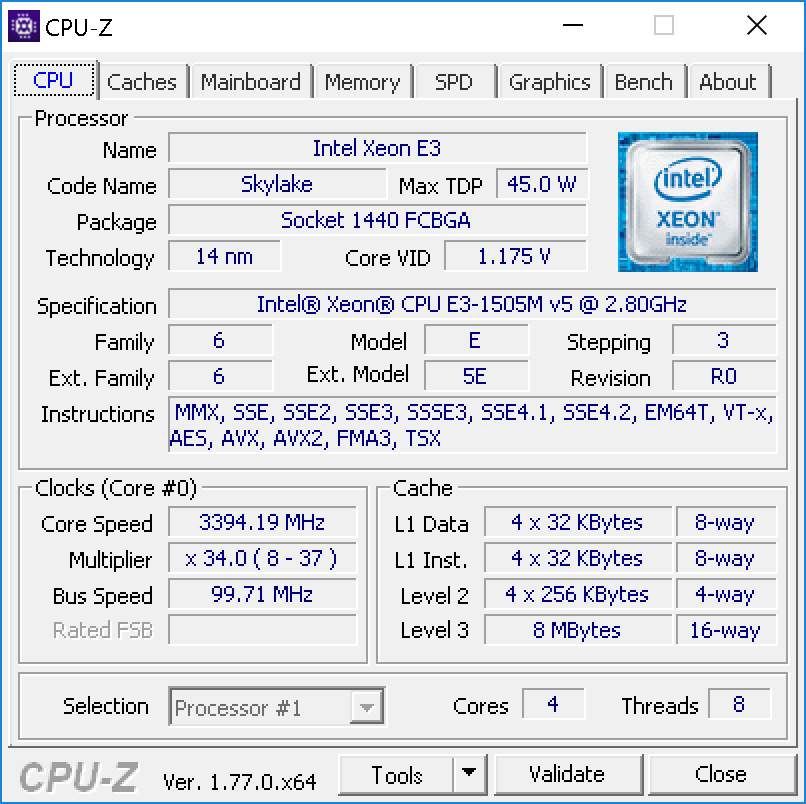
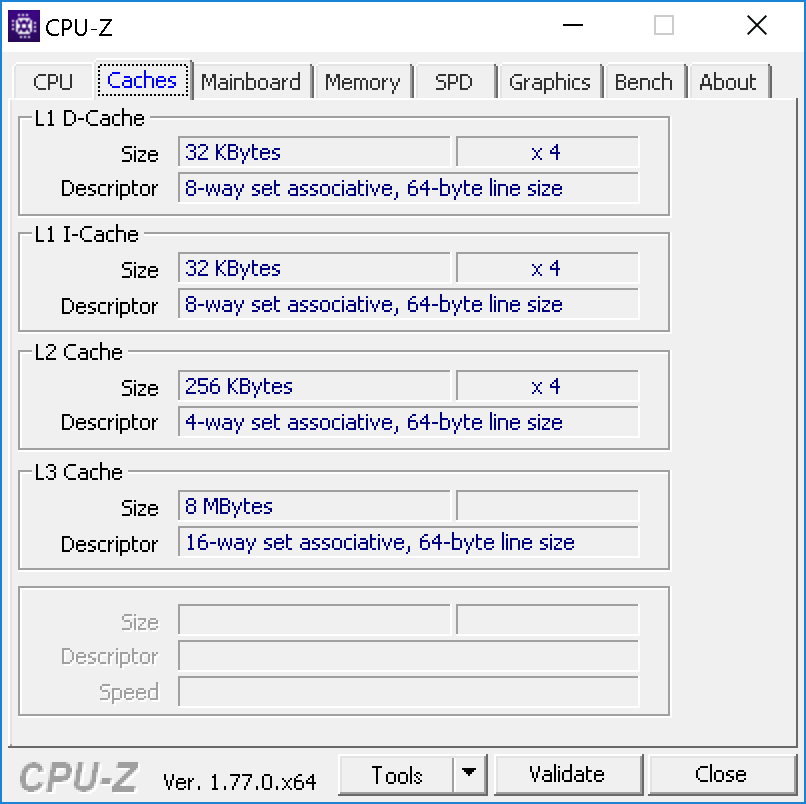
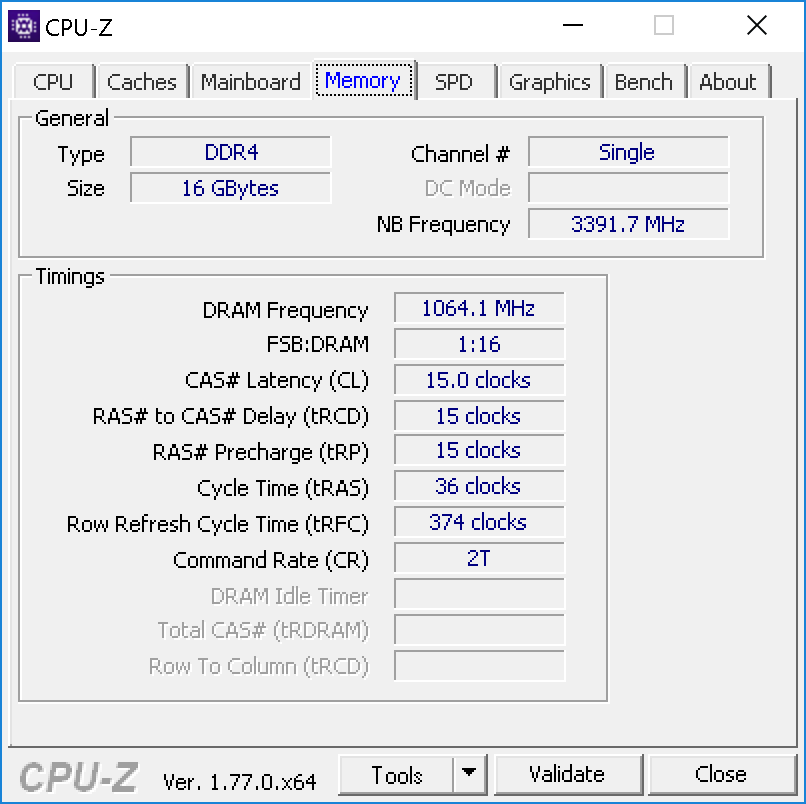
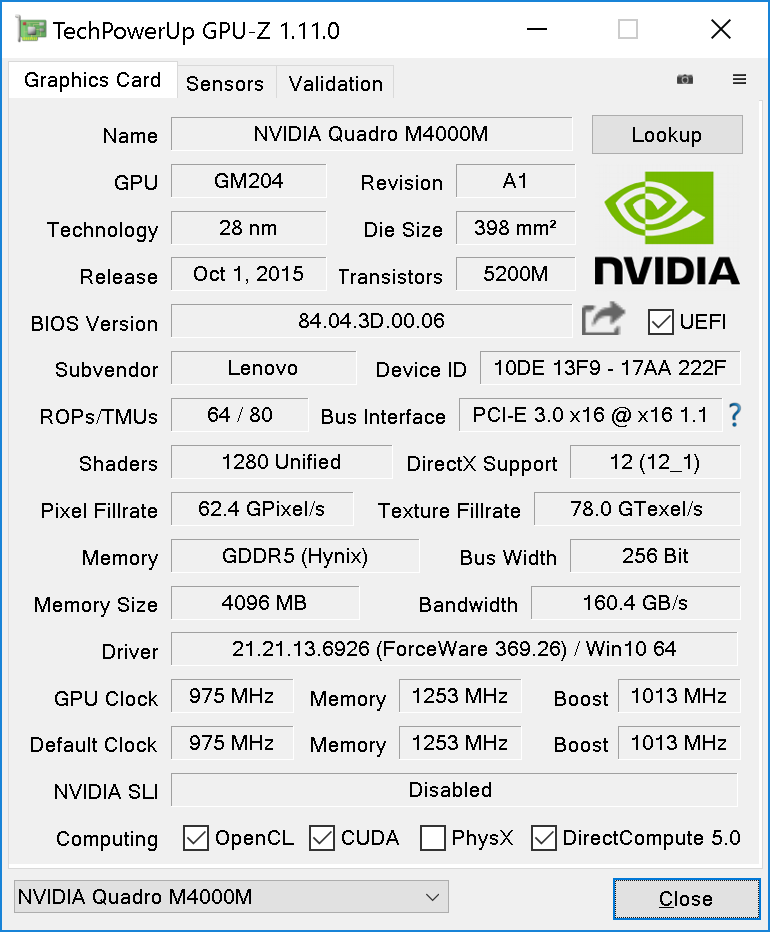
Muitas variáveis se combinam para criar um workstation móvel forte, mas resumindo, os aspectos mais críticos geralmente são a estabilidade, desempenho da CPU/GPU, e velocidade de armazenamento. O Lenovo P70-20ER000XUS se revela como mais que capaz em todas essas categorias, justificando o seu alto preço de $3.849 com seus fortes números de benchmark e operação confiável. Em comparação com a anterior configuração P70 que analisamos há vários meses, esta oferece um desempenho muito melhorado do armazenamento com um novo SSD NVMe, uma GPU NVIDIA Quadro M4000M mais poderosa (e voraz), e uma mudança para a Xeon CPU que prepara o caminho para a RAM ECC para uma maior estabilidade (16 GB dos quais estão pré-instalados).
Será que vale a penas quando comprado com a concorrência? A resposta curta é sim — desde que os benefícios singulares que traz (e as várias desvantagens) se alinhem com as necessidades específicas do comprador. Workstations, embora sejam elogiados como aparelho livres de compromissos, certamente não são isso: em vez disso, são aparelhos que se recusam a comprometer desempenho — mas sempre existem intercâmbios. Se o M4000M será que faz o trabalho, a RAM ECC e uma característica desejável, e se a duração da bateria não for uma preocupação primordial, o P70 é um excelente candidato e tem um preço coerente.
Lenovo ThinkPad P70-20ER000XUS
- 10/17/2016 v5.1 (old)
Steve Schardein
Price comparison
