Breve análise do Portátil MSI GT62VR 7RE Dominator Pro
| SD Card Reader | |
| average JPG Copy Test (av. of 3 runs) | |
| MSI GT62VR 7RE-223 | |
| MSI GT62VR-6RE16H21 | |
| Acer Predator 15 G9-593-765Q | |
| Schenker XMG P507 PRO | |
| maximum AS SSD Seq Read Test (1GB) | |
| MSI GT62VR 7RE-223 | |
| MSI GT62VR-6RE16H21 | |
| Acer Predator 15 G9-593-765Q | |
| Schenker XMG P507 PRO | |
| Networking | |
| iperf3 transmit AX12 | |
| Acer Predator 15 G9-593-765Q | |
| MSI GT62VR 7RE-223 | |
| Alienware 15 R3 | |
| Schenker XMG P507 PRO | |
| iperf3 receive AX12 | |
| Alienware 15 R3 | |
| Schenker XMG P507 PRO | |
| Acer Predator 15 G9-593-765Q | |
| MSI GT62VR 7RE-223 | |
| |||||||||||||||||||||||||
iluminação: 85 %
iluminação com acumulador: 310 cd/m²
Contraste: 1033:1 (Preto: 0.3 cd/m²)
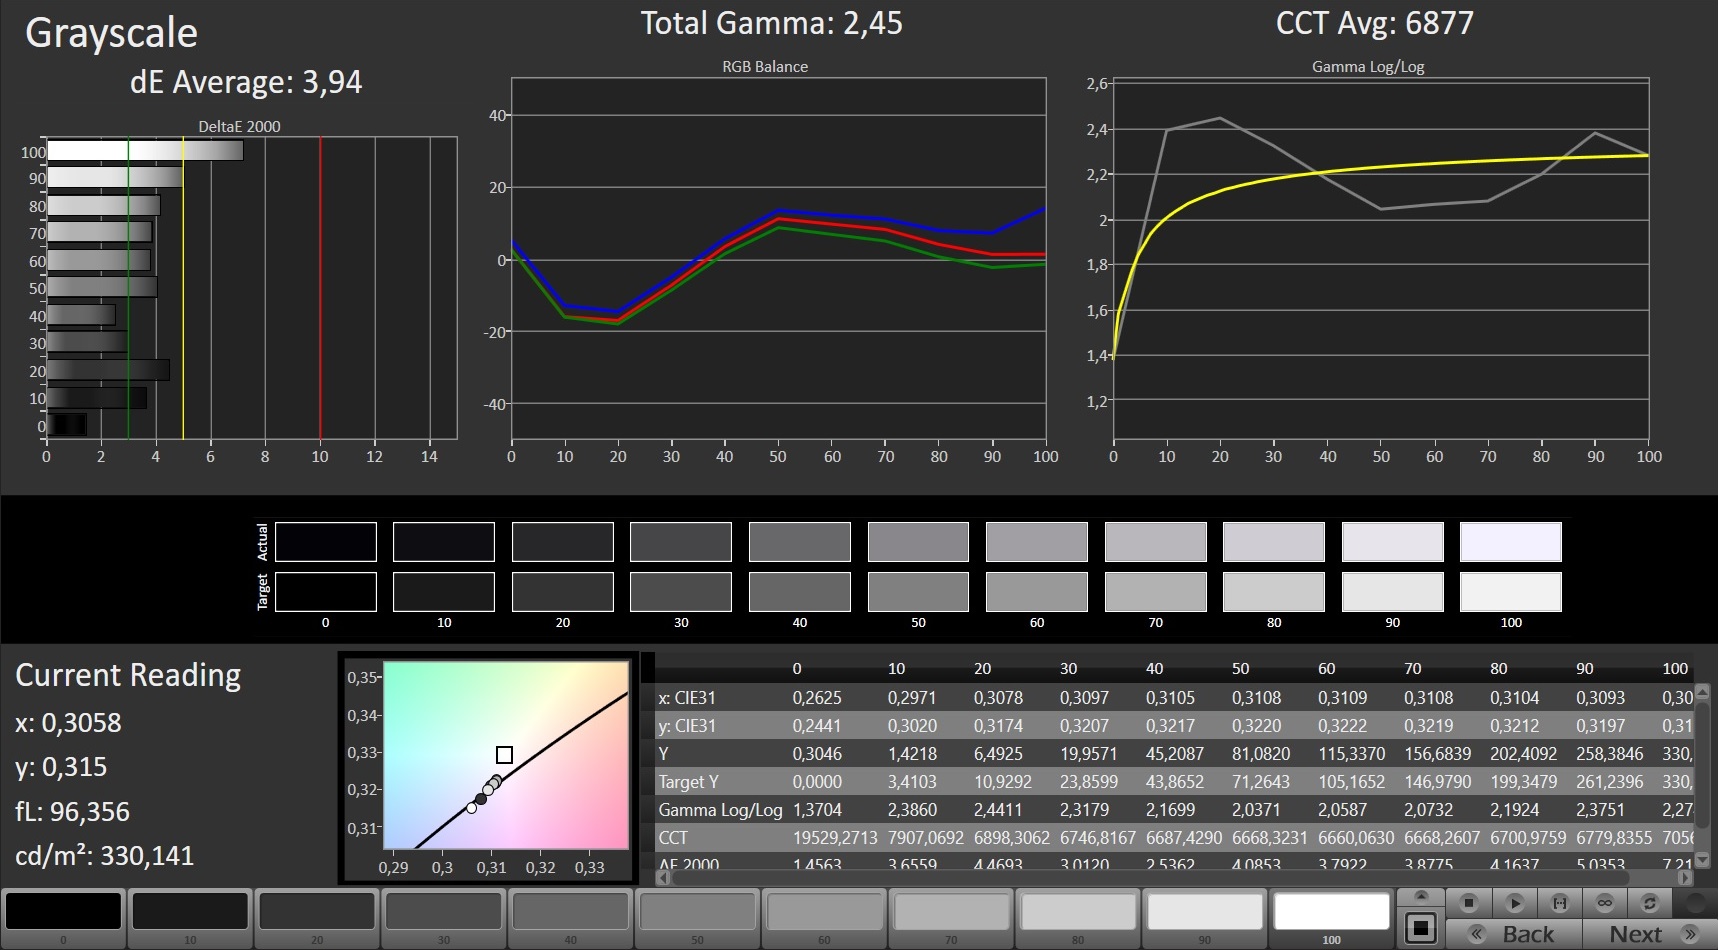
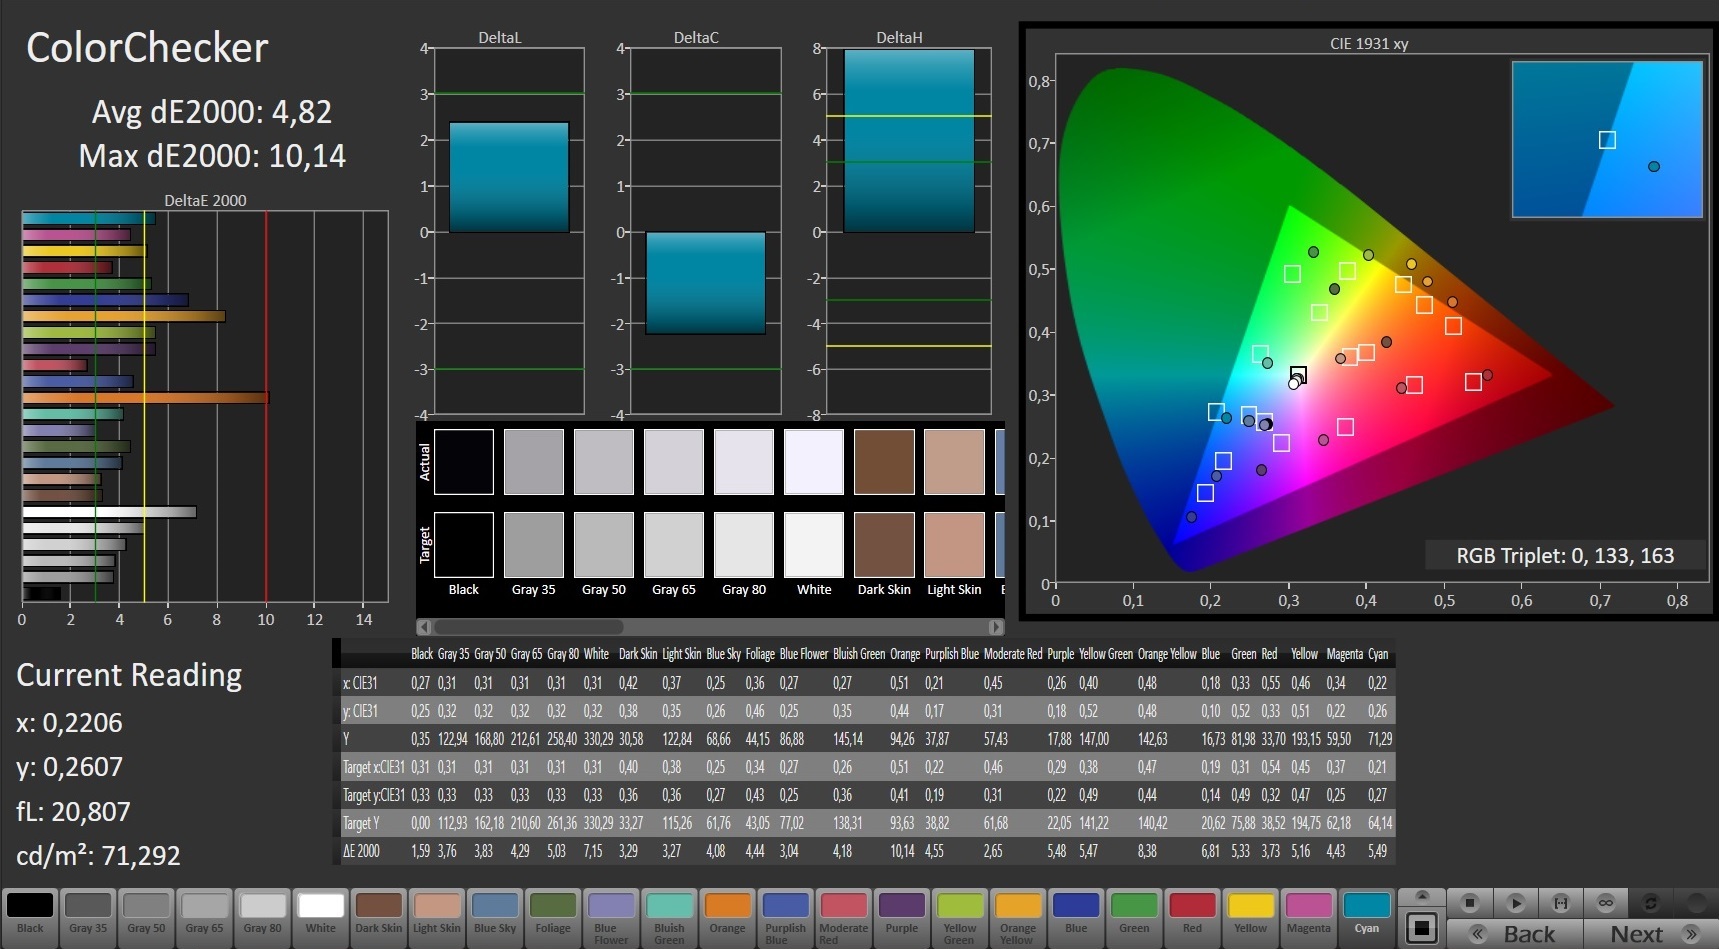
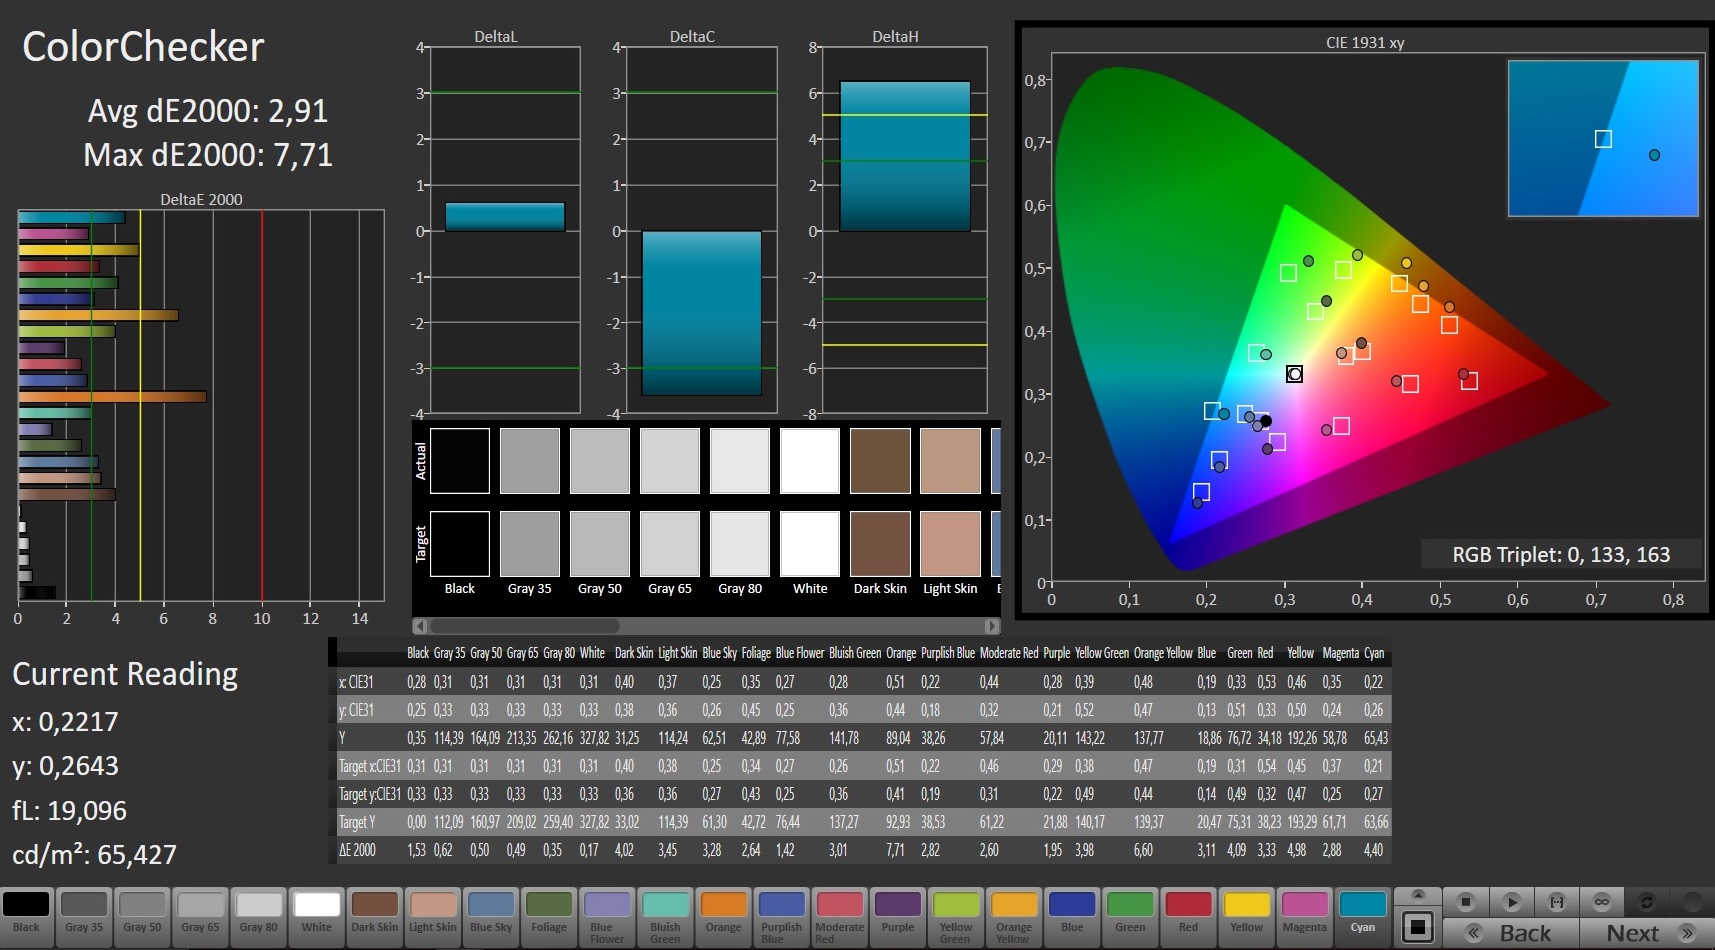
ΔE ColorChecker Calman: 4.82 | ∀{0.5-29.43 Ø4.71}
ΔE Greyscale Calman: 3.94 | ∀{0.09-98 Ø4.96}
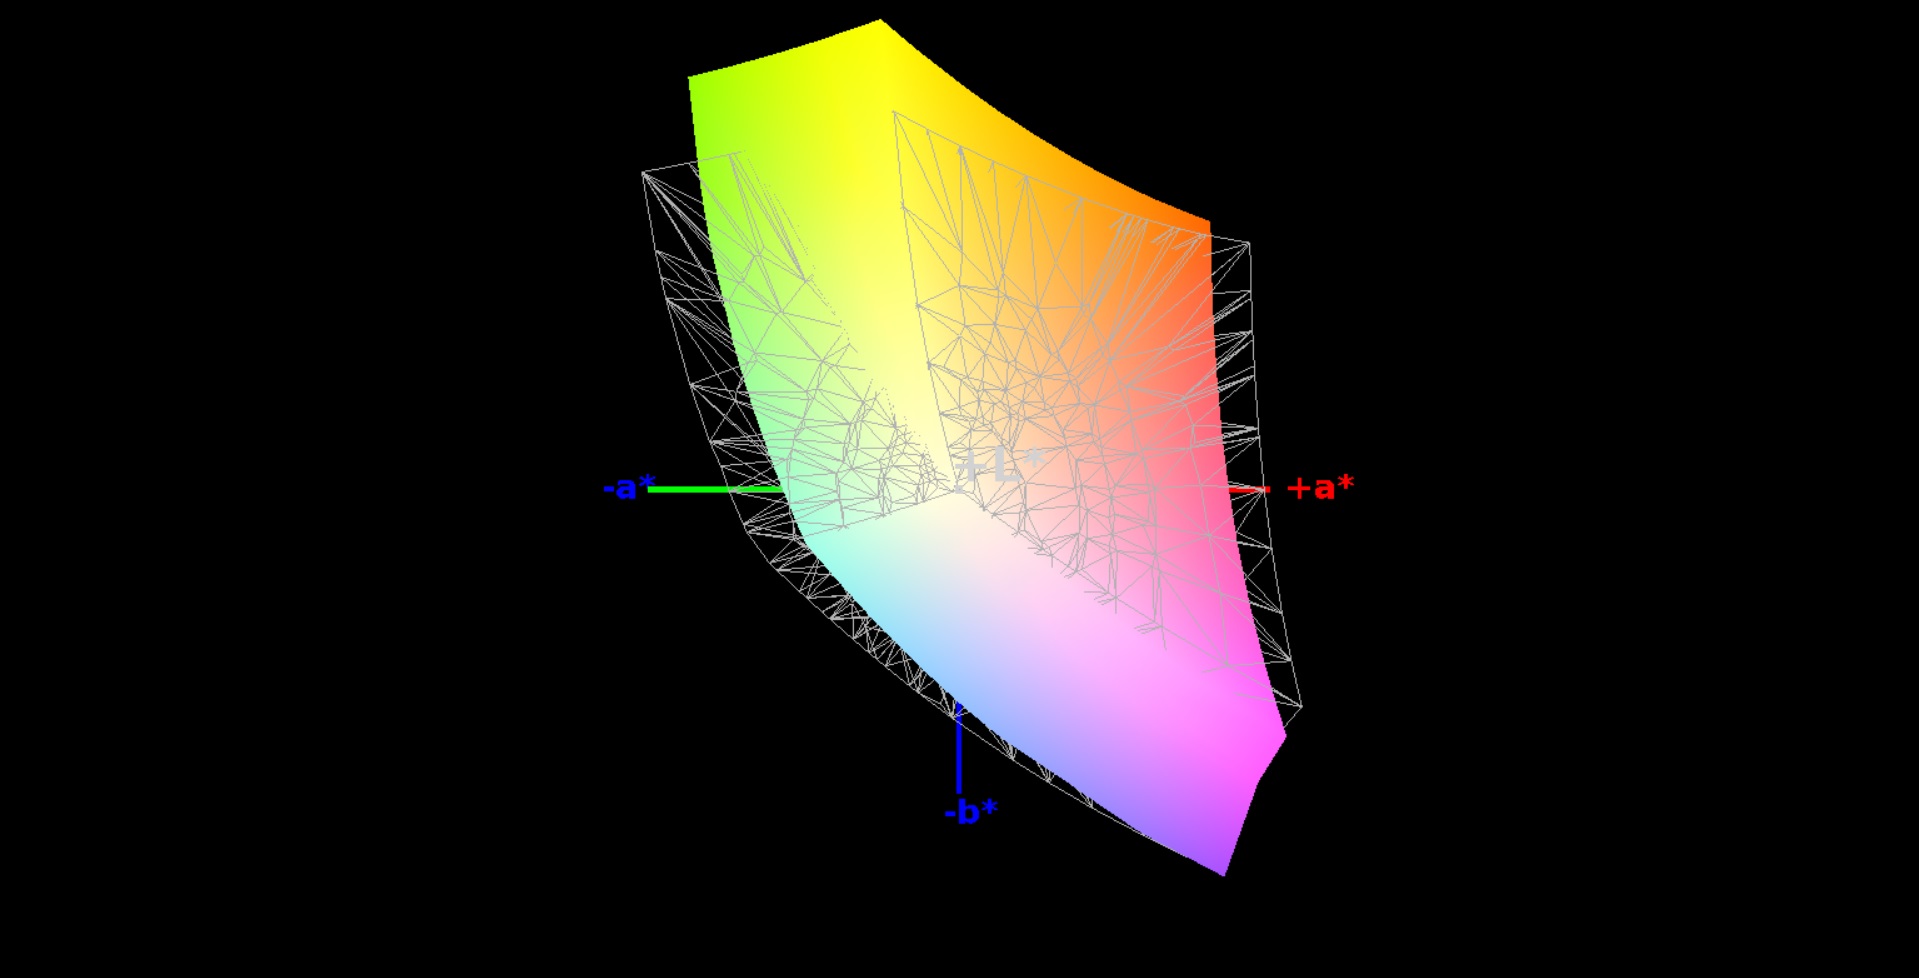
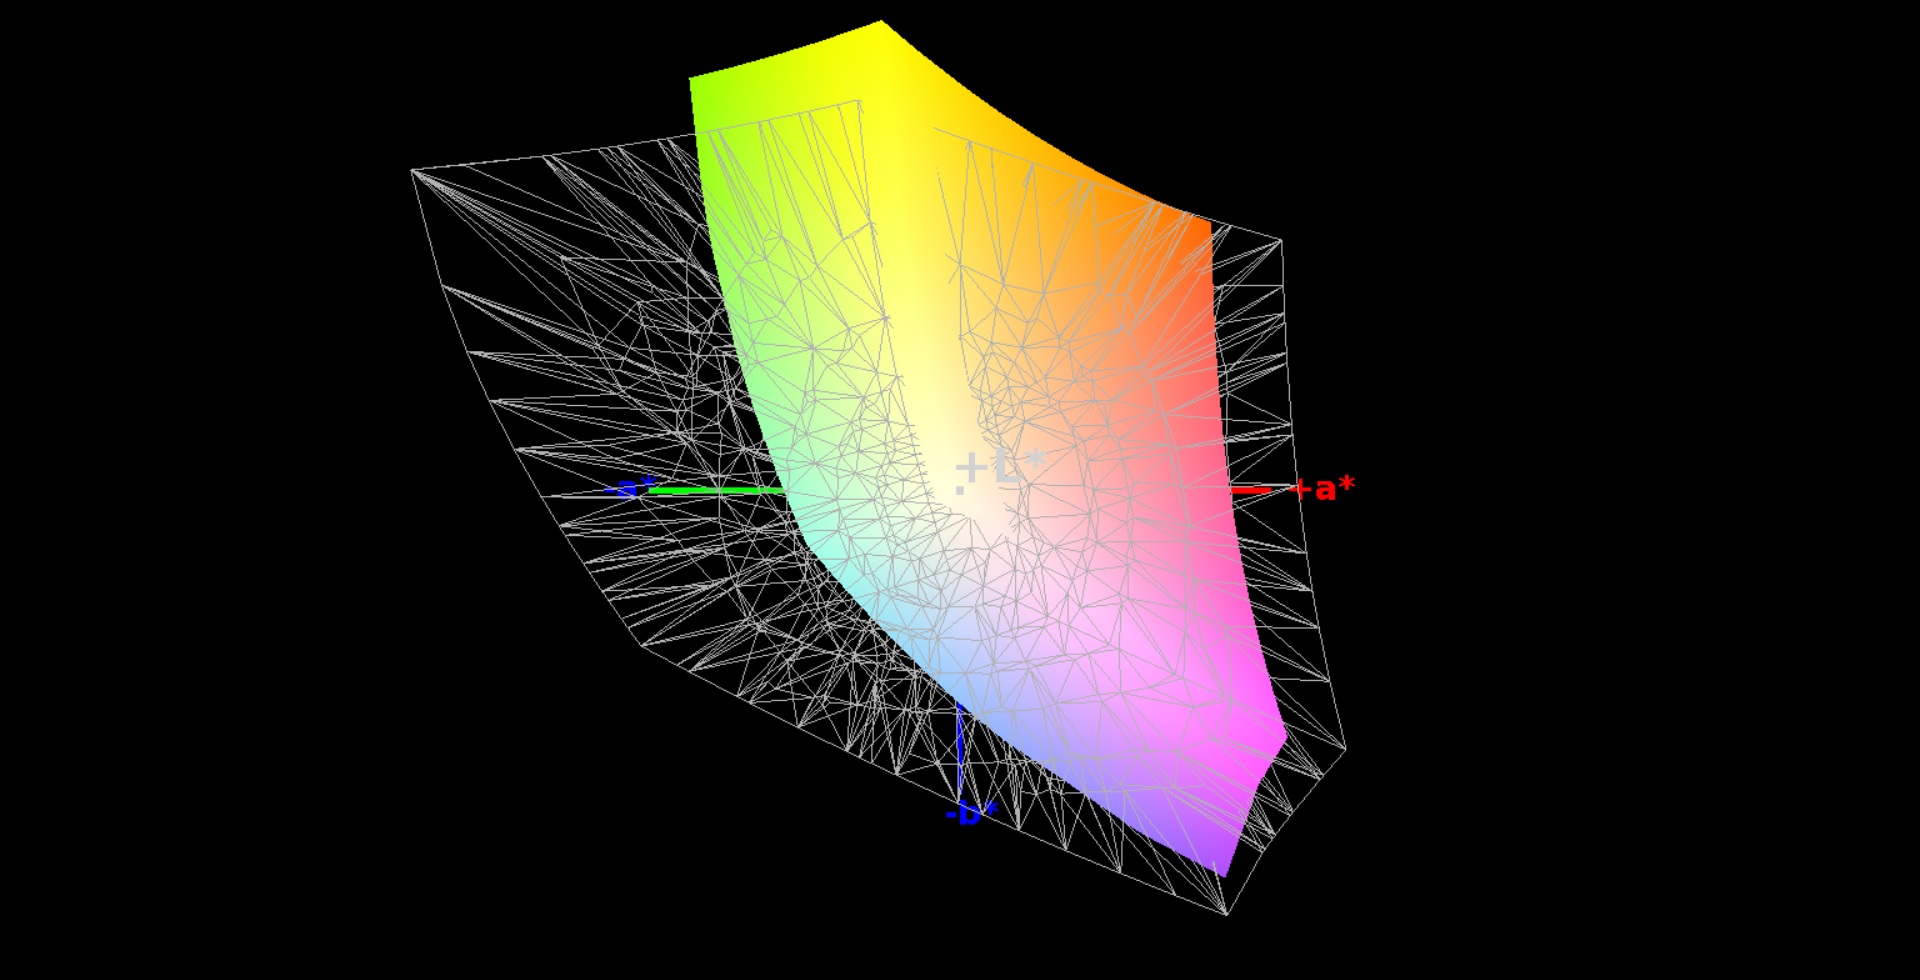
83% sRGB (Argyll 1.6.3 3D)
54% AdobeRGB 1998 (Argyll 1.6.3 3D)
60.8% AdobeRGB 1998 (Argyll 3D)
83.1% sRGB (Argyll 3D)
63.9% Display P3 (Argyll 3D)
Gamma: 2.45
CCT: 6877 K
| MSI GT62VR 7RE-223 LG Philips LP156WF6 (LGD046F), 1920x1080 | MSI GT62VR-6RE16H21 LG Philips LP156WF6 (LGD046F), 1920x1080 | Alienware 15 R3 HPJGK_B156HTN (AUO51ED), 1920x1080 | Schenker XMG P507 PRO AUO B156HTN05.2 (AUO52ED), 1920x1080 | Acer Predator 15 G9-593-765Q LG Philips LP156WF6-SPP1 (LGD04D5), 1920x1080 | |
|---|---|---|---|---|---|
| Display | 2% | 7% | 6% | 1% | |
| Display P3 Coverage (%) | 63.9 | 64.6 1% | 66 3% | 66.4 4% | 63.6 0% |
| sRGB Coverage (%) | 83.1 | 84.6 2% | 90.5 9% | 88.9 7% | 83.9 1% |
| AdobeRGB 1998 Coverage (%) | 60.8 | 61.8 2% | 66.2 9% | 65.1 7% | 61.3 1% |
| Response Times | 10% | 42% | 44% | 3% | |
| Response Time Grey 50% / Grey 80% * (ms) | 37 ? | 34 ? 8% | 25 ? 32% | 24 ? 35% | 35 ? 5% |
| Response Time Black / White * (ms) | 25 ? | 22 ? 12% | 12 ? 52% | 12 ? 52% | 25 ? -0% |
| PWM Frequency (Hz) | |||||
| Screen | 7% | -31% | -37% | 4% | |
| Brightness middle (cd/m²) | 310 | 273 -12% | 386 25% | 357 15% | 273 -12% |
| Brightness (cd/m²) | 311 | 278 -11% | 382 23% | 365 17% | 267 -14% |
| Brightness Distribution (%) | 85 | 88 4% | 93 9% | 85 0% | 83 -2% |
| Black Level * (cd/m²) | 0.3 | 0.27 10% | 0.39 -30% | 0.5 -67% | 0.27 10% |
| Contrast (:1) | 1033 | 1011 -2% | 990 -4% | 714 -31% | 1011 -2% |
| Colorchecker dE 2000 * | 4.82 | 3.67 24% | 10.2 -112% | 9.93 -106% | 3.77 22% |
| Colorchecker dE 2000 max. * | 10.14 | 8.33 18% | 15.81 -56% | 14.87 -47% | 10.64 -5% |
| Greyscale dE 2000 * | 3.94 | 2.73 31% | 11.28 -186% | 10.32 -162% | 2.48 37% |
| Gamma | 2.45 90% | 2.49 88% | 2.23 99% | 2.11 104% | 2.37 93% |
| CCT | 6877 95% | 7029 92% | 11383 57% | 10096 64% | 6854 95% |
| Color Space (Percent of AdobeRGB 1998) (%) | 54 | 55 2% | 59 9% | 58 7% | 55 2% |
| Color Space (Percent of sRGB) (%) | 83 | 84 1% | 90 8% | 89 7% | 84 1% |
| Média Total (Programa/Configurações) | 6% /
6% | 6% /
-14% | 4% /
-17% | 3% /
3% |
* ... menor é melhor
Exibir tempos de resposta
| ↔ Tempo de resposta preto para branco | ||
|---|---|---|
| 25 ms ... ascensão ↗ e queda ↘ combinadas | ↗ 4 ms ascensão | 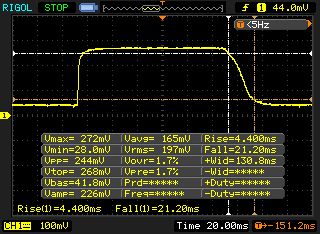 |
| ↘ 21 ms queda | ||
| A tela mostra taxas de resposta relativamente lentas em nossos testes e pode ser muito lenta para os jogadores. Em comparação, todos os dispositivos testados variam de 0.1 (mínimo) a 240 (máximo) ms. » 59 % de todos os dispositivos são melhores. Isso significa que o tempo de resposta medido é pior que a média de todos os dispositivos testados (19.8 ms). | ||
| ↔ Tempo de resposta 50% cinza a 80% cinza | ||
| 37 ms ... ascensão ↗ e queda ↘ combinadas | ↗ 16 ms ascensão | 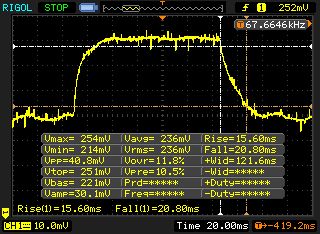 |
| ↘ 21 ms queda | ||
| A tela mostra taxas de resposta lentas em nossos testes e será insatisfatória para os jogadores. Em comparação, todos os dispositivos testados variam de 0.165 (mínimo) a 636 (máximo) ms. » 53 % de todos os dispositivos são melhores. Isso significa que o tempo de resposta medido é pior que a média de todos os dispositivos testados (31 ms). | ||
Cintilação da tela / PWM (modulação por largura de pulso)
| Tela tremeluzindo / PWM não detectado | 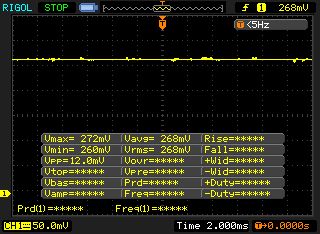 | ||
[pwm_comparison] Em comparação: 52 % de todos os dispositivos testados não usam PWM para escurecer a tela. Se PWM foi detectado, uma média de 7754 (mínimo: 5 - máximo: 343500) Hz foi medida. | |||
| Cinebench R10 | |
| Rendering Multiple CPUs 32Bit | |
| MSI GT62VR 7RE-223 | |
| Rendering Single 32Bit | |
| MSI GT62VR 7RE-223 | |
| Geekbench 4.0 | |
| 64 Bit Single-Core Score | |
| MSI GT62VR 7RE-223 | |
| 64 Bit Multi-Core Score | |
| MSI GT62VR 7RE-223 | |
| Geekbench 3 | |
| 32 Bit Single-Core Score | |
| MSI GT62VR 7RE-223 | |
| 32 Bit Multi-Core Score | |
| MSI GT62VR 7RE-223 | |
| JetStream 1.1 - 1.1 Total | |
| MSI GT62VR 7RE-223 | |
| Octane V2 - Total Score | |
| MSI GT62VR 7RE-223 | |
| Mozilla Kraken 1.1 - Total | |
| MSI GT62VR 7RE-223 | |
* ... menor é melhor
| PCMark 8 | |
| Home Score Accelerated v2 | |
| MSI GT62VR 7RE-223 | |
| Alienware 15 R3 | |
| Acer Predator 15 G9-593-765Q | |
| MSI GT62VR-6RE16H21 | |
| Schenker XMG P507 PRO | |
| Work Score Accelerated v2 | |
| MSI GT62VR 7RE-223 | |
| Alienware 15 R3 | |
| Schenker XMG P507 PRO | |
| Acer Predator 15 G9-593-765Q | |
| MSI GT62VR-6RE16H21 | |
| PCMark 7 - Score | |
| Alienware 15 R3 | |
| MSI GT62VR 7RE-223 | |
| Acer Predator 15 G9-593-765Q | |
| Schenker XMG P507 PRO | |
| MSI GT62VR-6RE16H21 | |
| PCMark 7 Score | 6831 pontos | |
| PCMark 8 Home Score Accelerated v2 | 5011 pontos | |
| PCMark 8 Creative Score Accelerated v2 | 7738 pontos | |
| PCMark 8 Work Score Accelerated v2 | 5406 pontos | |
Ajuda | ||

| MSI GT62VR 7RE-223 Samsung SSD PM871a MZNLN256HMHQ | MSI GT62VR-6RE16H21 Toshiba HG6 THNSNJ256G8NY | Alienware 15 R3 | Schenker XMG P507 PRO Samsung SSD 960 Evo 500GB m.2 NVMe | Acer Predator 15 G9-593-765Q LiteOn CV1-8B512 | |
|---|---|---|---|---|---|
| CrystalDiskMark 3.0 | -4% | 44% | 152% | -7% | |
| Read Seq (MB/s) | 521 | 523 0% | 1123 116% | 1718 230% | 517 -1% |
| Write Seq (MB/s) | 422.8 | 485.5 15% | 429.2 2% | 1635 287% | 449.7 6% |
| Read 512 (MB/s) | 462 | 444.7 -4% | 833 80% | 873 89% | 355.3 -23% |
| Write 512 (MB/s) | 286.9 | 471.2 64% | 428.1 49% | 1216 324% | 433.7 51% |
| Read 4k (MB/s) | 38.55 | 21.86 -43% | 37.8 -2% | 59.1 53% | 27.69 -28% |
| Write 4k (MB/s) | 122.8 | 98.8 -20% | 122.9 0% | 177.5 45% | 72.9 -41% |
| Read 4k QD32 (MB/s) | 388.4 | 350.3 -10% | 542 40% | 668 72% | 290.9 -25% |
| Write 4k QD32 (MB/s) | 257.9 | 162.2 -37% | 429.8 67% | 546 112% | 273.8 6% |
| 3DMark - 1920x1080 Fire Strike Graphics | |
| Alienware 15 R3 | |
| MSI GT62VR 7RE-223 | |
| Acer Predator 15 G9-593-765Q | |
| MSI GT62VR-6RE16H21 | |
| Schenker XMG P507 PRO | |
| 3DMark 11 - 1280x720 Performance GPU | |
| Alienware 15 R3 | |
| MSI GT62VR 7RE-223 | |
| Acer Predator 15 G9-593-765Q | |
| MSI GT62VR-6RE16H21 | |
| Schenker XMG P507 PRO | |
| 3DMark 06 Standard Score | 30759 pontos | |
| 3DMark 11 Performance | 15359 pontos | |
| 3DMark Ice Storm Standard Score | 123515 pontos | |
| 3DMark Cloud Gate Standard Score | 26786 pontos | |
| 3DMark Fire Strike Score | 13768 pontos | |
| 3DMark Fire Strike Extreme Score | 7445 pontos | |
| 3DMark Time Spy Score | 5114 pontos | |
Ajuda | ||
| BioShock Infinite - 1920x1080 Ultra Preset, DX11 (DDOF) | |
| MSI GT62VR 7RE-223 | |
| MSI GT62VR-6RE16H21 | |
| Gigabyte P55W v6 | |
| Battlefield 4 - 1920x1080 Ultra Preset AA:4x MS | |
| MSI GT62VR 7RE-223 | |
| MSI GT62VR-6RE16H21 | |
| Battlefield 1 - 1920x1080 Ultra Preset AA:T | |
| Alienware 15 R3 | |
| MSI GT62VR 7RE-223 | |
| Deus Ex Mankind Divided - 1920x1080 Ultra Preset AA:2xMS AF:8x | |
| MSI GT62VR 7RE-223 | |
| Acer Predator 15 G9-593-765Q | |
| Gigabyte P55W v6 | |
| Resident Evil 7 - 1920x1080 Very High / On AA:FXAA+T | |
| MSI GT62VR 7RE-223 | |
| Alienware 15 R3 | |
| baixo | média | alto | ultra | |
|---|---|---|---|---|
| Tomb Raider (2013) | 413.3 | 372.6 | 361.6 | 206.2 |
| BioShock Infinite (2013) | 208.2 | 186.6 | 186.2 | 130.6 |
| Battlefield 4 (2013) | 194.4 | 184.7 | 181.9 | 139.2 |
| Deus Ex Mankind Divided (2016) | 97.6 | 92.2 | 75.3 | 43.6 |
| Battlefield 1 (2016) | 144.7 | 128.3 | 110.8 | 104.5 |
| Civilization 6 (2016) | 70 | 57.2 | 49.7 | 49.5 |
| Titanfall 2 (2016) | 143.8 | 143.5 | 129.8 | 121 |
| Resident Evil 7 (2017) | 368.8 | 274.8 | 204.3 | 162.3 |
Barulho
| Ocioso |
| 34 / 35 / 36 dB |
| Carga |
| 40 / 46 dB |
 | ||
30 dB silencioso 40 dB(A) audível 50 dB(A) ruidosamente alto |
||
min: | ||
| MSI GT62VR 7RE-223 i7-7700HQ, GeForce GTX 1070 Mobile | MSI GT62VR-6RE16H21 6700HQ, GeForce GTX 1070 Mobile | Alienware 15 R3 i7-7700HQ, GeForce GTX 1070 Mobile | Schenker XMG P507 PRO i7-7700HQ, GeForce GTX 1070 Mobile | Acer Predator 15 G9-593-765Q 6700HQ, GeForce GTX 1070 Mobile | Gigabyte P55W v6 6700HQ, GeForce GTX 1060 Mobile | |
|---|---|---|---|---|---|---|
| Noise | 3% | -5% | -8% | -2% | -5% | |
| desligado / ambiente * (dB) | 30 | 30 -0% | 30 -0% | 31 -3% | 30 -0% | 31 -3% |
| Idle Minimum * (dB) | 34 | 32 6% | 31 9% | 33 3% | 31 9% | 35 -3% |
| Idle Average * (dB) | 35 | 33 6% | 32 9% | 34 3% | 35 -0% | 36 -3% |
| Idle Maximum * (dB) | 36 | 34 6% | 42 -17% | 44 -22% | 38 -6% | 37 -3% |
| Load Average * (dB) | 40 | 40 -0% | 49 -23% | 46 -15% | 43 -8% | 41 -2% |
| Load Maximum * (dB) | 46 | 46 -0% | 50 -9% | 52 -13% | 49 -7% | 52 -13% |
* ... menor é melhor
(±) A temperatura máxima no lado superior é 40.6 °C / 105 F, em comparação com a média de 40.4 °C / 105 F , variando de 21.2 a 68.8 °C para a classe Gaming.
(-) A parte inferior aquece até um máximo de 48.4 °C / 119 F, em comparação com a média de 43.2 °C / 110 F
(+) Em uso inativo, a temperatura média para o lado superior é 25 °C / 77 F, em comparação com a média do dispositivo de 33.9 °C / ### class_avg_f### F.
(+) Os apoios para as mãos e o touchpad estão atingindo a temperatura máxima da pele (34.7 °C / 94.5 F) e, portanto, não estão quentes.
(-) A temperatura média da área do apoio para as mãos de dispositivos semelhantes foi 28.8 °C / 83.8 F (-5.9 °C / -10.7 F).
| MSI GT62VR 7RE-223 i7-7700HQ, GeForce GTX 1070 Mobile | MSI GT62VR-6RE16H21 6700HQ, GeForce GTX 1070 Mobile | Alienware 15 R3 i7-7700HQ, GeForce GTX 1070 Mobile | Schenker XMG P507 PRO i7-7700HQ, GeForce GTX 1070 Mobile | Acer Predator 15 G9-593-765Q 6700HQ, GeForce GTX 1070 Mobile | Gigabyte P55W v6 6700HQ, GeForce GTX 1060 Mobile | |
|---|---|---|---|---|---|---|
| Heat | -8% | -25% | -24% | 4% | -17% | |
| Maximum Upper Side * (°C) | 40.6 | 44 -8% | 46 -13% | 49.2 -21% | 40.5 -0% | 47.7 -17% |
| Maximum Bottom * (°C) | 48.4 | 53.1 -10% | 51.8 -7% | 62 -28% | 42 13% | 51.2 -6% |
| Idle Upper Side * (°C) | 26.8 | 28.8 -7% | 36.5 -36% | 32.4 -21% | 28.2 -5% | 32.1 -20% |
| Idle Bottom * (°C) | 26.4 | 28.2 -7% | 38.2 -45% | 33 -25% | 24.3 8% | 32.8 -24% |
* ... menor é melhor
MSI GT62VR 7RE-223 análise de áudio
(+) | os alto-falantes podem tocar relativamente alto (###valor### dB)
Graves 100 - 315Hz
(±) | graves reduzidos - em média 13.6% menor que a mediana
(±) | a linearidade dos graves é média (10.1% delta para a frequência anterior)
Médios 400 - 2.000 Hz
(±) | médios mais altos - em média 5% maior que a mediana
(+) | médios são lineares (5.4% delta para frequência anterior)
Altos 2 - 16 kHz
(+) | agudos equilibrados - apenas 2.7% longe da mediana
(±) | a linearidade dos máximos é média (8.6% delta para frequência anterior)
Geral 100 - 16.000 Hz
(±) | a linearidade do som geral é média (15.6% diferença em relação à mediana)
Comparado com a mesma classe
» 36% de todos os dispositivos testados nesta classe foram melhores, 6% semelhantes, 58% piores
» O melhor teve um delta de 6%, a média foi 18%, o pior foi 132%
Comparado com todos os dispositivos testados
» 23% de todos os dispositivos testados foram melhores, 5% semelhantes, 72% piores
» O melhor teve um delta de 4%, a média foi 23%, o pior foi 134%
Alienware 15 R3 análise de áudio
(+) | os alto-falantes podem tocar relativamente alto (###valor### dB)
Graves 100 - 315Hz
(-) | quase nenhum baixo - em média 19.1% menor que a mediana
(±) | a linearidade dos graves é média (10.4% delta para a frequência anterior)
Médios 400 - 2.000 Hz
(±) | médios mais altos - em média 6.7% maior que a mediana
(±) | a linearidade dos médios é média (7.5% delta para frequência anterior)
Altos 2 - 16 kHz
(+) | agudos equilibrados - apenas 3.6% longe da mediana
(+) | os máximos são lineares (5.2% delta da frequência anterior)
Geral 100 - 16.000 Hz
(±) | a linearidade do som geral é média (21.6% diferença em relação à mediana)
Comparado com a mesma classe
» 77% de todos os dispositivos testados nesta classe foram melhores, 5% semelhantes, 18% piores
» O melhor teve um delta de 6%, a média foi 18%, o pior foi 132%
Comparado com todos os dispositivos testados
» 61% de todos os dispositivos testados foram melhores, 7% semelhantes, 32% piores
» O melhor teve um delta de 4%, a média foi 23%, o pior foi 134%
| desligado | |
| Ocioso | |
| Carga |
|
Key:
min: | |
| MSI GT62VR 7RE-223 i7-7700HQ, GeForce GTX 1070 Mobile | MSI GT62VR-6RE16H21 6700HQ, GeForce GTX 1070 Mobile | Alienware 15 R3 i7-7700HQ, GeForce GTX 1070 Mobile | Schenker XMG P507 PRO i7-7700HQ, GeForce GTX 1070 Mobile | Acer Predator 15 G9-593-765Q 6700HQ, GeForce GTX 1070 Mobile | Gigabyte P55W v6 6700HQ, GeForce GTX 1060 Mobile | |
|---|---|---|---|---|---|---|
| Power Consumption | -9% | 1% | 12% | 0% | 35% | |
| Idle Minimum * (Watt) | 20 | 20 -0% | 19 5% | 14 30% | 18 10% | 8 60% |
| Idle Average * (Watt) | 24 | 26 -8% | 23 4% | 18 25% | 24 -0% | 13 46% |
| Idle Maximum * (Watt) | 29 | 32 -10% | 29 -0% | 24 17% | 29 -0% | 17 41% |
| Load Average * (Watt) | 82 | 100 -22% | 85 -4% | 87 -6% | 86 -5% | 71 13% |
| Load Maximum * (Watt) | 193 | 202 -5% | 192 1% | 201 -4% | 201 -4% | 165 15% |
* ... menor é melhor
| MSI GT62VR 7RE-223 i7-7700HQ, GeForce GTX 1070 Mobile, 75 Wh | MSI GT62VR-6RE16H21 6700HQ, GeForce GTX 1070 Mobile, 75.24 Wh | Alienware 15 R3 i7-7700HQ, GeForce GTX 1070 Mobile, 99 Wh | Schenker XMG P507 PRO i7-7700HQ, GeForce GTX 1070 Mobile, 60 Wh | Acer Predator 15 G9-593-765Q 6700HQ, GeForce GTX 1070 Mobile, Wh | Gigabyte P55W v6 6700HQ, GeForce GTX 1060 Mobile, 63 Wh | |
|---|---|---|---|---|---|---|
| Duração da bateria | -7% | 5% | -17% | 18% | 35% | |
| Reader / Idle (h) | 6.3 | 5 -21% | 6.4 2% | 10.2 62% | ||
| H.264 (h) | 4.2 | 4.4 5% | 3.6 -14% | 5 19% | 5.6 33% | |
| WiFi v1.3 (h) | 4.1 | 4.1 0% | 4.4 7% | 3.3 -20% | 4.8 17% | 5.9 44% |
| Load (h) | 1.6 | 1.6 0% | 1.7 6% | 1.9 19% | 1.6 0% |
Pro
Contra
A combinação do processador quad core Kaby Lake e GeForce GTX 1070 podem rodar fluentemente todos os jogos atuais em resolução Full HD com configurações de qualidade altas a máximas. Pro: Apesar do poderoso hardware, o aumento da temperatura é apenas moderado. O pequeno ganho de desempenho resulta principalmente a resultados de benchmark um pouco melhores, mas subjetivamente não pe muito notório.
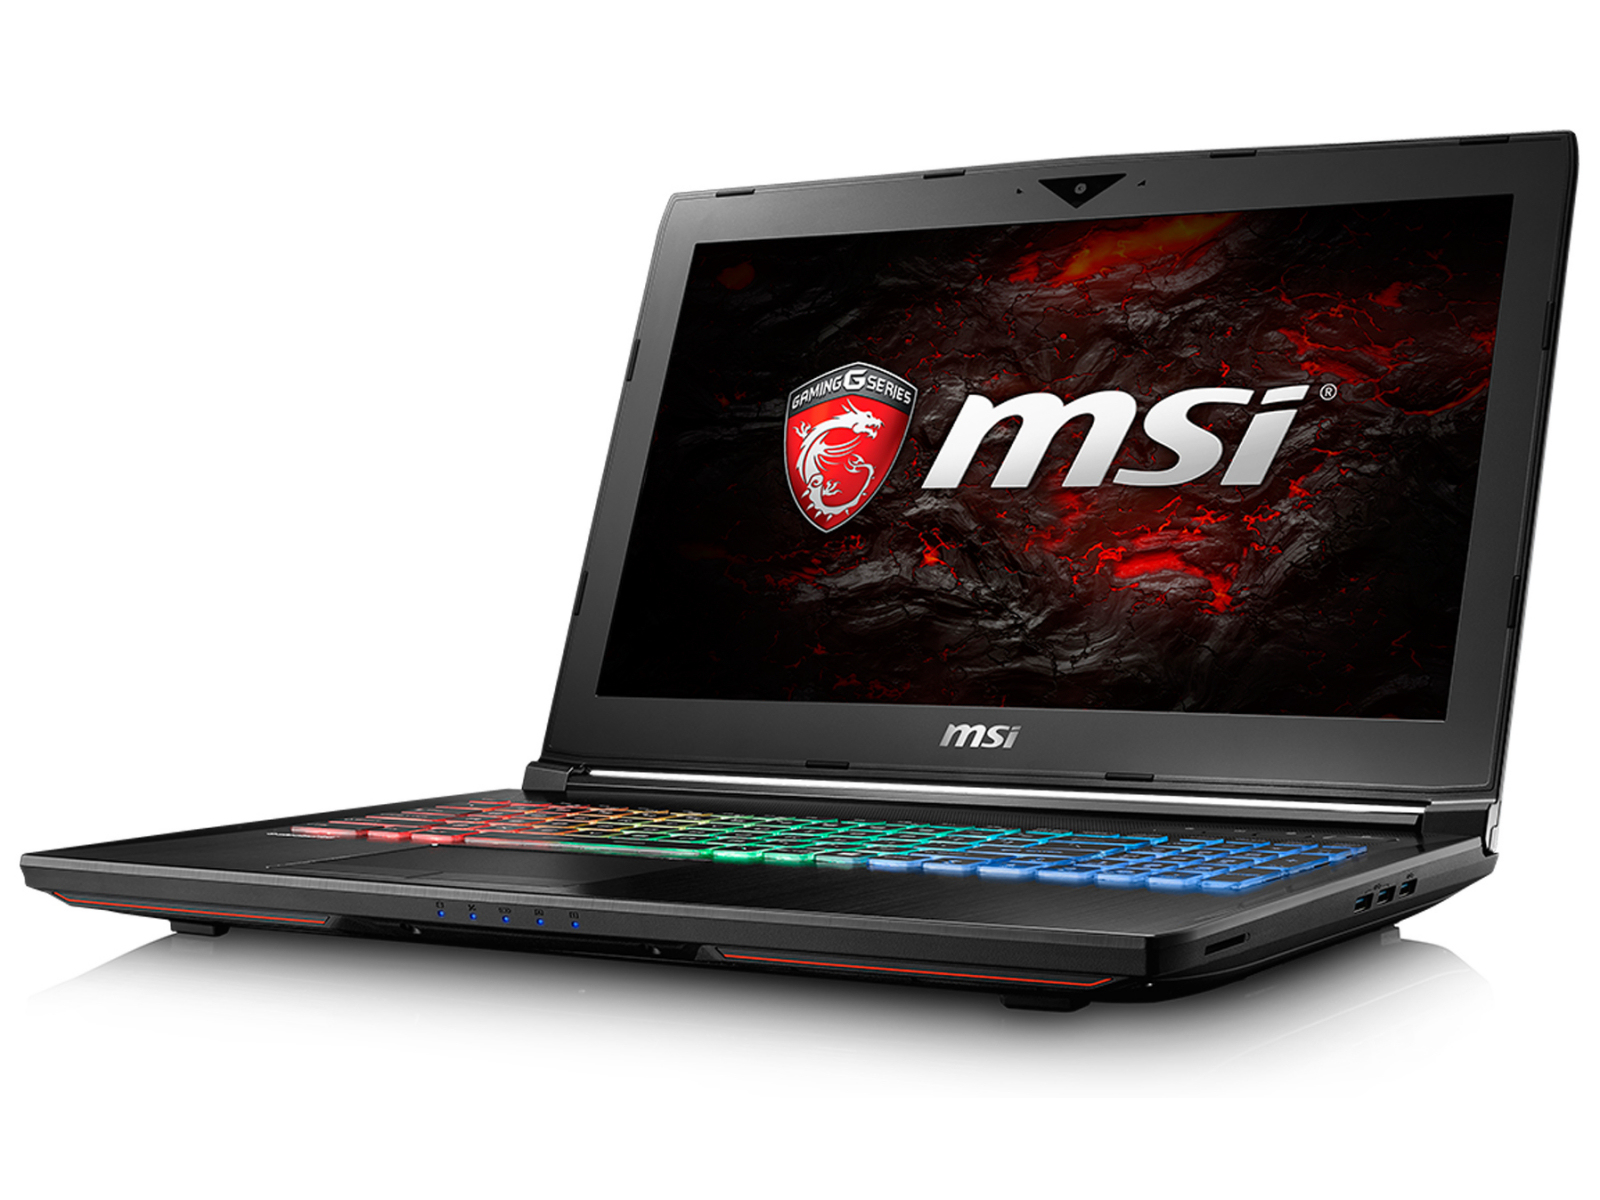
A MSI entrega um portátil para jogos, em geral, bem feito com o GT62VR 7RE.
Um veloz SSD SATA III garante um sistema responsivo. Se o desempenho do SSD não for suficiente para você, pode substituí-lo por um modelo PCIe/NVMe. Também é possível substituir o disco rígido de 2,5-polegadas. Dado que o computador não possui uma escotilha de manutenção, você precisará remover o lado inferior em ambos os casos.
A tela IPS matte Full HD funciona com uma frequência de 60 Hz. É brilhante, rica em contraste, e com ângulos de visão estáveis. A tecnologia G-Sync da Nvidia garante sequências de imagens fluentes.
MSI GT62VR 7RE-223
- 02/14/2017 v6 (old)
Sascha Mölck