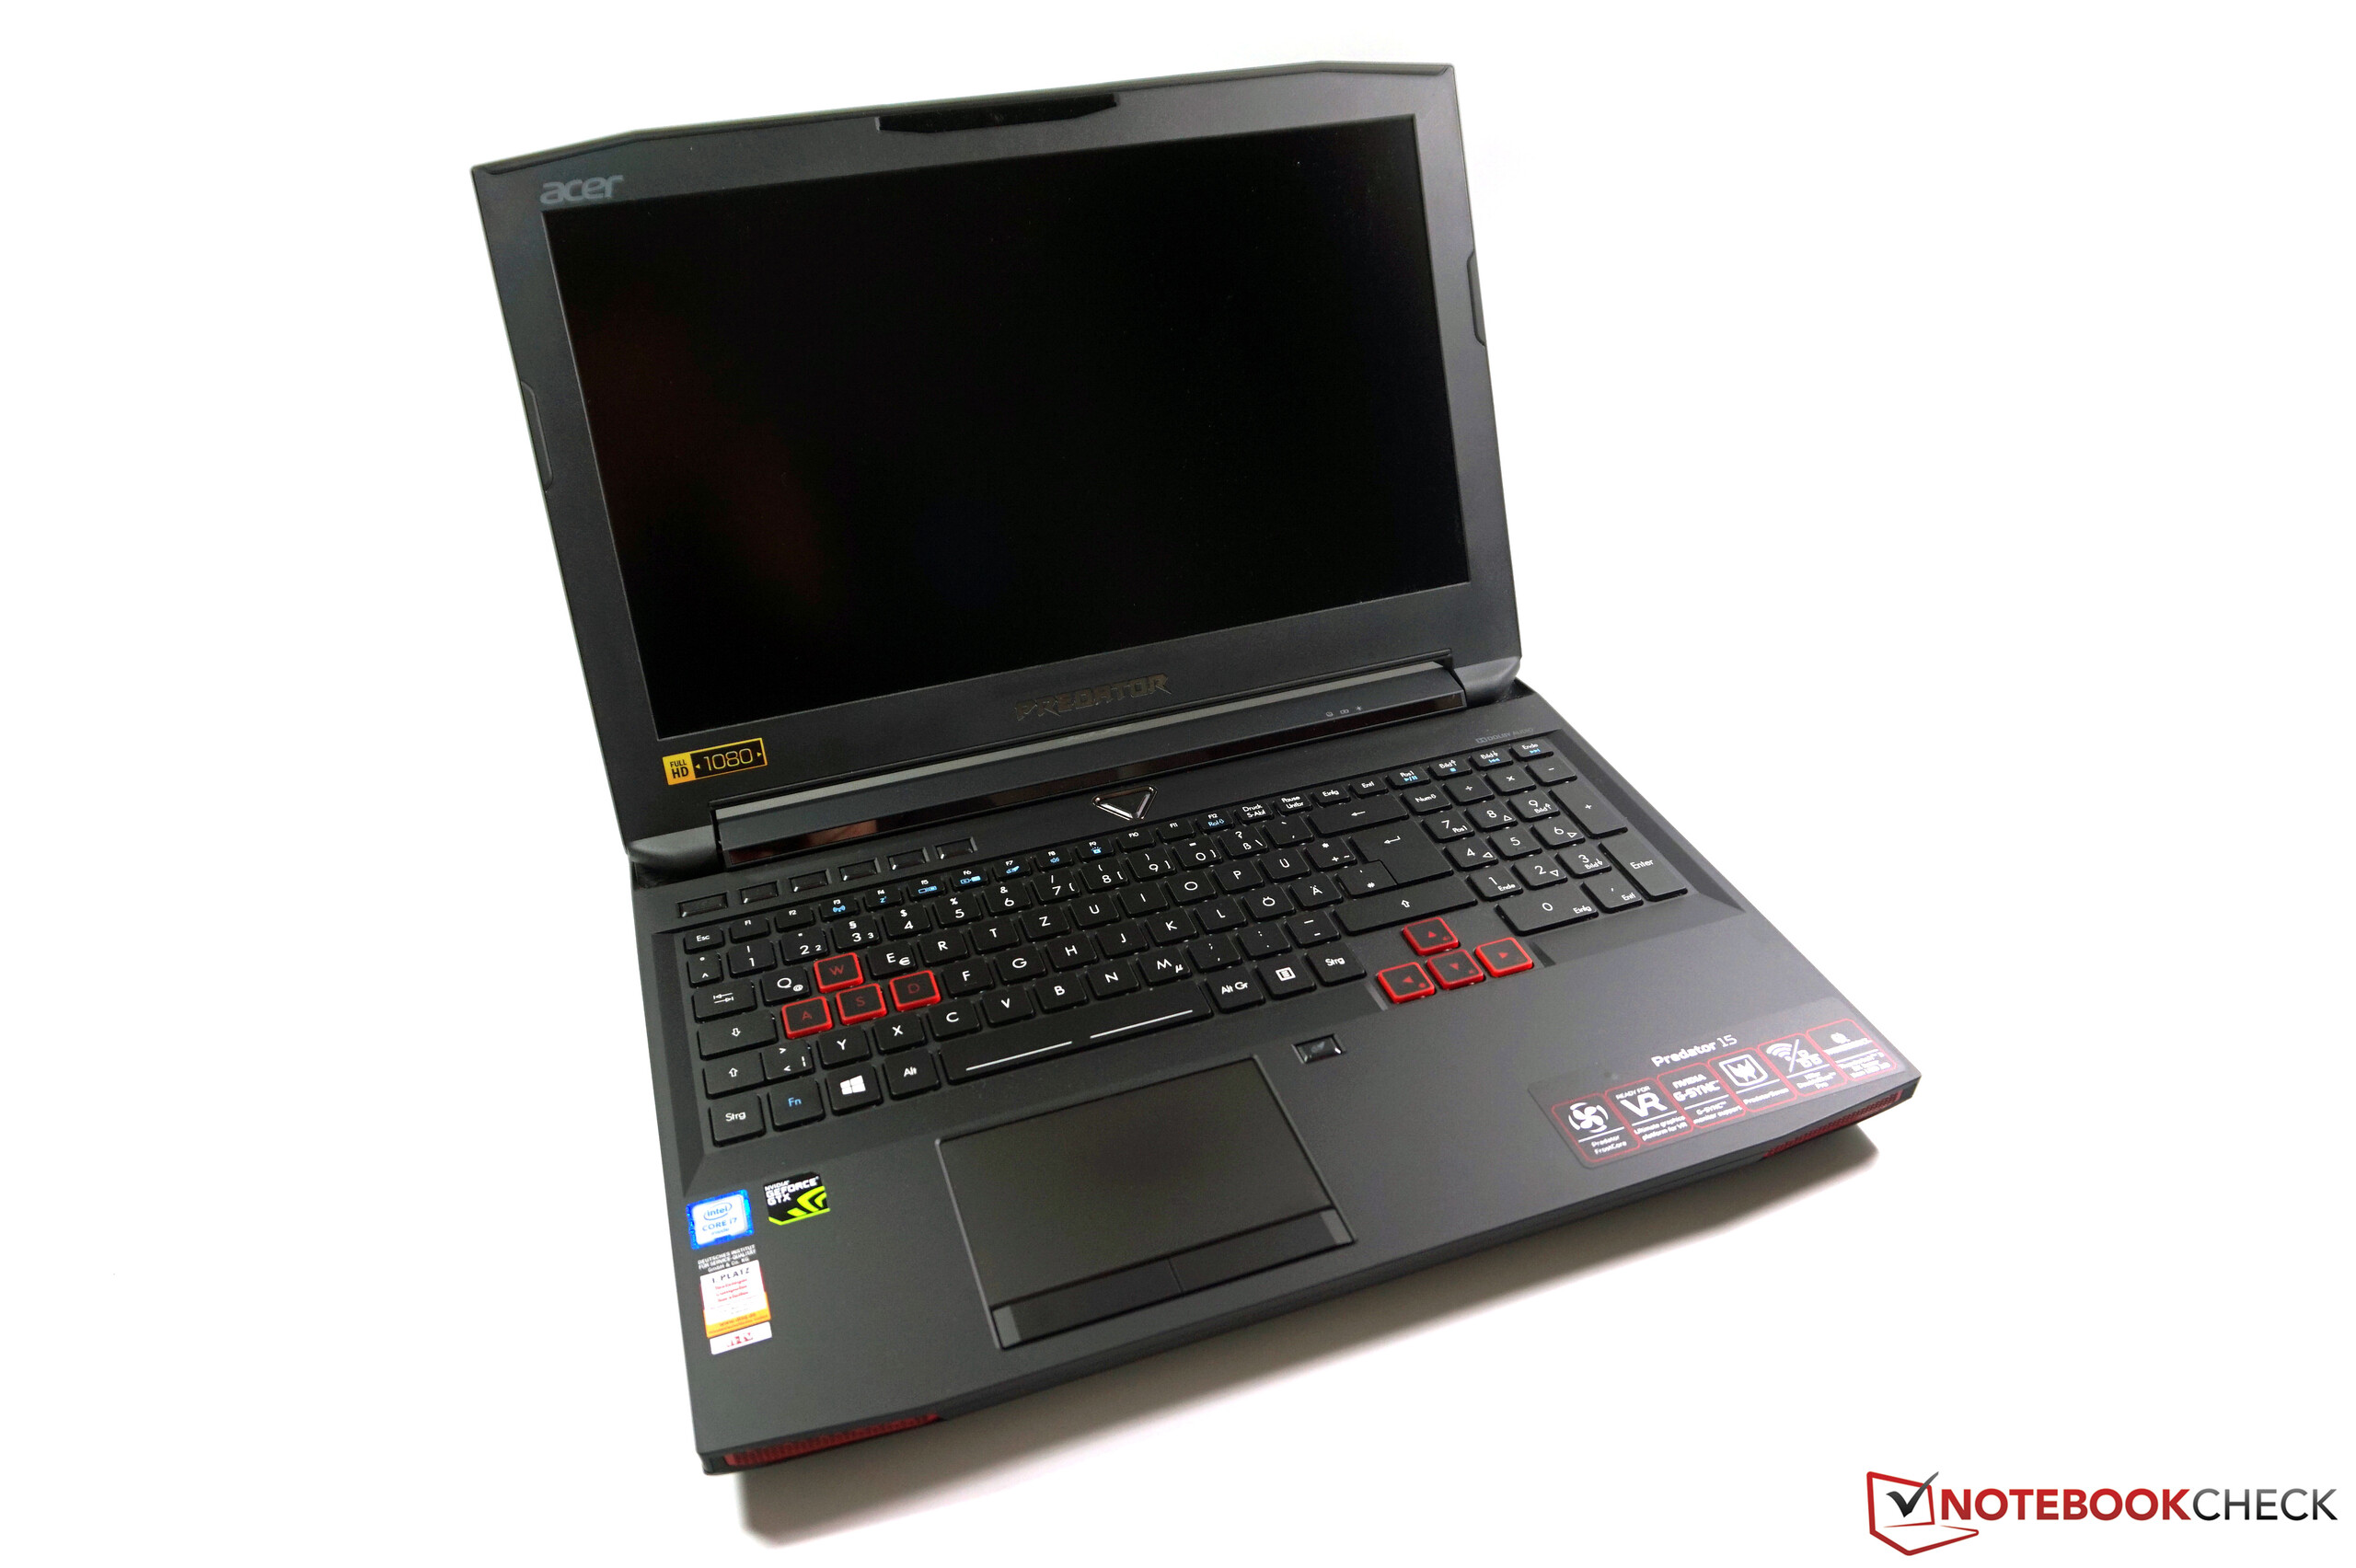
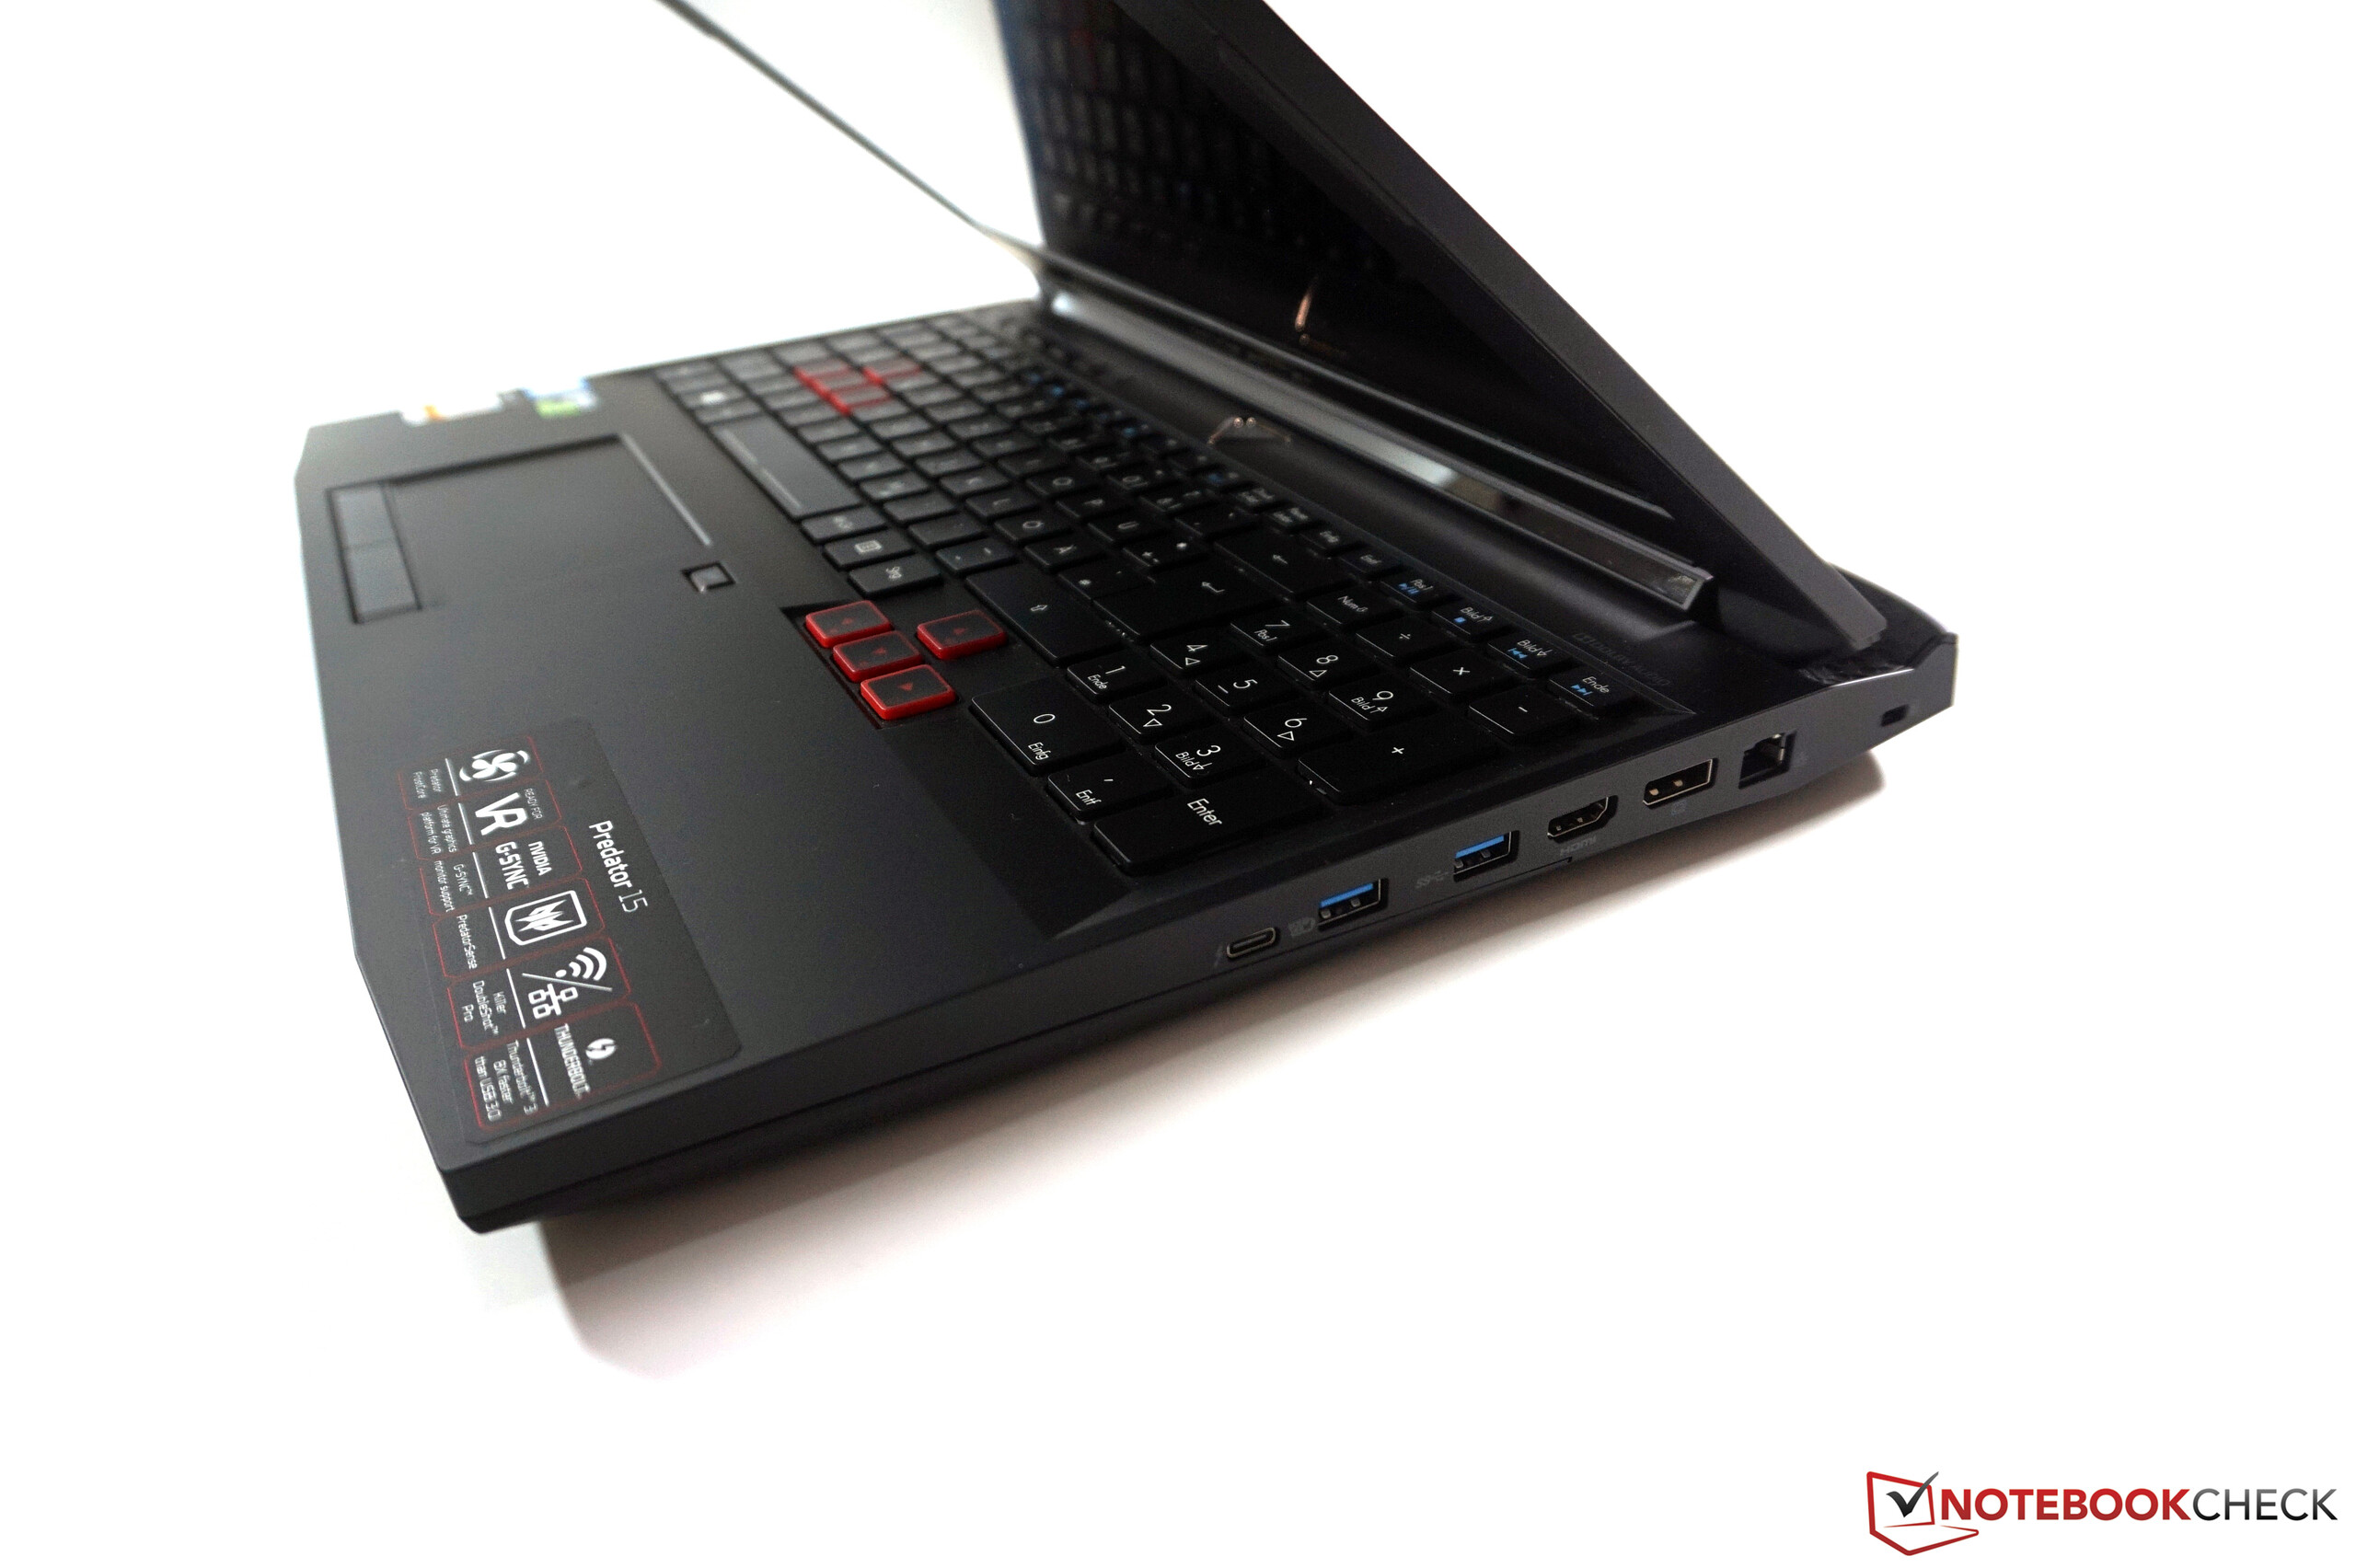
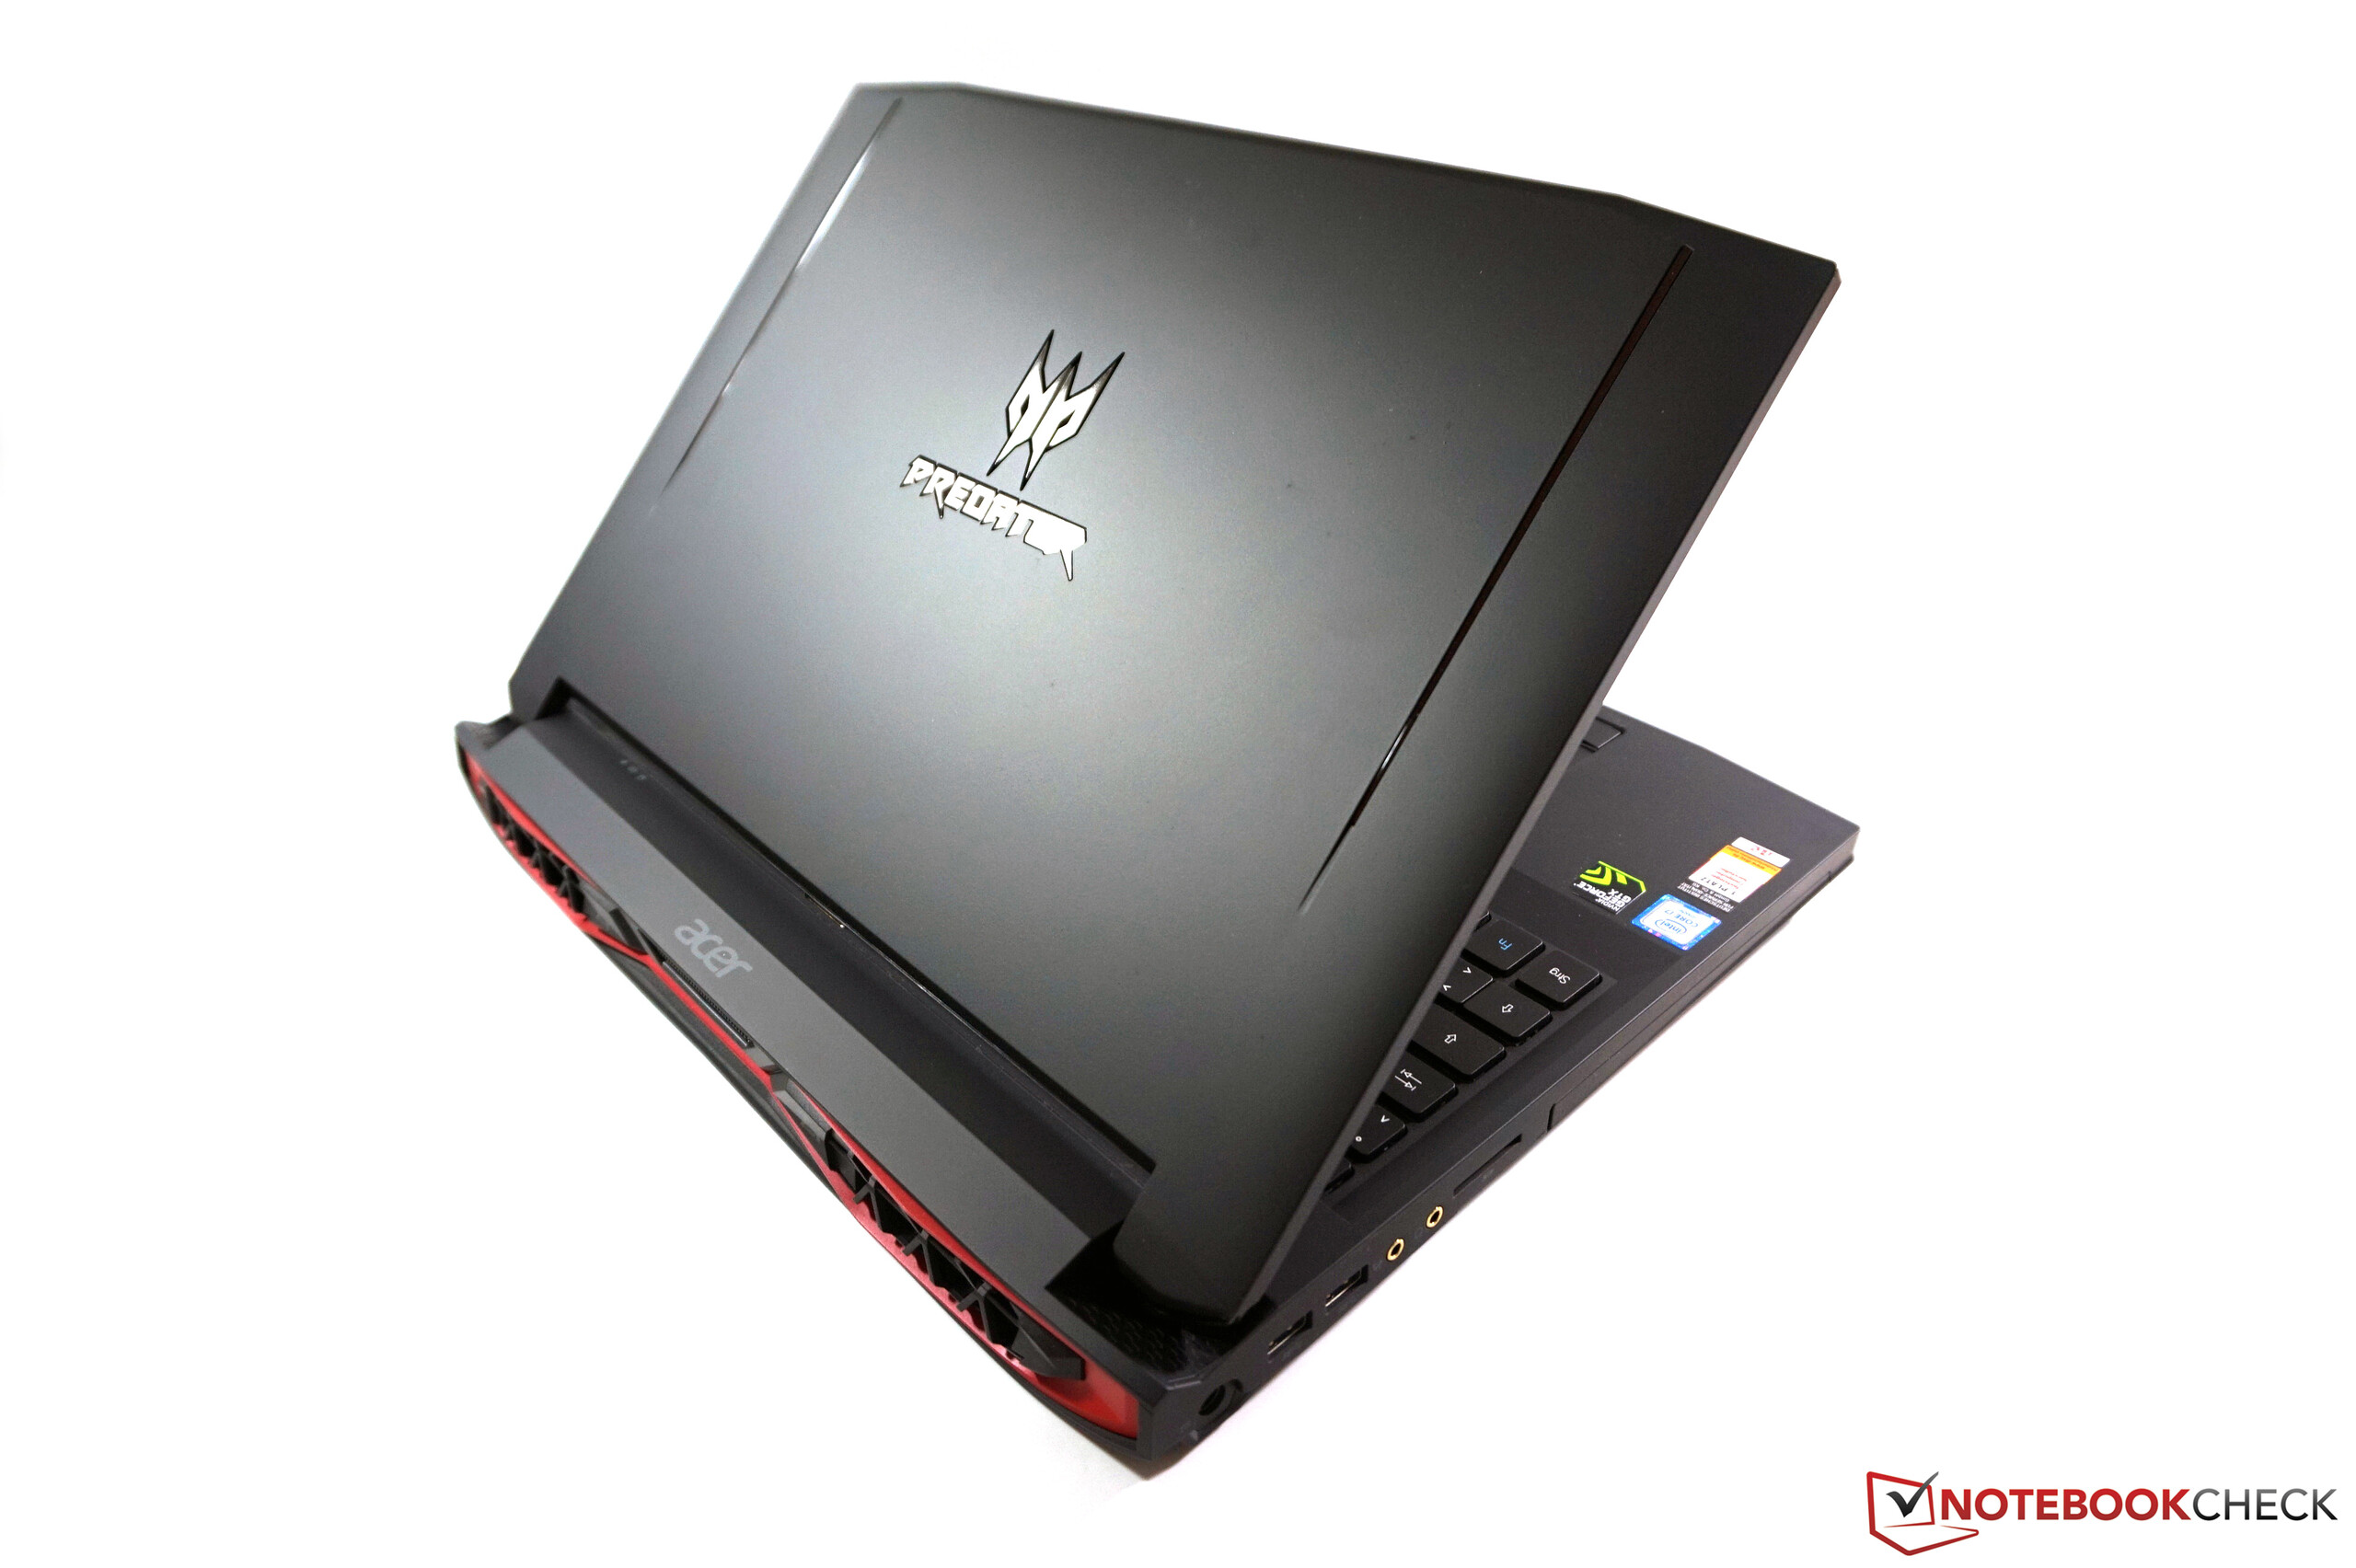
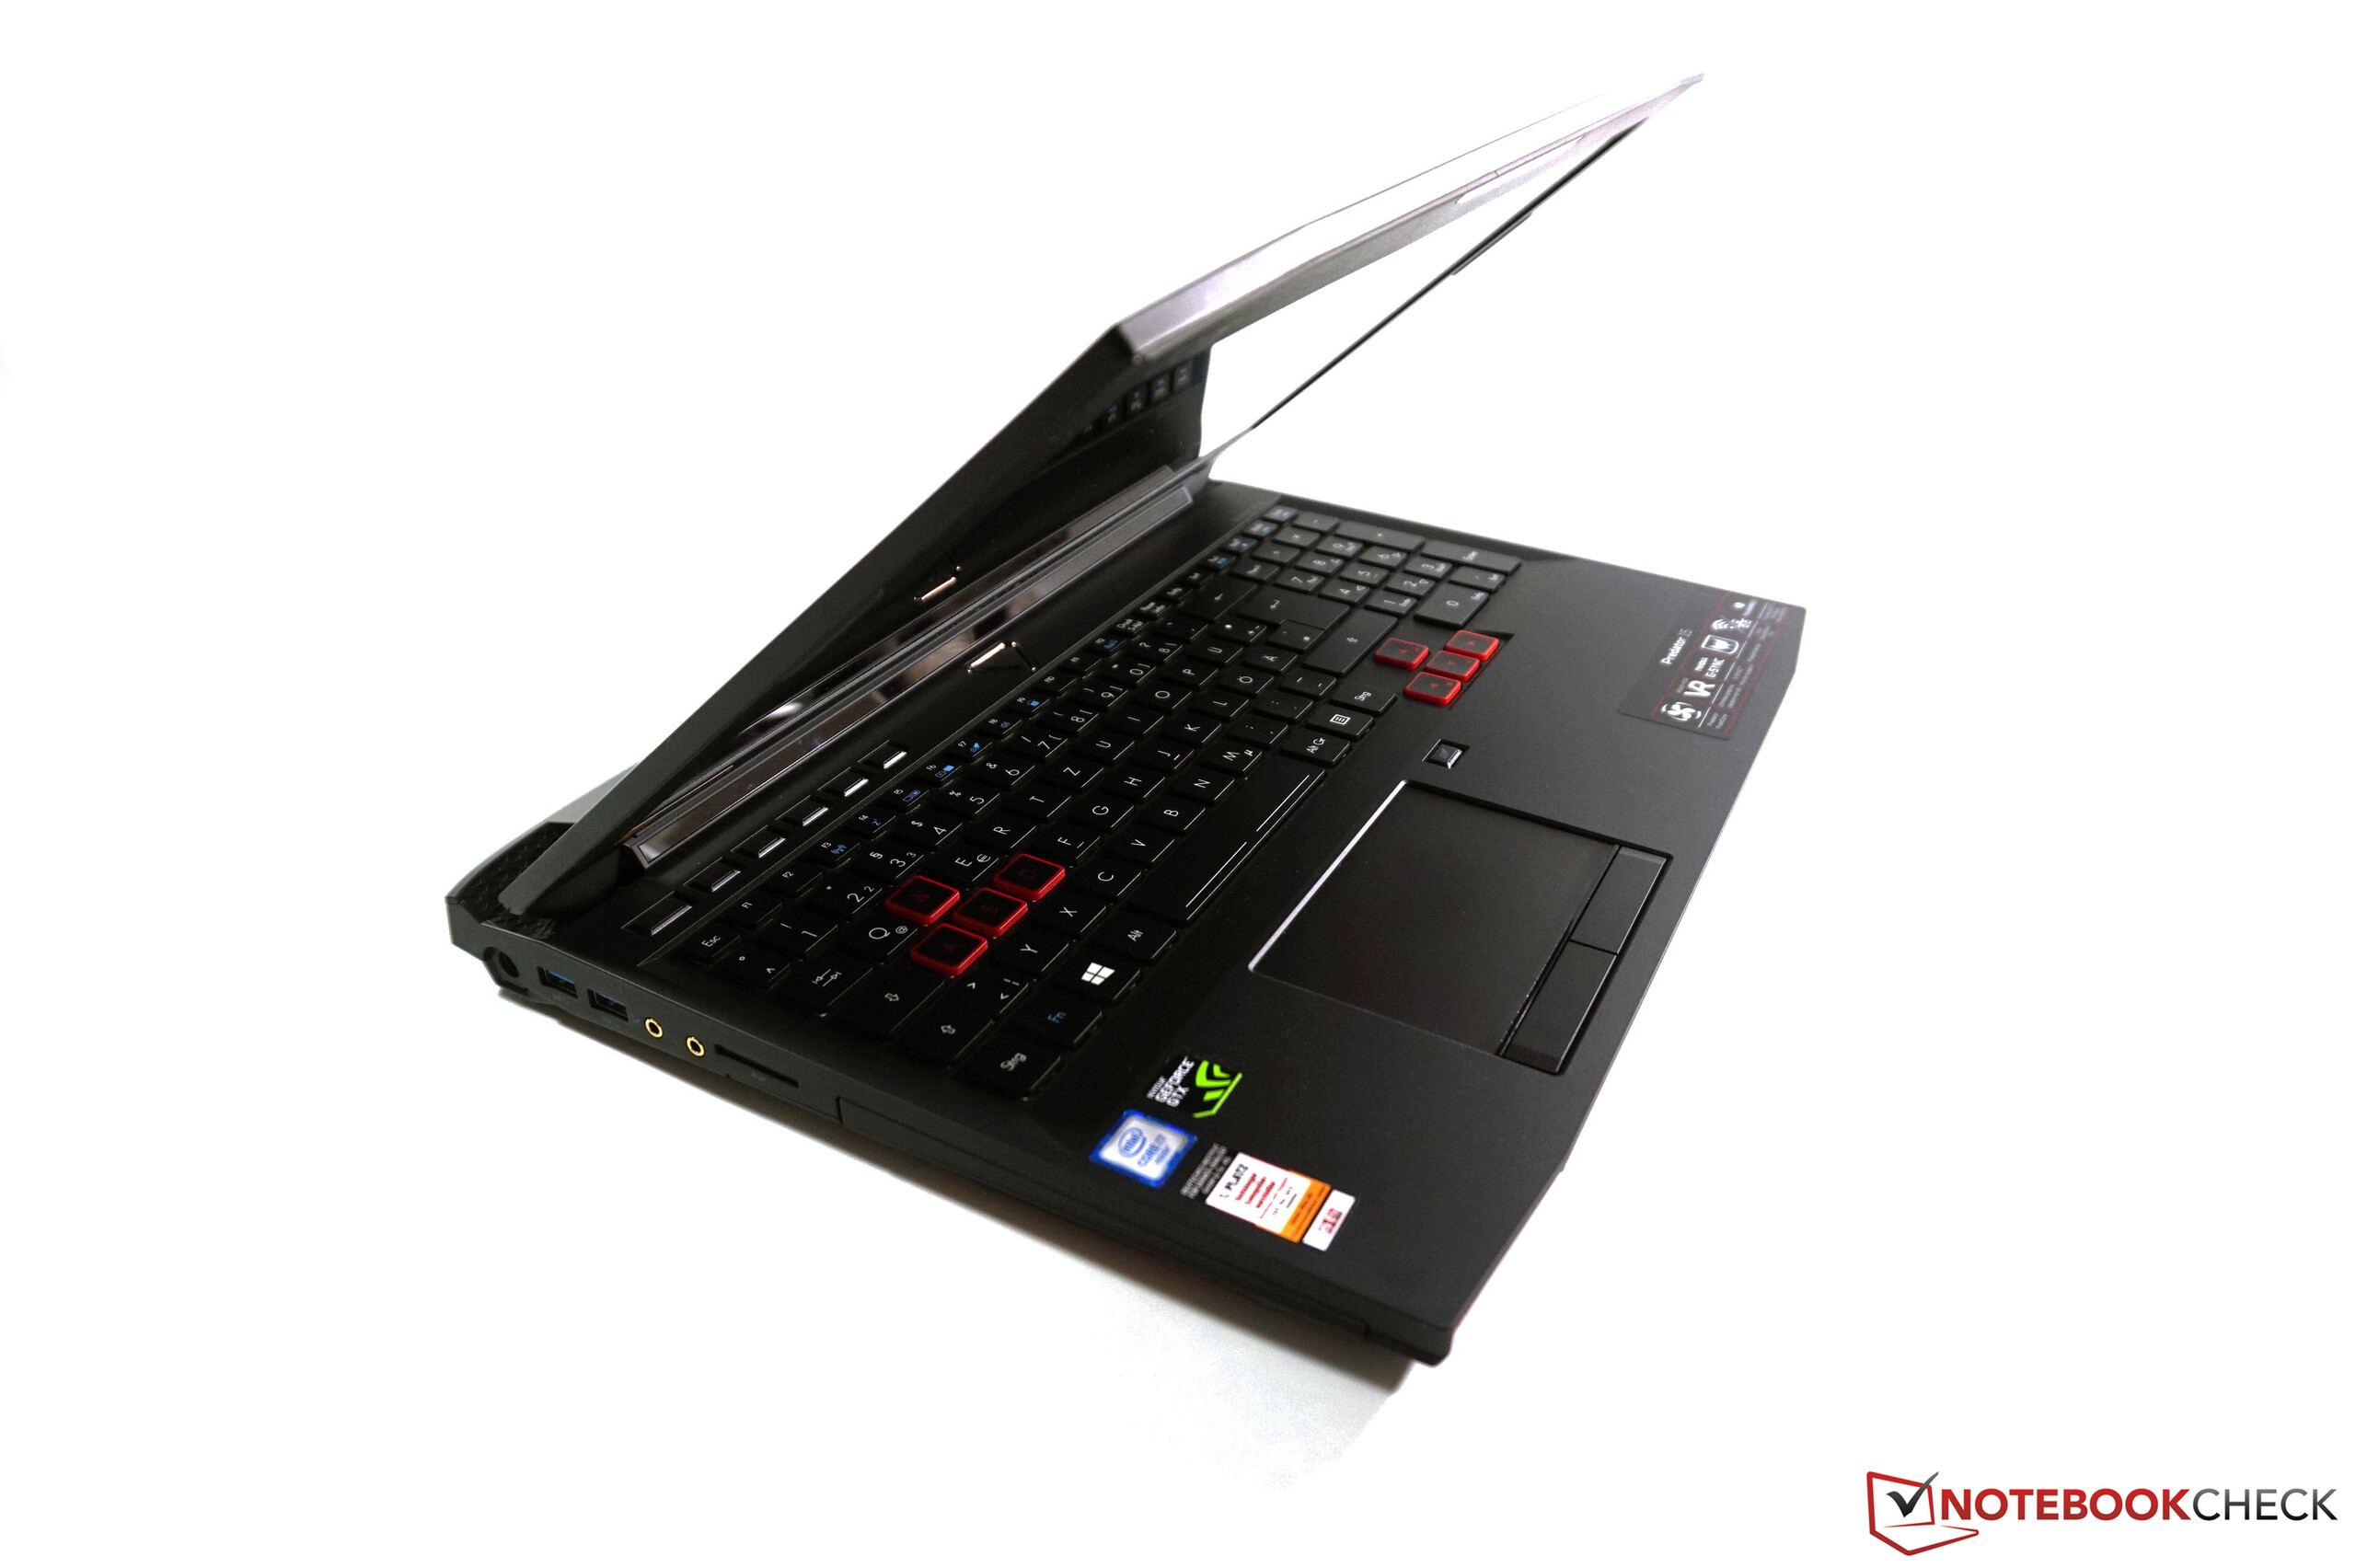
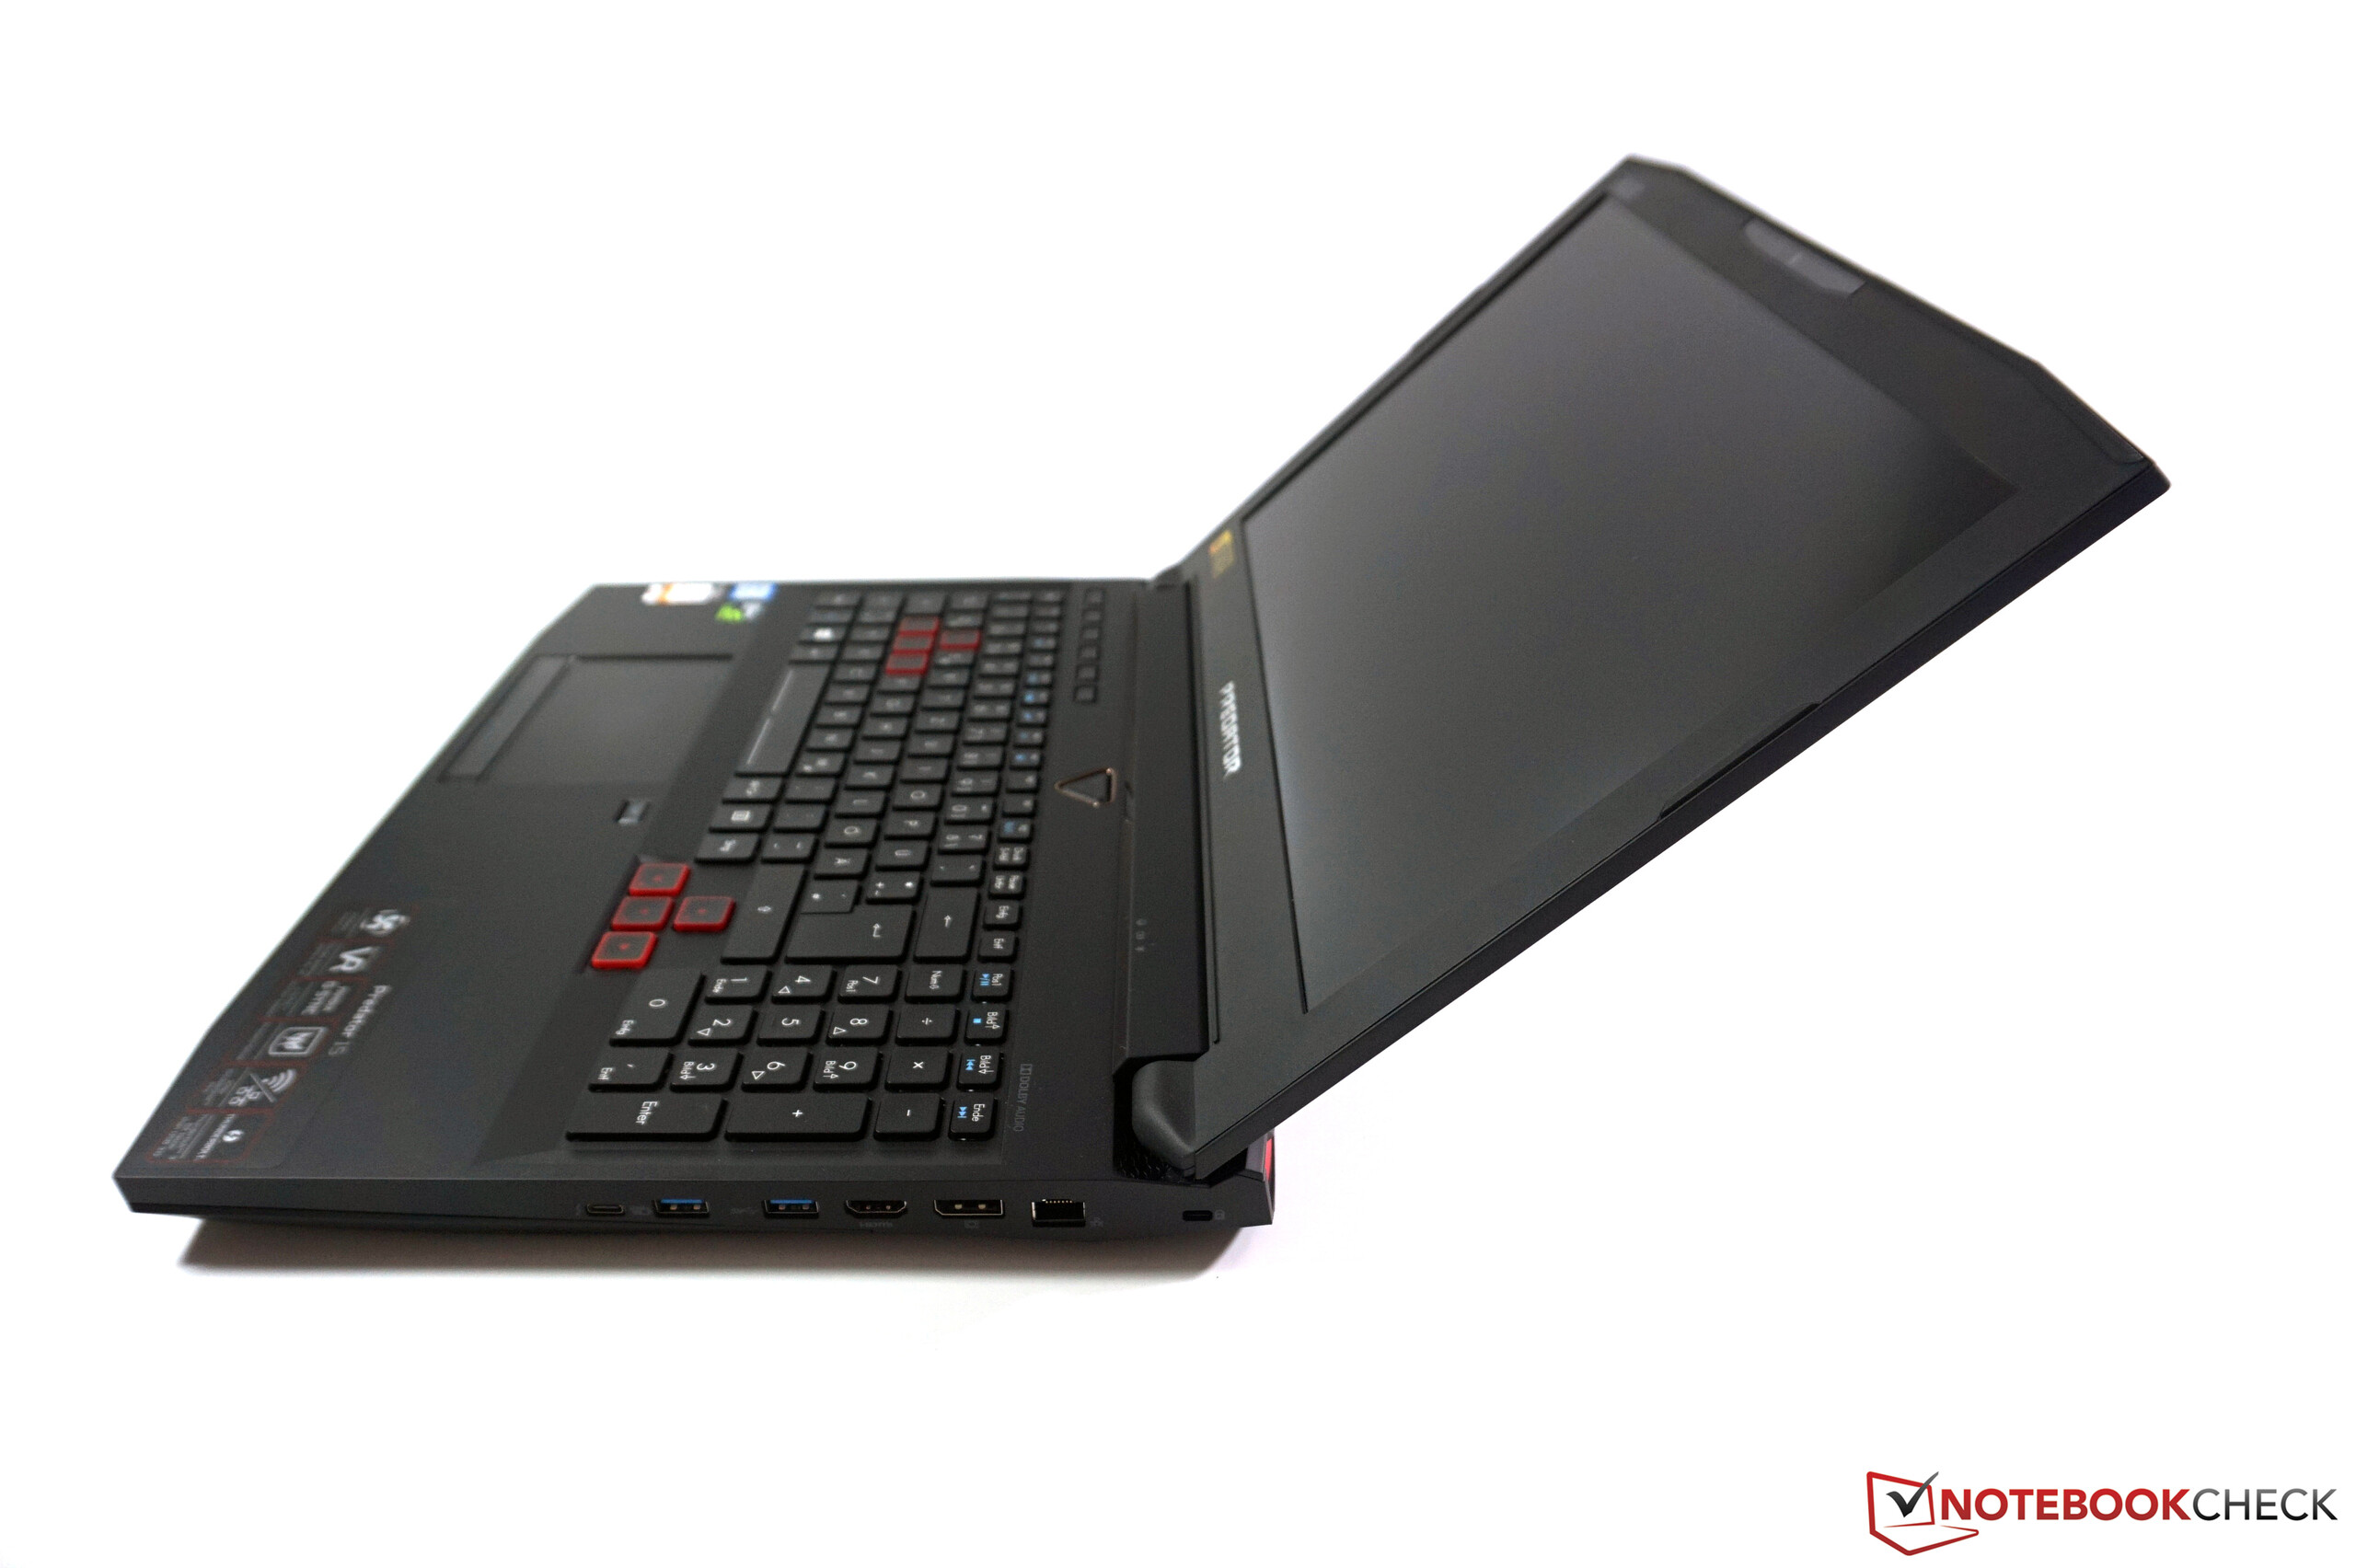
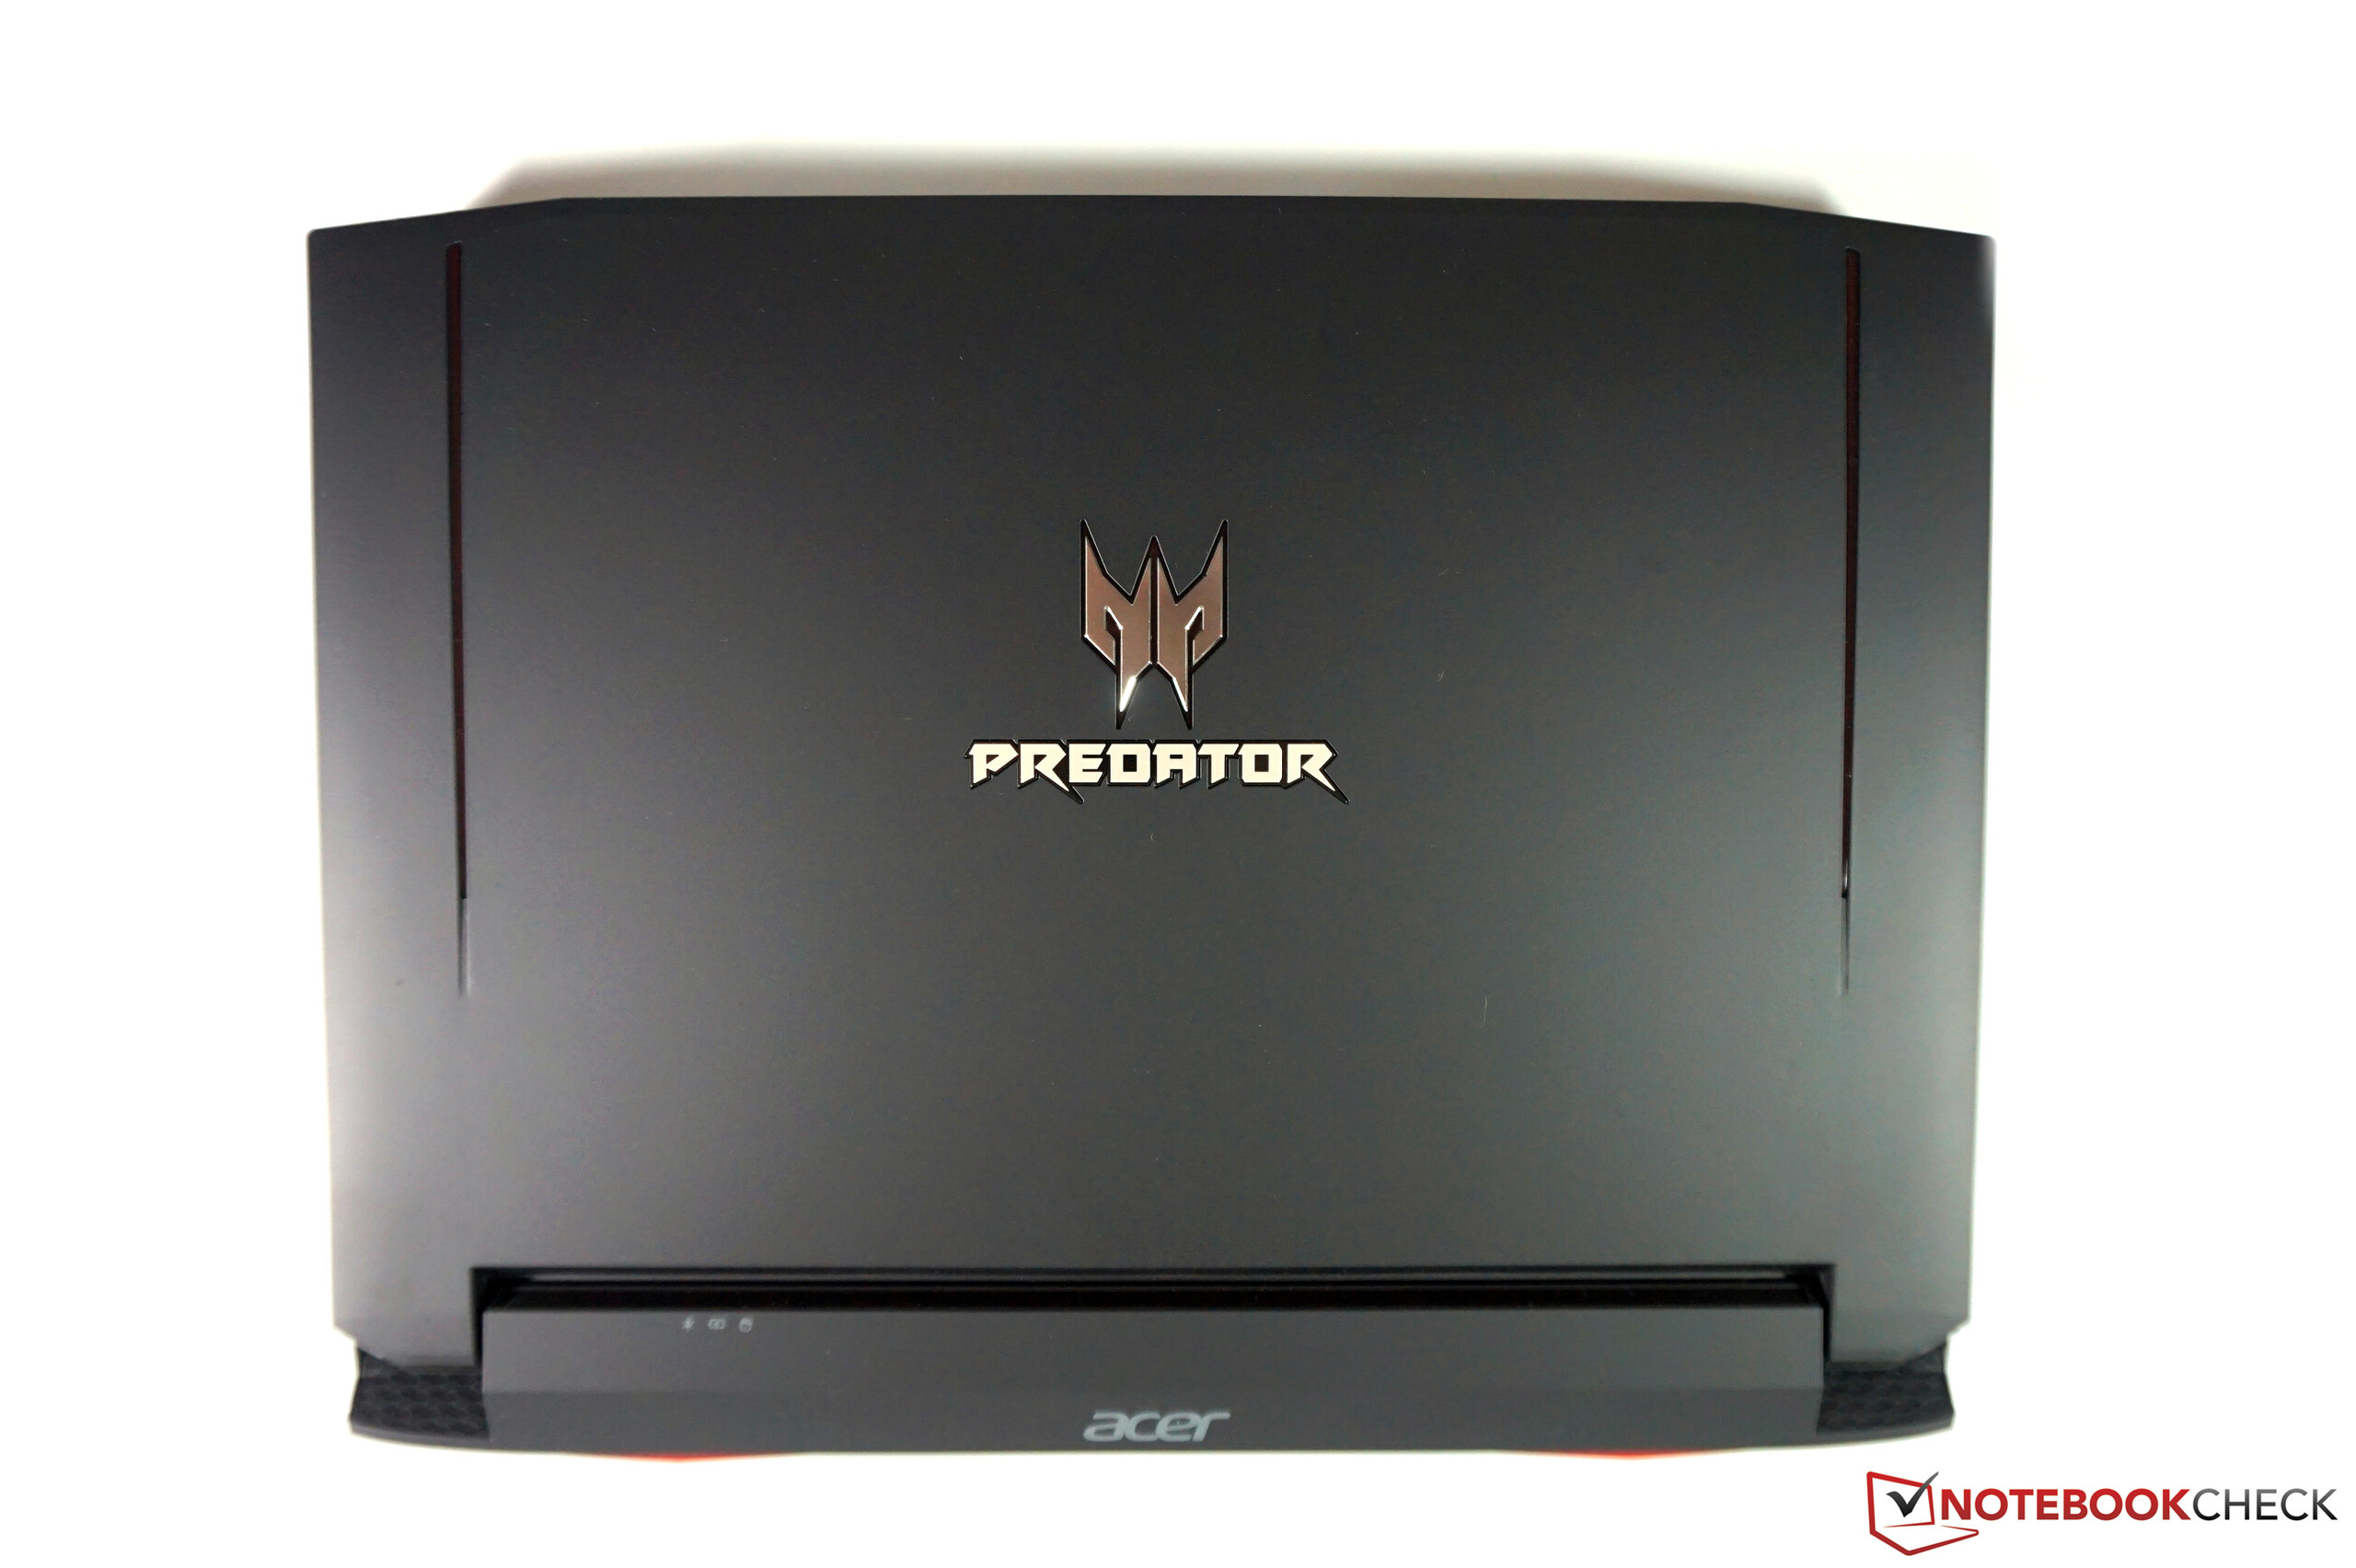
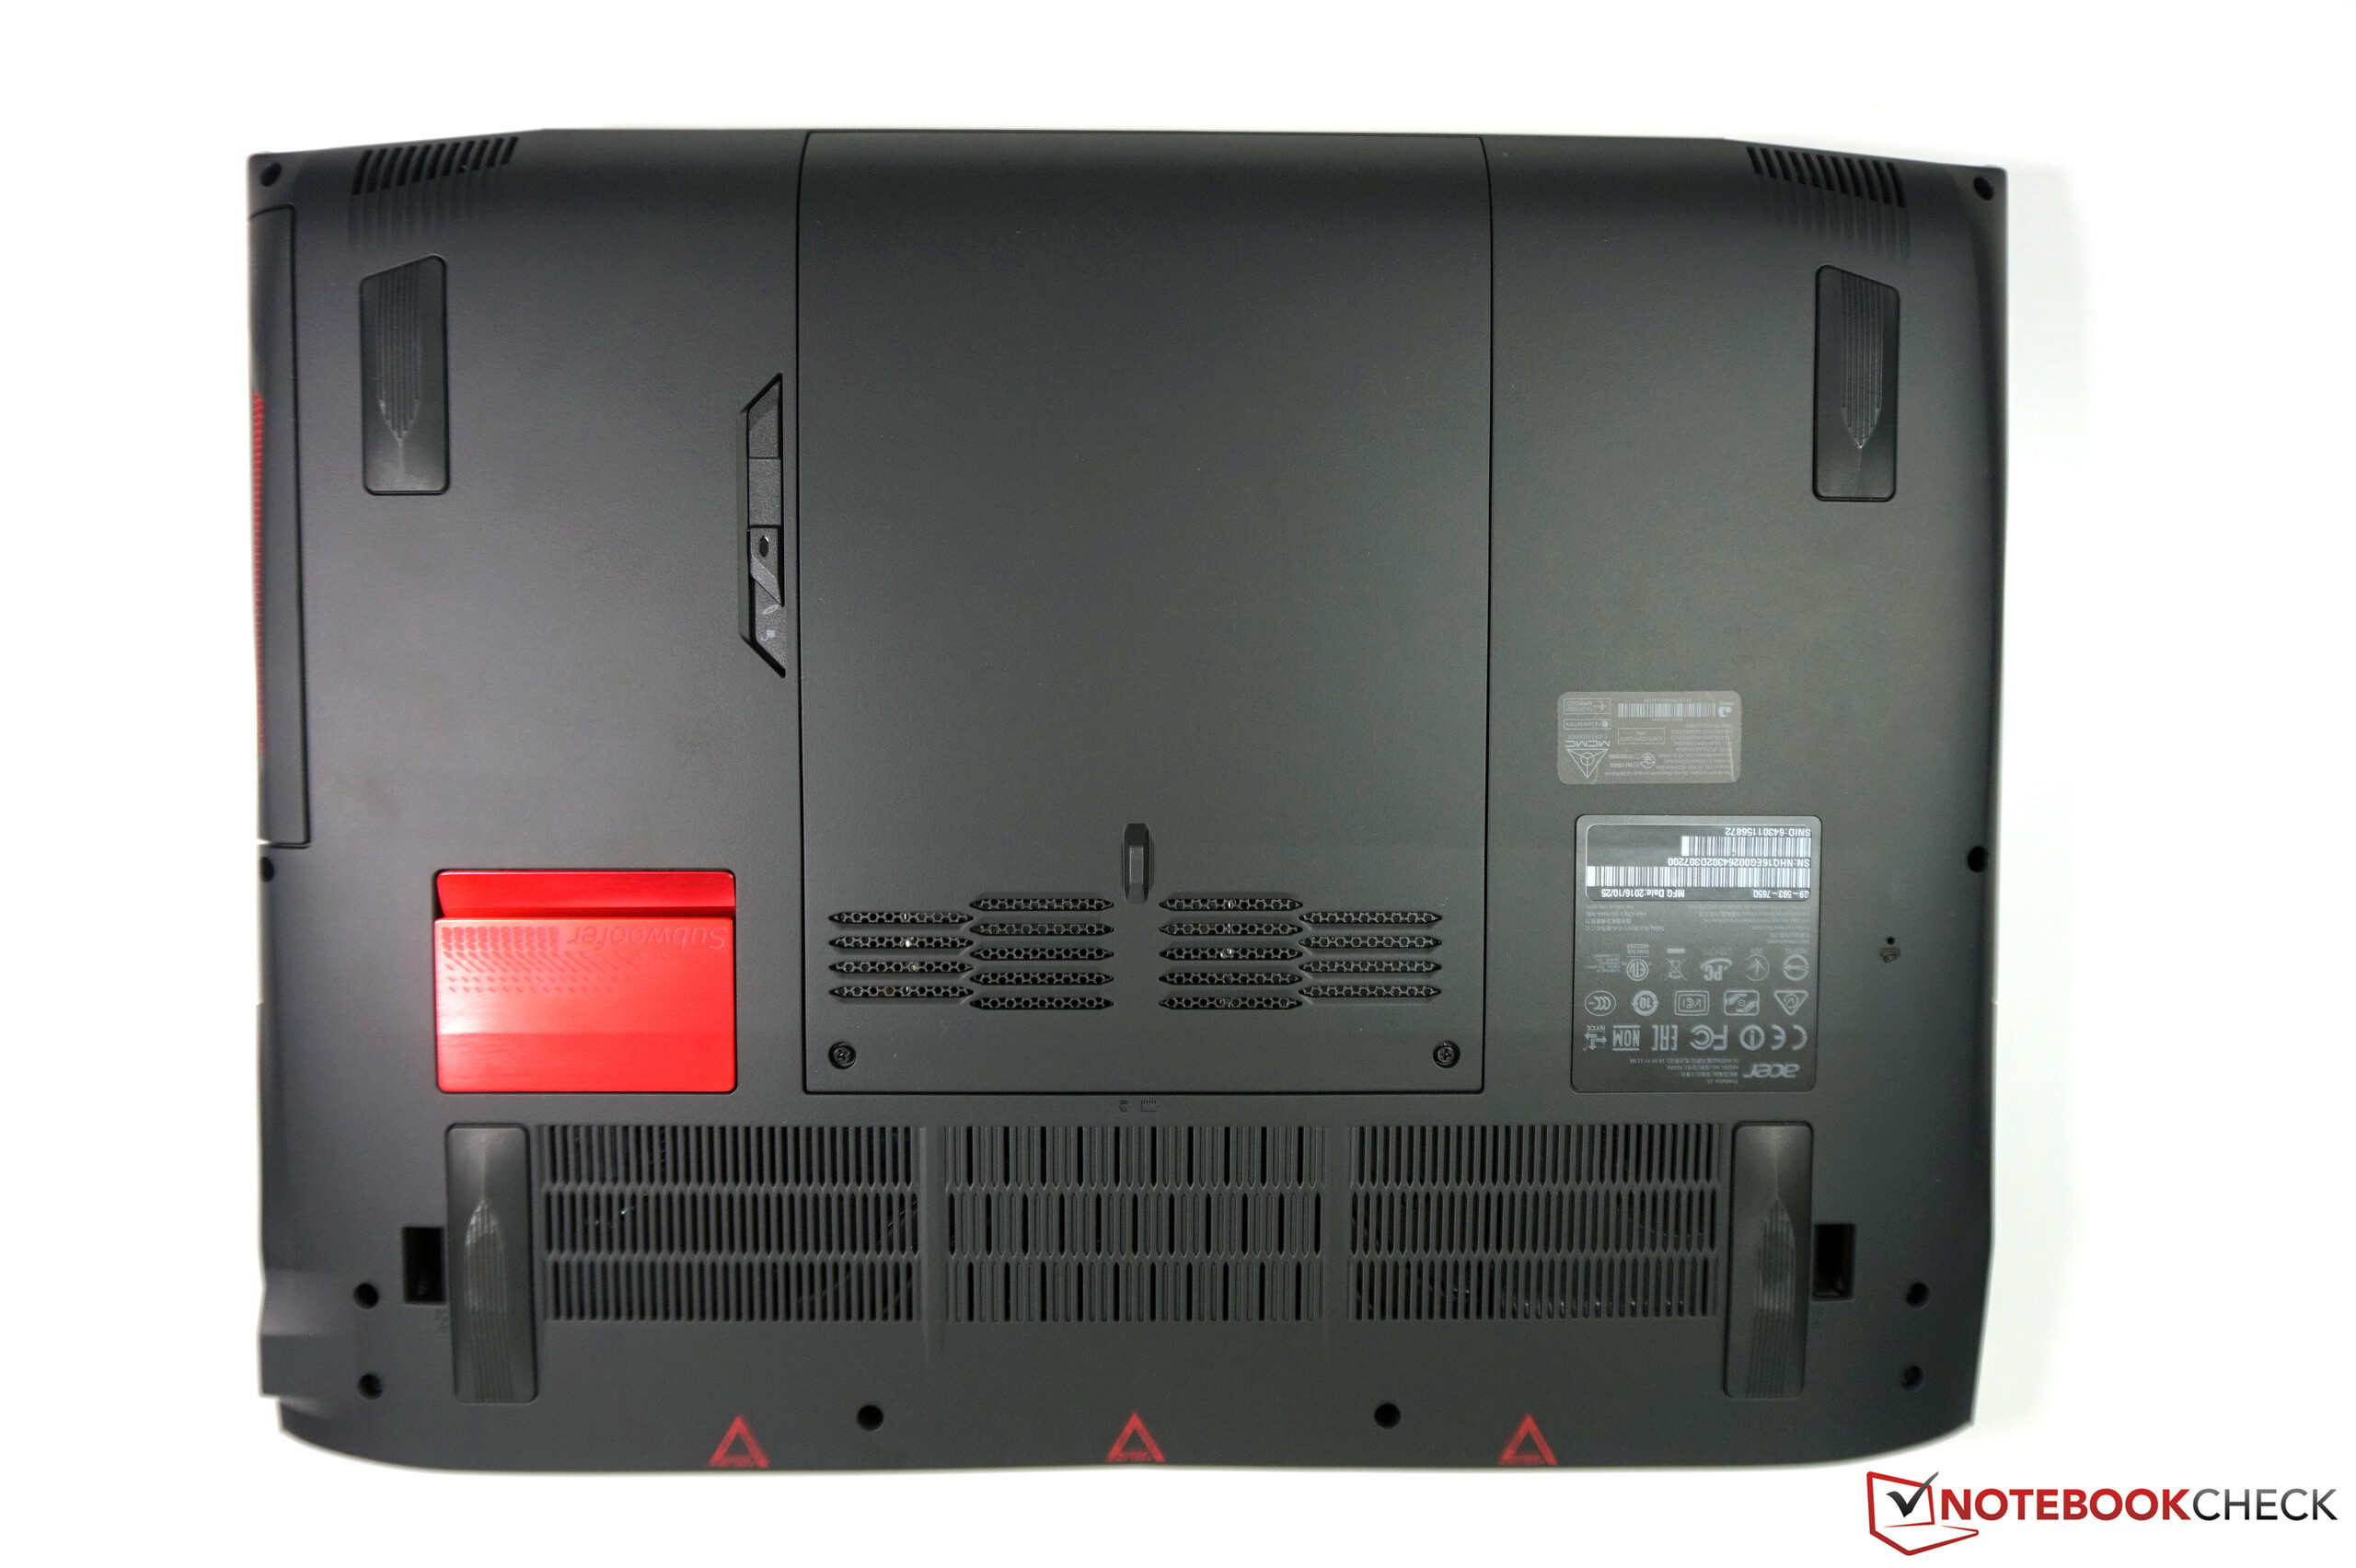
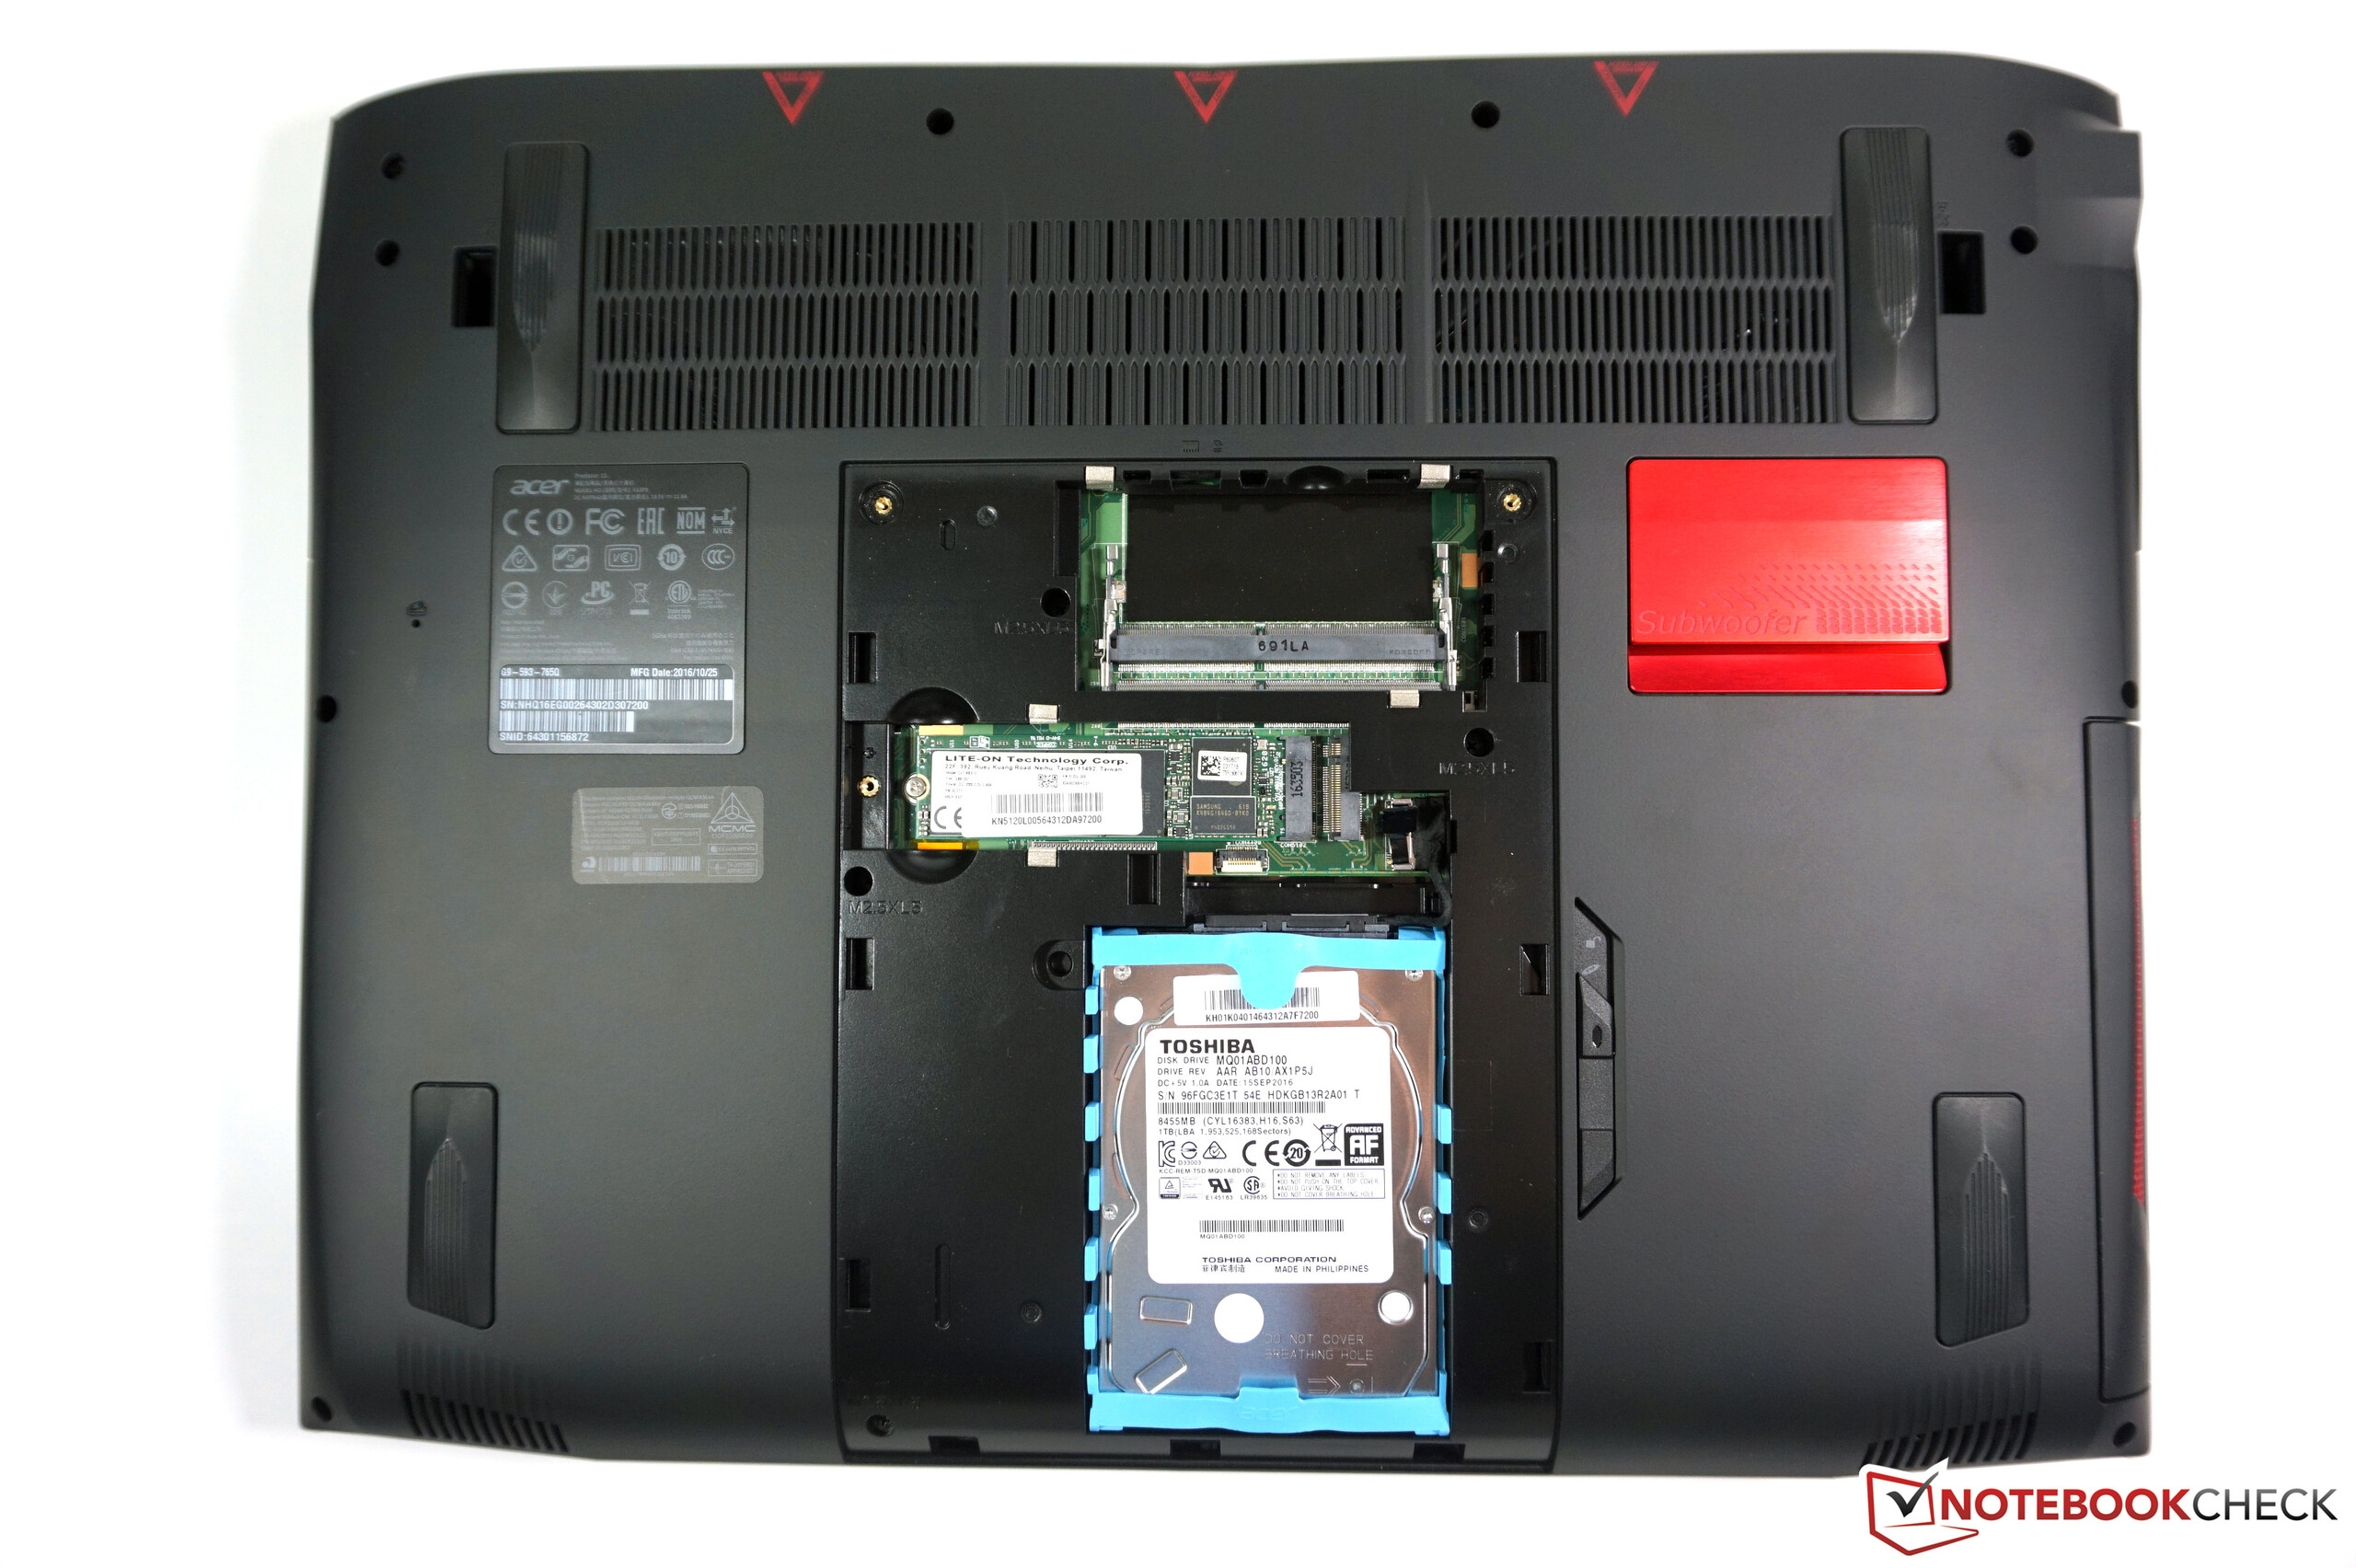
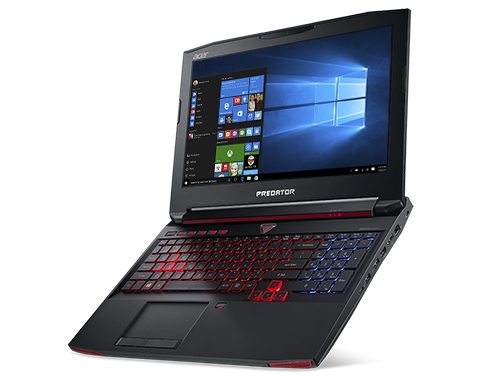
Breve Análise do Portátil Acer Predator 15 G9-593
| SD Card Reader | |
| average JPG Copy Test (av. of 3 runs) | |
| MSI GT62VR-6RE16H21 | |
| Aorus X5 v6 | |
| Acer Predator 15 G9-593-765Q | |
| Schenker XMG P507 | |
| Asus Strix GL502VS-FY032T | |
| maximum AS SSD Seq Read Test (1GB) | |
| MSI GT62VR-6RE16H21 | |
| Aorus X5 v6 | |
| Acer Predator 15 G9-593-765Q | |
| Schenker XMG P507 | |
| Asus Strix GL502VS-FY032T | |
| Networking | |
| iperf3 transmit AX12 | |
| MSI GT73VR 6RF | |
| Acer Predator 15 G9-593-765Q | |
| Razer Blade (2016) | |
| EVGA SC17 GTX 1070 | |
| iperf3 receive AX12 | |
| Acer Predator 15 G9-593-765Q | |
| MSI GT73VR 6RF | |
| EVGA SC17 GTX 1070 | |
| Razer Blade (2016) | |
| |||||||||||||||||||||||||
iluminação: 83 %
iluminação com acumulador: 273 cd/m²
Contraste: 1011:1 (Preto: 0.27 cd/m²)
ΔE ColorChecker Calman: 3.77 | ∀{0.5-29.43 Ø4.71}
ΔE Greyscale Calman: 2.48 | ∀{0.09-98 Ø4.96}
84% sRGB (Argyll 1.6.3 3D)
55% AdobeRGB 1998 (Argyll 1.6.3 3D)
61.3% AdobeRGB 1998 (Argyll 3D)
83.9% sRGB (Argyll 3D)
63.6% Display P3 (Argyll 3D)
Gamma: 2.37
CCT: 6854 K
| Acer Predator 15 G9-593-765Q LG Philips LP156WF6-SPP1 (LGD04D5), , 1920x1080, 15.6" | MSI GT62VR-6RE16H21 LG Philips LP156WF6 (LGD046F), , 1920x1080, 15.6" | Asus Strix GL502VS-FY032T LG Philips LP156WF6-SPB6 (LGD046F), , 1920x1080, 15.6" | Schenker XMG P507 LG Philips LP156WF6 (LGD046F), , 1920x1080, 15.6" | Aorus X5 v6 2880x1620, 15.6" | Acer Predator 15 G9-592-7925 LG Philips LP156WF6-SPP1 (LGD04D5), , 1920x1080, 15.6" | |
|---|---|---|---|---|---|---|
| Display | 1% | -0% | 0% | 1% | -2% | |
| Display P3 Coverage (%) | 63.6 | 64.6 2% | 64.5 1% | 64.5 1% | 62.5 -2% | 63 -1% |
| sRGB Coverage (%) | 83.9 | 84.6 1% | 83.1 -1% | 83.4 -1% | 86.2 3% | 82.2 -2% |
| AdobeRGB 1998 Coverage (%) | 61.3 | 61.8 1% | 60.8 -1% | 61 0% | 62.5 2% | 60.1 -2% |
| Response Times | 8% | -1% | 3% | -13% | -10% | |
| Response Time Grey 50% / Grey 80% * (ms) | 35 ? | 34 ? 3% | 38 ? -9% | 36 ? -3% | 34 ? 3% | 43 ? -23% |
| Response Time Black / White * (ms) | 25 ? | 22 ? 12% | 23 ? 8% | 23 ? 8% | 32 ? -28% | 24 ? 4% |
| PWM Frequency (Hz) | 198.4 | |||||
| Screen | 3% | -8% | -10% | -9% | -11% | |
| Brightness middle (cd/m²) | 273 | 273 0% | 315 15% | 288 5% | 280.4 3% | 302 11% |
| Brightness (cd/m²) | 267 | 278 4% | 290 9% | 292 9% | 271 1% | 287 7% |
| Brightness Distribution (%) | 83 | 88 6% | 85 2% | 87 5% | 83 0% | 91 10% |
| Black Level * (cd/m²) | 0.27 | 0.27 -0% | 0.32 -19% | 0.3 -11% | 0.249 8% | 0.36 -33% |
| Contrast (:1) | 1011 | 1011 0% | 984 -3% | 960 -5% | 1126 11% | 839 -17% |
| Colorchecker dE 2000 * | 3.77 | 3.67 3% | 4.88 -29% | 5.1 -35% | 4.94 -31% | 4.93 -31% |
| Colorchecker dE 2000 max. * | 10.64 | 8.33 22% | 8.88 17% | 9.44 11% | 8.13 24% | 12.34 -16% |
| Greyscale dE 2000 * | 2.48 | 2.73 -10% | 4.17 -68% | 4.43 -79% | 5.13 -107% | 3.47 -40% |
| Gamma | 2.37 93% | 2.49 88% | 2.53 87% | 2.46 89% | 2.26 97% | 2.16 102% |
| CCT | 6854 95% | 7029 92% | 6683 97% | 6687 97% | 7433 87% | 6622 98% |
| Color Space (Percent of AdobeRGB 1998) (%) | 55 | 55 0% | 55 0% | 55 0% | 55.9 2% | 54 -2% |
| Color Space (Percent of sRGB) (%) | 84 | 84 0% | 83 -1% | 83 -1% | 85.9 2% | 82 -2% |
| Média Total (Programa/Configurações) | 4% /
3% | -3% /
-5% | -2% /
-6% | -7% /
-7% | -8% /
-9% |
* ... menor é melhor
Exibir tempos de resposta
| ↔ Tempo de resposta preto para branco | ||
|---|---|---|
| 25 ms ... ascensão ↗ e queda ↘ combinadas | ↗ 5 ms ascensão | 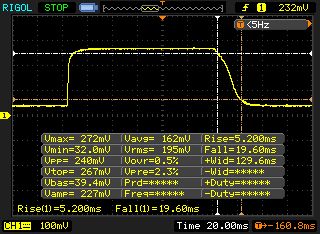 |
| ↘ 20 ms queda | ||
| A tela mostra taxas de resposta relativamente lentas em nossos testes e pode ser muito lenta para os jogadores. Em comparação, todos os dispositivos testados variam de 0.1 (mínimo) a 240 (máximo) ms. » 59 % de todos os dispositivos são melhores. Isso significa que o tempo de resposta medido é pior que a média de todos os dispositivos testados (19.8 ms). | ||
| ↔ Tempo de resposta 50% cinza a 80% cinza | ||
| 35 ms ... ascensão ↗ e queda ↘ combinadas | ↗ 14 ms ascensão | 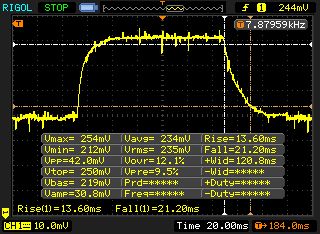 |
| ↘ 21 ms queda | ||
| A tela mostra taxas de resposta lentas em nossos testes e será insatisfatória para os jogadores. Em comparação, todos os dispositivos testados variam de 0.165 (mínimo) a 636 (máximo) ms. » 49 % de todos os dispositivos são melhores. Isso significa que o tempo de resposta medido é pior que a média de todos os dispositivos testados (30.9 ms). | ||
Cintilação da tela / PWM (modulação por largura de pulso)
| Tela tremeluzindo / PWM não detectado | 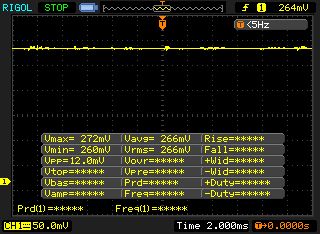 | ||
[pwm_comparison] Em comparação: 52 % de todos os dispositivos testados não usam PWM para escurecer a tela. Se PWM foi detectado, uma média de 7747 (mínimo: 5 - máximo: 343500) Hz foi medida. | |||
| PCMark 7 - Score | |
| Acer Predator 15 G9-593-765Q | |
| Schenker XMG P507 | |
| Acer Predator 15 G9-592-7925 | |
| MSI GT62VR-6RE16H21 | |
| PCMark 8 | |
| Home Score Accelerated v2 | |
| Aorus X5 v6 | |
| Acer Predator 15 G9-593-765Q | |
| Asus Strix GL502VS-FY032T | |
| MSI GT62VR-6RE16H21 | |
| Work Score Accelerated v2 | |
| Acer Predator 15 G9-593-765Q | |
| Aorus X5 v6 | |
| Asus Strix GL502VS-FY032T | |
| MSI GT62VR-6RE16H21 | |
| PCMark 7 Score | 6520 pontos | |
| PCMark 8 Home Score Accelerated v2 | 4692 pontos | |
| PCMark 8 Creative Score Accelerated v2 | 7680 pontos | |
| PCMark 8 Work Score Accelerated v2 | 5088 pontos | |
Ajuda | ||
| Acer Predator 15 G9-593-765Q LiteOn CV1-8B512 | MSI GT62VR-6RE16H21 Toshiba HG6 THNSNJ256G8NY | Asus Strix GL502VS-FY032T SanDisk SD8SNAT256G1002 | Schenker XMG P507 Samsung SM951 MZVPV256HDGL m.2 PCI-e | Aorus X5 v6 Samsung SM951 MZVPV256 m.2 | Acer Predator 15 G9-592-7925 Samsung SSD PM871 MZNLN512HCJH | |
|---|---|---|---|---|---|---|
| CrystalDiskMark 3.0 | 5% | -20% | 150% | 141% | 13% | |
| Read Seq (MB/s) | 517 | 523 1% | 485.4 -6% | 1857 259% | 1565 203% | 510 -1% |
| Write Seq (MB/s) | 449.7 | 485.5 8% | 312.4 -31% | 1240 176% | 1275 184% | 455.3 1% |
| Read 512 (MB/s) | 355.3 | 444.7 25% | 294.8 -17% | 971 173% | 990 179% | 415.9 17% |
| Write 512 (MB/s) | 433.7 | 471.2 9% | 287.8 -34% | 1239 186% | 1221 182% | 422.3 -3% |
| Read 4k (MB/s) | 27.69 | 21.86 -21% | 21.44 -23% | 54.1 95% | 53 91% | 32.46 17% |
| Write 4k (MB/s) | 72.9 | 98.8 36% | 75.7 4% | 167.4 130% | 158.8 118% | 92.5 27% |
| Read 4k QD32 (MB/s) | 290.9 | 350.3 20% | 149.4 -49% | 695 139% | 688 137% | 358.6 23% |
| Write 4k QD32 (MB/s) | 273.8 | 162.2 -41% | 256.3 -6% | 386.8 41% | 358.7 31% | 329.1 20% |

| 3DMark 11 - 1280x720 Performance GPU | |
| MSI GT73VR 6RF | |
| Aorus X5 v6 | |
| Acer Predator 15 G9-593-765Q | |
| MSI GT62VR-6RE16H21 | |
| Asus Strix GL502VS-FY032T | |
| Schenker XMG P507 | |
| Acer Predator 15 G9-592-7925 | |
| 3DMark | |
| 1920x1080 Fire Strike Graphics | |
| MSI GT73VR 6RF | |
| Aorus X5 v6 | |
| Acer Predator 15 G9-593-765Q | |
| MSI GT62VR-6RE16H21 | |
| Asus Strix GL502VS-FY032T | |
| Schenker XMG P507 | |
| Acer Predator 15 G9-592-7925 | |
| 2560x1440 Time Spy Graphics | |
| Acer Predator 15 G9-593-765Q | |
| MSI GT62VR-6RE16H21 | |
| Schenker XMG P507 | |
| 3DMark 11 Performance | 15768 pontos | |
| 3DMark Ice Storm Standard Score | 118595 pontos | |
| 3DMark Cloud Gate Standard Score | 24262 pontos | |
| 3DMark Fire Strike Score | 12973 pontos | |
| 3DMark Time Spy Score | 5013 pontos | |
Ajuda | ||
| The Witcher 3 - 1920x1080 Ultra Graphics & Postprocessing (HBAO+) | |
| Acer Predator 15 G9-593-765Q | |
| MSI GT62VR-6RE16H21 | |
| Asus Strix GL502VS-FY032T | |
| Schenker XMG P507 | |
| Rise of the Tomb Raider - 1920x1080 Very High Preset AA:FX AF:16x | |
| Aorus X5 v6 | |
| Acer Predator 15 G9-593-765Q | |
| Asus Strix GL502VS-FY032T | |
| MSI GT62VR-6RE16H21 | |
| Schenker XMG P507 | |
| baixo | média | alto | ultra | |
|---|---|---|---|---|
| The Witcher 3 (2015) | 110.8 | 60 | ||
| Rise of the Tomb Raider (2016) | 116.2 | 96.7 | ||
| Deus Ex Mankind Divided (2016) | 81.3 | 43.2 | ||
| Call of Duty Infinite Warfare (2016) | 120.3 | 116.1 |
Barulho
| Ocioso |
| 31 / 35 / 38 dB |
| HDD |
| 34 dB |
| Carga |
| 43 / 49 dB |
 | ||
30 dB silencioso 40 dB(A) audível 50 dB(A) ruidosamente alto |
||
min: | ||
| Acer Predator 15 G9-593-765Q 6700HQ, GeForce GTX 1070 Mobile | Acer Predator 15 G9-592-7925 6700HQ, GeForce GTX 970M | MSI GT62VR-6RE16H21 6700HQ, GeForce GTX 1070 Mobile | Asus Strix GL502VS-FY032T 6700HQ, GeForce GTX 1070 Mobile | Schenker XMG P507 6700HQ, GeForce GTX 1060 Mobile | Aorus X5 v6 6820HK, GeForce GTX 1070 Mobile | |
|---|---|---|---|---|---|---|
| Noise | 5% | 5% | 3% | 0% | -7% | |
| desligado / ambiente * (dB) | 30 | 30 -0% | 30 -0% | 30 -0% | 29.3 2% | |
| Idle Minimum * (dB) | 31 | 31 -0% | 32 -3% | 32 -3% | 31 -0% | 33.4 -8% |
| Idle Average * (dB) | 35 | 32 9% | 33 6% | 33 6% | 32 9% | 35.2 -1% |
| Idle Maximum * (dB) | 38 | 36 5% | 34 11% | 34 11% | 38 -0% | 35.2 7% |
| Load Average * (dB) | 43 | 40 7% | 40 7% | 39 9% | 46 -7% | 53.3 -24% |
| Load Maximum * (dB) | 49 | 47 4% | 46 6% | 51 -4% | 49 -0% | 57.6 -18% |
* ... menor é melhor
(±) A temperatura máxima no lado superior é 40.5 °C / 105 F, em comparação com a média de 40.4 °C / 105 F , variando de 21.2 a 68.8 °C para a classe Gaming.
(±) A parte inferior aquece até um máximo de 42 °C / 108 F, em comparação com a média de 43.2 °C / 110 F
(+) Em uso inativo, a temperatura média para o lado superior é 25.6 °C / 78 F, em comparação com a média do dispositivo de 33.9 °C / ### class_avg_f### F.
(+) Os apoios para as mãos e o touchpad são mais frios que a temperatura da pele, com um máximo de 29.9 °C / 85.8 F e, portanto, são frios ao toque.
(±) A temperatura média da área do apoio para as mãos de dispositivos semelhantes foi 28.8 °C / 83.8 F (-1.1 °C / -2 F).
| Acer Predator 15 G9-593-765Q 6700HQ, GeForce GTX 1070 Mobile | Acer Predator 15 G9-592-7925 6700HQ, GeForce GTX 970M | MSI GT62VR-6RE16H21 6700HQ, GeForce GTX 1070 Mobile | Asus Strix GL502VS-FY032T 6700HQ, GeForce GTX 1070 Mobile | Schenker XMG P507 6700HQ, GeForce GTX 1060 Mobile | Aorus X5 v6 6820HK, GeForce GTX 1070 Mobile | |
|---|---|---|---|---|---|---|
| Heat | 3% | -13% | -19% | -21% | -39% | |
| Maximum Upper Side * (°C) | 40.5 | 42.6 -5% | 44 -9% | 48 -19% | 49.3 -22% | 57 -41% |
| Maximum Bottom * (°C) | 42 | 38.7 8% | 53.1 -26% | 46.8 -11% | 52.7 -25% | 54 -29% |
| Idle Upper Side * (°C) | 28.2 | 27.2 4% | 28.8 -2% | 33.7 -20% | 32.6 -16% | 36.2 -28% |
| Idle Bottom * (°C) | 24.3 | 22.8 6% | 28.2 -16% | 30.5 -26% | 29.5 -21% | 38 -56% |
* ... menor é melhor
Acer Predator 15 G9-593-765Q análise de áudio
(+) | os alto-falantes podem tocar relativamente alto (###valor### dB)
Graves 100 - 315Hz
(-) | quase nenhum baixo - em média 16.8% menor que a mediana
(±) | a linearidade dos graves é média (8.2% delta para a frequência anterior)
Médios 400 - 2.000 Hz
(+) | médios equilibrados - apenas 2.7% longe da mediana
(+) | médios são lineares (4.9% delta para frequência anterior)
Altos 2 - 16 kHz
(+) | agudos equilibrados - apenas 2.6% longe da mediana
(+) | os máximos são lineares (3.1% delta da frequência anterior)
Geral 100 - 16.000 Hz
(+) | o som geral é linear (13% diferença em relação à mediana)
Comparado com a mesma classe
» 18% de todos os dispositivos testados nesta classe foram melhores, 3% semelhantes, 79% piores
» O melhor teve um delta de 6%, a média foi 18%, o pior foi 132%
Comparado com todos os dispositivos testados
» 13% de todos os dispositivos testados foram melhores, 2% semelhantes, 85% piores
» O melhor teve um delta de 4%, a média foi 23%, o pior foi 134%
MSI GT62VR-6RE16H21 análise de áudio
(±) | o volume do alto-falante é médio, mas bom (###valor### dB)
Graves 100 - 315Hz
(±) | graves reduzidos - em média 11.3% menor que a mediana
(±) | a linearidade dos graves é média (11.4% delta para a frequência anterior)
Médios 400 - 2.000 Hz
(±) | médios mais altos - em média 8.3% maior que a mediana
(+) | médios são lineares (5.7% delta para frequência anterior)
Altos 2 - 16 kHz
(+) | agudos equilibrados - apenas 4.3% longe da mediana
(±) | a linearidade dos máximos é média (11% delta para frequência anterior)
Geral 100 - 16.000 Hz
(±) | a linearidade do som geral é média (20.5% diferença em relação à mediana)
Comparado com a mesma classe
» 73% de todos os dispositivos testados nesta classe foram melhores, 5% semelhantes, 22% piores
» O melhor teve um delta de 6%, a média foi 18%, o pior foi 132%
Comparado com todos os dispositivos testados
» 54% de todos os dispositivos testados foram melhores, 8% semelhantes, 38% piores
» O melhor teve um delta de 4%, a média foi 23%, o pior foi 134%
| desligado | |
| Ocioso | |
| Carga |
|
Key:
min: | |
| Acer Predator 15 G9-593-765Q 6700HQ, GeForce GTX 1070 Mobile | MSI GT62VR-6RE16H21 6700HQ, GeForce GTX 1070 Mobile | Asus Strix GL502VS-FY032T 6700HQ, GeForce GTX 1070 Mobile | Schenker XMG P507 6700HQ, GeForce GTX 1060 Mobile | Aorus X5 v6 6820HK, GeForce GTX 1070 Mobile | Acer Predator 15 G9-592-7925 6700HQ, GeForce GTX 970M | |
|---|---|---|---|---|---|---|
| Power Consumption | -9% | -0% | 24% | -34% | 19% | |
| Idle Minimum * (Watt) | 18 | 20 -11% | 20 -11% | 11 39% | 25 -39% | 12 33% |
| Idle Average * (Watt) | 24 | 26 -8% | 24 -0% | 16 33% | 28.9 -20% | 16 33% |
| Idle Maximum * (Watt) | 29 | 32 -10% | 29 -0% | 21 28% | 30.1 -4% | 22 24% |
| Load Average * (Watt) | 86 | 100 -16% | 86 -0% | 80 7% | 167.3 -95% | 96 -12% |
| Load Maximum * (Watt) | 201 | 202 -0% | 183 9% | 174 13% | 222.6 -11% | 166 17% |
* ... menor é melhor
| Acer Predator 15 G9-593-765Q 6700HQ, GeForce GTX 1070 Mobile | MSI GT62VR-6RE16H21 6700HQ, GeForce GTX 1070 Mobile | Asus Strix GL502VS-FY032T 6700HQ, GeForce GTX 1070 Mobile | Schenker XMG P507 6700HQ, GeForce GTX 1060 Mobile | Aorus X5 v6 6820HK, GeForce GTX 1070 Mobile | Acer Predator 15 G9-592-7925 6700HQ, GeForce GTX 970M | |
|---|---|---|---|---|---|---|
| Duração da bateria | -16% | -39% | 4% | -24% | 65% | |
| H.264 (h) | 5 | |||||
| WiFi v1.3 (h) | 4.8 | 4.1 -15% | 3.3 -31% | 4.6 -4% | 3 -37% | 7.9 65% |
| Load (h) | 1.9 | 1.6 -16% | 1 -47% | 2.1 11% | 1.7 -11% |
Pro
Contra
O novo Predator 15 G9-593 da Acer é uma boa evolução das dois modelos anteriores – pelo menos em termos de componentes. Suficiente desempenho é garantido pela nova GeForce GTX 1070, a boa tela IPS finalmente suporta G-Sync e as portas também estão atualizadas. Em nossa opinião, que as durações da bateria agora sejam mais curtas do que antes, não é uma grande desvantagem.
A Acer poderia melhorar o sistema de som. As medições não são tão ruins e os módulos também conseguem um bom volume máximo, mas o som resultante infelizmente não é muito convincente devido à falta e baixos. Outra pequena crítica concerne ao SSD, porque a Acer anda utiliza uma unidade SATA-III. O fabricante também poderia considerar telas de maior resolução para futuras iterações, considerando o desempenho aumentado da GPU.
Muito desempenho, baixas temperaturas, boa tela e bons dispositivos de entrada – se você não tiver problemas com o design e planeja utilizar o seu portátil para jogos de forma estacionária a maior parte de tempo, então o Predator 15 G9-593 é uma boa escolha.
Exceto pelo design – onde as opiniões ainda diferirão – a carcaça é muito robusta e pesada, inclusive para um portátil de jogos. E também está o Frost Core, que garante um pousa palmas frio durante os jogos, mas a sua ventoinha é um pouco irritante, na prática. Se não estiver jogando, deve retirá-lo. Em resumo, no entanto, estes são apenas pequenos pontos de crítica, e nós definitivamente tivemos uma impressão positiva depois da análise. O Predator 15 G9-593 é um bom portátil para jogos, embora o nosso modelo de teste com o grande SSD não é uma barganha dentro do grupo de comparação.
Acer Predator 15 G9-593-765Q
- 12/10/2016 v6 (old)
Andreas Osthoff
Price comparison
