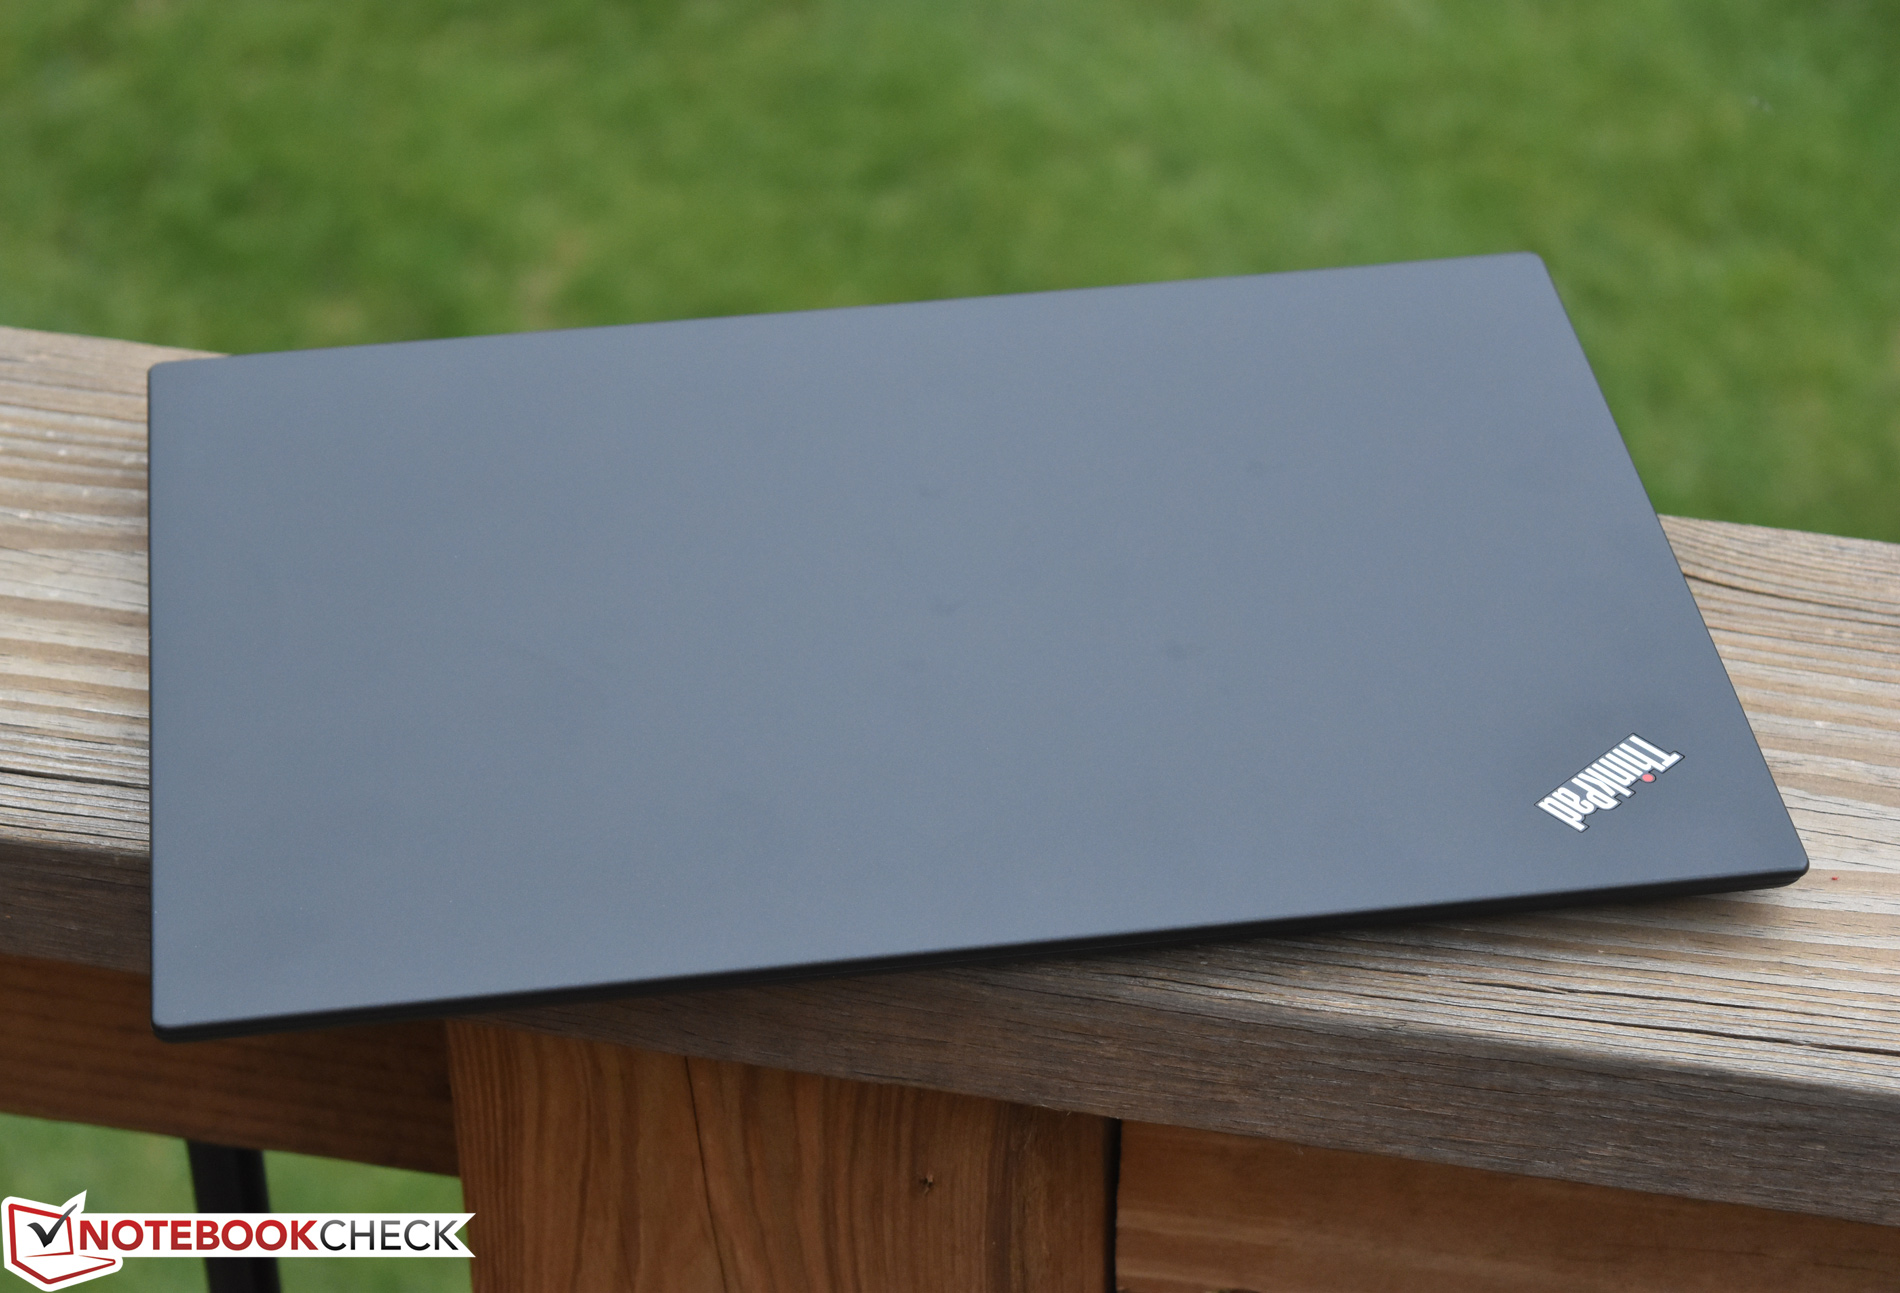
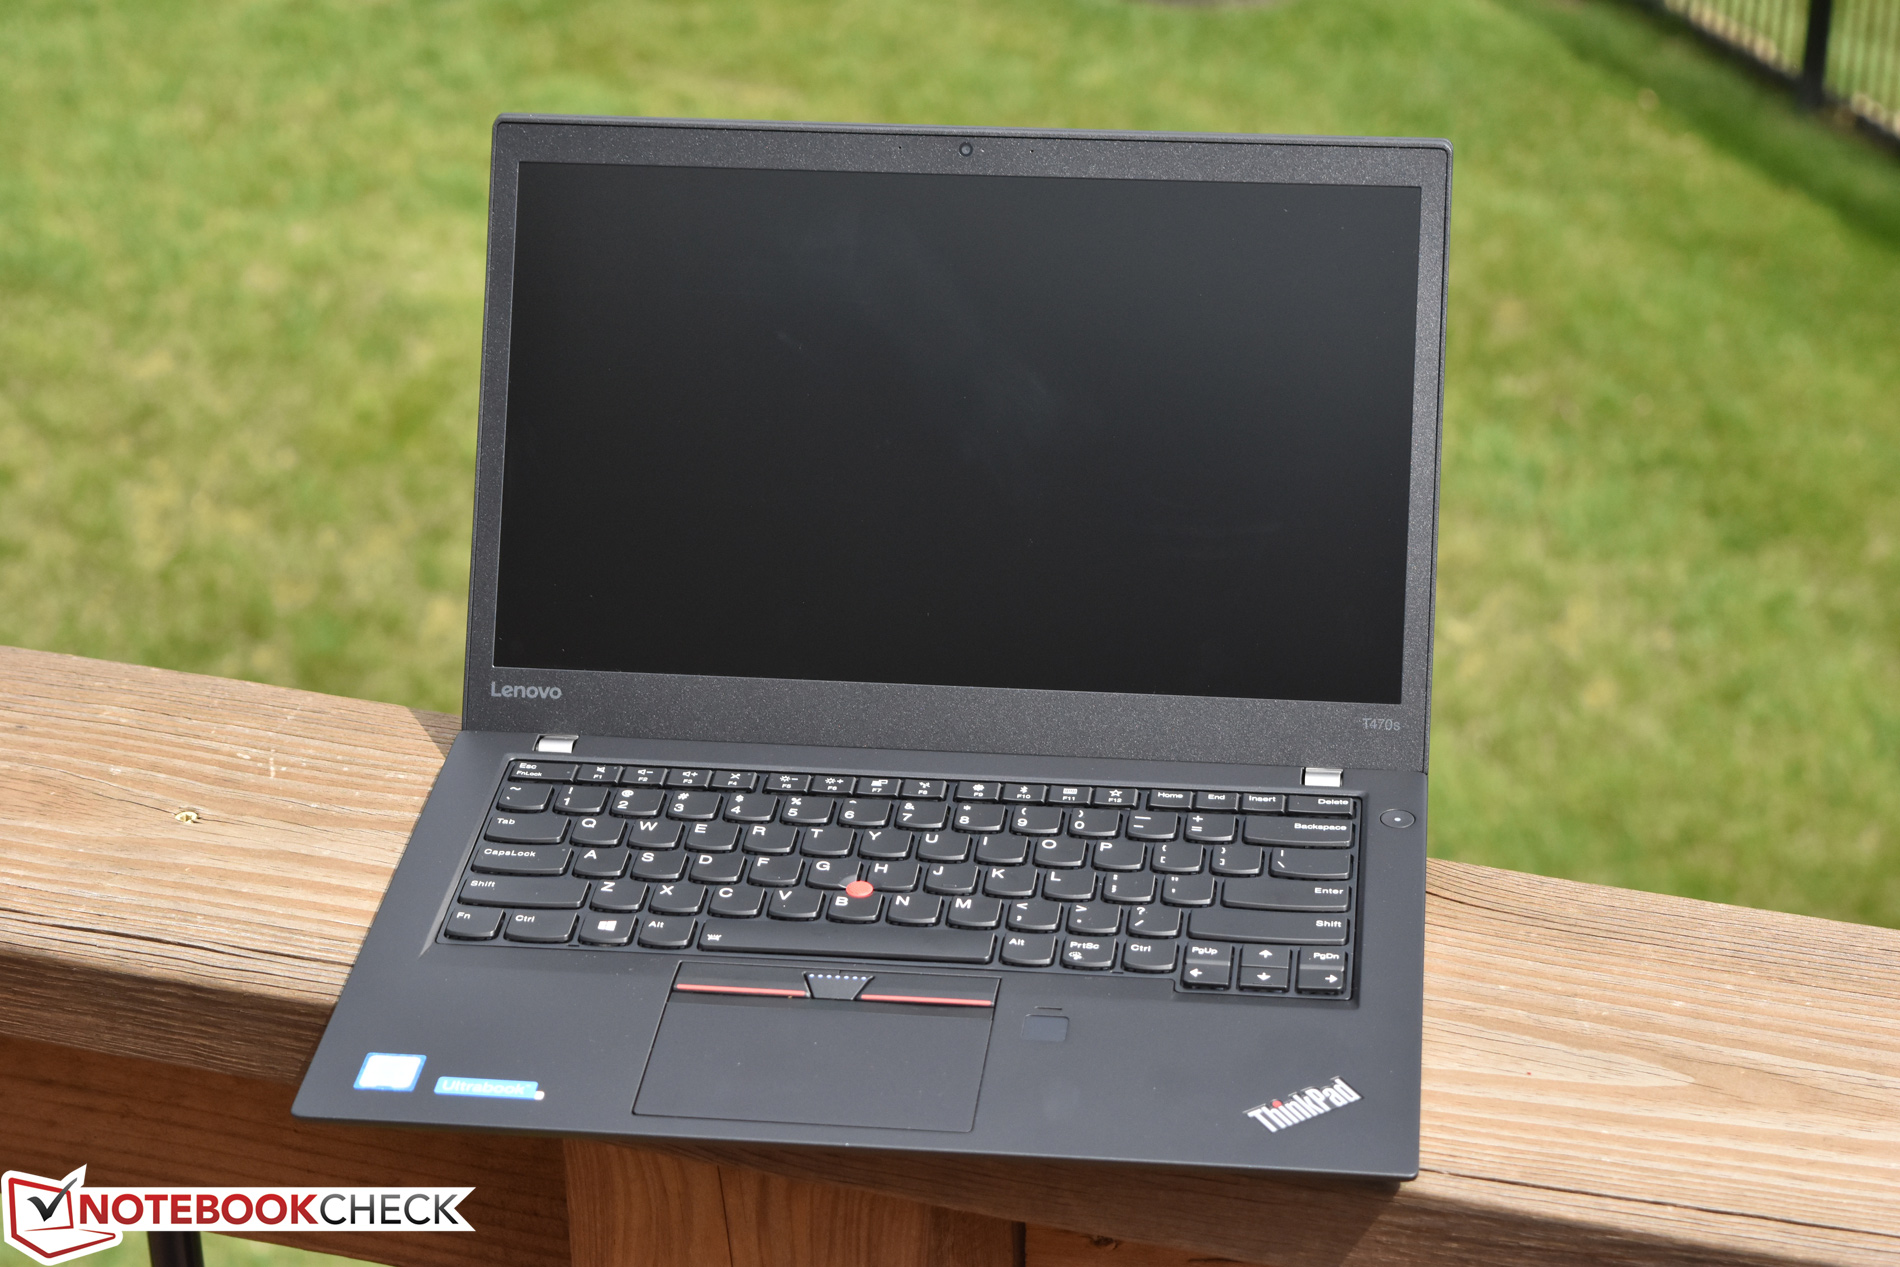
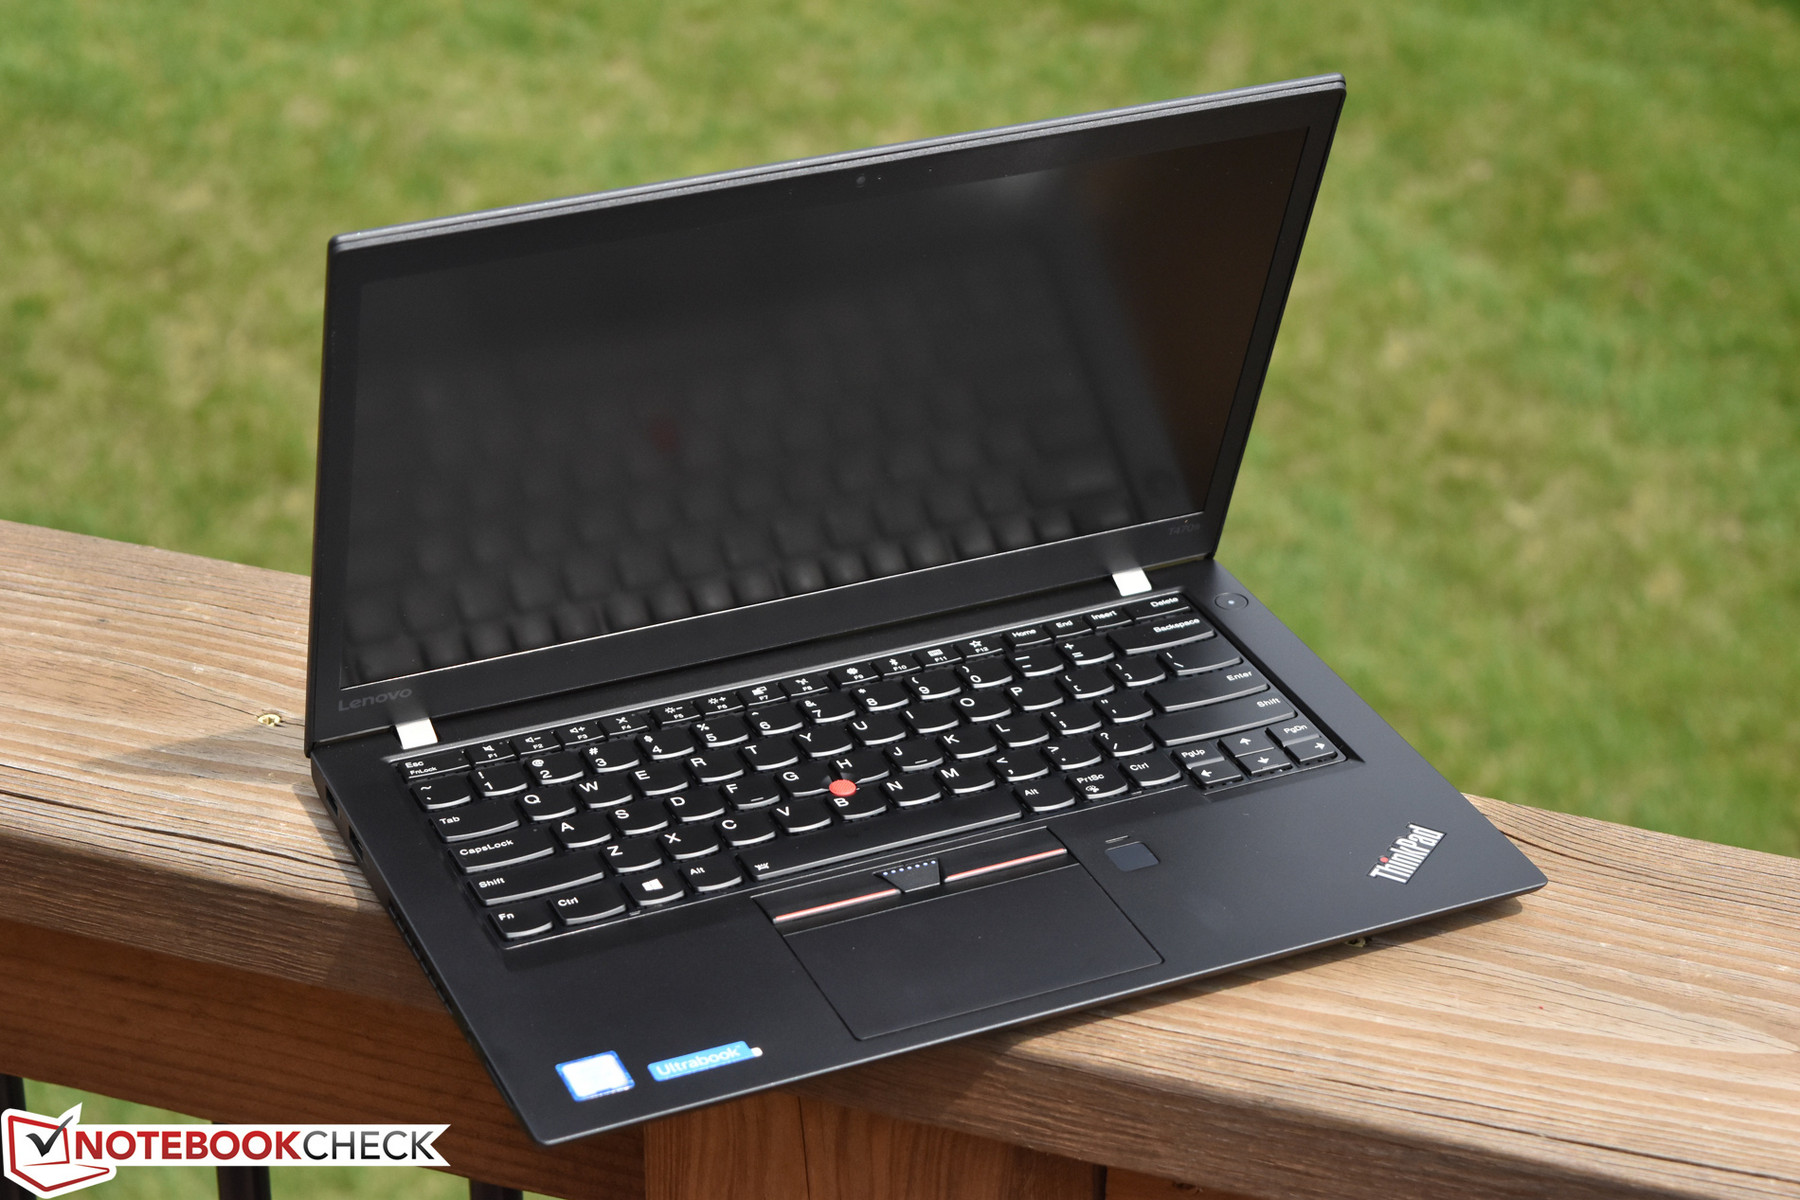
Breve Análise do Portátil Lenovo ThinkPad T470s (7300U, FHD)
| SD Card Reader | |
| average JPG Copy Test (av. of 3 runs) | |
| Lenovo ThinkPad T470s-20HGS00V00 | |
| Lenovo ThinkPad T470-20HD002HGE | |
| Dell Latitude 7480 | |
| Lenovo ThinkPad T470s-20HF0012US | |
| Lenovo ThinkPad X1 Carbon 2017-20HQS03P00 | |
| maximum AS SSD Seq Read Test (1GB) | |
| Dell Latitude 7480 | |
| Lenovo ThinkPad T470s-20HF0012US | |
| Lenovo ThinkPad T470s-20HGS00V00 | |
| Lenovo ThinkPad T470-20HD002HGE | |
| Lenovo ThinkPad X1 Carbon 2017-20HQS03P00 | |
| |||||||||||||||||||||||||
iluminação: 88 %
iluminação com acumulador: 271.6 cd/m²
Contraste: 1132:1 (Preto: 0.24 cd/m²)
ΔE ColorChecker Calman: 6.1 | ∀{0.5-29.43 Ø4.71}
ΔE Greyscale Calman: 3.4 | ∀{0.09-98 Ø4.96}
60% sRGB (Argyll 1.6.3 3D)
38% AdobeRGB 1998 (Argyll 1.6.3 3D)
41.72% AdobeRGB 1998 (Argyll 3D)
60.3% sRGB (Argyll 3D)
40.35% Display P3 (Argyll 3D)
Gamma: 2.12
CCT: 6077 K
| Lenovo ThinkPad T470s-20HF0012US LEN40A9 (R140NWF5 R1), IPS, 14", 1920x1080 | Lenovo ThinkPad T470s-20HGS00V00 B140QAN01.5, IPS, 14", 2560x1440 | Dell Latitude 7480 LG Philips LGD0557, IPS, 14", 1920x1080 | Lenovo ThinkPad T470-20HD002HGE N140HCA-EAB, IPS, 14", 1920x1080 | Lenovo ThinkPad X1 Carbon 2017-20HQS03P00 B140HAN03_1, IPS, 14", 1920x1080 | |
|---|---|---|---|---|---|
| Display | 65% | 58% | 3% | 48% | |
| Display P3 Coverage (%) | 40.35 | 69 71% | 65.4 62% | 41.6 3% | 61.4 52% |
| sRGB Coverage (%) | 60.3 | 95.1 58% | 92.3 53% | 61.9 3% | 85.9 42% |
| AdobeRGB 1998 Coverage (%) | 41.72 | 69.6 67% | 65.8 58% | 43.06 3% | 62.4 50% |
| Response Times | -7% | -4% | -10% | -6% | |
| Response Time Grey 50% / Grey 80% * (ms) | 40.8 ? | 46.4 ? -14% | 40.8 ? -0% | 41.6 ? -2% | 41.6 ? -2% |
| Response Time Black / White * (ms) | 28.8 ? | 28.8 ? -0% | 31.2 ? -8% | 34 ? -18% | 31.6 ? -10% |
| PWM Frequency (Hz) | 219.3 ? | ||||
| Screen | 7% | 29% | -3% | 12% | |
| Brightness middle (cd/m²) | 271.6 | 327 20% | 344 27% | 306 13% | 311 15% |
| Brightness (cd/m²) | 264 | 311 18% | 321 22% | 287 9% | 288 9% |
| Brightness Distribution (%) | 88 | 88 0% | 85 -3% | 88 0% | 85 -3% |
| Black Level * (cd/m²) | 0.24 | 0.25 -4% | 0.32 -33% | 0.3 -25% | 0.24 -0% |
| Contrast (:1) | 1132 | 1308 16% | 1075 -5% | 1020 -10% | 1296 14% |
| Colorchecker dE 2000 * | 6.1 | 6.1 -0% | 2.6 57% | 6.2 -2% | 5.5 10% |
| Colorchecker dE 2000 max. * | 28.6 | 12.2 57% | 7.8 73% | 13.6 52% | 9 69% |
| Greyscale dE 2000 * | 3.4 | 8.8 -159% | 2.6 24% | 5.8 -71% | 6.2 -82% |
| Gamma | 2.12 104% | 2.18 101% | 2.28 96% | 2.04 108% | 2.02 109% |
| CCT | 6077 107% | 6172 105% | 7050 92% | 6277 104% | 5950 109% |
| Color Space (Percent of AdobeRGB 1998) (%) | 38 | 61.56 62% | 65.82 73% | 39.62 4% | 55.96 47% |
| Color Space (Percent of sRGB) (%) | 60 | 94.88 58% | 92.27 54% | 61.44 2% | 85.77 43% |
| Média Total (Programa/Configurações) | 22% /
17% | 28% /
30% | -3% /
-3% | 18% /
17% |
* ... menor é melhor
Exibir tempos de resposta
| ↔ Tempo de resposta preto para branco | ||
|---|---|---|
| 28.8 ms ... ascensão ↗ e queda ↘ combinadas | ↗ 14.8 ms ascensão | 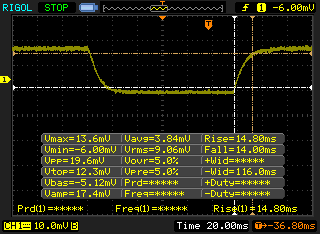 |
| ↘ 14 ms queda | ||
| A tela mostra taxas de resposta relativamente lentas em nossos testes e pode ser muito lenta para os jogadores. Em comparação, todos os dispositivos testados variam de 0.1 (mínimo) a 240 (máximo) ms. » 76 % de todos os dispositivos são melhores. Isso significa que o tempo de resposta medido é pior que a média de todos os dispositivos testados (19.8 ms). | ||
| ↔ Tempo de resposta 50% cinza a 80% cinza | ||
| 40.8 ms ... ascensão ↗ e queda ↘ combinadas | ↗ 22.8 ms ascensão | 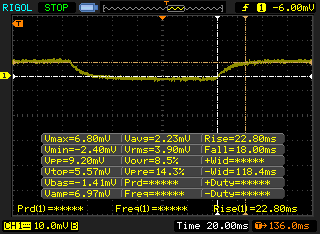 |
| ↘ 18 ms queda | ||
| A tela mostra taxas de resposta lentas em nossos testes e será insatisfatória para os jogadores. Em comparação, todos os dispositivos testados variam de 0.165 (mínimo) a 636 (máximo) ms. » 64 % de todos os dispositivos são melhores. Isso significa que o tempo de resposta medido é pior que a média de todos os dispositivos testados (31 ms). | ||
Cintilação da tela / PWM (modulação por largura de pulso)
| Tela tremeluzindo/PWM detectado | 219.3 Hz | ≤ 99 % configuração de brilho | 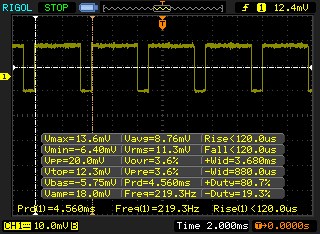 |
A luz de fundo da tela pisca em 219.3 Hz (pior caso, por exemplo, utilizando PWM) Cintilação detectada em uma configuração de brilho de 99 % e abaixo. Não deve haver cintilação ou PWM acima desta configuração de brilho. A frequência de 219.3 Hz é relativamente baixa, portanto, usuários sensíveis provavelmente notarão cintilação e sentirão fadiga ocular na configuração de brilho indicada e abaixo. [pwm_comparison] Em comparação: 52 % de todos os dispositivos testados não usam PWM para escurecer a tela. Se PWM foi detectado, uma média de 7747 (mínimo: 5 - máximo: 343500) Hz foi medida. | |||
| wPrime 2.10 - 1024m | |
| Dell Latitude 7480 | |
| Lenovo ThinkPad T470s-20HF0012US | |
| Lenovo ThinkPad T470s-20HGS00V00 | |
* ... menor é melhor
| PCMark 8 Home Score Accelerated v2 | 3987 pontos | |
| PCMark 8 Creative Score Accelerated v2 | 4910 pontos | |
| PCMark 8 Work Score Accelerated v2 | 4999 pontos | |
Ajuda | ||
| Lenovo ThinkPad T470s-20HF0012US Samsung PM961 MZVLW256HEHP | Lenovo ThinkPad T470s-20HGS00V00 Samsung SSD PM961 1TB M.2 PCIe 3.0 x4 NVMe (MZVLW1T0) | Dell Latitude 7480 Intel SSDSCKKF256H6 | Lenovo ThinkPad T470-20HD002HGE Samsung PM961 NVMe MZVLW512HMJP | Lenovo ThinkPad X1 Carbon 2017-20HQS03P00 Samsung PM961 NVMe MZVLW512HMJP | |
|---|---|---|---|---|---|
| CrystalDiskMark 3.0 | 12% | -56% | -10% | 10% | |
| Read Seq (MB/s) | 1399 | 1760 26% | 486.5 -65% | 1155 -17% | 1827 31% |
| Write Seq (MB/s) | 1213 | 1666 37% | 418.6 -65% | 1076 -11% | 1383 14% |
| Read 512 (MB/s) | 831 | 832 0% | 354.3 -57% | 811 -2% | 814 -2% |
| Write 512 (MB/s) | 856 | 1064 24% | 306.8 -64% | 862 1% | 1098 28% |
| Read 4k (MB/s) | 60.7 | 53.2 -12% | 29.25 -52% | 55.5 -9% | 61 0% |
| Write 4k (MB/s) | 159.2 | 167.4 5% | 90.5 -43% | 134.6 -15% | 172.2 8% |
| Read 4k QD32 (MB/s) | 580 | 630 9% | 280.2 -52% | 496.2 -14% | 601 4% |
| Write 4k QD32 (MB/s) | 499.4 | 533 7% | 252.8 -49% | 425.4 -15% | 495.6 -1% |

| 3DMark | |
| 1280x720 Cloud Gate Standard Graphics | |
| Lenovo ThinkPad T470s-20HGS00V00 | |
| Lenovo ThinkPad X1 Carbon 2017-20HQS03P00 | |
| Lenovo ThinkPad T470s-20HF0012US | |
| Dell Latitude 7480 | |
| Lenovo ThinkPad T470-20HD002HGE | |
| 1920x1080 Fire Strike Graphics | |
| Lenovo ThinkPad T470s-20HGS00V00 | |
| Lenovo ThinkPad X1 Carbon 2017-20HQS03P00 | |
| Lenovo ThinkPad T470s-20HF0012US | |
| Dell Latitude 7480 | |
| Lenovo ThinkPad T470-20HD002HGE | |
| 1920x1080 Ice Storm Extreme Graphics | |
| Dell Latitude 7480 | |
| 3DMark 06 Standard Score | 9671 pontos | |
| 3DMark 11 Performance | 1741 pontos | |
| 3DMark Ice Storm Standard Score | 67756 pontos | |
| 3DMark Cloud Gate Standard Score | 6945 pontos | |
| 3DMark Fire Strike Score | 971 pontos | |
Ajuda | ||
| baixo | média | alto | ultra | |
|---|---|---|---|---|
| BioShock Infinite (2013) | 54.6 | 31.7 | 26 | 8.2 |
Barulho
| Ocioso |
| 27.8 / 27.8 / 27.8 dB |
| Carga |
| 34.8 / 42 dB |
 | ||
30 dB silencioso 40 dB(A) audível 50 dB(A) ruidosamente alto |
||
min: | ||
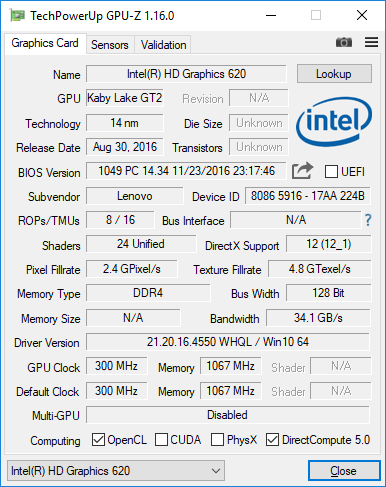
| Lenovo ThinkPad T470s-20HF0012US HD Graphics 620, i5-7300U, Samsung PM961 MZVLW256HEHP | Lenovo ThinkPad T470s-20HGS00V00 HD Graphics 620, i7-7600U, Samsung SSD PM961 1TB M.2 PCIe 3.0 x4 NVMe (MZVLW1T0) | Dell Latitude 7480 HD Graphics 620, i7-7600U, Intel SSDSCKKF256H6 | Lenovo ThinkPad T470-20HD002HGE HD Graphics 620, i5-7200U, Samsung PM961 NVMe MZVLW512HMJP | Lenovo ThinkPad X1 Carbon 2017-20HQS03P00 HD Graphics 620, i7-7500U, Samsung PM961 NVMe MZVLW512HMJP | |
|---|---|---|---|---|---|
| Noise | -4% | 6% | 3% | -4% | |
| desligado / ambiente * (dB) | 27.8 | 28.9 -4% | 28 -1% | 29.3 -5% | |
| Idle Minimum * (dB) | 27.8 | 28.9 -4% | 28.6 -3% | 28 -1% | 29.3 -5% |
| Idle Average * (dB) | 27.8 | 28.9 -4% | 28.6 -3% | 28 -1% | 29.3 -5% |
| Idle Maximum * (dB) | 27.8 | 30.1 -8% | 28.6 -3% | 29.4 -6% | 32.2 -16% |
| Load Average * (dB) | 34.8 | 39.2 -13% | 30.2 13% | 31.4 10% | 34.3 1% |
| Witcher 3 ultra * (dB) | 42 | ||||
| Load Maximum * (dB) | 42 | 39.2 7% | 31.2 26% | 34.6 18% | 39.3 6% |
* ... menor é melhor
(-) A temperatura máxima no lado superior é 45.4 °C / 114 F, em comparação com a média de 34.3 °C / 94 F , variando de 21.2 a 62.5 °C para a classe Office.
(-) A parte inferior aquece até um máximo de 51.2 °C / 124 F, em comparação com a média de 36.8 °C / 98 F
(+) Em uso inativo, a temperatura média para o lado superior é 24 °C / 75 F, em comparação com a média do dispositivo de 29.5 °C / ### class_avg_f### F.
(+) Os apoios para as mãos e o touchpad estão atingindo a temperatura máxima da pele (33.8 °C / 92.8 F) e, portanto, não estão quentes.
(-) A temperatura média da área do apoio para as mãos de dispositivos semelhantes foi 27.5 °C / 81.5 F (-6.3 °C / -11.3 F).
Lenovo ThinkPad T470s-20HF0012US análise de áudio
(±) | o volume do alto-falante é médio, mas bom (###valor### dB)
Graves 100 - 315Hz
(-) | quase nenhum baixo - em média 15.3% menor que a mediana
(±) | a linearidade dos graves é média (14.1% delta para a frequência anterior)
Médios 400 - 2.000 Hz
(+) | médios equilibrados - apenas 3.2% longe da mediana
(±) | a linearidade dos médios é média (11% delta para frequência anterior)
Altos 2 - 16 kHz
(+) | agudos equilibrados - apenas 4.4% longe da mediana
(±) | a linearidade dos máximos é média (12.5% delta para frequência anterior)
Geral 100 - 16.000 Hz
(±) | a linearidade do som geral é média (24.8% diferença em relação à mediana)
Comparado com a mesma classe
» 73% de todos os dispositivos testados nesta classe foram melhores, 7% semelhantes, 20% piores
» O melhor teve um delta de 7%, a média foi 21%, o pior foi 53%
Comparado com todos os dispositivos testados
» 76% de todos os dispositivos testados foram melhores, 5% semelhantes, 19% piores
» O melhor teve um delta de 4%, a média foi 23%, o pior foi 134%
Dell Latitude 7480 análise de áudio
(±) | o volume do alto-falante é médio, mas bom (###valor### dB)
Graves 100 - 315Hz
(±) | graves reduzidos - em média 11.9% menor que a mediana
(±) | a linearidade dos graves é média (10.6% delta para a frequência anterior)
Médios 400 - 2.000 Hz
(+) | médios equilibrados - apenas 3.8% longe da mediana
(±) | a linearidade dos médios é média (7.8% delta para frequência anterior)
Altos 2 - 16 kHz
(±) | máximos mais altos - em média 6.6% maior que a mediana
(+) | os máximos são lineares (6.3% delta da frequência anterior)
Geral 100 - 16.000 Hz
(±) | a linearidade do som geral é média (23.2% diferença em relação à mediana)
Comparado com a mesma classe
» 65% de todos os dispositivos testados nesta classe foram melhores, 8% semelhantes, 27% piores
» O melhor teve um delta de 7%, a média foi 21%, o pior foi 53%
Comparado com todos os dispositivos testados
» 70% de todos os dispositivos testados foram melhores, 5% semelhantes, 25% piores
» O melhor teve um delta de 4%, a média foi 23%, o pior foi 134%
| desligado | |
| Ocioso | |
| Carga |
|
Key:
min: | |
| Lenovo ThinkPad T470s-20HF0012US i5-7300U, HD Graphics 620, Samsung PM961 MZVLW256HEHP, IPS, 1920x1080, 14" | Lenovo ThinkPad T470s-20HGS00V00 i7-7600U, HD Graphics 620, Samsung SSD PM961 1TB M.2 PCIe 3.0 x4 NVMe (MZVLW1T0), IPS, 2560x1440, 14" | Dell Latitude 7480 i7-7600U, HD Graphics 620, Intel SSDSCKKF256H6, IPS, 1920x1080, 14" | Lenovo ThinkPad T470-20HD002HGE i5-7200U, HD Graphics 620, Samsung PM961 NVMe MZVLW512HMJP, IPS, 1920x1080, 14" | Lenovo ThinkPad X1 Carbon 2017-20HQS03P00 i7-7500U, HD Graphics 620, Samsung PM961 NVMe MZVLW512HMJP, IPS, 1920x1080, 14" | |
|---|---|---|---|---|---|
| Power Consumption | -15% | 16% | 19% | -3% | |
| Idle Minimum * (Watt) | 4.8 | 4.64 3% | 4.32 10% | 3.21 33% | 3.84 20% |
| Idle Average * (Watt) | 6.6 | 8.93 -35% | 6.27 5% | 6.15 7% | 6.3 5% |
| Idle Maximum * (Watt) | 7 | 9.12 -30% | 6.35 9% | 6.82 3% | 8.6 -23% |
| Load Average * (Watt) | 39.2 | 42.2 -8% | 29.82 24% | 28.5 27% | 41.9 -7% |
| Load Maximum * (Watt) | 44.8 | 47.3 -6% | 30.64 32% | 34.5 23% | 48.7 -9% |
* ... menor é melhor
| Lenovo ThinkPad T470s-20HF0012US i5-7300U, HD Graphics 620, 51 Wh | Lenovo ThinkPad T470s-20HGS00V00 i7-7600U, HD Graphics 620, 51 Wh | Dell Latitude 7480 i7-7600U, HD Graphics 620, 60 Wh | Lenovo ThinkPad T470-20HD002HGE i5-7200U, HD Graphics 620, 48 Wh | Lenovo ThinkPad X1 Carbon 2017-20HQS03P00 i7-7500U, HD Graphics 620, 57 Wh | |
|---|---|---|---|---|---|
| Duração da bateria | -28% | 35% | -24% | -6% | |
| Reader / Idle (h) | 17.7 | 13.1 -26% | 27.7 56% | 20.9 18% | |
| WiFi v1.3 (h) | 8.1 | 7 -14% | 12 48% | 7.3 -10% | 8.3 2% |
| Load (h) | 2.9 | 1.6 -45% | 2.9 0% | 1.8 -38% | 1.8 -38% |
Pro
Contra
Verdict
Com uma construção bem leve que é portável e durável (graças à construção híbrida de gama alta de fibra de carbono e magnésio), excelente duração da bateria, e excelentes dispositivos de entrada pelos quais a marca ThinkPad é conhecida há muito tempo, o Lenovo ThinkPad T470s FHD já deve ter a atenção de profissionais empresariais à procura de seu próximo companheiro do dia a dia. Mas adicione a isso o excelente desempenho dos aplicativos (possível ´graças a um muito veloz SSD NVMe SSD da Samsumg), sólido desempenho da CPU do chip Core i5, e fácil manutenção, e este é um dispositivo difícil de recusar.
Pontos negativos? Sim, há alguns. Para começar, a tela não é tão impressionante quanto as de muitos concorrentes, e dá um passo para trás do modelo WQHD não apenas em termos de resolução, mas também no brilho, contraste, e reprodução de cores. Detectamos PWM em todos os níveis de brilho, exceto no máximo, o qual é uma decepção para um ThinkPad. E finalmente, o aparelho esquenta rapidamente, atingindo rápido temperaturas perturbantes na carcaça (sob carga), especialmente durante o uso sobre as pernas.
Fora o desafortunado flicker PWM, qualidade baixa da tela, e um pouco de calor desagradável durante cargas de trabalho mais pesadas, o Lenovo ThinkPad T470s FHD é uma excelente escolha.
Se o usuário não se importar com uma duração da bateria ligeiramente inferior (mas ainda muito boa) e um preço mais alto, recomendamos que dê uma olhada no modelo T470s WQHD que analisamos recentemente, dado que sua tela não apenas oferece melhores brilho e cores, mas também não utiliza PWM para controlar as reduções do brilho. No entanto, a CPU Core i5 que analisamos na configuração atual parece ser um investimento mais racional, considerando o excelente desempenho e a relativa estabilidade, contra o i7 da configuração WQHD que avaliamos. O Dell Latitude 7480 também é uma ótima opção — ou, se o orçamento permite, o ThinkPad X1 Carbon. Mas, além dos problemas da tela, desde que o usuário não se importe com um pouco de calor durante as o uso mais pesado, o T470s FHD é um concorrente imediato para um dos melhores portáteis de negócios de 14 polegadas no mercado, hoje em dia.
Lenovo ThinkPad T470s-20HF0012US
- 05/13/2017 v6 (old)
Steve Schardein
Price comparison
