Breve Análise do Portátil Dell Latitude 7480 (7600U, FHD)
| SD Card Reader | |
| average JPG Copy Test (av. of 3 runs) | |
| Dell Latitude 14 7000 Series E7470 | |
| Lenovo ThinkPad T470s-20HGS00V00 | |
| Dell Latitude 7480 | |
| HP EliteBook 840 G4-Z2V49ET ABD | |
| Lenovo ThinkPad X1 Carbon 2017-20HQS03P00 | |
| maximum AS SSD Seq Read Test (1GB) | |
| Dell Latitude 14 7000 Series E7470 | |
| Dell Latitude 7480 | |
| Lenovo ThinkPad T470s-20HGS00V00 | |
| HP EliteBook 840 G4-Z2V49ET ABD | |
| Lenovo ThinkPad X1 Carbon 2017-20HQS03P00 | |
| Networking | |
| Wi-Fi Client 1m 4M x10 Netgear AX12 | |
| Wi-Fi Server 1m 4M x10 (-R) Netgear AX12 |
| |||||||||||||||||||||||||
iluminação: 85 %
iluminação com acumulador: 344 cd/m²
Contraste: 1075:1 (Preto: 0.32 cd/m²)
ΔE ColorChecker Calman: 2.6 | ∀{0.5-29.43 Ø4.71}
ΔE Greyscale Calman: 2.6 | ∀{0.09-98 Ø4.96}
92.27% sRGB (Argyll 1.6.3 3D)
65.82% AdobeRGB 1998 (Argyll 1.6.3 3D)
65.8% AdobeRGB 1998 (Argyll 3D)
92.3% sRGB (Argyll 3D)
65.4% Display P3 (Argyll 3D)
Gamma: 2.28
CCT: 7050 K
| Dell Latitude 7480 LG Philips LGD0557, IPS, 14", 1920x1080 | Dell Latitude 14 7000 Series E7470 AUO B140QAN Dell PN F0WXVV, IPS, 14", 2560x1440 | Lenovo ThinkPad X1 Carbon 2017-20HQS03P00 B140HAN03_1, IPS, 14", 1920x1080 | HP EliteBook 840 G4-Z2V49ET ABD AUO123D, TN, 14", 1920x1080 | Lenovo ThinkPad T470s-20HGS00V00 B140QAN01.5, IPS, 14", 2560x1440 | |
|---|---|---|---|---|---|
| Display | 4% | -6% | -13% | 5% | |
| Display P3 Coverage (%) | 65.4 | 67.2 3% | 61.4 -6% | 55.8 -15% | 69 6% |
| sRGB Coverage (%) | 92.3 | 95.9 4% | 85.9 -7% | 80.7 -13% | 95.1 3% |
| AdobeRGB 1998 Coverage (%) | 65.8 | 69.3 5% | 62.4 -5% | 57.7 -12% | 69.6 6% |
| Response Times | -3% | -2% | 15% | -3% | |
| Response Time Grey 50% / Grey 80% * (ms) | 40.8 ? | 48 ? -18% | 41.6 ? -2% | 39 ? 4% | 46.4 ? -14% |
| Response Time Black / White * (ms) | 31.2 ? | 27 ? 13% | 31.6 ? -1% | 23 ? 26% | 28.8 ? 8% |
| PWM Frequency (Hz) | |||||
| Screen | -1% | -26% | -90% | -39% | |
| Brightness middle (cd/m²) | 344 | 380 10% | 311 -10% | 346 1% | 327 -5% |
| Brightness (cd/m²) | 321 | 354 10% | 288 -10% | 317 -1% | 311 -3% |
| Brightness Distribution (%) | 85 | 81 -5% | 85 0% | 86 1% | 88 4% |
| Black Level * (cd/m²) | 0.32 | 0.26 19% | 0.24 25% | 0.86 -169% | 0.25 22% |
| Contrast (:1) | 1075 | 1462 36% | 1296 21% | 402 -63% | 1308 22% |
| Colorchecker dE 2000 * | 2.6 | 3.11 -20% | 5.5 -112% | 8.64 -232% | 6.1 -135% |
| Colorchecker dE 2000 max. * | 7.8 | 6.73 14% | 9 -15% | 13.58 -74% | 12.2 -56% |
| Greyscale dE 2000 * | 2.6 | 4.35 -67% | 6.2 -138% | 11.24 -332% | 8.8 -238% |
| Gamma | 2.28 96% | 2.37 93% | 2.02 109% | 2.62 84% | 2.18 101% |
| CCT | 7050 92% | 6771 96% | 5950 109% | 12530 52% | 6172 105% |
| Color Space (Percent of AdobeRGB 1998) (%) | 65.82 | 62 -6% | 55.96 -15% | 52 -21% | 61.56 -6% |
| Color Space (Percent of sRGB) (%) | 92.27 | 96 4% | 85.77 -7% | 80 -13% | 94.88 3% |
| Média Total (Programa/Configurações) | 0% /
0% | -11% /
-19% | -29% /
-61% | -12% /
-26% |
* ... menor é melhor
Exibir tempos de resposta
| ↔ Tempo de resposta preto para branco | ||
|---|---|---|
| 31.2 ms ... ascensão ↗ e queda ↘ combinadas | ↗ 18.8 ms ascensão | 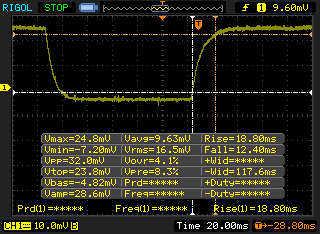 |
| ↘ 12.4 ms queda | ||
| A tela mostra taxas de resposta lentas em nossos testes e será insatisfatória para os jogadores. Em comparação, todos os dispositivos testados variam de 0.1 (mínimo) a 240 (máximo) ms. » 84 % de todos os dispositivos são melhores. Isso significa que o tempo de resposta medido é pior que a média de todos os dispositivos testados (19.8 ms). | ||
| ↔ Tempo de resposta 50% cinza a 80% cinza | ||
| 40.8 ms ... ascensão ↗ e queda ↘ combinadas | ↗ 19.2 ms ascensão | 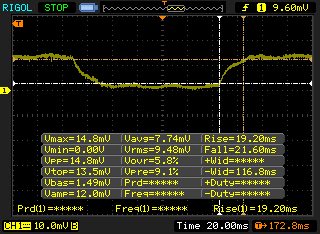 |
| ↘ 21.6 ms queda | ||
| A tela mostra taxas de resposta lentas em nossos testes e será insatisfatória para os jogadores. Em comparação, todos os dispositivos testados variam de 0.165 (mínimo) a 636 (máximo) ms. » 64 % de todos os dispositivos são melhores. Isso significa que o tempo de resposta medido é pior que a média de todos os dispositivos testados (31 ms). | ||
Cintilação da tela / PWM (modulação por largura de pulso)
| Tela tremeluzindo / PWM não detectado | 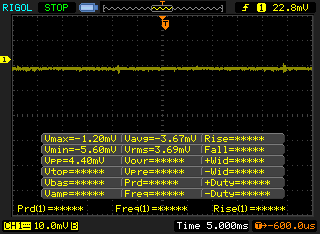 | ||
[pwm_comparison] Em comparação: 52 % de todos os dispositivos testados não usam PWM para escurecer a tela. Se PWM foi detectado, uma média de 7757 (mínimo: 5 - máximo: 343500) Hz foi medida. | |||

| Cinebench R10 | |
| Rendering Multiple CPUs 32Bit | |
| Lenovo ThinkPad T470s-20HGS00V00 | |
| Dell Latitude 7480 | |
| Rendering Single 32Bit | |
| Lenovo ThinkPad T470s-20HGS00V00 | |
| Dell Latitude 7480 | |
| Dell Latitude 14 7000 Series E7470 | |
| wPrime 2.10 - 1024m | |
| Dell Latitude 7480 | |
| Dell Latitude 7280 | |
| Lenovo ThinkPad T470s-20HGS00V00 | |
* ... menor é melhor
| PCMark 8 Home Score Accelerated v2 | 3985 pontos | |
| PCMark 8 Creative Score Accelerated v2 | 4981 pontos | |
| PCMark 8 Work Score Accelerated v2 | 5052 pontos | |
Ajuda | ||
| Dell Latitude 7480 Intel SSDSCKKF256H6 | Lenovo ThinkPad X1 Carbon 2017-20HQS03P00 Samsung PM961 NVMe MZVLW512HMJP | HP EliteBook 840 G4-Z2V49ET ABD Samsung PM961 MZVLW256HEHP | Lenovo ThinkPad T470s-20HGS00V00 Samsung SSD PM961 1TB M.2 PCIe 3.0 x4 NVMe (MZVLW1T0) | Dell Latitude 7280 SanDisk X400 M.2 2280 256GB | Dell Latitude 5480 Toshiba SG5 256GB THNSNK256GVN8 | |
|---|---|---|---|---|---|---|
| CrystalDiskMark 3.0 | 163% | 141% | 168% | -2% | -1% | |
| Read Seq (MB/s) | 486.5 | 1827 276% | 1819 274% | 1760 262% | 470.8 -3% | 469.4 -4% |
| Write Seq (MB/s) | 418.6 | 1383 230% | 1263 202% | 1666 298% | 477.4 14% | 264.8 -37% |
| Read 512 (MB/s) | 354.3 | 814 130% | 922 160% | 832 135% | 370.1 4% | 408.1 15% |
| Write 512 (MB/s) | 306.8 | 1098 258% | 804 162% | 1064 247% | 323.2 5% | 265.5 -13% |
| Read 4k (MB/s) | 29.25 | 61 109% | 61.4 110% | 53.2 82% | 30.23 3% | 24.66 -16% |
| Write 4k (MB/s) | 90.5 | 172.2 90% | 157.1 74% | 167.4 85% | 59.5 -34% | 114.8 27% |
| Read 4k QD32 (MB/s) | 280.2 | 601 114% | 513 83% | 630 125% | 344.4 23% | 380.3 36% |
| Write 4k QD32 (MB/s) | 252.8 | 495.6 96% | 410.2 62% | 533 111% | 183 -28% | 207.2 -18% |

| 3DMark | |
| 1280x720 Cloud Gate Standard Graphics | |
| Lenovo ThinkPad T470s-20HGS00V00 | |
| Lenovo ThinkPad X1 Carbon 2017-20HQS03P00 | |
| Dell Latitude 5480 | |
| Dell Latitude 7480 | |
| Dell Latitude 7280 | |
| HP EliteBook 840 G4-Z2V49ET ABD | |
| Dell Latitude 14 7000 Series E7470 | |
| 1920x1080 Fire Strike Graphics | |
| Lenovo ThinkPad T470s-20HGS00V00 | |
| Lenovo ThinkPad X1 Carbon 2017-20HQS03P00 | |
| Dell Latitude 5480 | |
| Dell Latitude 7480 | |
| Dell Latitude 7280 | |
| Dell Latitude 14 7000 Series E7470 | |
| HP EliteBook 840 G4-Z2V49ET ABD | |
| 1920x1080 Ice Storm Extreme Graphics | |
| Dell Latitude 7480 | |
| 3DMark 11 Performance | 1807 pontos | |
| 3DMark Ice Storm Standard Score | 64798 pontos | |
| 3DMark Cloud Gate Standard Score | 6706 pontos | |
| 3DMark Fire Strike Score | 934 pontos | |
| 3DMark Fire Strike Extreme Score | 441 pontos | |
Ajuda | ||
| baixo | média | alto | ultra | |
|---|---|---|---|---|
| Tomb Raider (2013) | 83.6 | 43.3 | 25.9 | 12.7 |
| BioShock Infinite (2013) | 54.5 | 31.6 | 26.3 | 8.4 |
Barulho
| Ocioso |
| 28.6 / 28.6 / 28.6 dB |
| Carga |
| 30.2 / 31.2 dB |
 | ||
30 dB silencioso 40 dB(A) audível 50 dB(A) ruidosamente alto |
||
min: | ||
| Dell Latitude 7480 HD Graphics 620, i7-7600U, Intel SSDSCKKF256H6 | Lenovo ThinkPad X1 Carbon 2017-20HQS03P00 HD Graphics 620, i7-7500U, Samsung PM961 NVMe MZVLW512HMJP | HP EliteBook 840 G4-Z2V49ET ABD HD Graphics 620, i5-7200U, Samsung PM961 MZVLW256HEHP | Lenovo ThinkPad T470s-20HGS00V00 HD Graphics 620, i7-7600U, Samsung SSD PM961 1TB M.2 PCIe 3.0 x4 NVMe (MZVLW1T0) | Dell Latitude 7280 HD Graphics 620, i7-7600U, SanDisk X400 M.2 2280 256GB | Dell Latitude 5480 HD Graphics 620, i7-7600U, Toshiba SG5 256GB THNSNK256GVN8 | |
|---|---|---|---|---|---|---|
| Noise | -11% | -9% | -13% | -3% | -20% | |
| Idle Minimum * (dB) | 28.6 | 29.3 -2% | 31 -8% | 28.9 -1% | 29.4 -3% | 29.6 -3% |
| Idle Average * (dB) | 28.6 | 29.3 -2% | 31 -8% | 28.9 -1% | 29.4 -3% | 29.6 -3% |
| Idle Maximum * (dB) | 28.6 | 32.2 -13% | 31 -8% | 30.1 -5% | 30 -5% | 29.6 -3% |
| Load Average * (dB) | 30.2 | 34.3 -14% | 33.5 -11% | 39.2 -30% | 30.6 -1% | 42 -39% |
| Load Maximum * (dB) | 31.2 | 39.3 -26% | 33.7 -8% | 39.2 -26% | 32.7 -5% | 47.1 -51% |
| desligado / ambiente * (dB) | 29.3 | 31 | 28.9 | 29.4 |
* ... menor é melhor
(+) A temperatura máxima no lado superior é 39 °C / 102 F, em comparação com a média de 34.3 °C / 94 F , variando de 21.2 a 62.5 °C para a classe Office.
(-) A parte inferior aquece até um máximo de 47.2 °C / 117 F, em comparação com a média de 36.8 °C / 98 F
(+) Em uso inativo, a temperatura média para o lado superior é 24.5 °C / 76 F, em comparação com a média do dispositivo de 29.5 °C / ### class_avg_f### F.
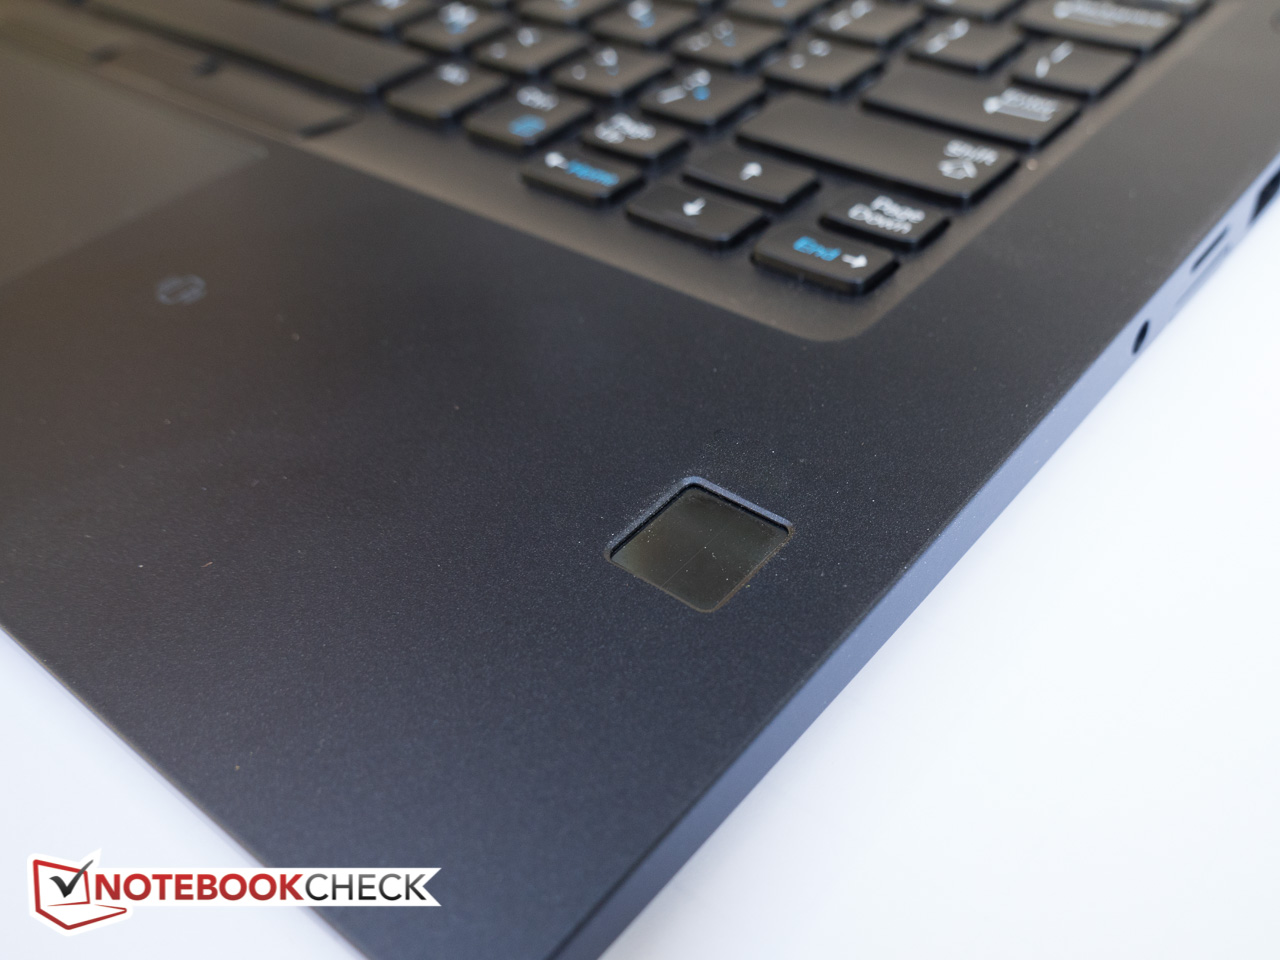
(+) Os apoios para as mãos e o touchpad são mais frios que a temperatura da pele, com um máximo de 24.2 °C / 75.6 F e, portanto, são frios ao toque.
(+) A temperatura média da área do apoio para as mãos de dispositivos semelhantes foi 27.5 °C / 81.5 F (+3.3 °C / 5.9 F).
Dell Latitude 7480 análise de áudio
(±) | o volume do alto-falante é médio, mas bom (###valor### dB)
Graves 100 - 315Hz
(±) | graves reduzidos - em média 11.9% menor que a mediana
(±) | a linearidade dos graves é média (10.6% delta para a frequência anterior)
Médios 400 - 2.000 Hz
(+) | médios equilibrados - apenas 3.8% longe da mediana
(±) | a linearidade dos médios é média (7.8% delta para frequência anterior)
Altos 2 - 16 kHz
(±) | máximos mais altos - em média 6.6% maior que a mediana
(+) | os máximos são lineares (6.3% delta da frequência anterior)
Geral 100 - 16.000 Hz
(±) | a linearidade do som geral é média (23.2% diferença em relação à mediana)
Comparado com a mesma classe
» 65% de todos os dispositivos testados nesta classe foram melhores, 8% semelhantes, 27% piores
» O melhor teve um delta de 7%, a média foi 21%, o pior foi 53%
Comparado com todos os dispositivos testados
» 70% de todos os dispositivos testados foram melhores, 5% semelhantes, 25% piores
» O melhor teve um delta de 4%, a média foi 23%, o pior foi 134%
Apple MacBook 12 (Early 2016) 1.1 GHz análise de áudio
(+) | os alto-falantes podem tocar relativamente alto (###valor### dB)
Graves 100 - 315Hz
(±) | graves reduzidos - em média 11.3% menor que a mediana
(±) | a linearidade dos graves é média (14.2% delta para a frequência anterior)
Médios 400 - 2.000 Hz
(+) | médios equilibrados - apenas 2.4% longe da mediana
(+) | médios são lineares (5.5% delta para frequência anterior)
Altos 2 - 16 kHz
(+) | agudos equilibrados - apenas 2% longe da mediana
(+) | os máximos são lineares (4.5% delta da frequência anterior)
Geral 100 - 16.000 Hz
(+) | o som geral é linear (10.2% diferença em relação à mediana)
Comparado com a mesma classe
» 7% de todos os dispositivos testados nesta classe foram melhores, 2% semelhantes, 90% piores
» O melhor teve um delta de 5%, a média foi 18%, o pior foi 53%
Comparado com todos os dispositivos testados
» 5% de todos os dispositivos testados foram melhores, 1% semelhantes, 94% piores
» O melhor teve um delta de 4%, a média foi 23%, o pior foi 134%
| desligado | |
| Ocioso | |
| Carga |
|
Key:
min: | |
| Dell Latitude 7480 i7-7600U, HD Graphics 620, Intel SSDSCKKF256H6, IPS, 1920x1080, 14" | Lenovo ThinkPad X1 Carbon 2017-20HQS03P00 i7-7500U, HD Graphics 620, Samsung PM961 NVMe MZVLW512HMJP, IPS, 1920x1080, 14" | HP EliteBook 840 G4-Z2V49ET ABD i5-7200U, HD Graphics 620, Samsung PM961 MZVLW256HEHP, TN, 1920x1080, 14" | Lenovo ThinkPad T470s-20HGS00V00 i7-7600U, HD Graphics 620, Samsung SSD PM961 1TB M.2 PCIe 3.0 x4 NVMe (MZVLW1T0), IPS, 2560x1440, 14" | Dell Latitude 7280 i7-7600U, HD Graphics 620, SanDisk X400 M.2 2280 256GB, IPS, 1920x1080, 12.5" | Dell Latitude 5480 i7-7600U, HD Graphics 620, Toshiba SG5 256GB THNSNK256GVN8, IPS, 1920x1080, 14" | Dell Latitude 14 7000 Series E7470 6600U, HD Graphics 520, Samsung SSD PM851 M.2 2280 256GB, IPS, 2560x1440, 14" | |
|---|---|---|---|---|---|---|---|
| Power Consumption | -25% | 2% | -38% | 7% | -18% | -26% | |
| Idle Minimum * (Watt) | 4.32 | 3.84 11% | 2.9 33% | 4.64 -7% | 4.28 1% | 6.64 -54% | 5.1 -18% |
| Idle Average * (Watt) | 6.27 | 6.3 -0% | 5.6 11% | 8.93 -42% | 5.11 19% | 6.67 -6% | 8.5 -36% |
| Idle Maximum * (Watt) | 6.35 | 8.6 -35% | 8.15 -28% | 9.12 -44% | 5.49 14% | 7.78 -23% | 10.1 -59% |
| Load Average * (Watt) | 29.82 | 41.9 -41% | 30.6 -3% | 42.2 -42% | 29.83 -0% | 30.83 -3% | 35.2 -18% |
| Load Maximum * (Watt) | 30.64 | 48.7 -59% | 31 -1% | 47.3 -54% | 30.05 2% | 31.7 -3% | 31 -1% |
* ... menor é melhor
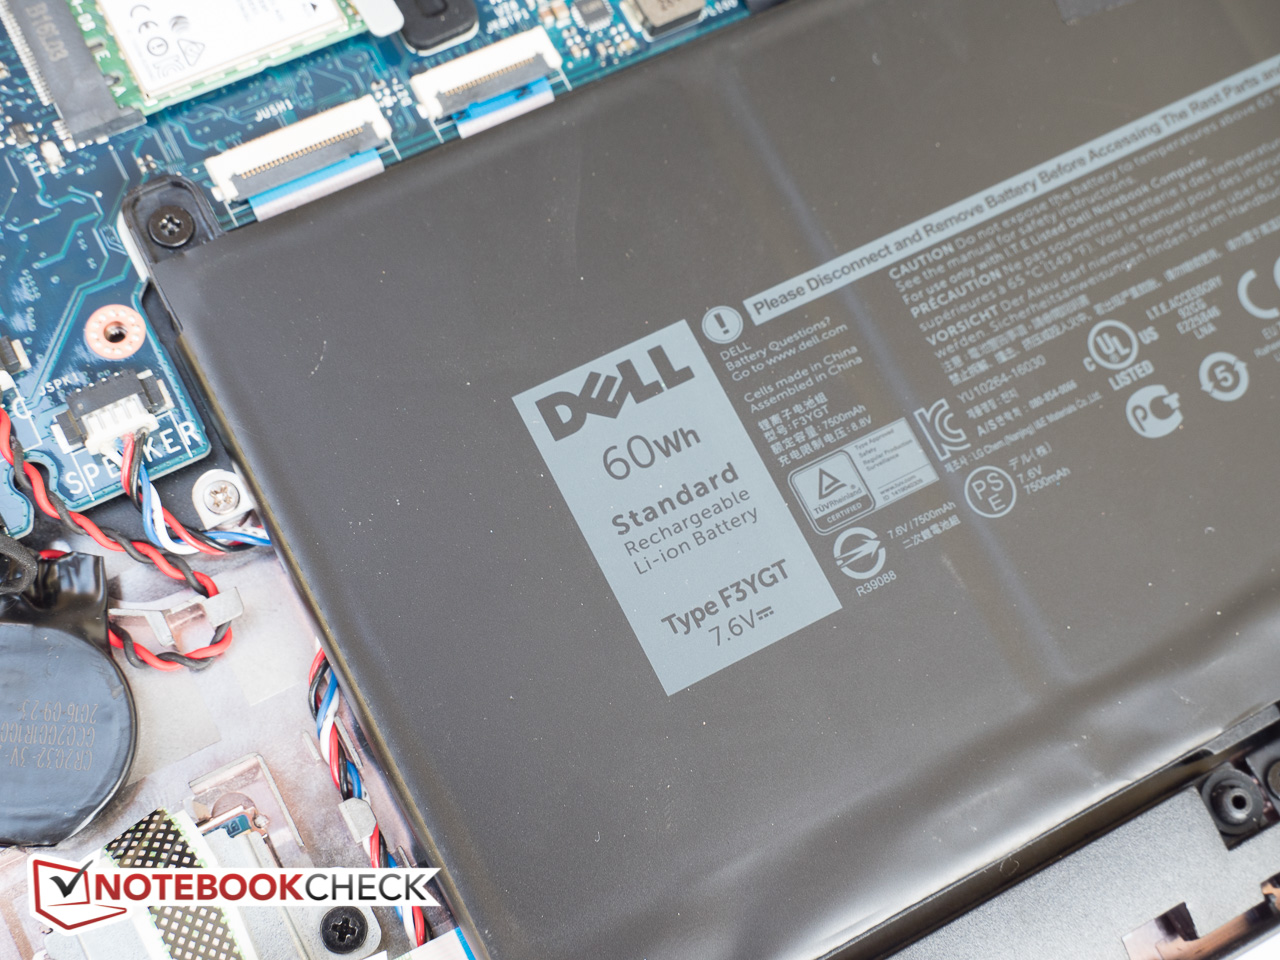
| Dell Latitude 7480 i7-7600U, HD Graphics 620, 60 Wh | Lenovo ThinkPad X1 Carbon 2017-20HQS03P00 i7-7500U, HD Graphics 620, 57 Wh | HP EliteBook 840 G4-Z2V49ET ABD i5-7200U, HD Graphics 620, 51 Wh | Lenovo ThinkPad T470s-20HGS00V00 i7-7600U, HD Graphics 620, 51 Wh | Dell Latitude 5480 i7-7600U, HD Graphics 620, 68 Wh | Dell Latitude 14 7000 Series E7470 6600U, HD Graphics 520, 55 Wh | |
|---|---|---|---|---|---|---|
| Duração da bateria | -31% | -15% | -47% | 5% | -43% | |
| Reader / Idle (h) | 27.7 | 20.9 -25% | 19.3 -30% | 13.1 -53% | 24.1 -13% | |
| WiFi v1.3 (h) | 12 | 8.3 -31% | 9.5 -21% | 7 -42% | 16.1 34% | 5.8 -52% |
| Load (h) | 2.9 | 1.8 -38% | 3.1 7% | 1.6 -45% | 2.7 -7% | 1.9 -34% |
Pro
Contra
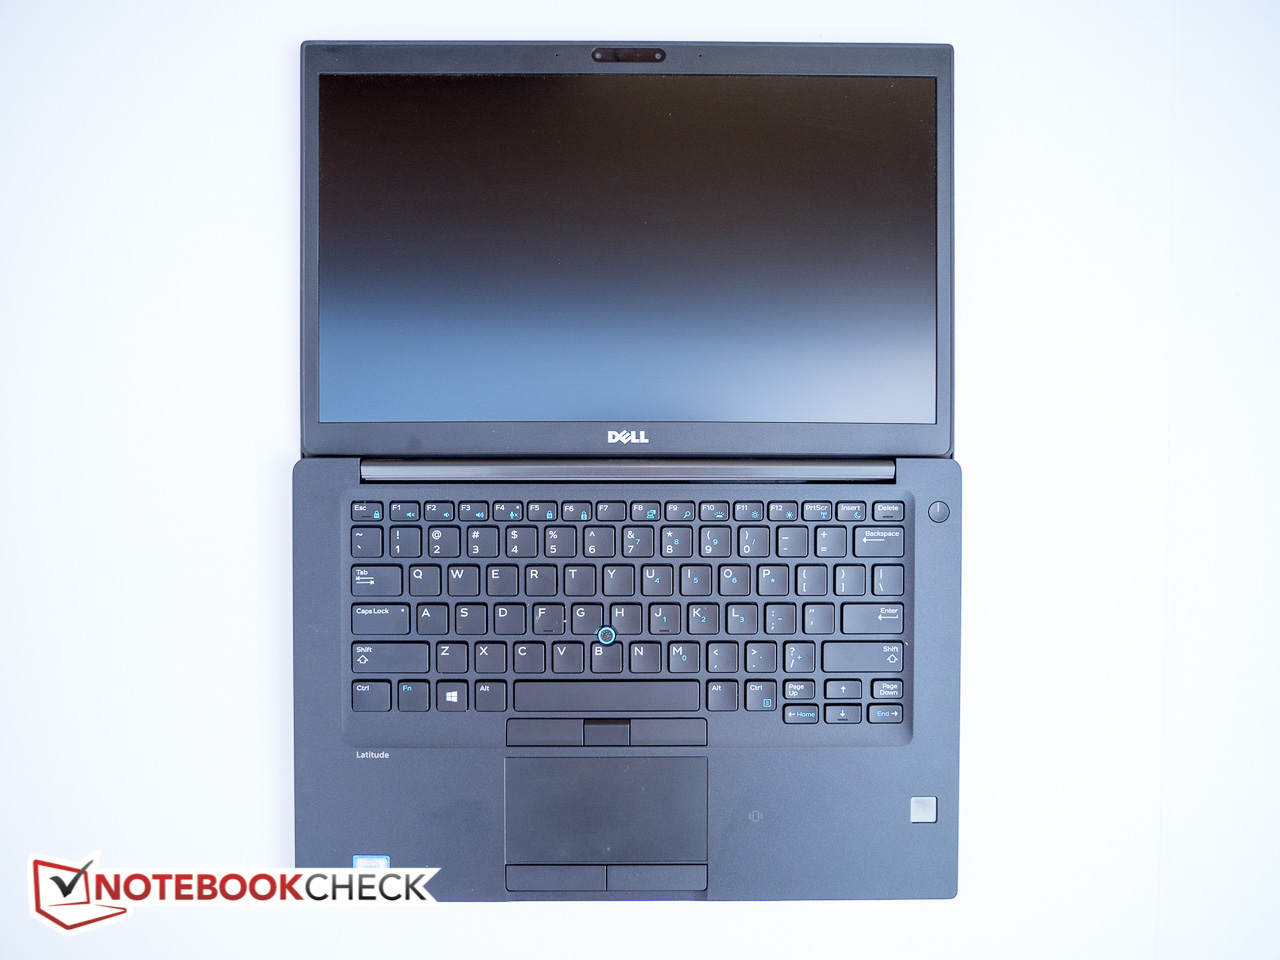
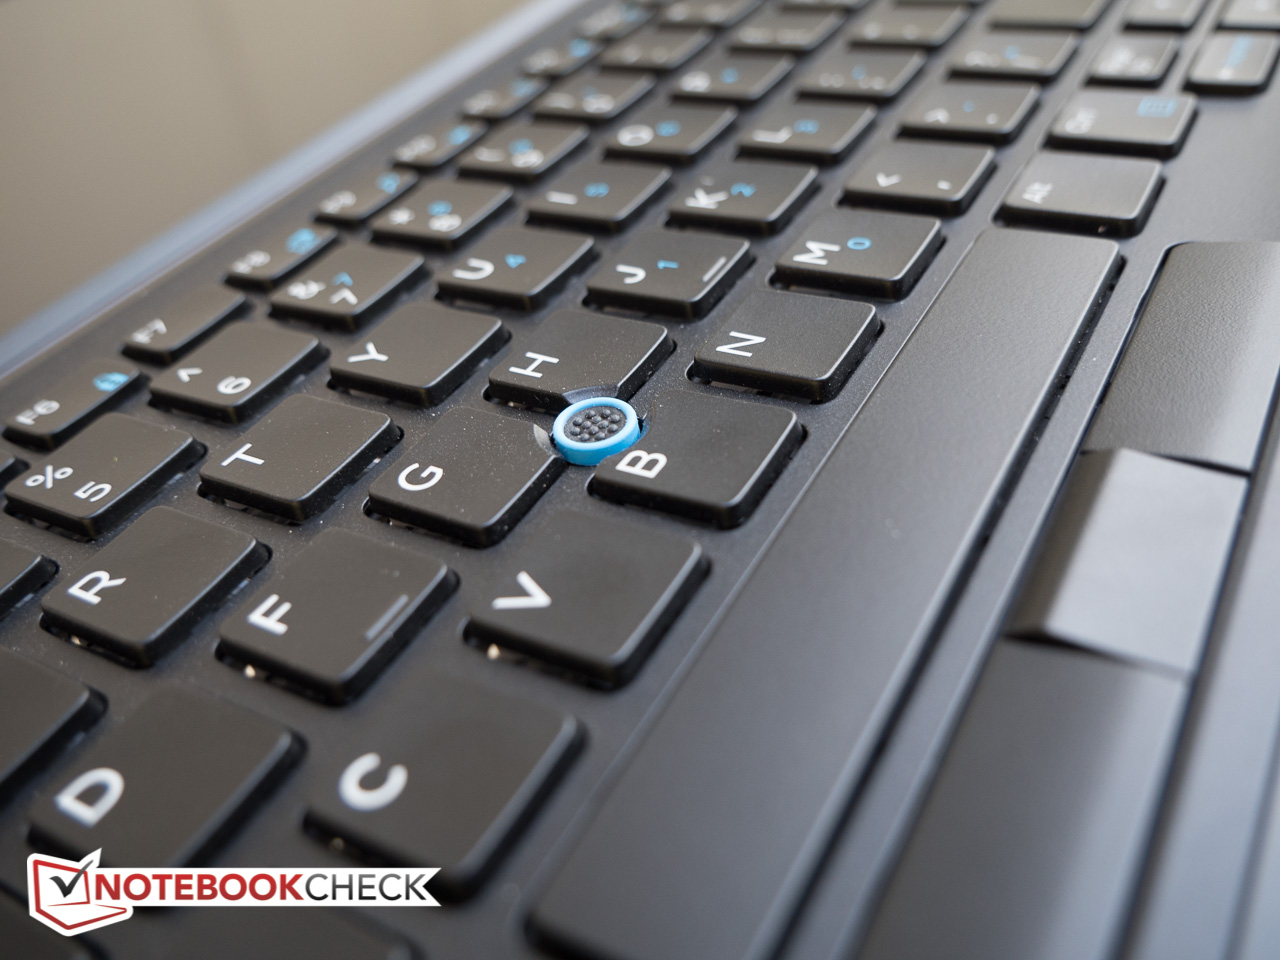
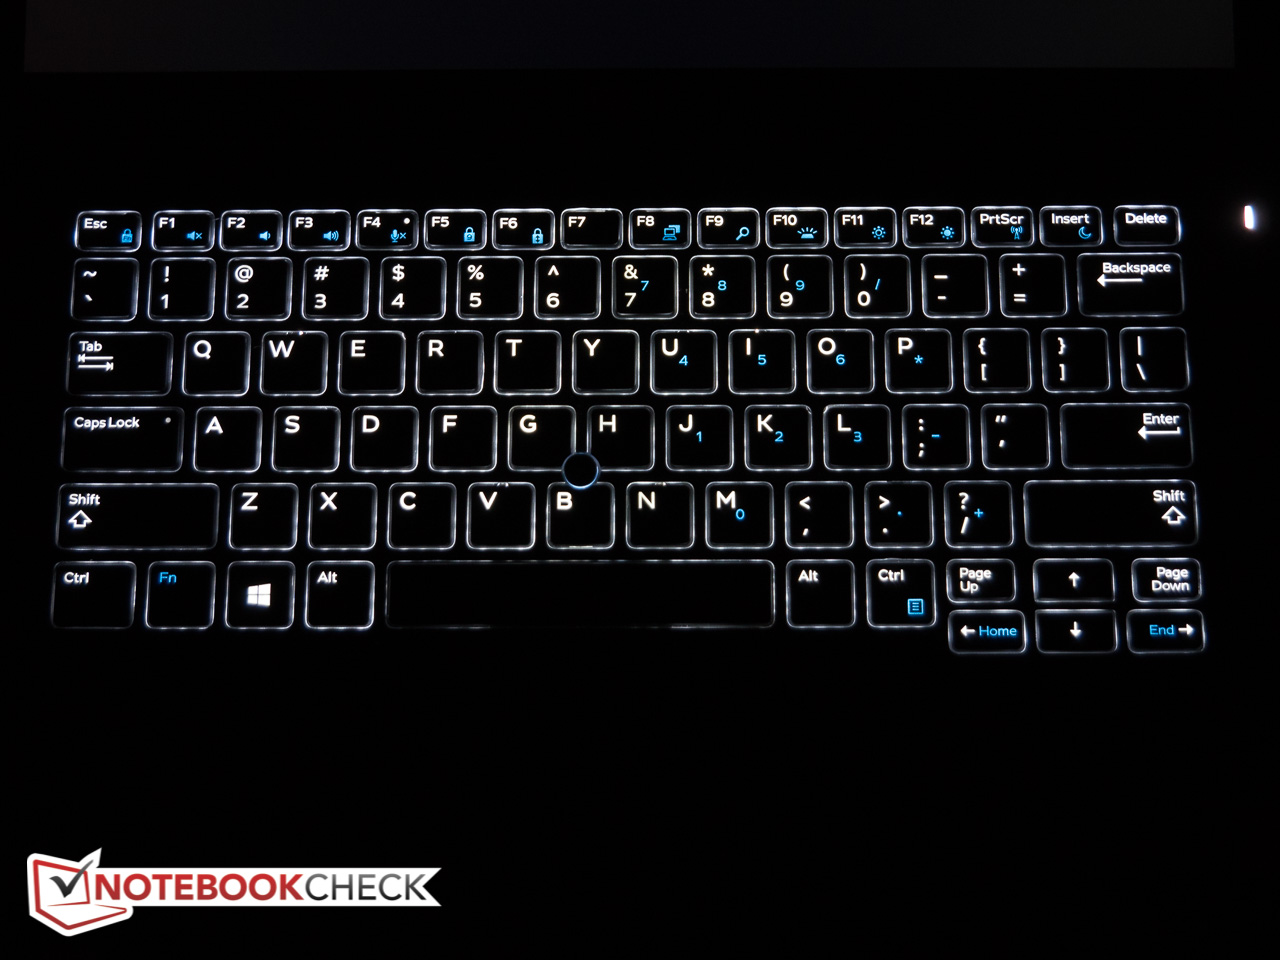
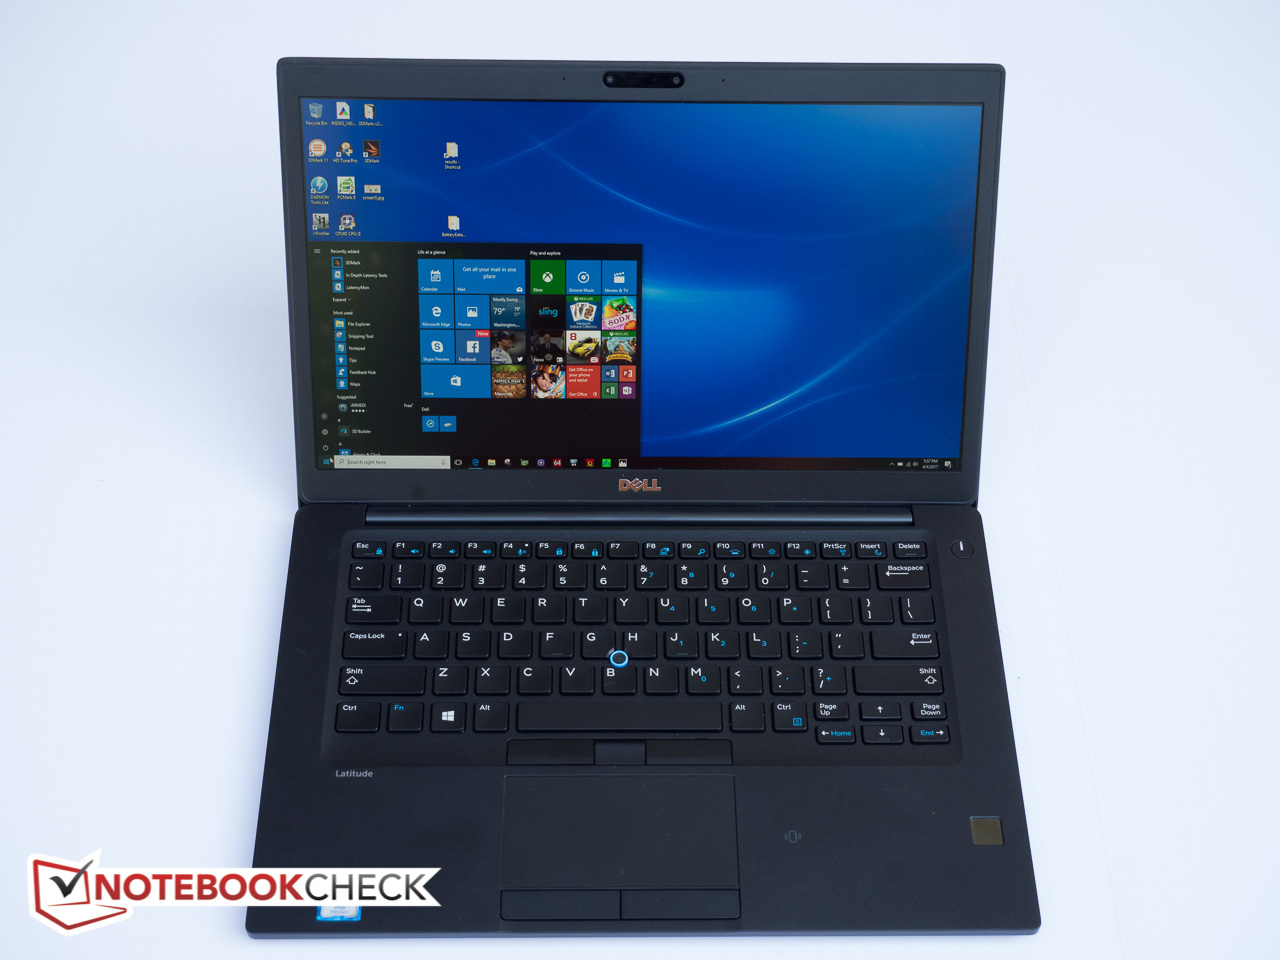
Embora não chegue perto do glamour dos seus irmãos XPS de 13 e 15 polegadas da própria Dell, o Latitude 7480 é de certa forma o equivalente empresarial daquelas máquinas mainstream bem recebidas. O portátil de 14-polegadas de bom visual é menor e muito mais leve que antes, mas a qualidade de construção continua sendo inquestionavelmente alta. O chassi é sólido com tolerâncias apertadas e possui um acabamento suave e amigável ao toque. A tela é brilhante com cores precisas e revestimento antirefletivo, portanto, os viajantes não terão que lidar com reflexos irritantes. O desempenho é de primeira categoria - embora os testes específicos da CPU fiquem um pouco para trás, o portátil se destaca quando se trata de benchmarks sintéticos - e a bateria dura todo o dia mesmo sem ser completamente carregada. Os dispositivos de entrada também são muito bons com o teclado em particular, recebendo o nosso assentimento como um dos melhores disponíveis no mercado atualmente.
O Latitude 7480 é um portátil empresarial sólido de alta qualidade. No entanto, o barulho de sua bobina poderia ser um fator decisivo para alguns.
Se houver uma pontos negativo flagrante, é o barulho da bobina, que é audível há pelo menos 3 metros de distância e parece estar presente independentemente do nível de uso (mas é claro, mais perceptível durante o modo inativo). Certamente esperamos que este barulho afete apenas o nosso modelo de teste, mas dado que observamos o mesmo tipo de barulho durante nossa análise do Latitude 5480 e 7280, não ficaríamos surpresos se este for um problema mais espalhado.
Dell Latitude 7480
- 04/18/2017 v6 (old)
Bernie Pechlaner
Price comparison
