MSI Summit E13 Flip vs. XPS 13 2 em 1: Dando à Dell uma corrida por seu dinheiro
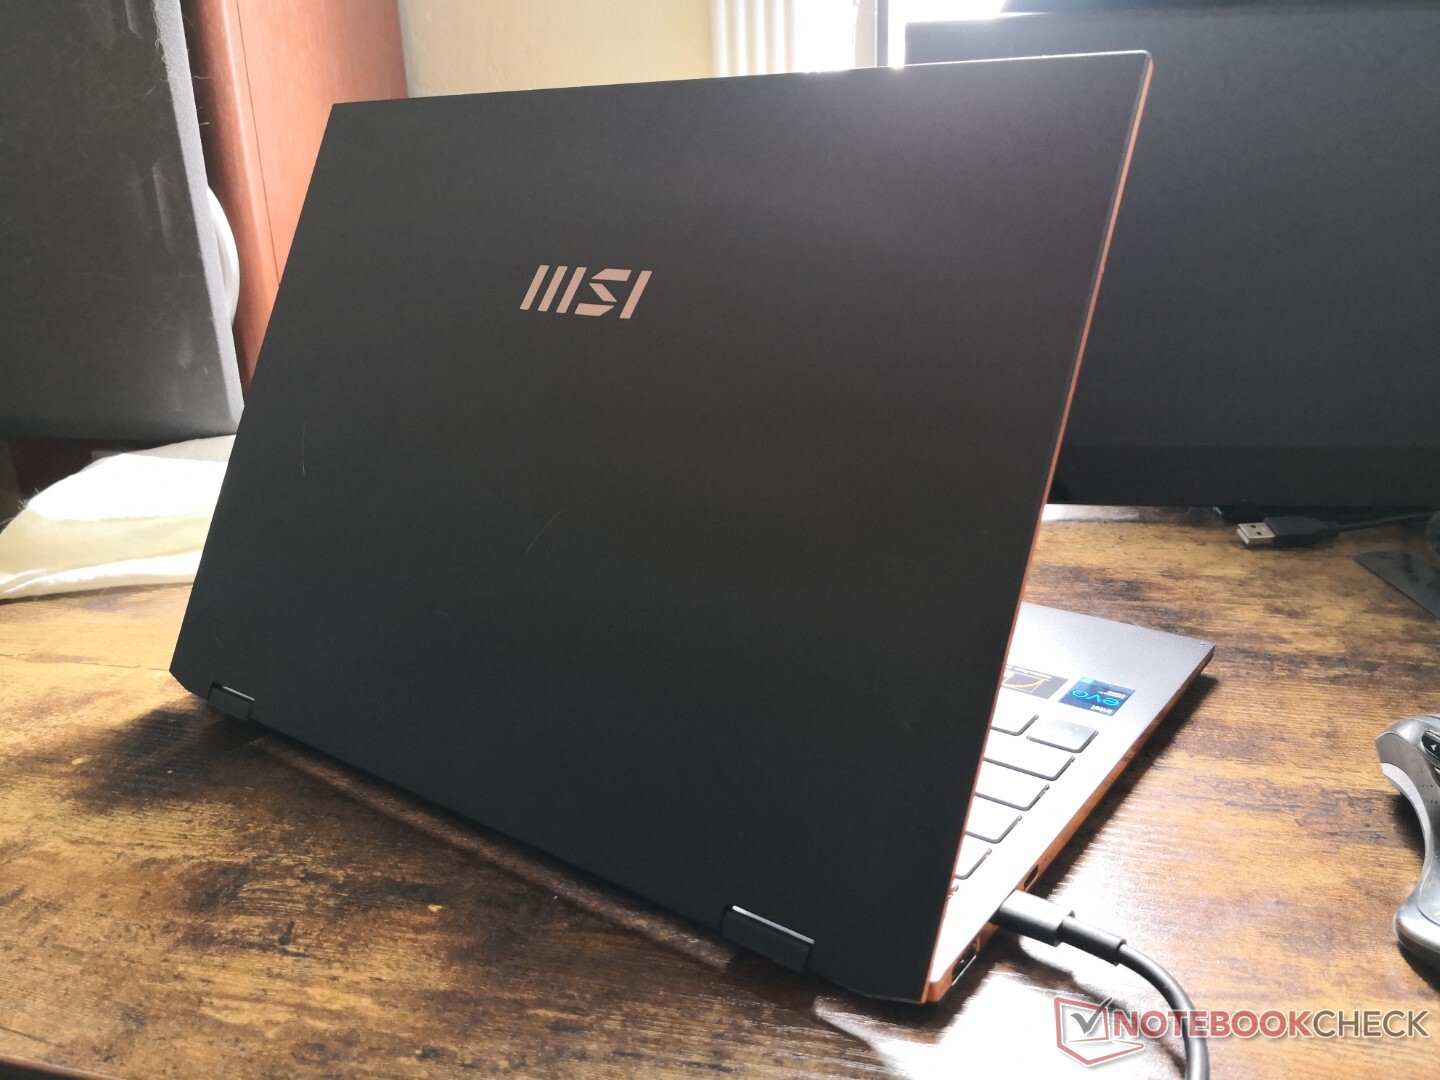
A MSI não é mais apenas uma empresa de jogos. Sua última série Summit é uma resposta direta aos populares laptops prosumer como o Dell XPS, HP Spectre, Asus ZenBook, Huawei MateBook X Pro, e até o MacBook Air ou MacBook Pro. Acabamos de concluir recentemente a revisão do MSI Summit E13 Flip conversível de 13,4 polegadas e já está provando ser uma alternativa válida para a venerável alternativa XPS 13 de 13,4 polegadas
Nossos gráficos e tabelas abaixo comparam o Summit E13 Flip com o XPS 13 7390 2 em 1 do ano passado para mostrar as vantagens e desvantagens de cada um. Teríamos adorado comparar o mais novo Tiger Lake XPS 13 9310 2 em 1, mas a Dell diz que não foi capaz de nos enviar uma unidade para testes e por isso tivemos que usar seu modelo mais antigo Ice Lake como a próxima melhor coisa. O XPS 13 7390 2 em 1 e o 9310 2 em 1 são visualmente idênticos
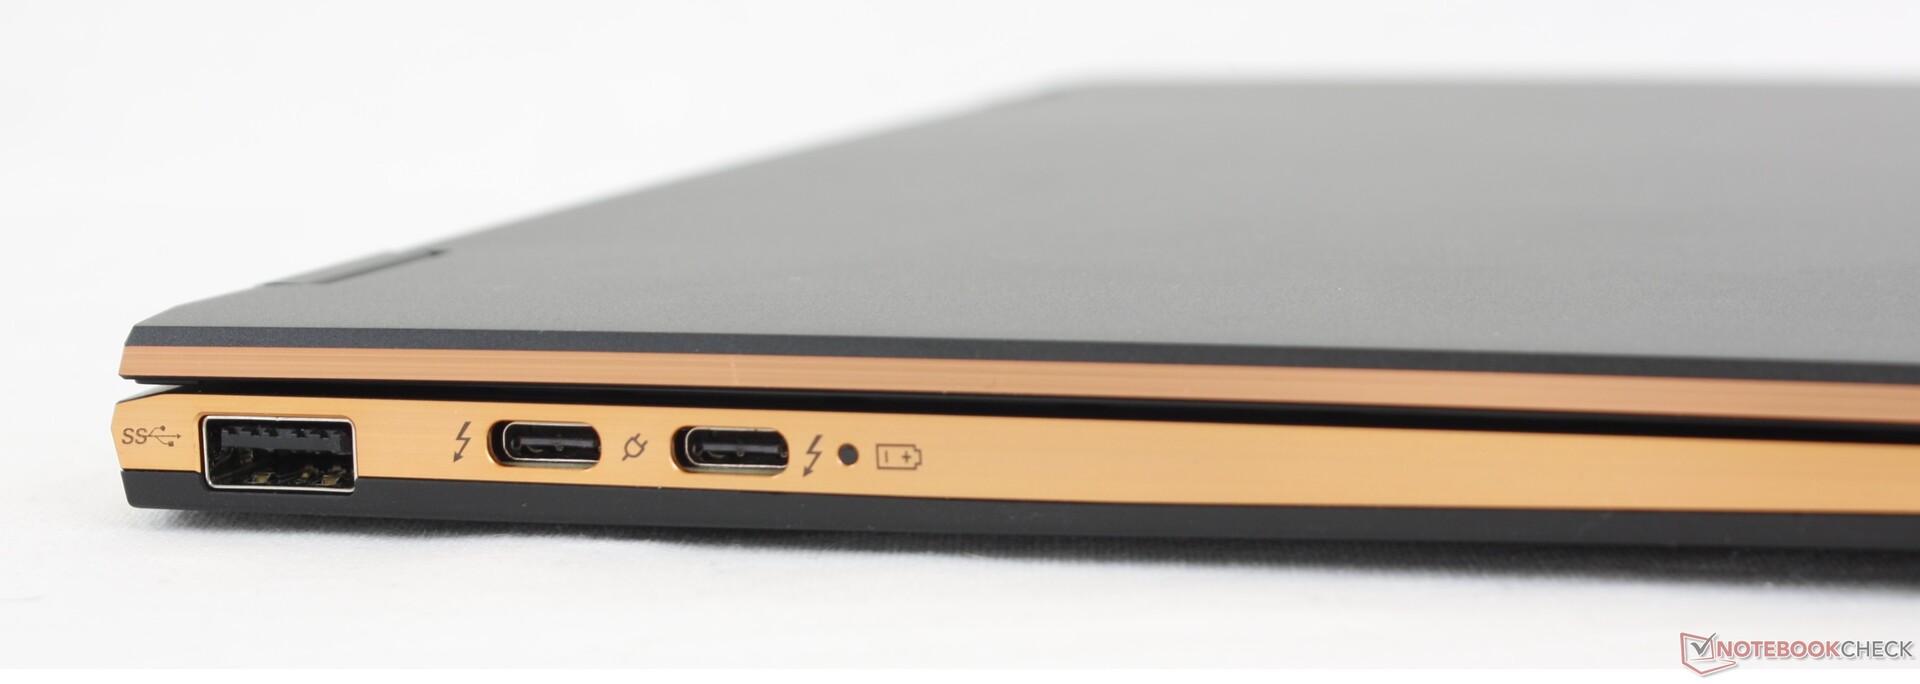
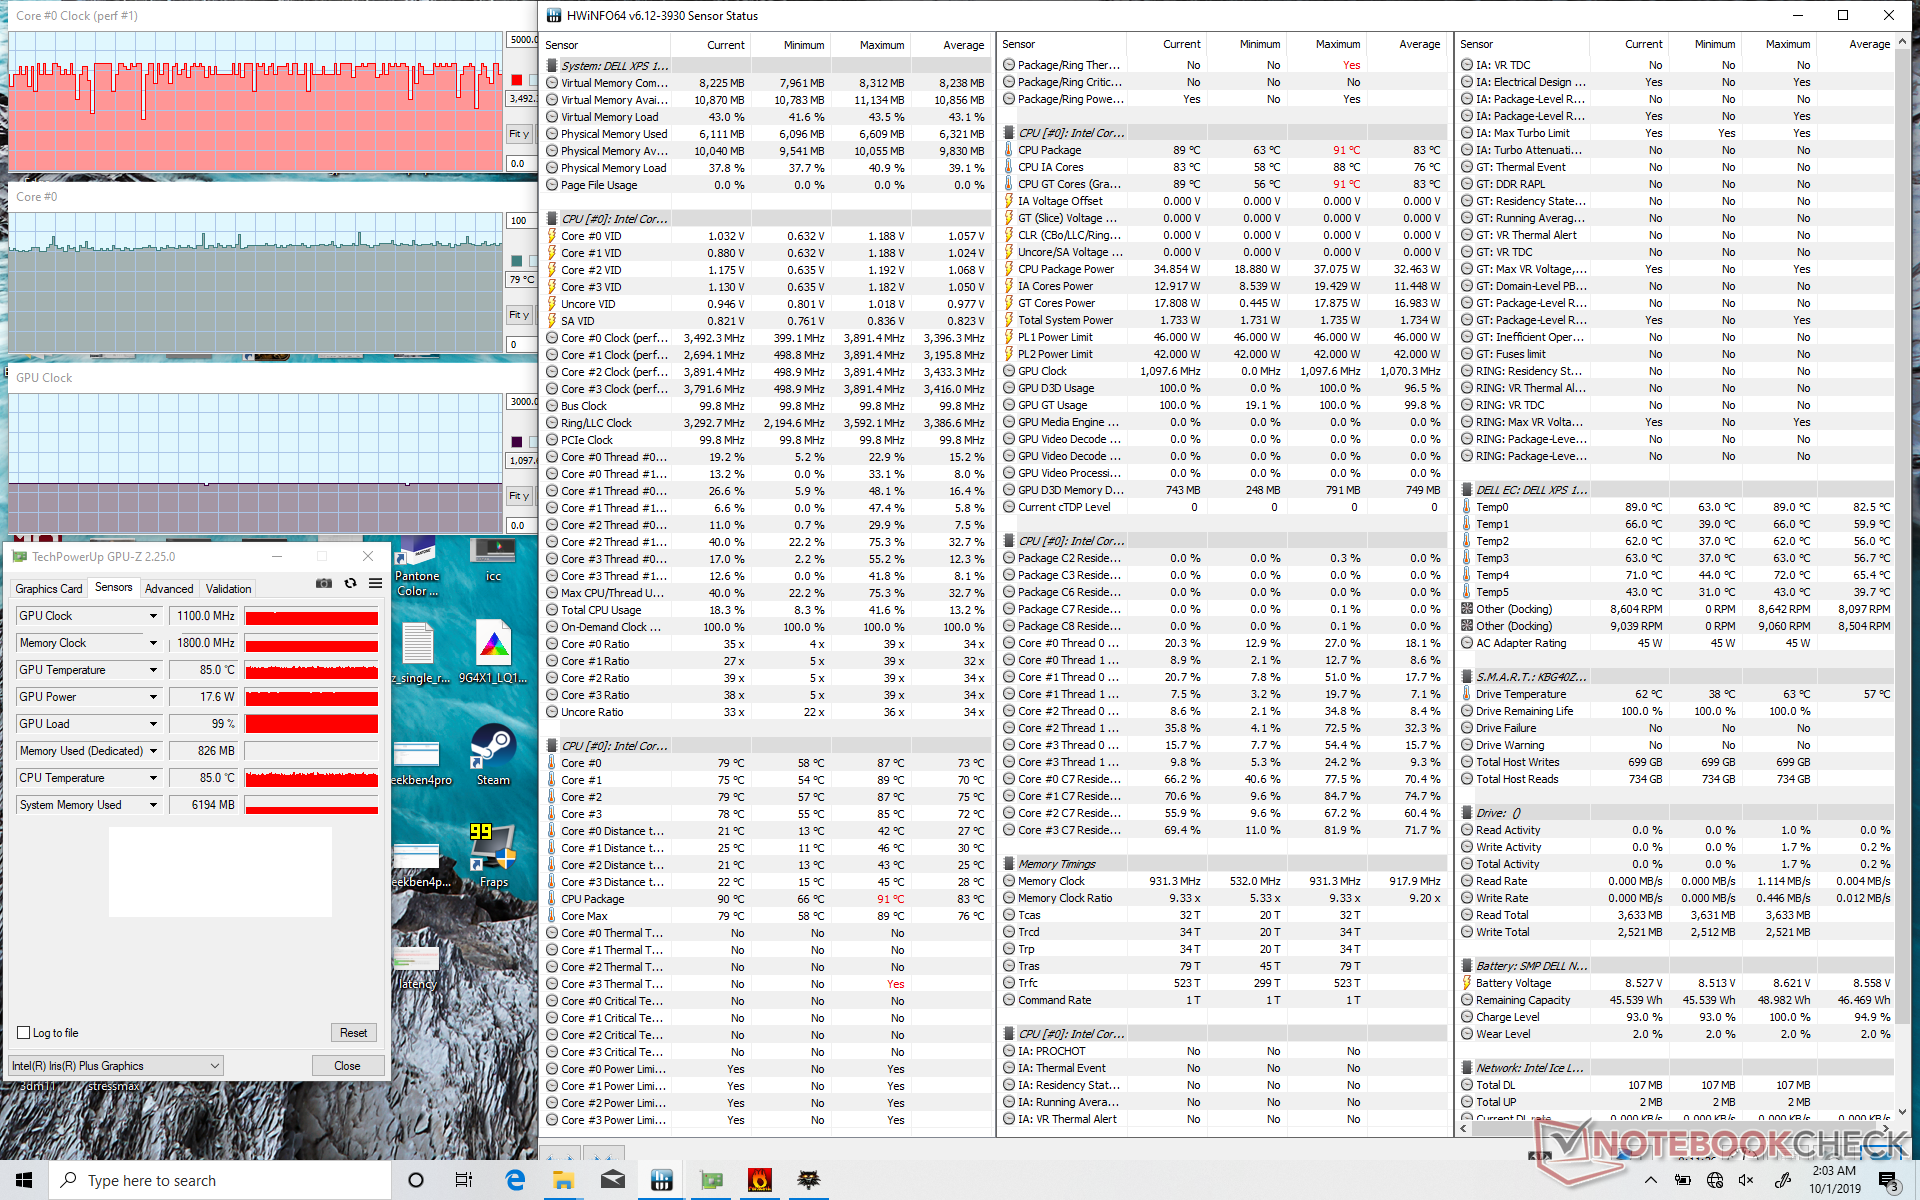
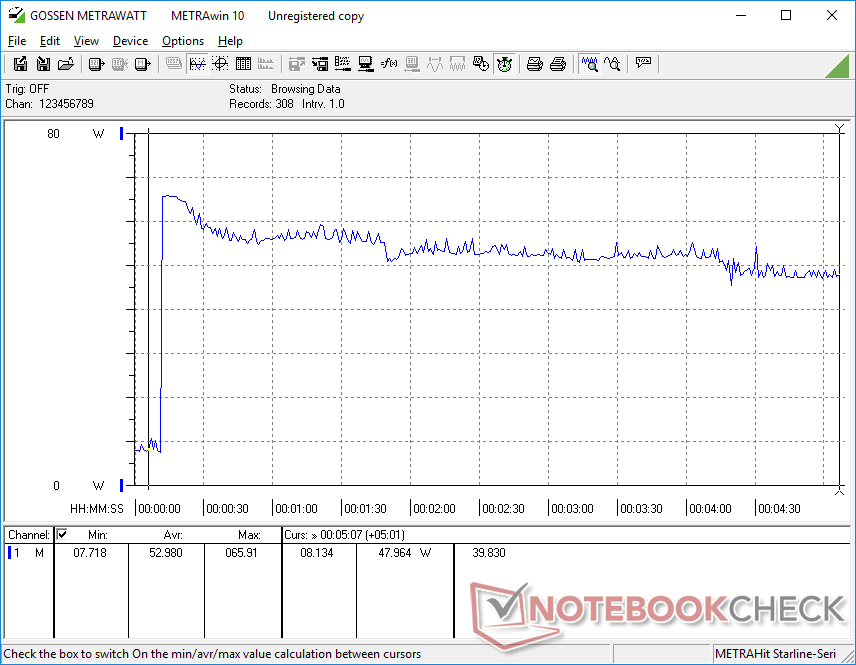
As maiores vantagens do sistema MSI são sua taxa de atualização de tela de 120 Hz mais suave, desempenho maior e mais consistente, slot PCIe 4.0 M.2, e bateria maior para tempos de execução mais longos. A maior taxa de atualização em particular aumenta significativamente a experiência do usuário, pois aumenta a capacidade de resposta, especialmente quando se usa um estilete
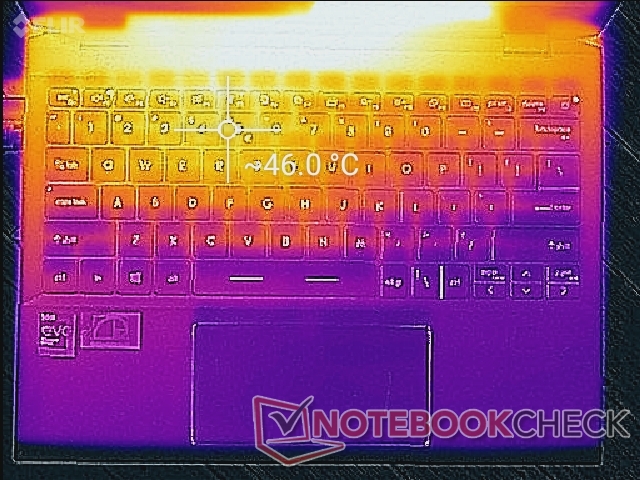
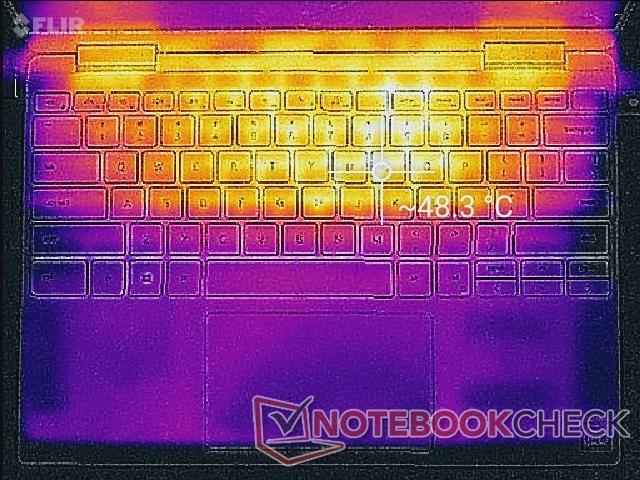
As desvantagens da MSI são, sem dúvida, igualmente consideráveis. Mais notadamente, é ligeiramente mais pesado e maior do que a alternativa Dell, o que significa que seu maior desempenho, tempos de execução mais longos e opções de porta maiores não são gratuitas. Seus ventiladores tendem a ser mais perceptíveis também porque mudam em RPM com maior freqüência quando se trabalha com cargas mais altas
Não podemos declarar que um sistema seja objetivamente melhor do que o outro, uma vez que eles têm seus prós e contras. Se você não se importa com um sistema um pouco maior por sua exibição superior, opções de porta, duração da bateria e desempenho, por exemplo, então a circunferência extra e o ruído do MSI podem valer a pena sobre a Dell. Veja nossas revisões sobre o MSI Summit E13 Flip e Dell XPS 13 7390 2 em 1 para saber mais sobre cada sistema.
| MSI Summit E13 Flip Evo | Dell XPS 13 7390 2 em 1 | |
|---|---|---|
| CPU/GPU | 11º gênero Core i7-1185G7 Iris Xe | 10ª geração Core i7-1065G7 Iris Plus G7 |
| Tela sensível ao toque | 13.4 polegadas, 16:10, 1920 x 1200 Taxa de atualização 120 Hz | 13.4 polegadas, 16:10, 1920 x 1200 |
RAM | 32 GB LPDDR4X 2133 MHz | 16 GB LPDDR4 1866 MHz |
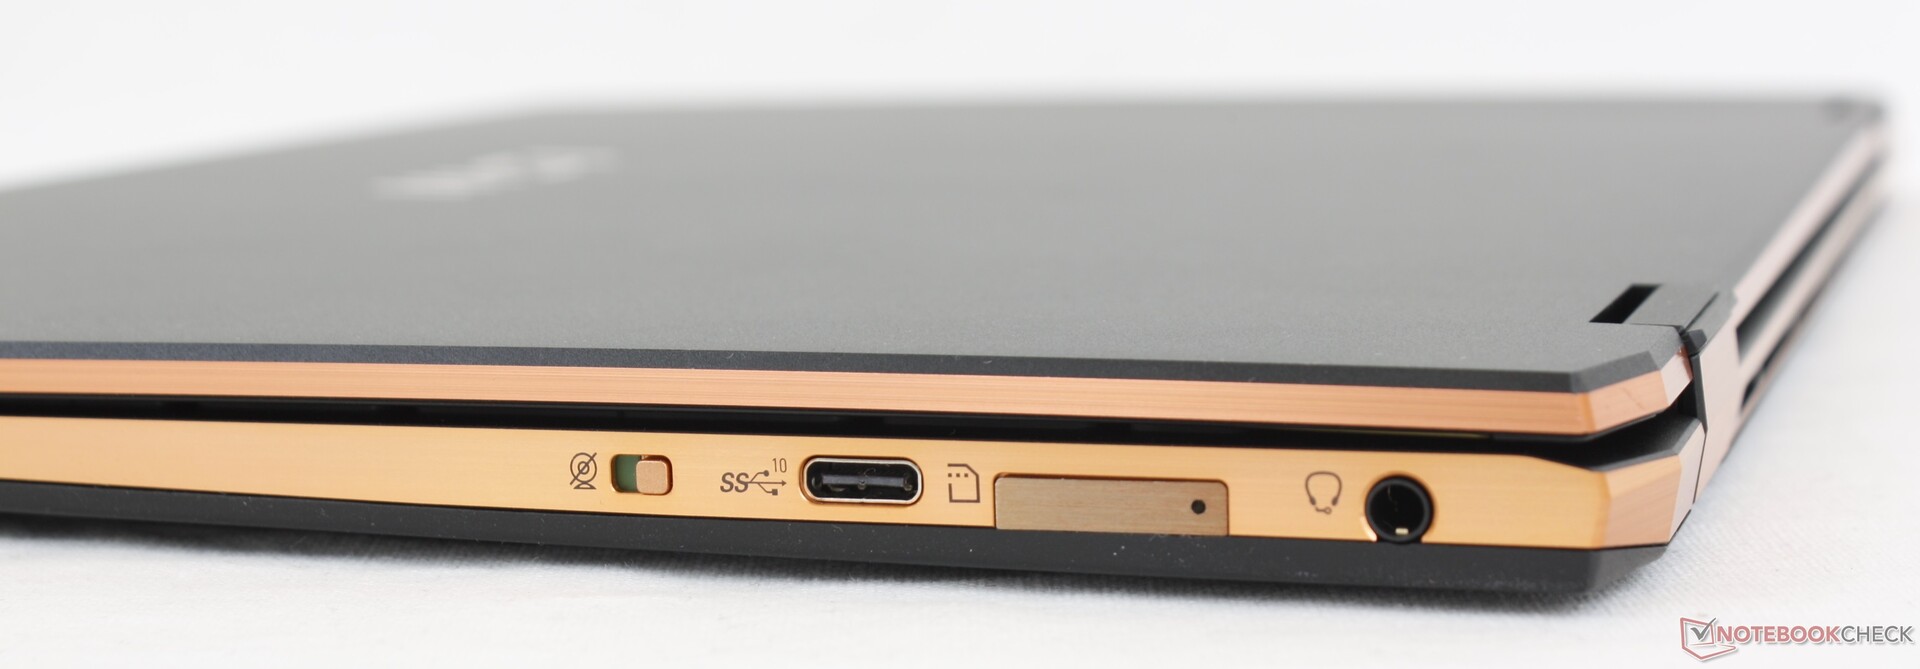
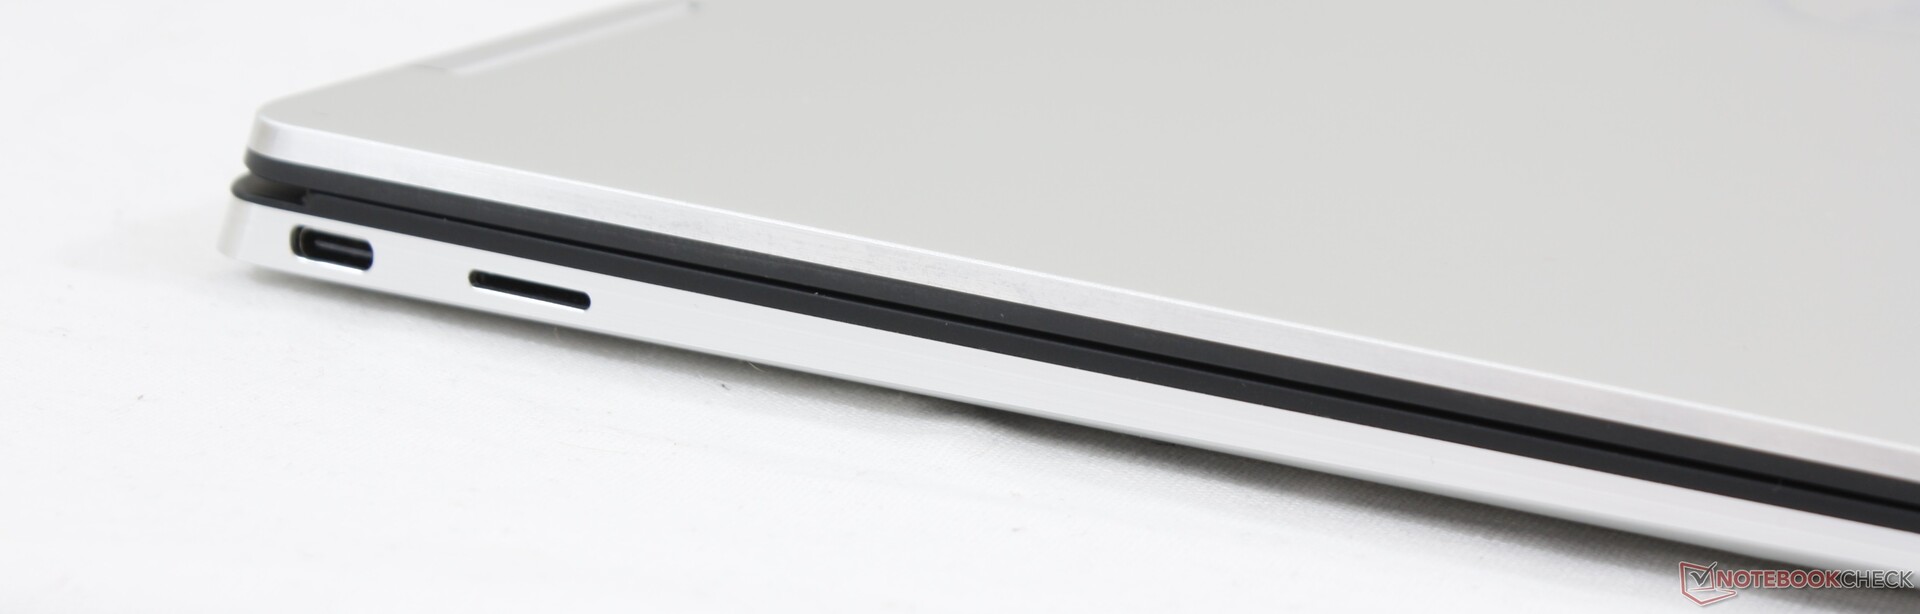
| Portos | 3x USB-C (2x Thunderbolt 4 + DisplayPort + Power Delivery) 1x USB-A 1x Áudio combinado de 3,5 mm Leitor MicroSD | 2x USB-C (2x Thunderbolt 3 + DisplayPort + Power Delivery) 1x Áudio combinado de 3,5 mm Leitor MicroSD |
| MSI Summit E13 Flip Evo A11MT Sharp LQ134N1JW53, IPS, 13.4", 1920x1200 | Dell XPS 13 7390 2-in-1 Core i7 Sharp LQ134N1, IPS, 13.4", 1920x1200 | |
|---|---|---|
| Display | 0% | |
| Display P3 Coverage (%) | 69.8 | 69.9 0% |
| sRGB Coverage (%) | 98.8 | 99.2 0% |
| AdobeRGB 1998 Coverage (%) | 70.6 | 71.5 1% |
| Response Times | 30% | |
| Response Time Grey 50% / Grey 80% * (ms) | 64 ? | 47.6 ? 26% |
| Response Time Black / White * (ms) | 44 ? | 29.2 ? 34% |
| PWM Frequency (Hz) | 2500 ? | |
| Screen | -15% | |
| Brightness middle (cd/m²) | 551.3 | 549.8 0% |
| Brightness (cd/m²) | 517 | 520 1% |
| Brightness Distribution (%) | 91 | 86 -5% |
| Black Level * (cd/m²) | 0.37 | 0.39 -5% |
| Contrast (:1) | 1490 | 1410 -5% |
| Colorchecker dE 2000 * | 1.45 | 2.12 -46% |
| Colorchecker dE 2000 max. * | 2.86 | 3.66 -28% |
| Colorchecker dE 2000 calibrated * | 1.7 | 1.37 19% |
| Greyscale dE 2000 * | 1.3 | 2.6 -100% |
| Gamma | 2.14 103% | 2.3 96% |
| CCT | 6580 99% | 6884 94% |
| Color Space (Percent of AdobeRGB 1998) (%) | 65 | 65.4 1% |
| Color Space (Percent of sRGB) (%) | 99 | 99.7 1% |
| Média Total (Programa/Configurações) | 5% /
-7% |
* ... menor é melhor
Cinebench R23: Multi Core | Single Core
Cinebench R15: CPU Single 64Bit | CPU Multi 64Bit
Blender: v2.79 BMW27 CPU
7-Zip 18.03: 7z b 4 -mmt1 | 7z b 4
Geekbench 5.5: Single-Core | Multi-Core
HWBOT x265 Benchmark v2.2: 4k Preset
LibreOffice : 20 Documents To PDF
R Benchmark 2.5: Overall mean
| Cinebench R20 / CPU (Multi Core) | |
| MSI Summit E13 Flip Evo A11MT | |
| Dell XPS 13 7390 2-in-1 Core i7 | |
| Cinebench R20 / CPU (Single Core) | |
| MSI Summit E13 Flip Evo A11MT | |
| Dell XPS 13 7390 2-in-1 Core i7 | |
| Cinebench R23 / Multi Core | |
| MSI Summit E13 Flip Evo A11MT | |
| Cinebench R23 / Single Core | |
| MSI Summit E13 Flip Evo A11MT | |
| Cinebench R15 / CPU Single 64Bit | |
| MSI Summit E13 Flip Evo A11MT | |
| Dell XPS 13 7390 2-in-1 Core i7 | |
| Cinebench R15 / CPU Multi 64Bit | |
| MSI Summit E13 Flip Evo A11MT | |
| Dell XPS 13 7390 2-in-1 Core i7 | |
| Blender / v2.79 BMW27 CPU | |
| Dell XPS 13 7390 2-in-1 Core i7 | |
| MSI Summit E13 Flip Evo A11MT | |
| 7-Zip 18.03 / 7z b 4 -mmt1 | |
| MSI Summit E13 Flip Evo A11MT | |
| Dell XPS 13 7390 2-in-1 Core i7 | |
| 7-Zip 18.03 / 7z b 4 | |
| MSI Summit E13 Flip Evo A11MT | |
| Dell XPS 13 7390 2-in-1 Core i7 | |
| Geekbench 5.5 / Single-Core | |
| MSI Summit E13 Flip Evo A11MT | |
| Geekbench 5.5 / Multi-Core | |
| MSI Summit E13 Flip Evo A11MT | |
| HWBOT x265 Benchmark v2.2 / 4k Preset | |
| MSI Summit E13 Flip Evo A11MT | |
| Dell XPS 13 7390 2-in-1 Core i7 | |
| LibreOffice / 20 Documents To PDF | |
| MSI Summit E13 Flip Evo A11MT | |
| R Benchmark 2.5 / Overall mean | |
| MSI Summit E13 Flip Evo A11MT | |
* ... menor é melhor
| PCMark 10 | |
| Score | |
| MSI Summit E13 Flip Evo A11MT | |
| Dell XPS 13 7390 2-in-1 Core i7 | |
| Essentials | |
| Dell XPS 13 7390 2-in-1 Core i7 | |
| MSI Summit E13 Flip Evo A11MT | |
| Productivity | |
| Dell XPS 13 7390 2-in-1 Core i7 | |
| MSI Summit E13 Flip Evo A11MT | |
| Digital Content Creation | |
| MSI Summit E13 Flip Evo A11MT | |
| Dell XPS 13 7390 2-in-1 Core i7 | |
| 3DMark | |
| 1920x1080 Fire Strike Graphics | |
| MSI Summit E13 Flip Evo A11MT | |
| Dell XPS 13 9310 Core i7 4K | |
| Dell XPS 13 7390 2-in-1 Core i7 | |
| 2560x1440 Time Spy Graphics | |
| MSI Summit E13 Flip Evo A11MT | |
| Dell XPS 13 9310 Core i7 4K | |
| Dell XPS 13 7390 2-in-1 Core i7 | |
| 2560x1440 Time Spy Score | |
| MSI Summit E13 Flip Evo A11MT | |
| Dell XPS 13 9310 Core i7 4K | |
| Dell XPS 13 7390 2-in-1 Core i7 | |
| 3DMark 11 | |
| 1280x720 Performance GPU | |
| MSI Summit E13 Flip Evo A11MT | |
| Dell XPS 13 9310 Core i7 4K | |
| Dell XPS 13 7390 2-in-1 Core i7 | |
| 1280x720 Performance Combined | |
| MSI Summit E13 Flip Evo A11MT | |
| Dell XPS 13 9310 Core i7 4K | |
| Dell XPS 13 7390 2-in-1 Core i7 | |
| MSI Summit E13 Flip Evo A11MT Iris Xe G7 96EUs, i7-1185G7, Phison 1TB SM2801T24GKBB4S-E162 | Dell XPS 13 7390 2-in-1 Core i7 Iris Plus Graphics G7 (Ice Lake 64 EU), i7-1065G7, Toshiba BG4 KBG40ZPZ512G | |
|---|---|---|
| Noise | -4% | |
| desligado / ambiente * (dB) | 24.5 | 28.1 -15% |
| Idle Minimum * (dB) | 24.7 | 28.1 -14% |
| Idle Average * (dB) | 24.7 | 28.1 -14% |
| Idle Maximum * (dB) | 26.4 | 28.1 -6% |
| Load Average * (dB) | 37.8 | 31.7 16% |
| Witcher 3 ultra * (dB) | 41.4 | 43.4 -5% |
| Load Maximum * (dB) | 48.8 | 43.4 11% |
* ... menor é melhor
| MSI Summit E13 Flip Evo A11MT i7-1185G7, Iris Xe G7 96EUs, 70 Wh | Dell XPS 13 7390 2-in-1 Core i7 i7-1065G7, Iris Plus Graphics G7 (Ice Lake 64 EU), 51 Wh | |
|---|---|---|
| Duração da bateria | -20% | |
| Reader / Idle (h) | 21.1 | |
| WiFi v1.3 (h) | 11.2 | 9 -20% |
| Load (h) | 1.8 |
Price comparison

