Core i7-1165G7 vs. Core i7-1185G7: Dell XPS 13 9310 4K Revisão de Laptop
")
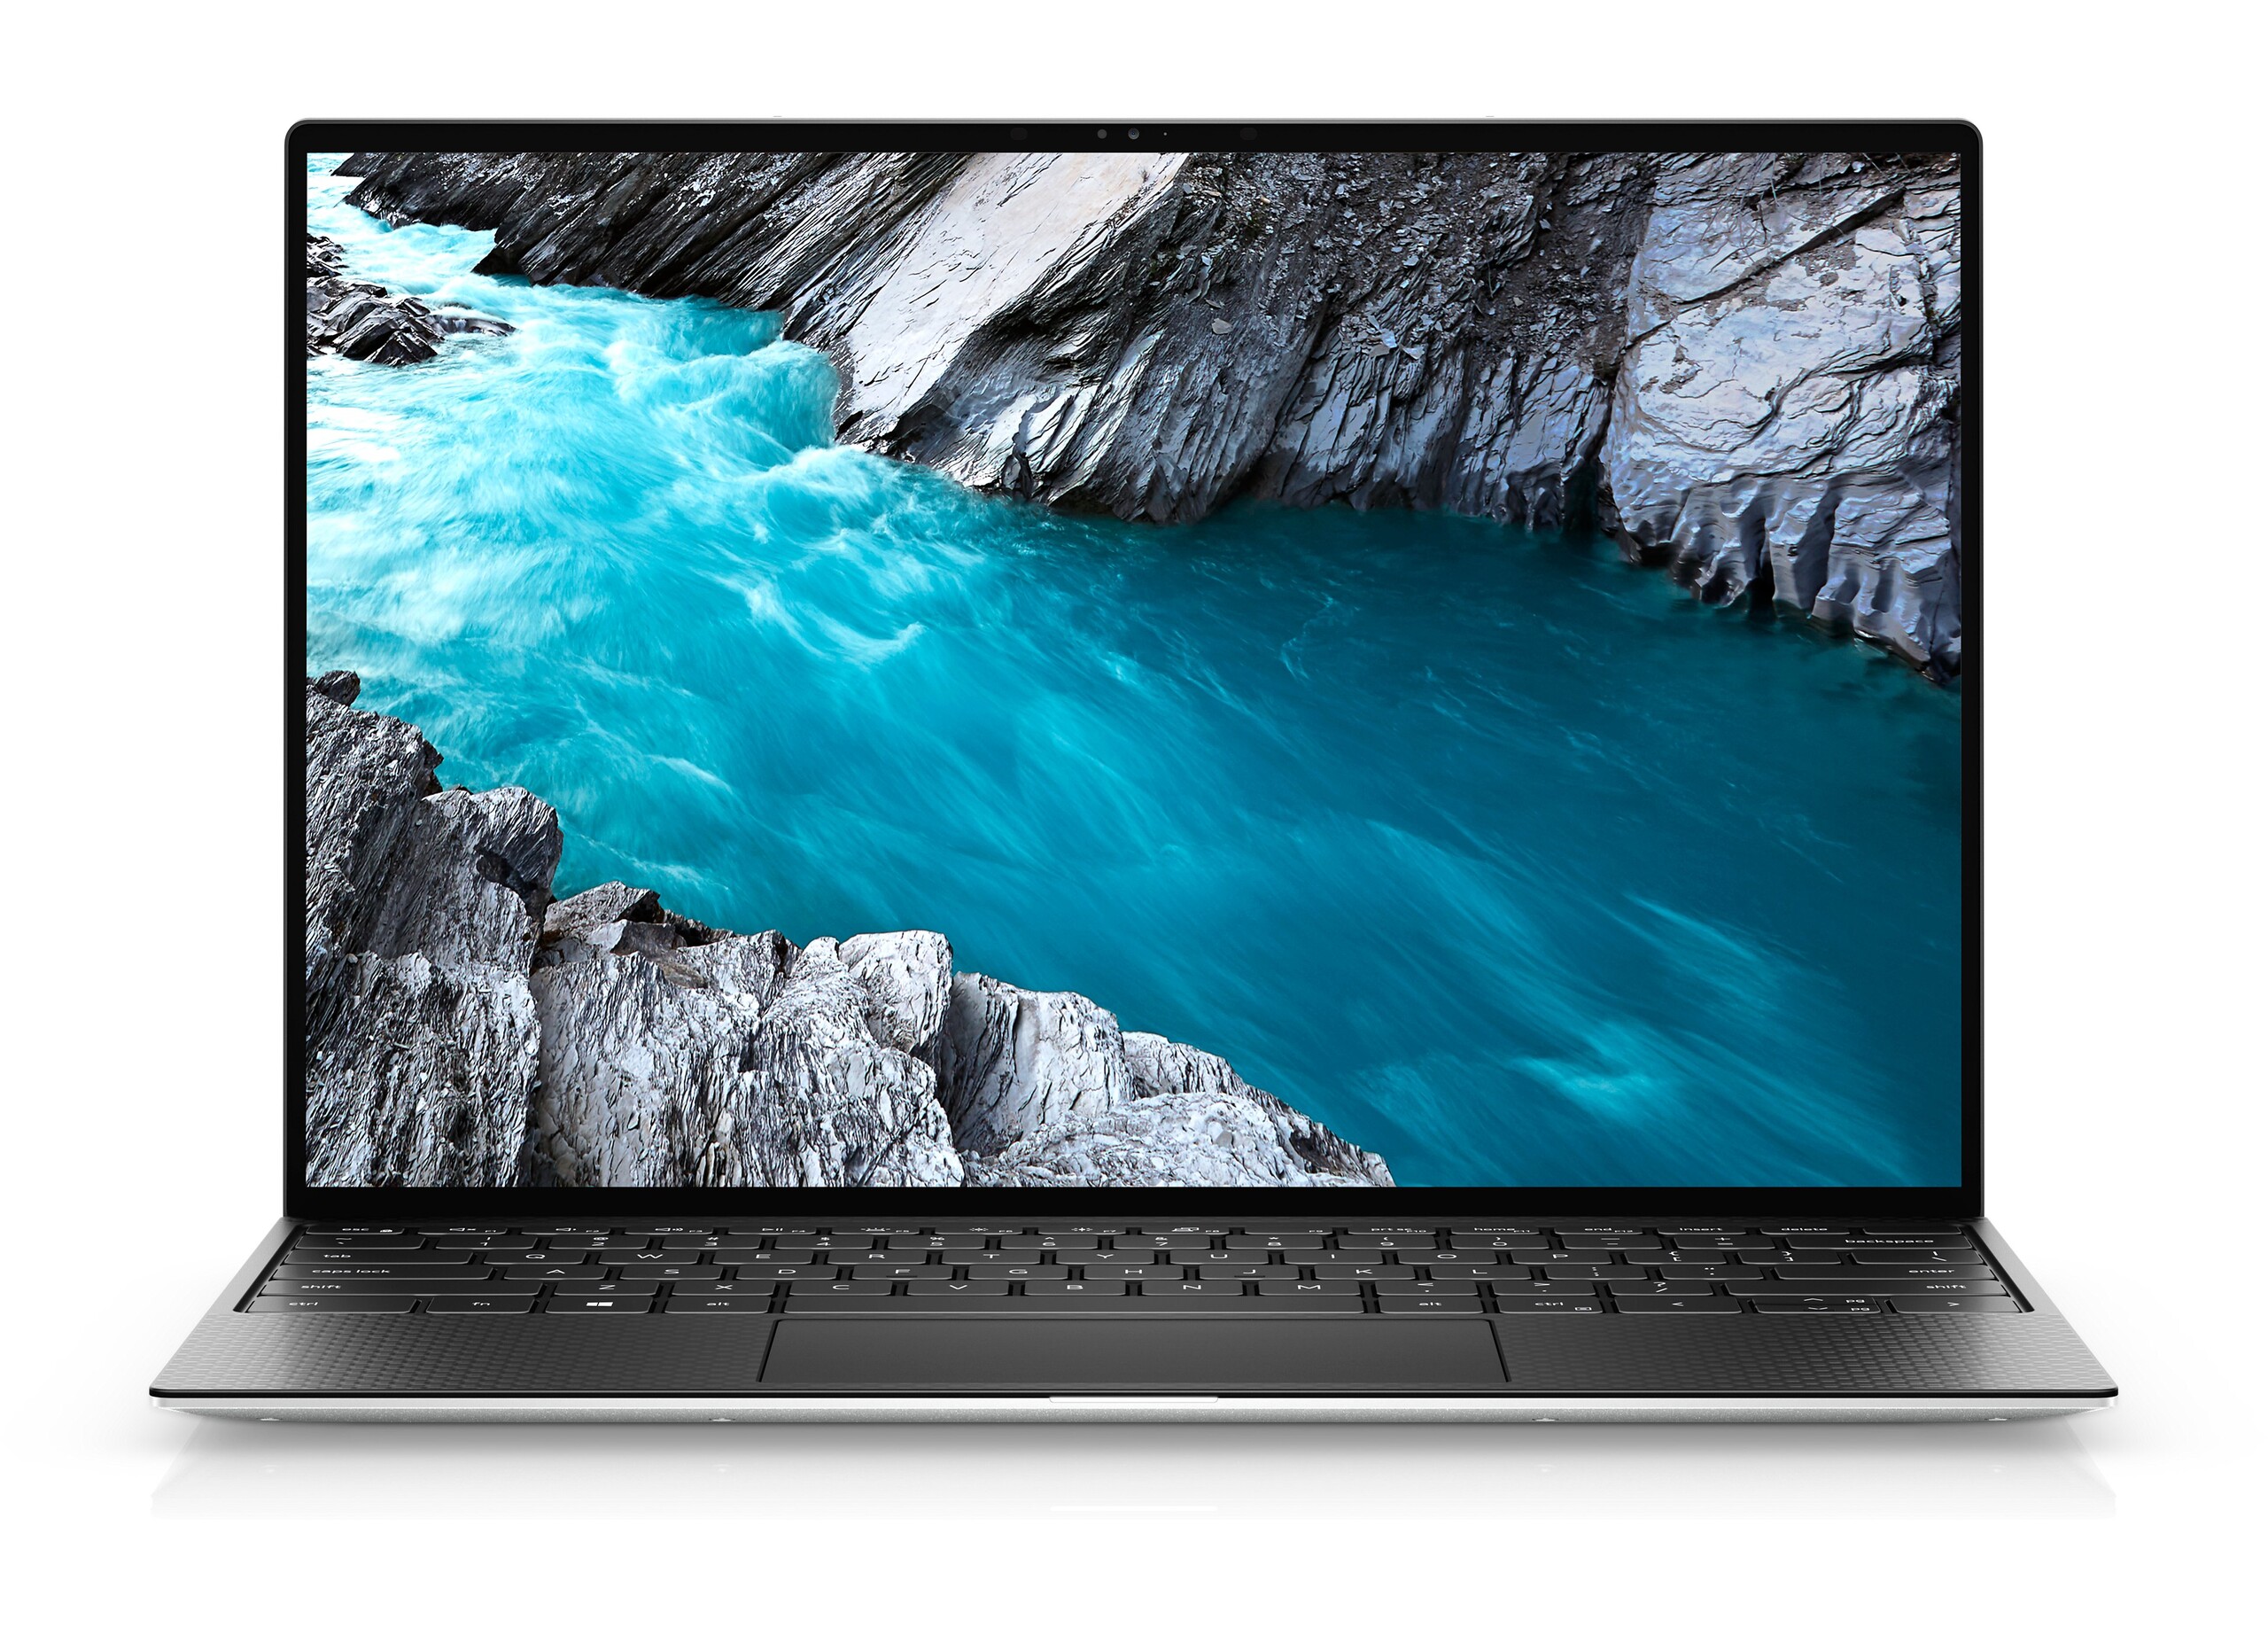
O Dell XPS 13 9310 foi lançado há apenas alguns meses ao lado da novíssima plataforma da Intel, a 11ª geração Tiger Lake-U. Com base em nosso tempo com uma unidade, o desempenho provou ser uma atualização notável do XPS 13 9300, especialmente em termos de gráficos, embora não tenha havido mudanças no design externo. Se você possuísse um modelo XPS mais antigo ou pudesse usar o impulso gráfico, então uma atualização para o XPS 13 9310 faria muito sentido.
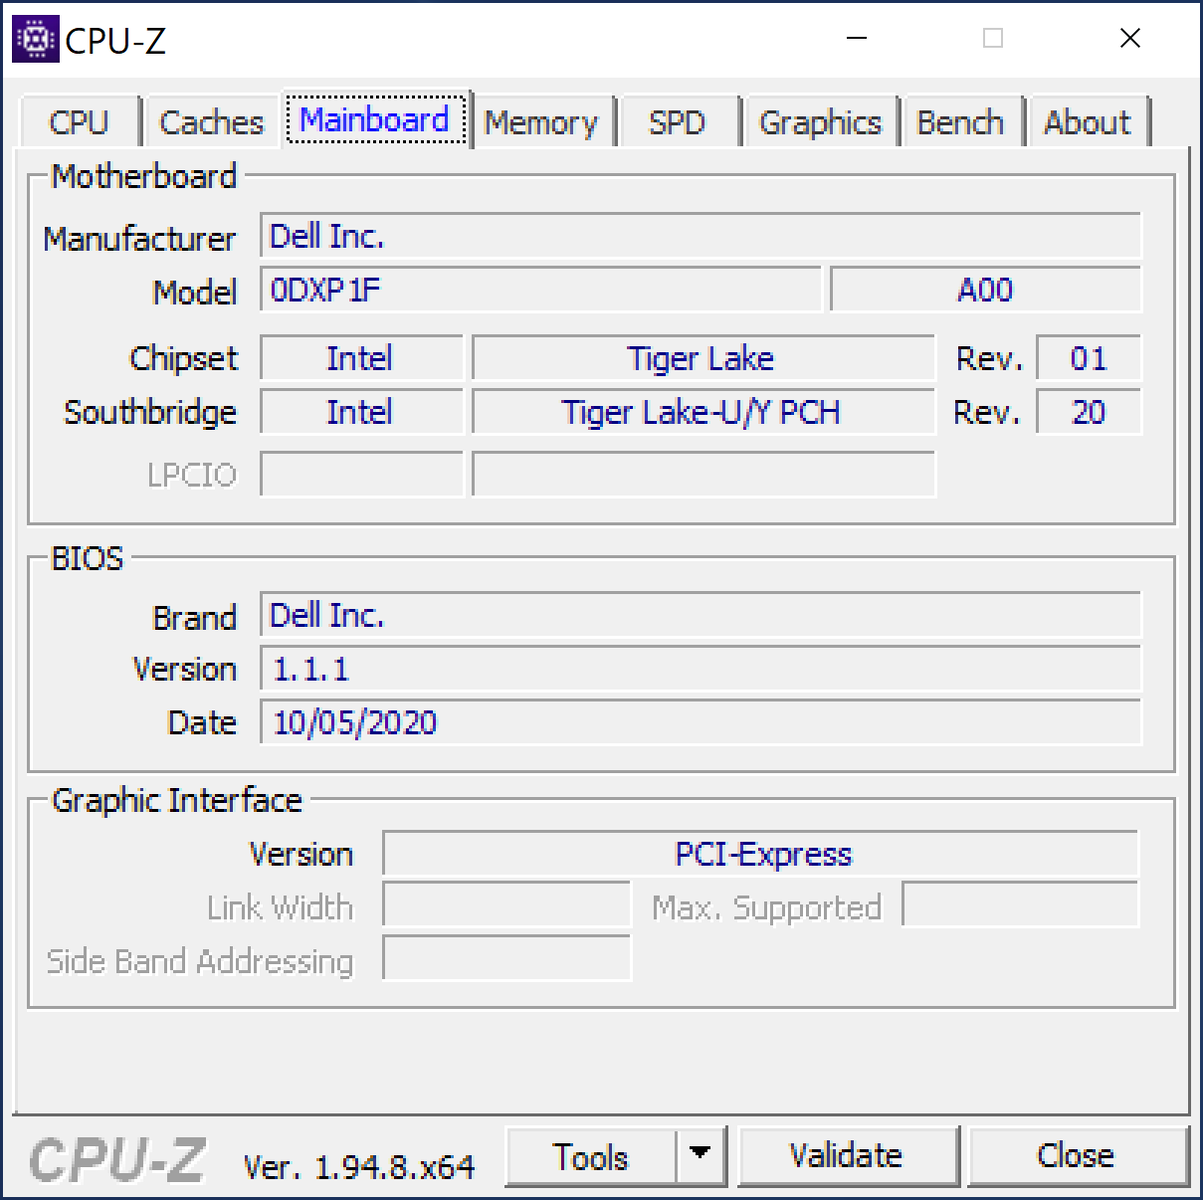
Desta vez, a Dell nos enviou uma segunda unidade XPS 13 9310 de última geração equipada com a CPU Core i7-1185G7 e display 4K UHD em contraste com nossa primeira unidade equipada com o display Core i7-1165G7 e FHD. A configuração atualmente é de varejo por cerca de $1600 USD ou aproximadamente $300 a mais do que a opção Core i7-1165G7/FHD. Veja nossas revisões existentes sobre o XPS 13 9300 e XPS 13 9310 para saber mais sobre o chassi e suas características, pois nossa revisão aqui se concentrará nas diferenças entre as SKUs Core i7-1165G7/FHD e Core i7-1185G7/4K XPS 13 9310. A opção mais cara vale o Benjamins extra?
Mais análises da Dell:
potential competitors in comparison
Avaliação | Data | Modelo | Peso | Altura | Size | Resolução | Preço |
|---|---|---|---|---|---|---|---|
| 87.4 % v7 (old) | 12/2020 | Dell XPS 13 9310 Core i7 4K i7-1185G7, Iris Xe G7 96EUs | 1.3 kg | 14.8 mm | 13.40" | 3840x2400 | |
| 85.1 % v7 (old) | 10/2020 | Asus Zenbook S UX393JA i7-1065G7, Iris Plus Graphics G7 (Ice Lake 64 EU) | 1.4 kg | 15.7 mm | 13.90" | 3300x2200 | |
| 87.4 % v7 (old) | 06/2020 | Huawei MateBook X Pro 2020 i7 i7-10510U, GeForce MX250 | 1.3 kg | 14.6 mm | 13.90" | 3000x2000 | |
| 88.9 % v7 (old) | 03/2020 | Dell XPS 13 9300 Core i7-1065G7 i7-1065G7, Iris Plus Graphics G7 (Ice Lake 64 EU) | 1.2 kg | 14.8 mm | 13.40" | 1920x1200 | |
| 85.3 % v7 (old) | 08/2020 | Lenovo Yoga Slim 7-14ARE R7 4800U, Vega 8 | 1.4 kg | 14.9 mm | 14.00" | 1920x1080 | |
| 88.4 % v7 (old) | 12/2019 | HP Spectre x360 13-aw0013dx i7-1065G7, Iris Plus Graphics G7 (Ice Lake 64 EU) | 1.2 kg | 16.9 mm | 13.30" | 1920x1080 |
Caso
Leitor de cartões SD
| SD Card Reader | |
| average JPG Copy Test (av. of 3 runs) | |
| Dell XPS 13 9310 Core i7 4K (Toshiba Exceria Pro M501 32 GB UHS-II) | |
| HP Spectre x360 13-aw0013dx (Toshiba Exceria Pro M501 microSDXC 64GB) | |
| Dell XPS 13 9300 Core i7-1065G7 (Toshiba Exceria Pro M501 64 GB UHS-II) | |
| Asus Zenbook S UX393JA (Toshiba Exceria Pro M501 64 GB UHS-II) | |
| Lenovo Yoga Slim 7-14ARE (Toshiba Exceria Pro M501 64 GB UHS-II) | |
| maximum AS SSD Seq Read Test (1GB) | |
| Dell XPS 13 9310 Core i7 4K (Toshiba Exceria Pro M501 32 GB UHS-II) | |
| Dell XPS 13 9300 Core i7-1065G7 (Toshiba Exceria Pro M501 64 GB UHS-II) | |
| HP Spectre x360 13-aw0013dx (Toshiba Exceria Pro M501 microSDXC 64GB) | |
| Lenovo Yoga Slim 7-14ARE (Toshiba Exceria Pro M501 64 GB UHS-II) | |
| Asus Zenbook S UX393JA (Toshiba Exceria Pro M501 64 GB UHS-II) | |
Comunicação
Webcam


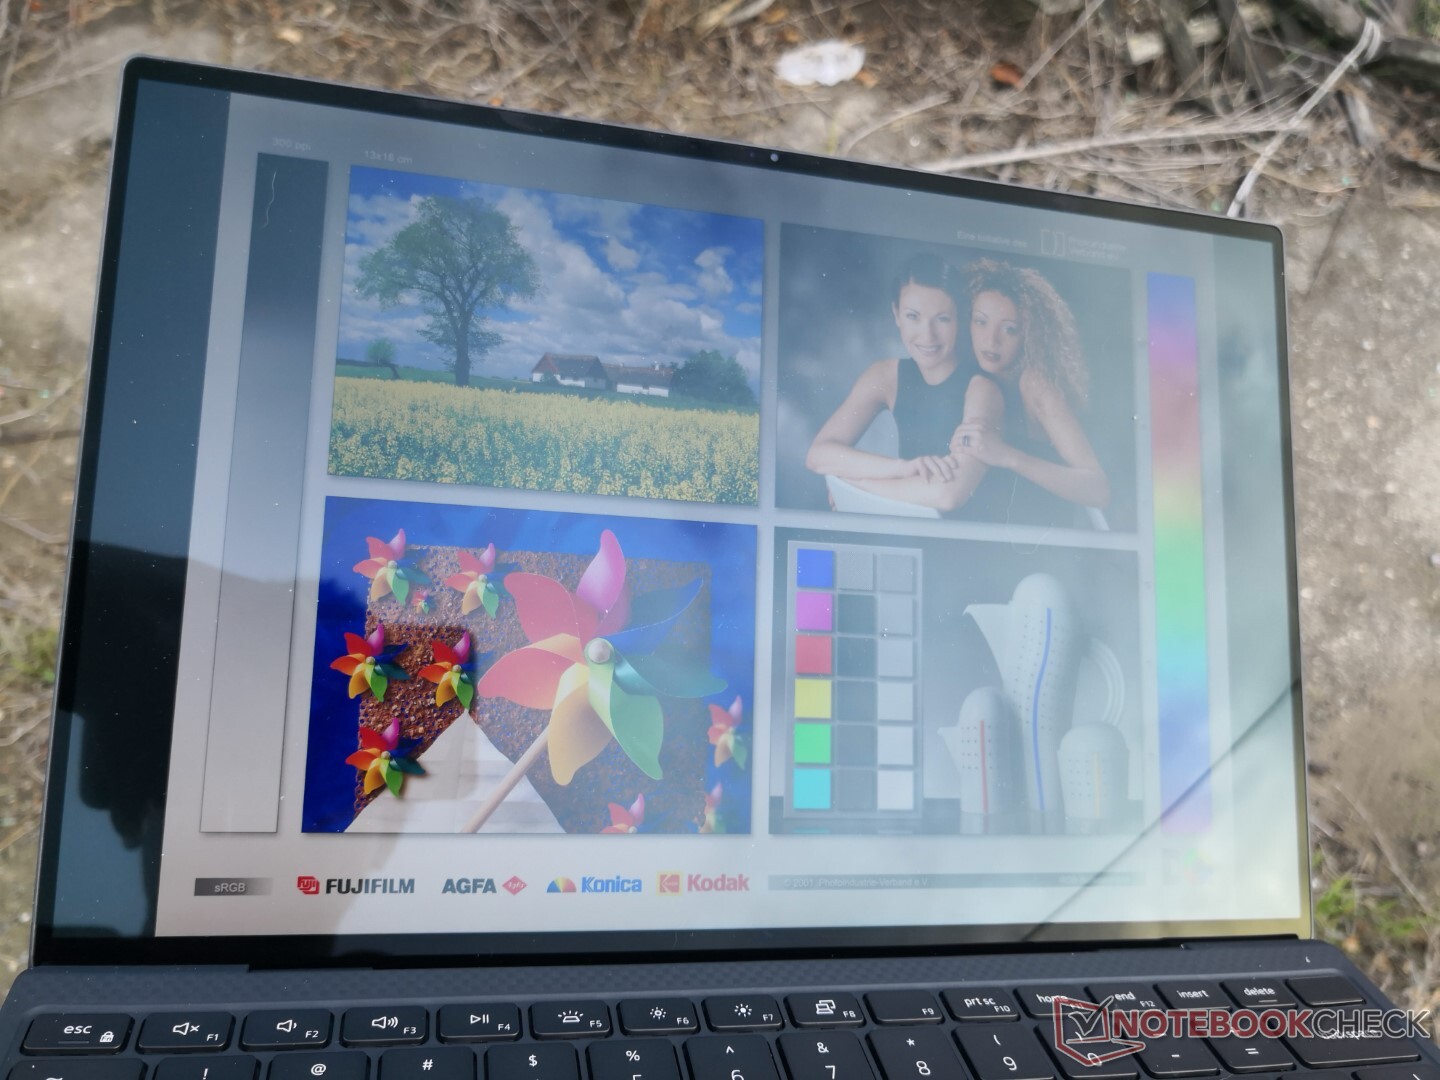
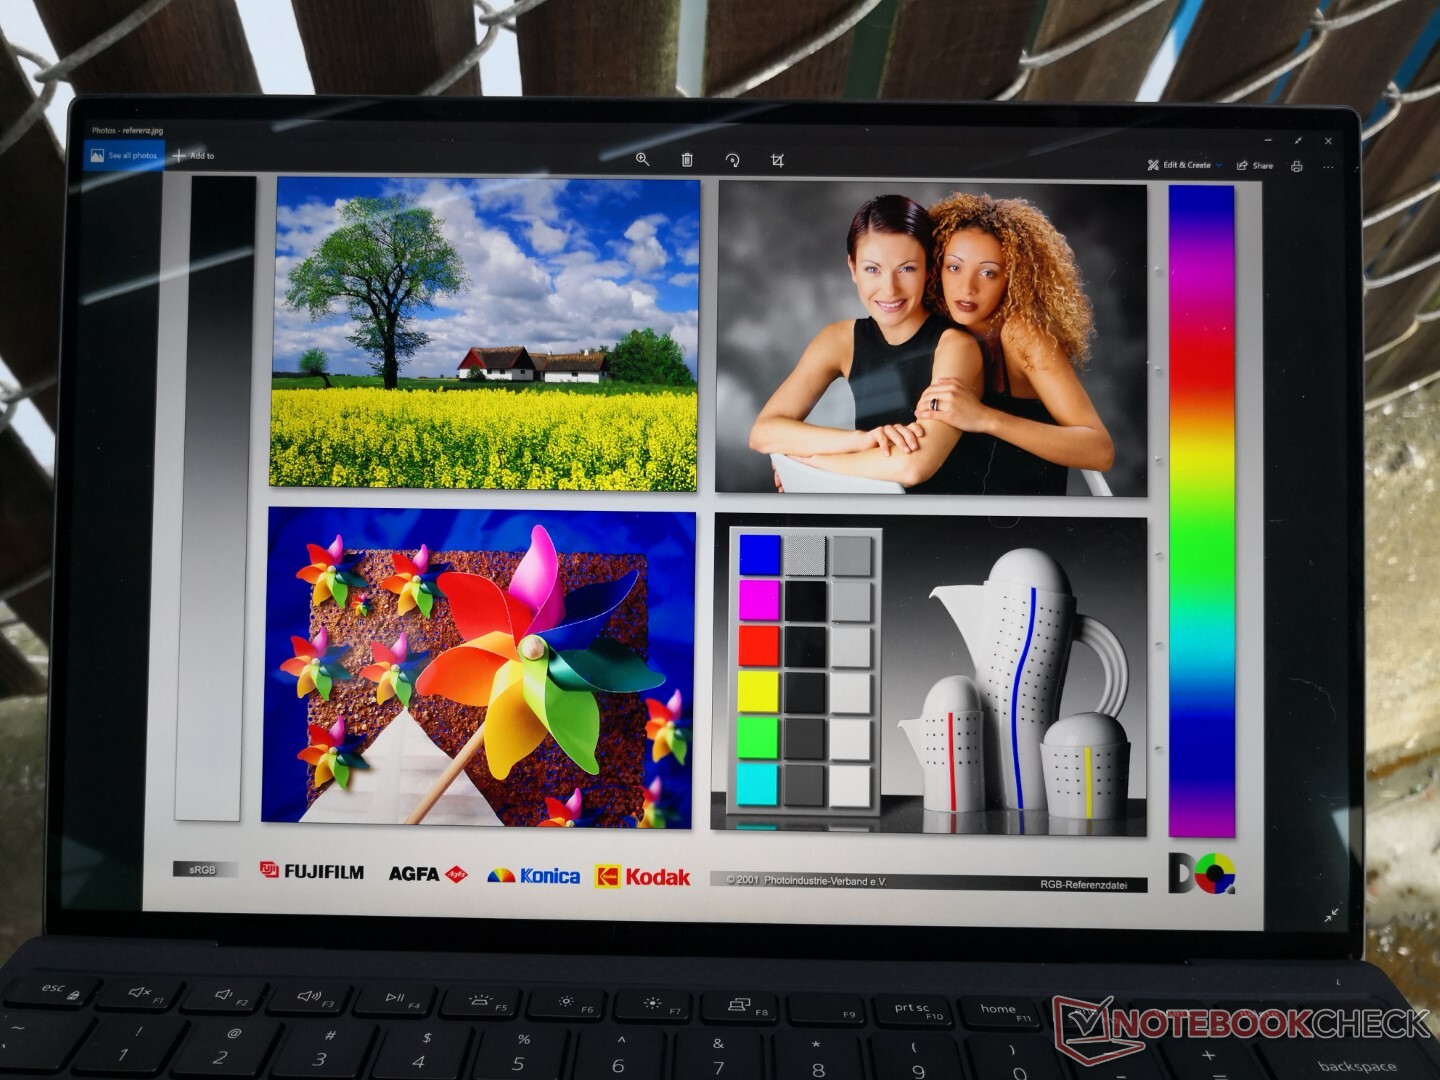
Mostrar
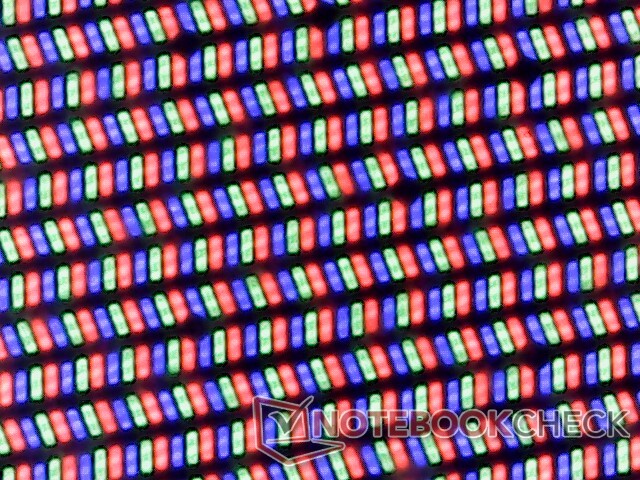
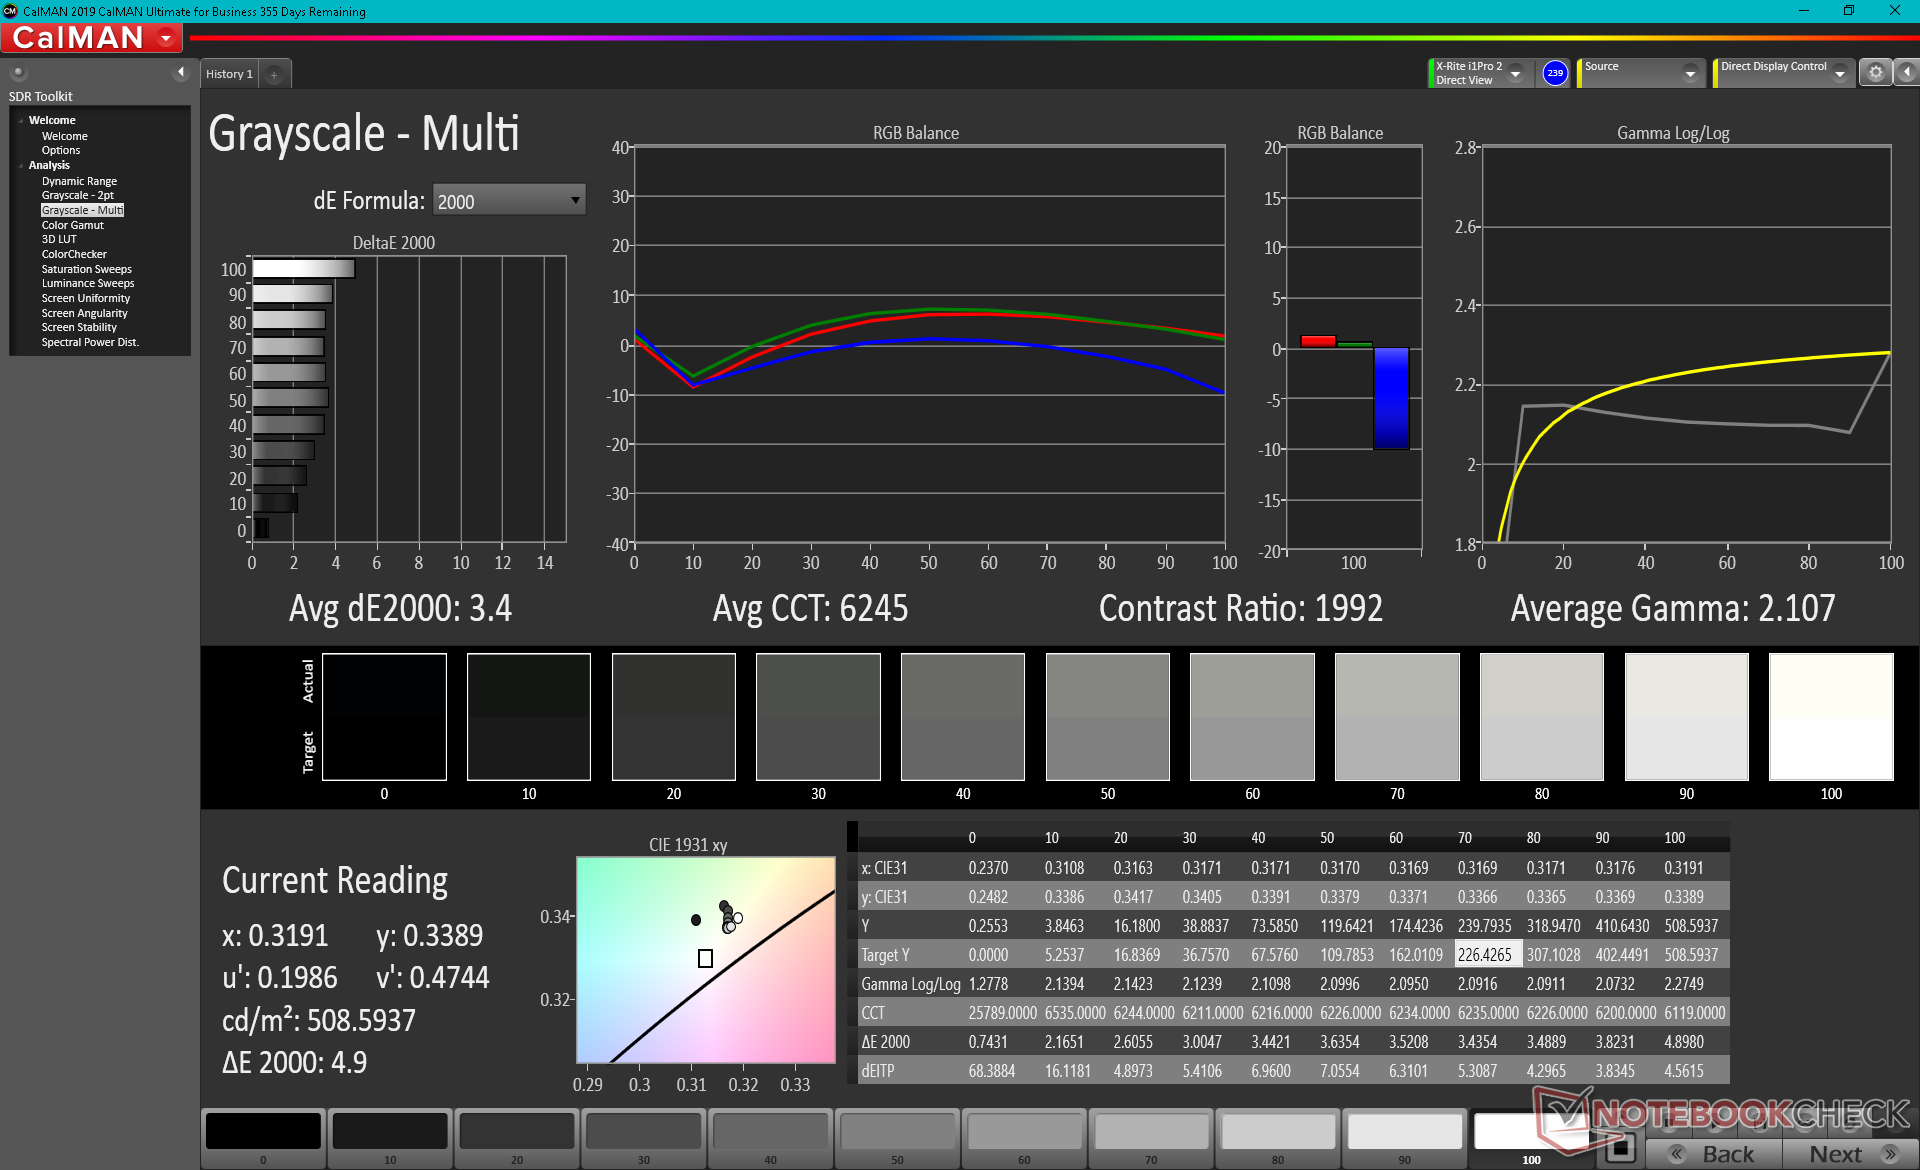
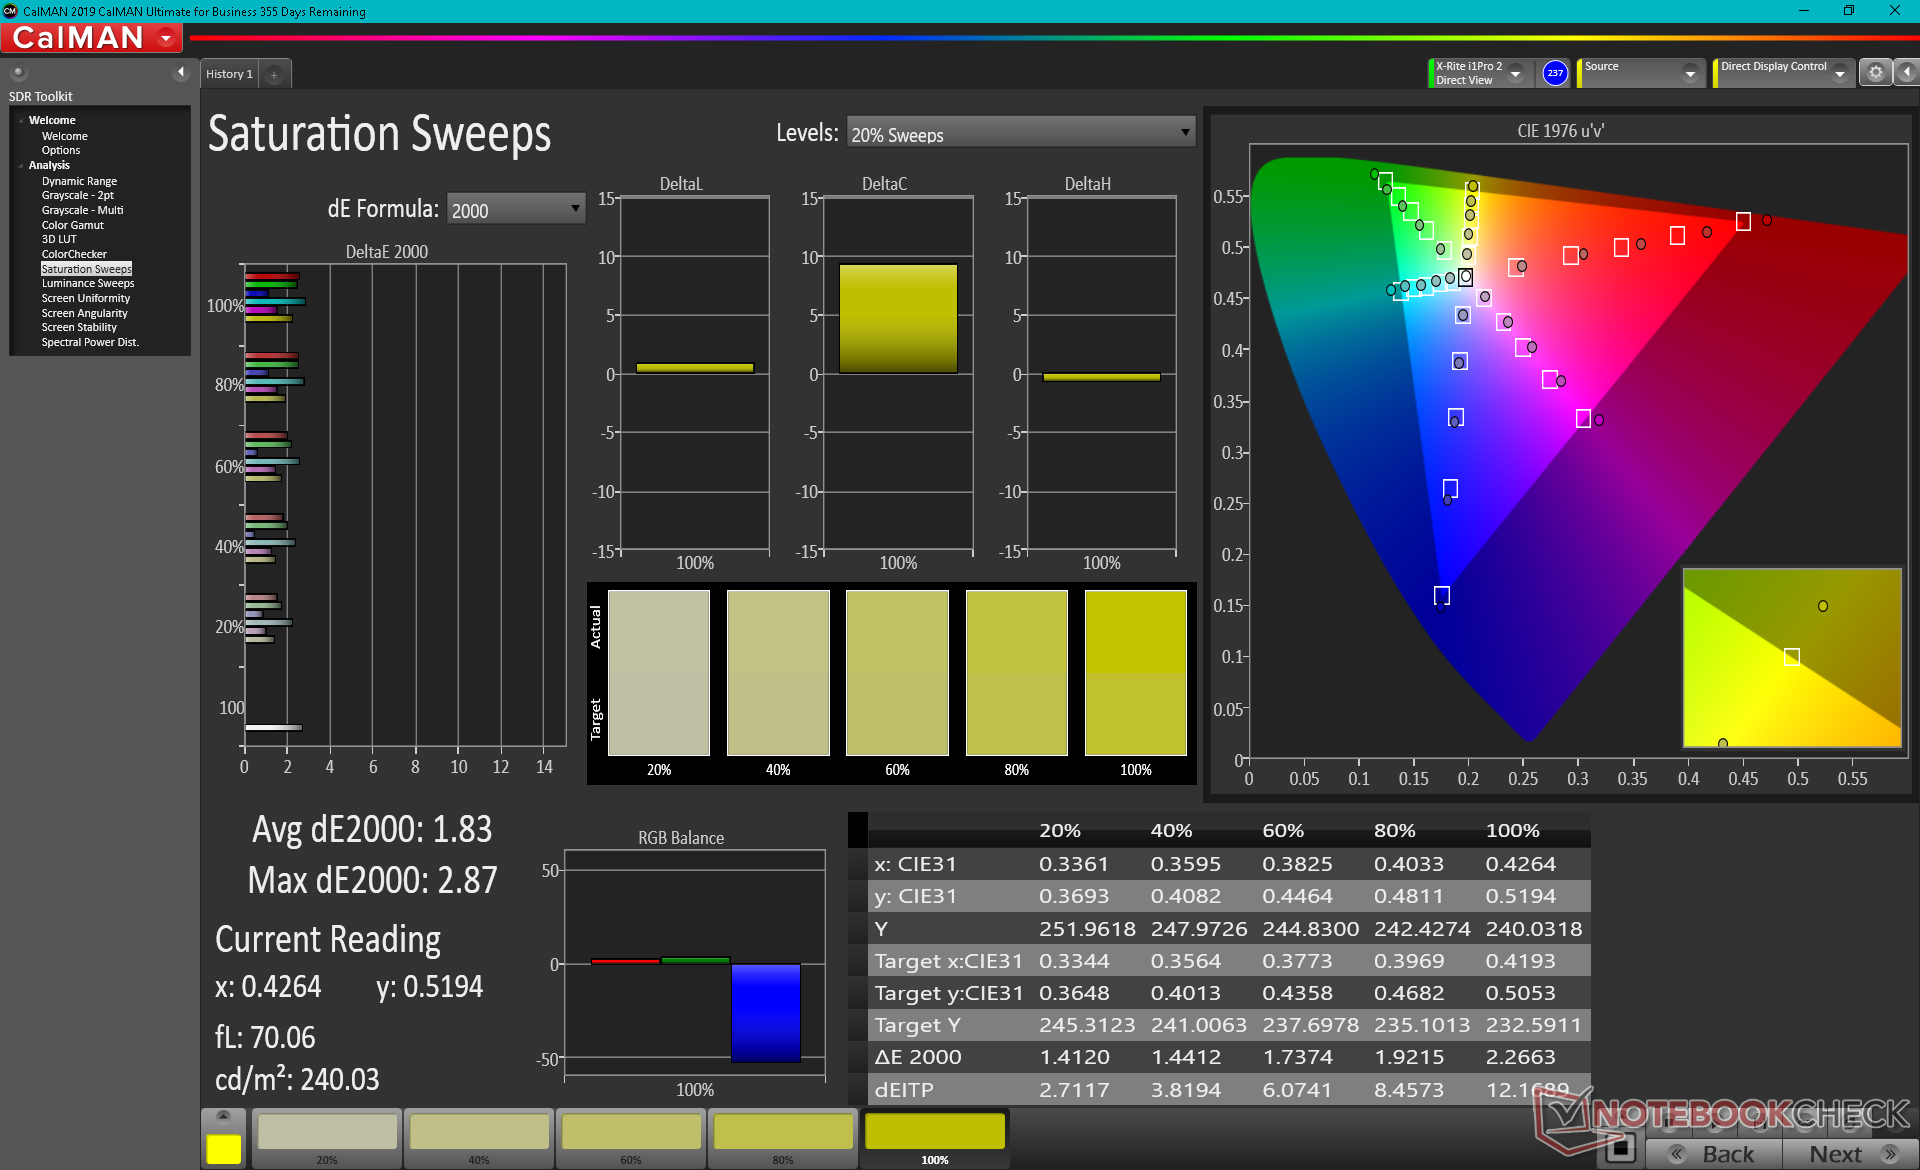
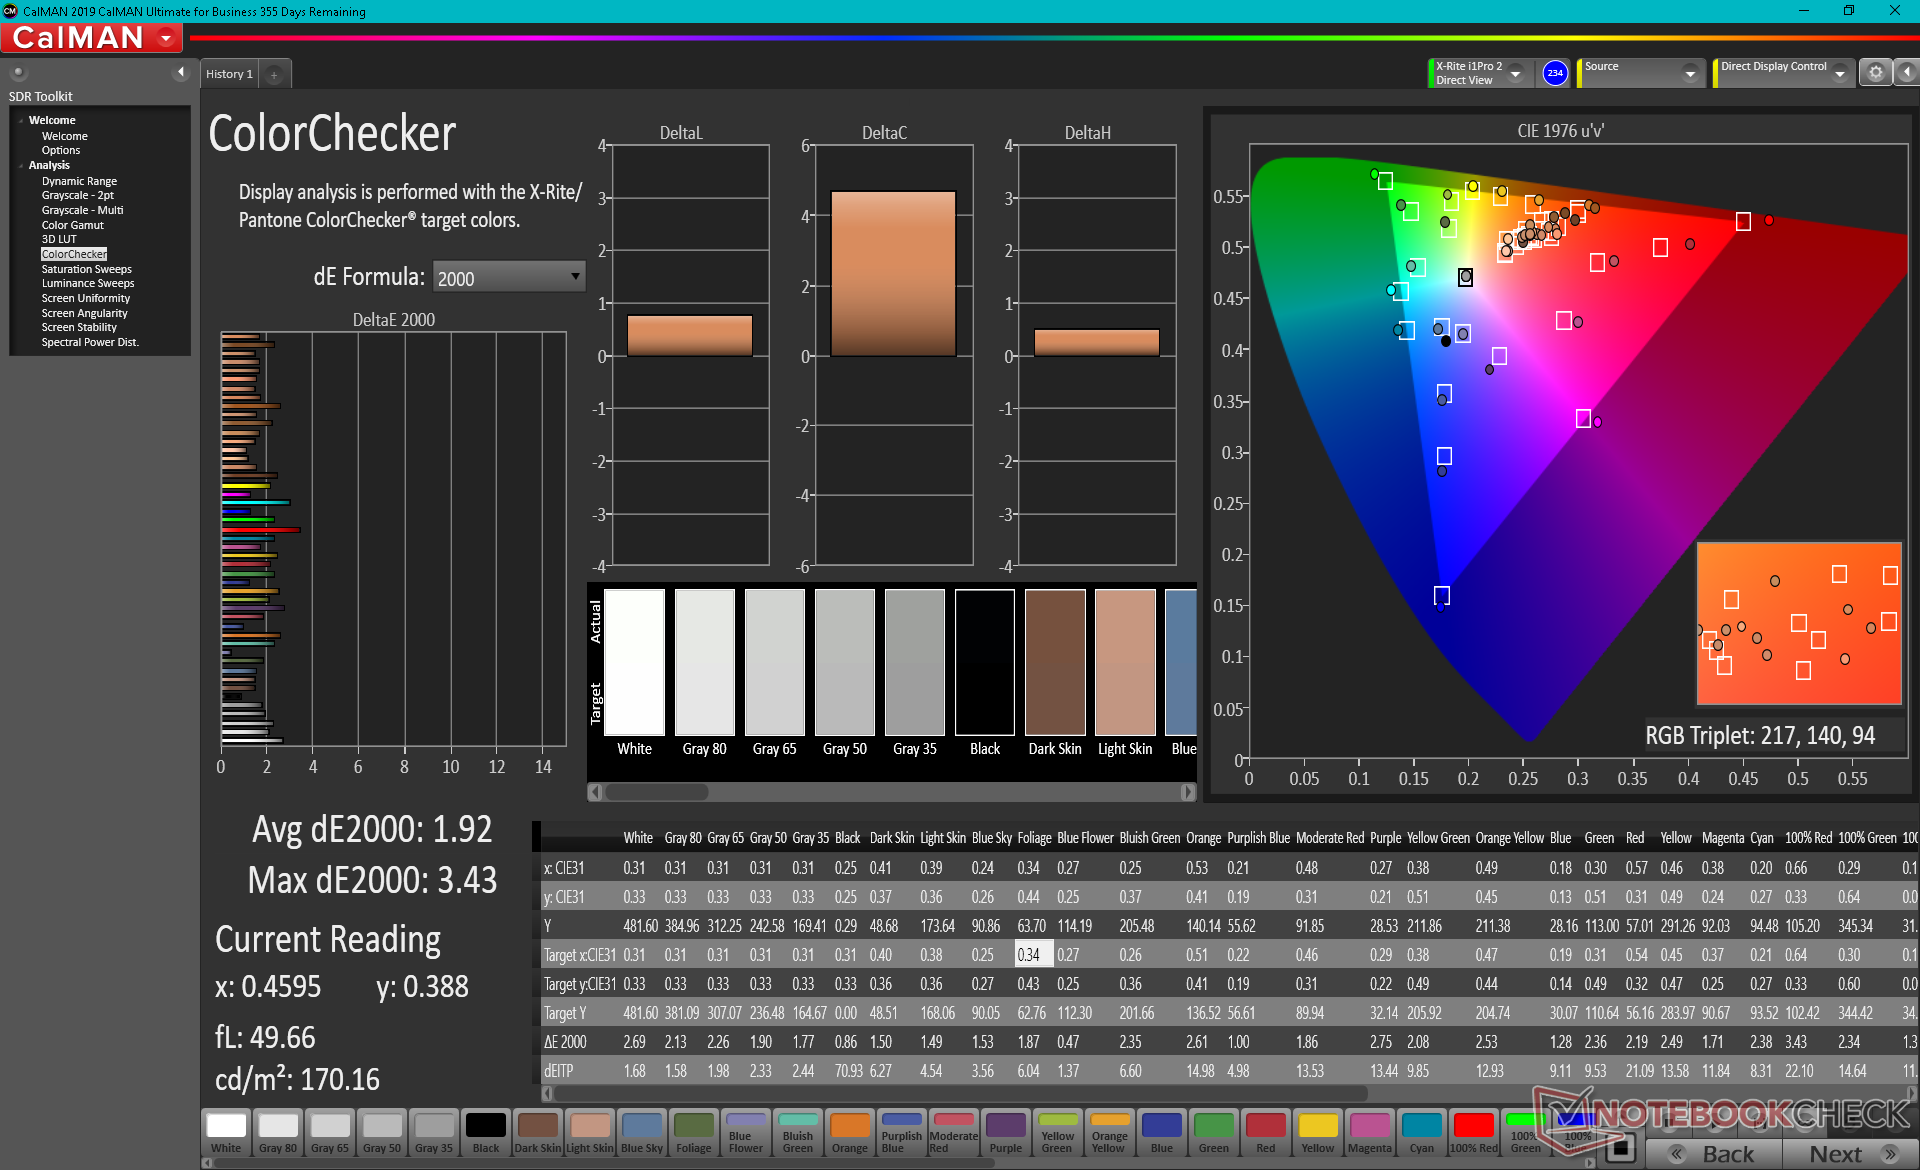
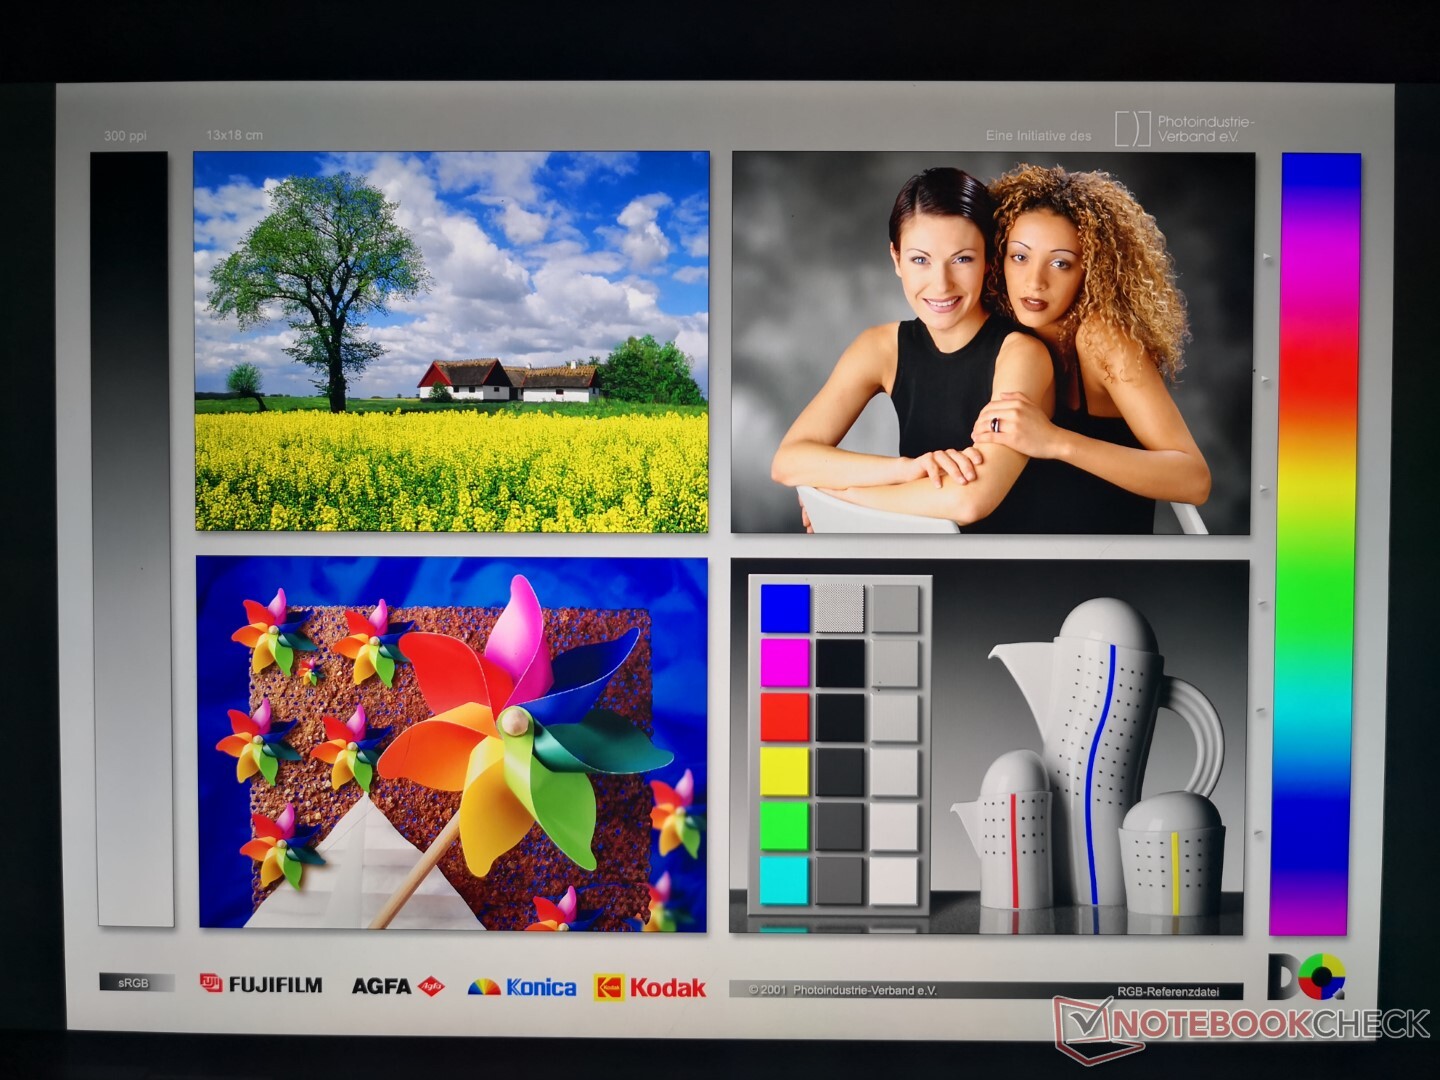
A Dell usa o mesmo painel IPS Sharp LQ134R1 para sua última geração XPS 13 9300 4K e geração atual XPS 13 9310 4K para uma experiência visual similar de gênero a gênero. Uma grande diferença que notamos entre nossas duas unidades, entretanto, está relacionada com a tela mais brilhante do mais novo XPS 13 9310 (479 lêndeas vs 401 lêndeas). A modulação por largura de pulso também está presente no modelo mais novo, enquanto que no XPS 13 9300 4K mais antigo ela estava ausente para sugerir que a Dell pode estar usando uma luz de fundo diferente desta vez.
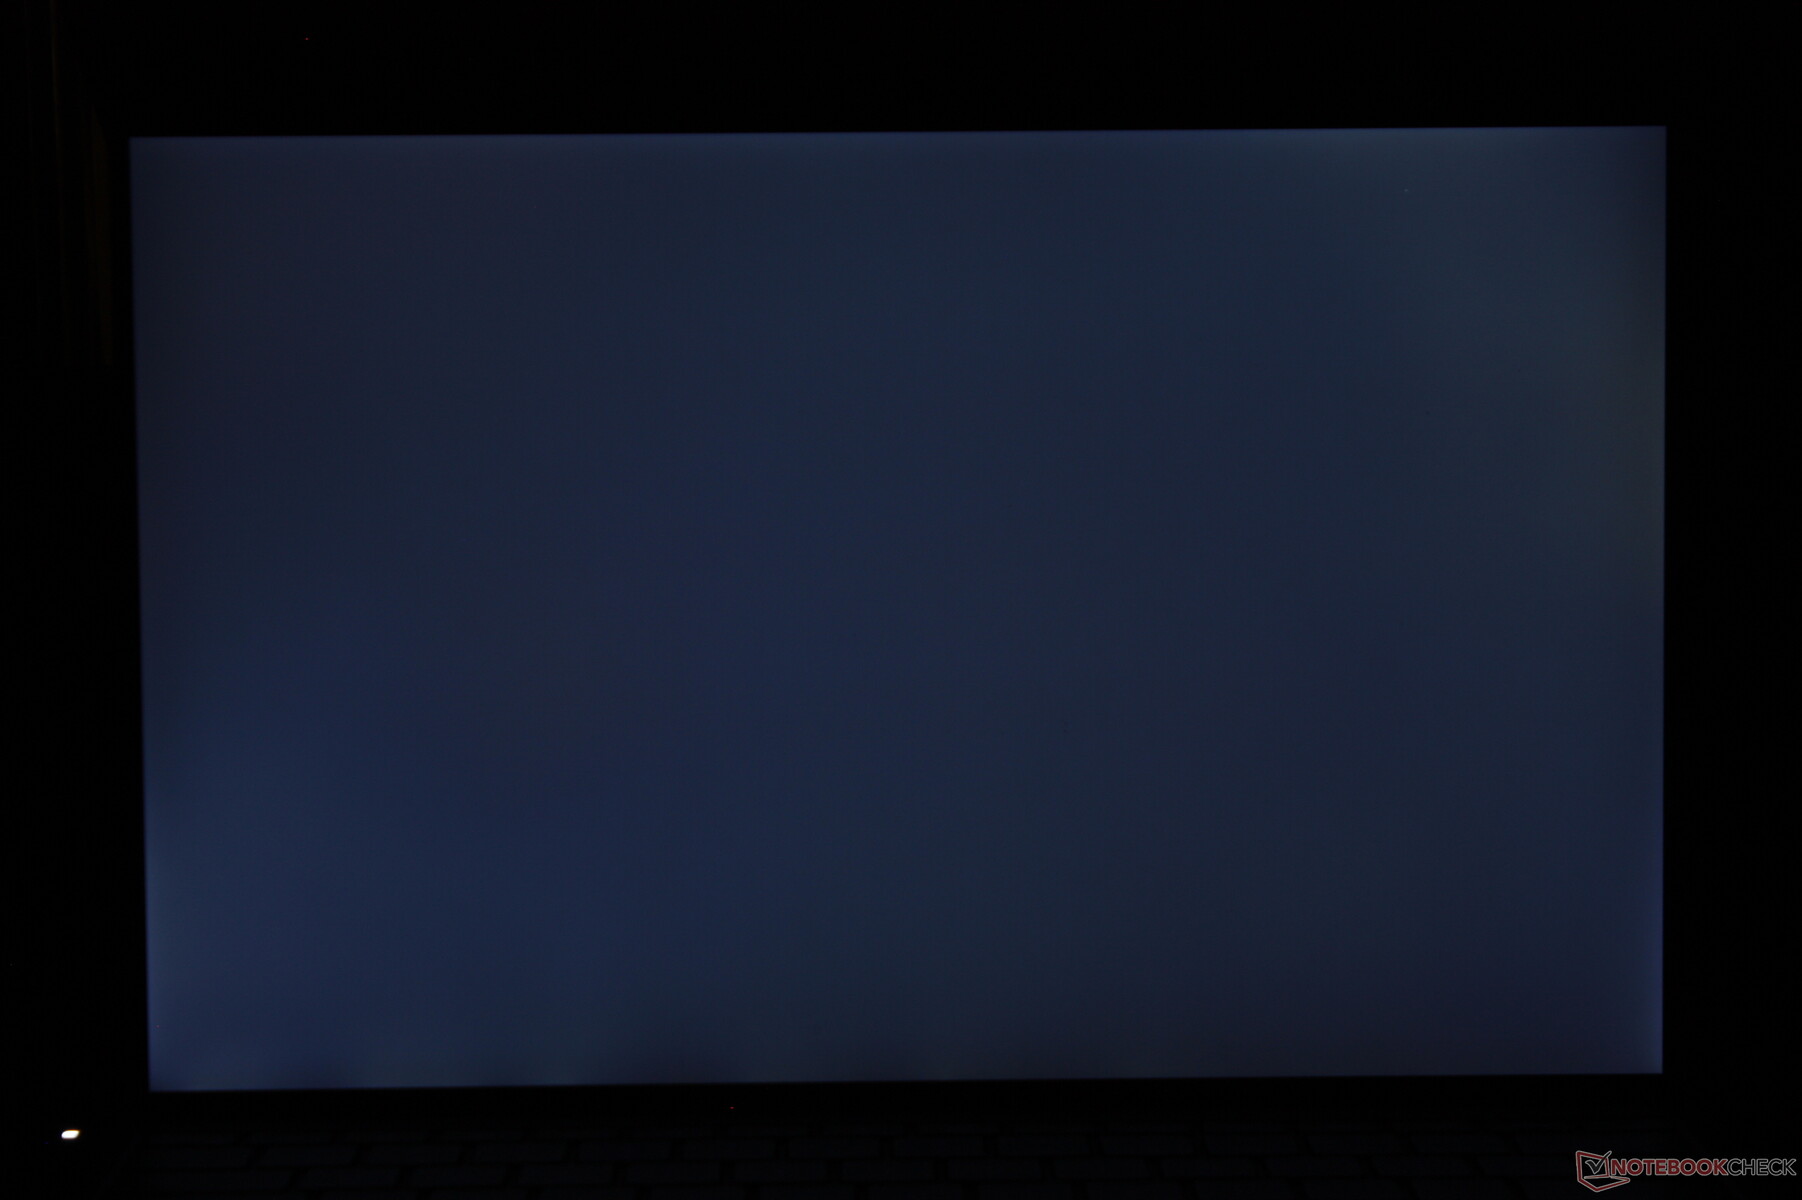
A uniformidade de luminosidade poderia ser um pouco melhor em nossa unidade. O canto superior esquerdo de nossa tela é ligeiramente mais escuro do que deveria ser, como mostram nossas medidas abaixo. Não é suficiente ser tão perceptível, mas esperamos melhor de uma série de bandeiras como o XPS.


| |||||||||||||||||||||||||
iluminação: 84 %
iluminação com acumulador: 508.7 cd/m²
Contraste: 1696:1 (Preto: 0.3 cd/m²)
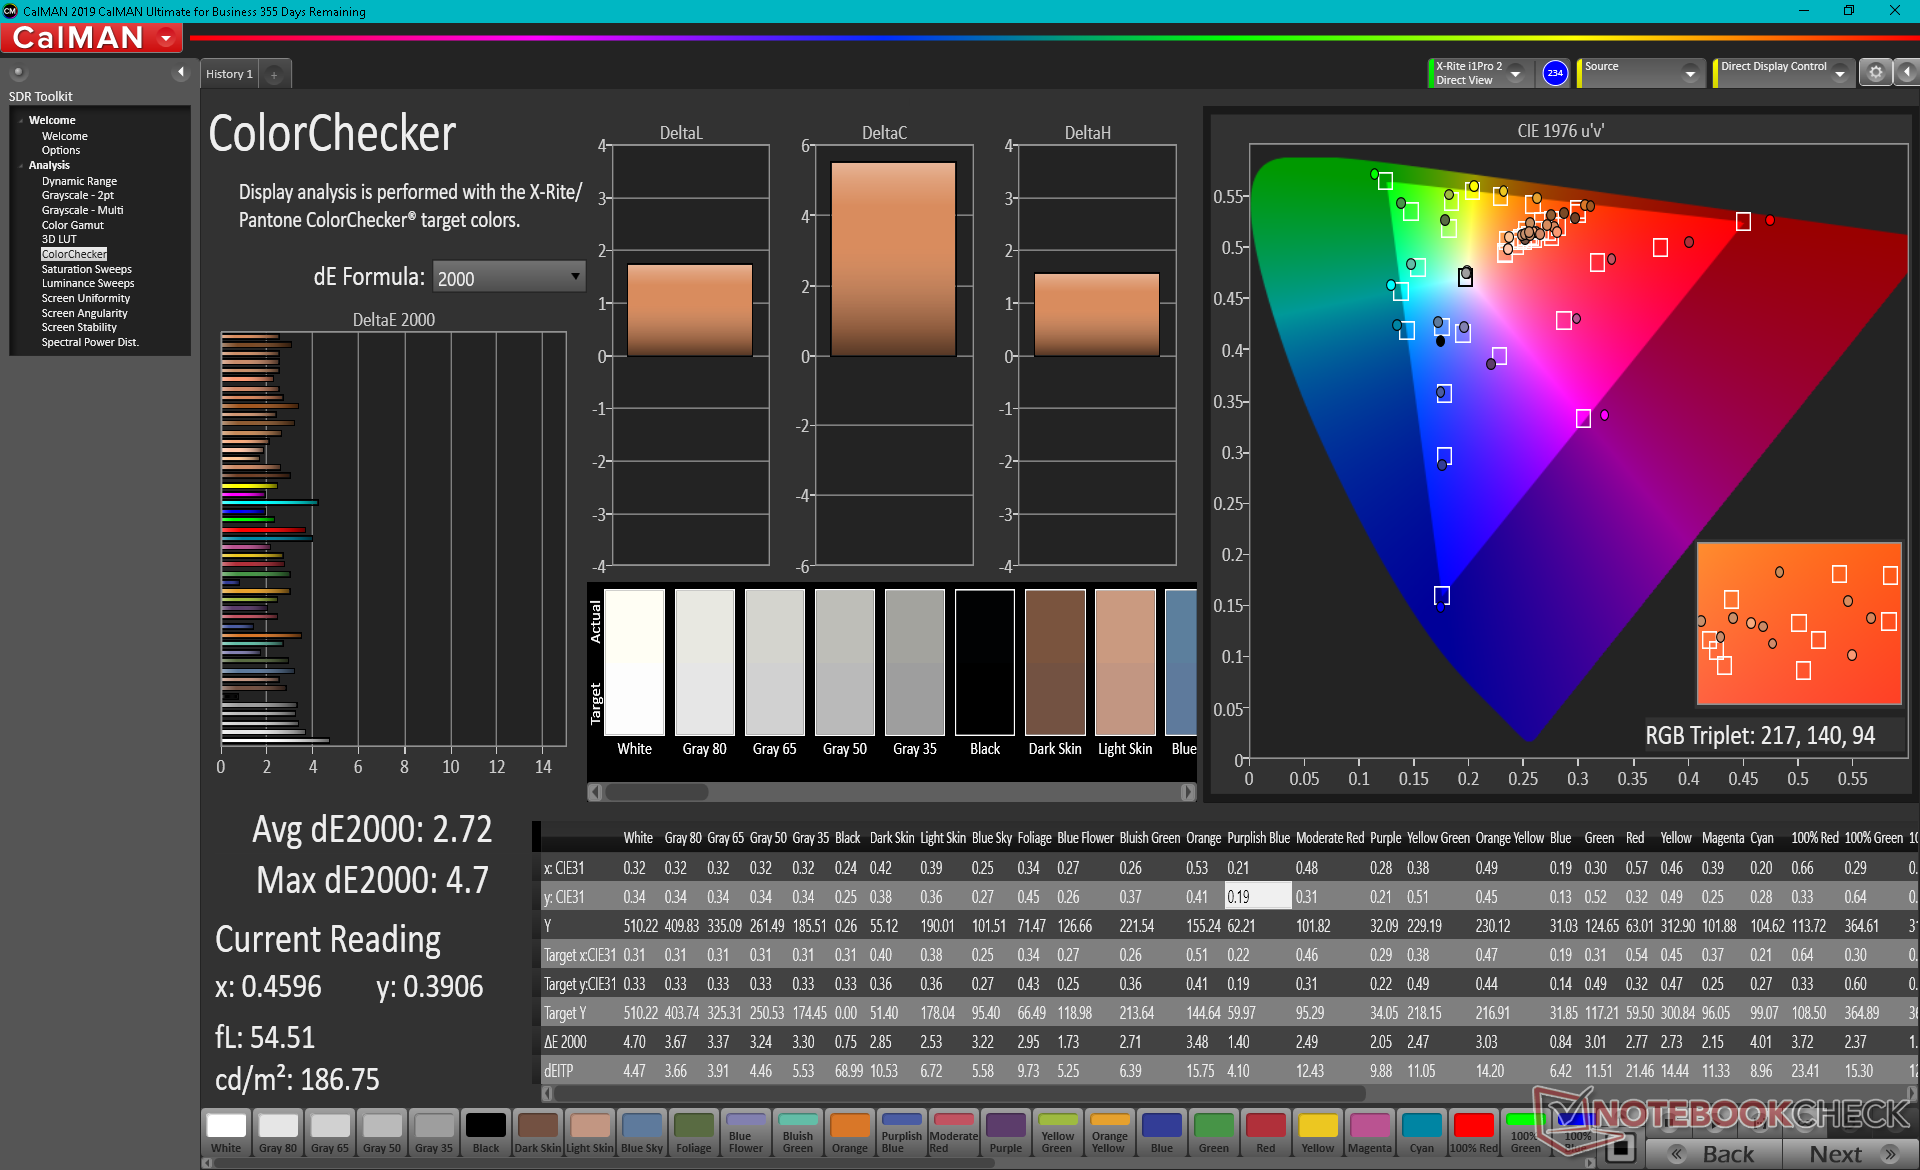
ΔE ColorChecker Calman: 2.72 | ∀{0.5-29.43 Ø4.71}
calibrated: 1.92
ΔE Greyscale Calman: 3.4 | ∀{0.09-98 Ø4.96}
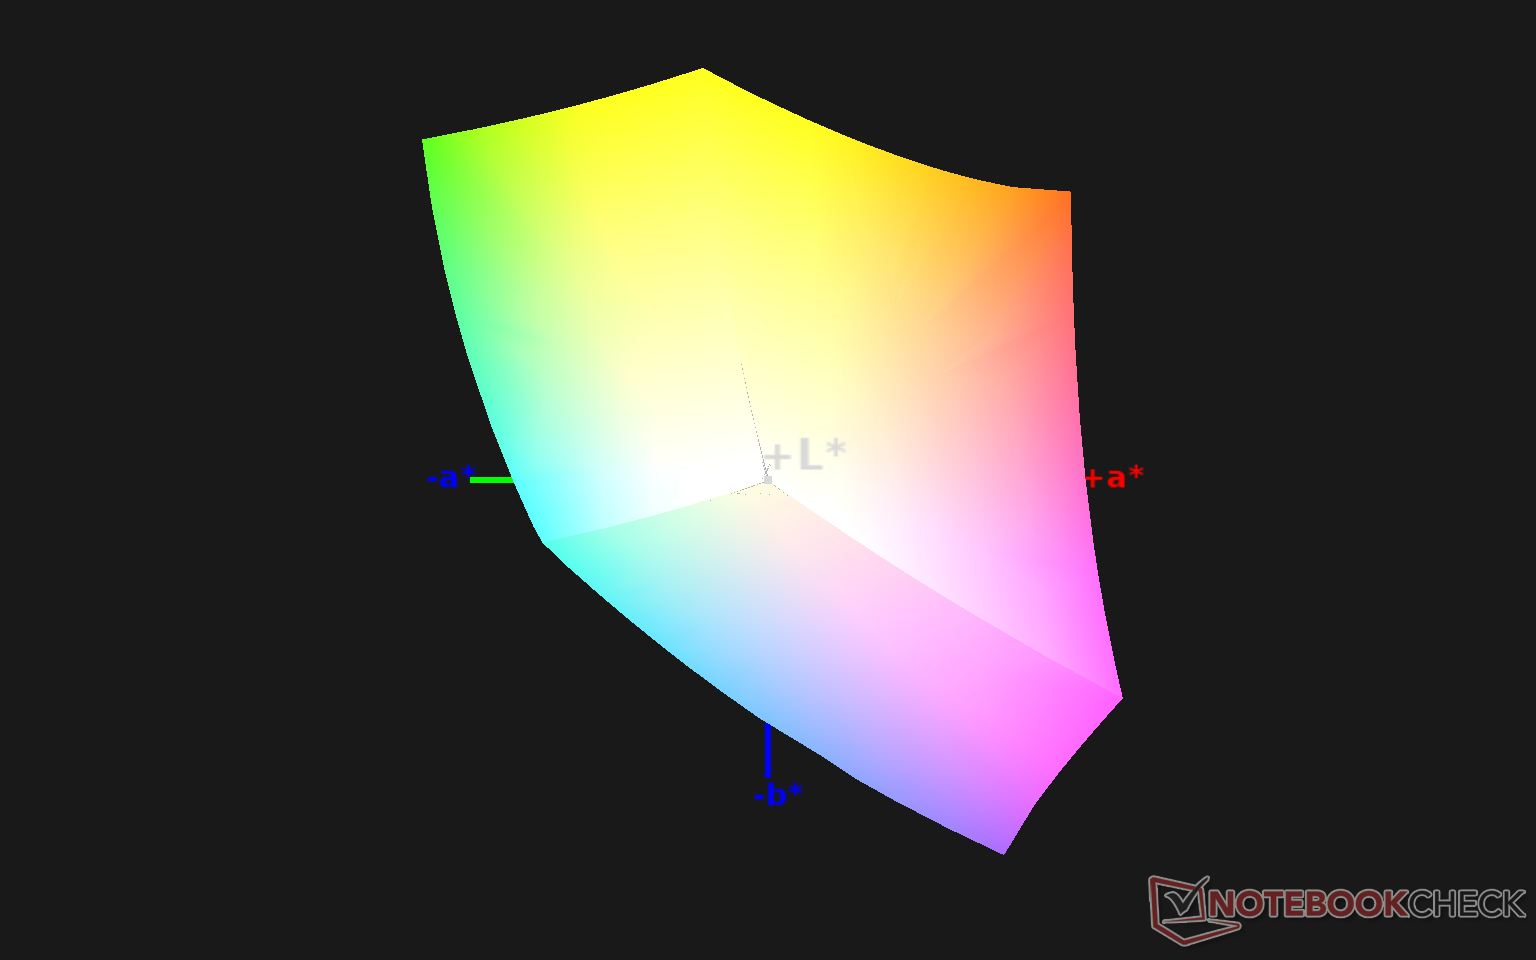
100% sRGB (Argyll 1.6.3 3D)
70.7% AdobeRGB 1998 (Argyll 1.6.3 3D)
78.9% AdobeRGB 1998 (Argyll 3D)
100% sRGB (Argyll 3D)
80.2% Display P3 (Argyll 3D)
Gamma: 2.11
CCT: 6245 K
| Dell XPS 13 9310 Core i7 4K Sharp LQ134R1, IPS, 13.4", 3840x2400 | Asus Zenbook S UX393JA AU Optronics B139KAN01.0, IPS, 13.9", 3300x2200 | Huawei MateBook X Pro 2020 i7 JDI LPM139M422A, LTPS, 13.9", 3000x2000 | Dell XPS 13 9300 Core i7-1065G7 Sharp LQ134N1, IPS, 13.4", 1920x1200 | Lenovo Yoga Slim 7-14ARE AU Optronics B140HAN06.8, IPS, 14", 1920x1080 | HP Spectre x360 13-aw0013dx AU Optronics AUO5E2D, IPS, 13.3", 1920x1080 | |
|---|---|---|---|---|---|---|
| Display | 11% | -10% | -11% | -7% | -8% | |
| Display P3 Coverage (%) | 80.2 | 97.7 22% | 66.6 -17% | 66.3 -17% | 71.7 -11% | 69.6 -13% |
| sRGB Coverage (%) | 100 | 99.8 0% | 99.4 -1% | 97.3 -3% | 99.3 -1% | 98.9 -1% |
| AdobeRGB 1998 Coverage (%) | 78.9 | 87.9 11% | 68.6 -13% | 68.5 -13% | 72.9 -8% | 71.5 -9% |
| Response Times | 5% | 20% | 17% | 25% | 3% | |
| Response Time Grey 50% / Grey 80% * (ms) | 59.2 ? | 56.4 ? 5% | 49.6 ? 16% | 50 ? 16% | 45.6 ? 23% | 60.8 ? -3% |
| Response Time Black / White * (ms) | 40.4 ? | 38.8 ? 4% | 30.8 ? 24% | 33.2 ? 18% | 29.6 ? 27% | 36.8 ? 9% |
| PWM Frequency (Hz) | 2137 ? | 29070 ? | 2500 ? | |||
| Screen | -15% | 18% | -11% | -17% | -23% | |
| Brightness middle (cd/m²) | 508.7 | 444.1 -13% | 557 9% | 607.6 19% | 399.6 -21% | 447.4 -12% |
| Brightness (cd/m²) | 479 | 423 -12% | 532 11% | 595 24% | 385 -20% | 420 -12% |
| Brightness Distribution (%) | 84 | 89 6% | 87 4% | 96 14% | 89 6% | 85 1% |
| Black Level * (cd/m²) | 0.3 | 0.37 -23% | 0.33 -10% | 0.4 -33% | 0.37 -23% | 0.31 -3% |
| Contrast (:1) | 1696 | 1200 -29% | 1688 0% | 1519 -10% | 1080 -36% | 1443 -15% |
| Colorchecker dE 2000 * | 2.72 | 2.94 -8% | 1.4 49% | 3.23 -19% | 3.2 -18% | 4.23 -56% |
| Colorchecker dE 2000 max. * | 4.7 | 7.37 -57% | 2.5 47% | 8.67 -84% | 6.44 -37% | 9.34 -99% |
| Colorchecker dE 2000 calibrated * | 1.92 | 3.05 -59% | 0.7 64% | 1.01 47% | 1.73 10% | 1.32 31% |
| Greyscale dE 2000 * | 3.4 | 2.9 15% | 2 41% | 5.5 -62% | 4.7 -38% | 6.1 -79% |
| Gamma | 2.11 104% | 2.1 105% | 2.14 103% | 2.12 104% | 2.21 100% | 2.11 104% |
| CCT | 6245 104% | 6766 96% | 6689 97% | 6413 101% | 7184 90% | 6136 106% |
| Color Space (Percent of AdobeRGB 1998) (%) | 70.7 | 78.2 11% | 62.5 -12% | 63 -11% | 66.3 -6% | 64.8 -8% |
| Color Space (Percent of sRGB) (%) | 100 | 99.8 0% | 99.5 0% | 97.5 -2% | 99.5 0% | 98.9 -1% |
| Média Total (Programa/Configurações) | 0% /
-8% | 9% /
13% | -2% /
-7% | 0% /
-10% | -9% /
-17% |
* ... menor é melhor
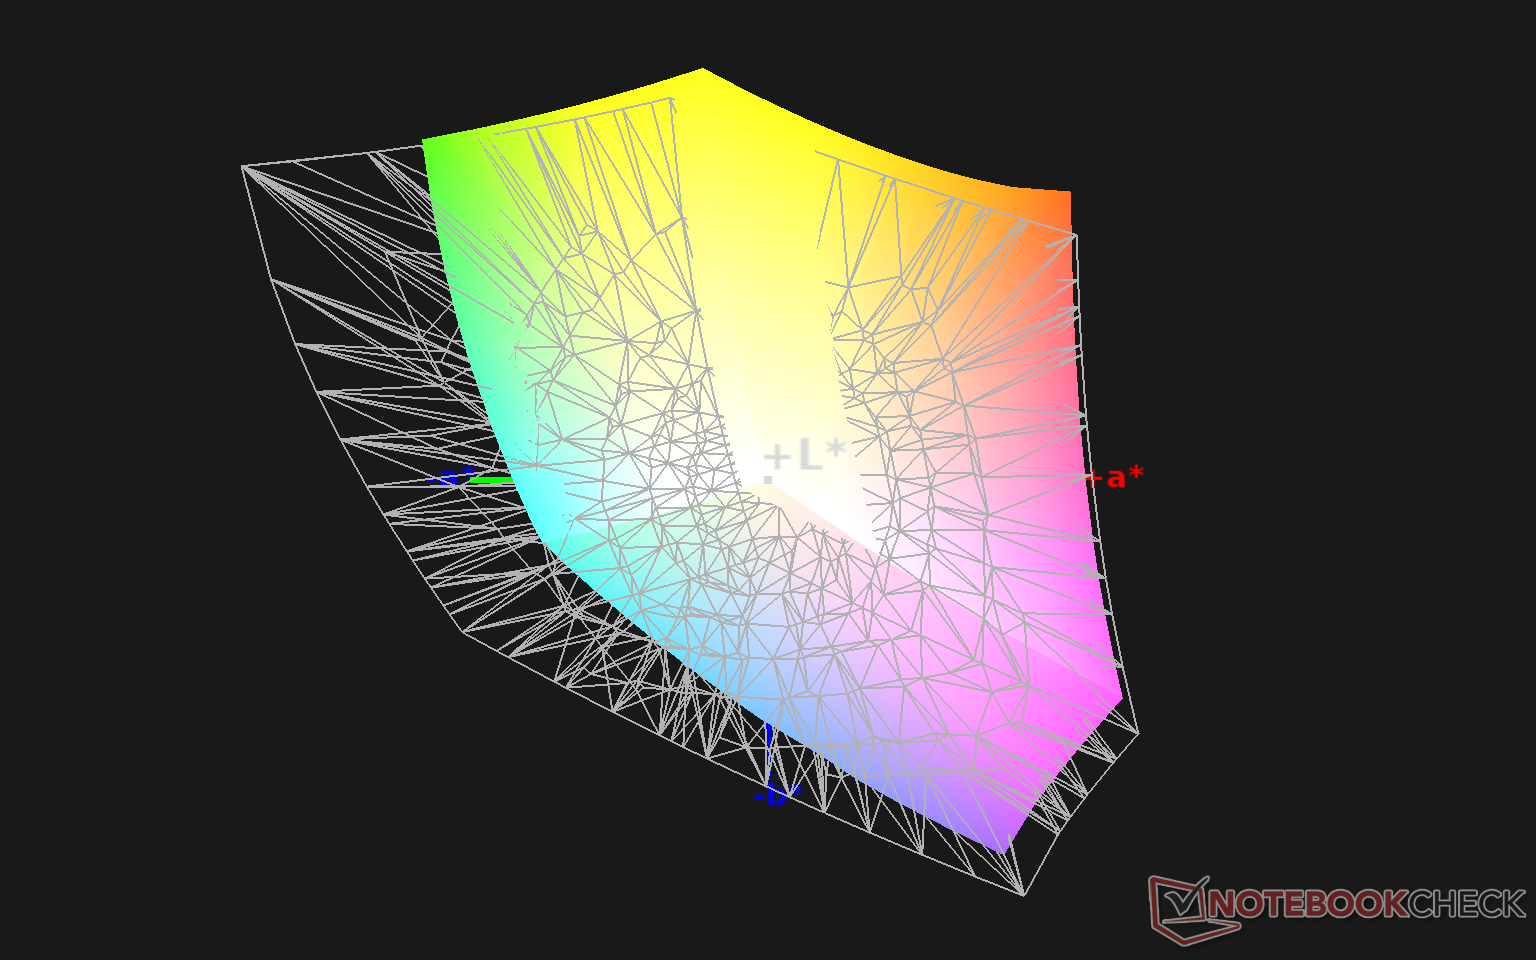
O espaço de cores cobre todo o sRGB e aproximadamente 70% do AdobeRGB. Não há opções AMOLED ou AdobeRGB/DCI-P3 completo, provavelmente porque tais painéis não estão amplamente disponíveis no tamanho de tela de 16:10 de 13,4 polegadas.
A temperatura da cor é um pouco quente demais fora da caixa, mas isto não é nada que nosso colorímetro X-Rite não pudesse fixar após uma calibração (6245 a 6442 CCT). Os valores médios de cor e escala de cinza do DeltaE também melhorariam apenas marginalmente após um pouco de ajuste, não diferente de nossa experiência com as configurações XPS 13 9310 FHD ou XPS 13 9300 4K.

Exibir tempos de resposta
| ↔ Tempo de resposta preto para branco | ||
|---|---|---|
| 40.4 ms ... ascensão ↗ e queda ↘ combinadas | ↗ 22.4 ms ascensão | 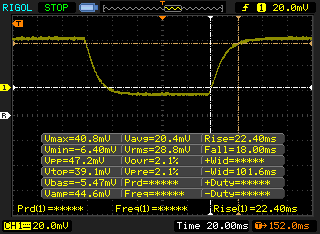 |
| ↘ 18 ms queda | ||
| A tela mostra taxas de resposta lentas em nossos testes e será insatisfatória para os jogadores. Em comparação, todos os dispositivos testados variam de 0.1 (mínimo) a 240 (máximo) ms. » 98 % de todos os dispositivos são melhores. Isso significa que o tempo de resposta medido é pior que a média de todos os dispositivos testados (19.8 ms). | ||
| ↔ Tempo de resposta 50% cinza a 80% cinza | ||
| 59.2 ms ... ascensão ↗ e queda ↘ combinadas | ↗ 30 ms ascensão | 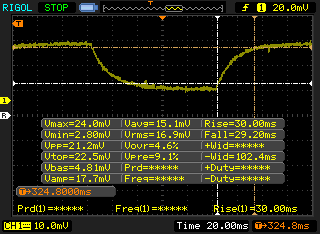 |
| ↘ 29.2 ms queda | ||
| A tela mostra taxas de resposta lentas em nossos testes e será insatisfatória para os jogadores. Em comparação, todos os dispositivos testados variam de 0.165 (mínimo) a 636 (máximo) ms. » 95 % de todos os dispositivos são melhores. Isso significa que o tempo de resposta medido é pior que a média de todos os dispositivos testados (31 ms). | ||
Cintilação da tela / PWM (modulação por largura de pulso)
| Tela tremeluzindo/PWM detectado | 2137 Hz | ≤ 31 % configuração de brilho | 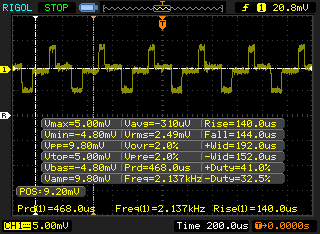 |
A luz de fundo da tela pisca em 2137 Hz (pior caso, por exemplo, utilizando PWM) Cintilação detectada em uma configuração de brilho de 31 % e abaixo. Não deve haver cintilação ou PWM acima desta configuração de brilho. A frequência de 2137 Hz é bastante alta, então a maioria dos usuários sensíveis ao PWM não deve notar nenhuma oscilação. [pwm_comparison] Em comparação: 52 % de todos os dispositivos testados não usam PWM para escurecer a tela. Se PWM foi detectado, uma média de 7757 (mínimo: 5 - máximo: 343500) Hz foi medida. | |||
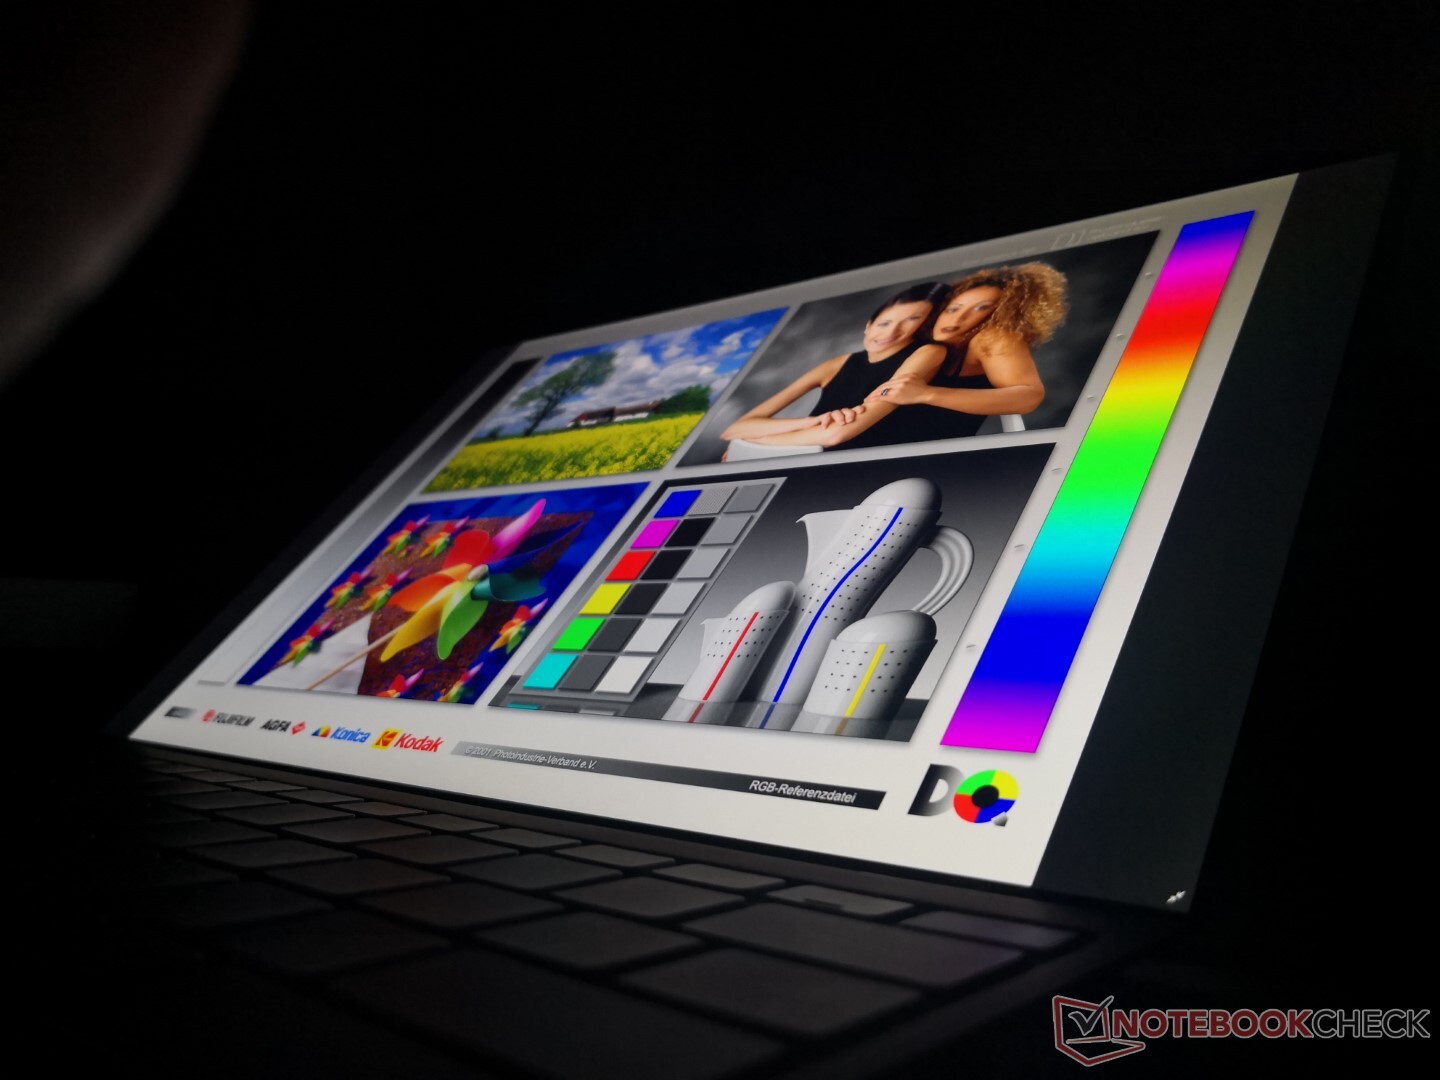
A visibilidade ao ar livre não é grande se em um dia brilhante devido ao painel brilhante. Ao contrário de alguns modelos XPS 13 mais antigos, a Dell não oferece nenhuma opção mate para sua série XPS 13 9310. Entretanto, a tela geralmente é brilhante o suficiente para uma visualização confortável se trabalhar sob a sombra.

Desempenho
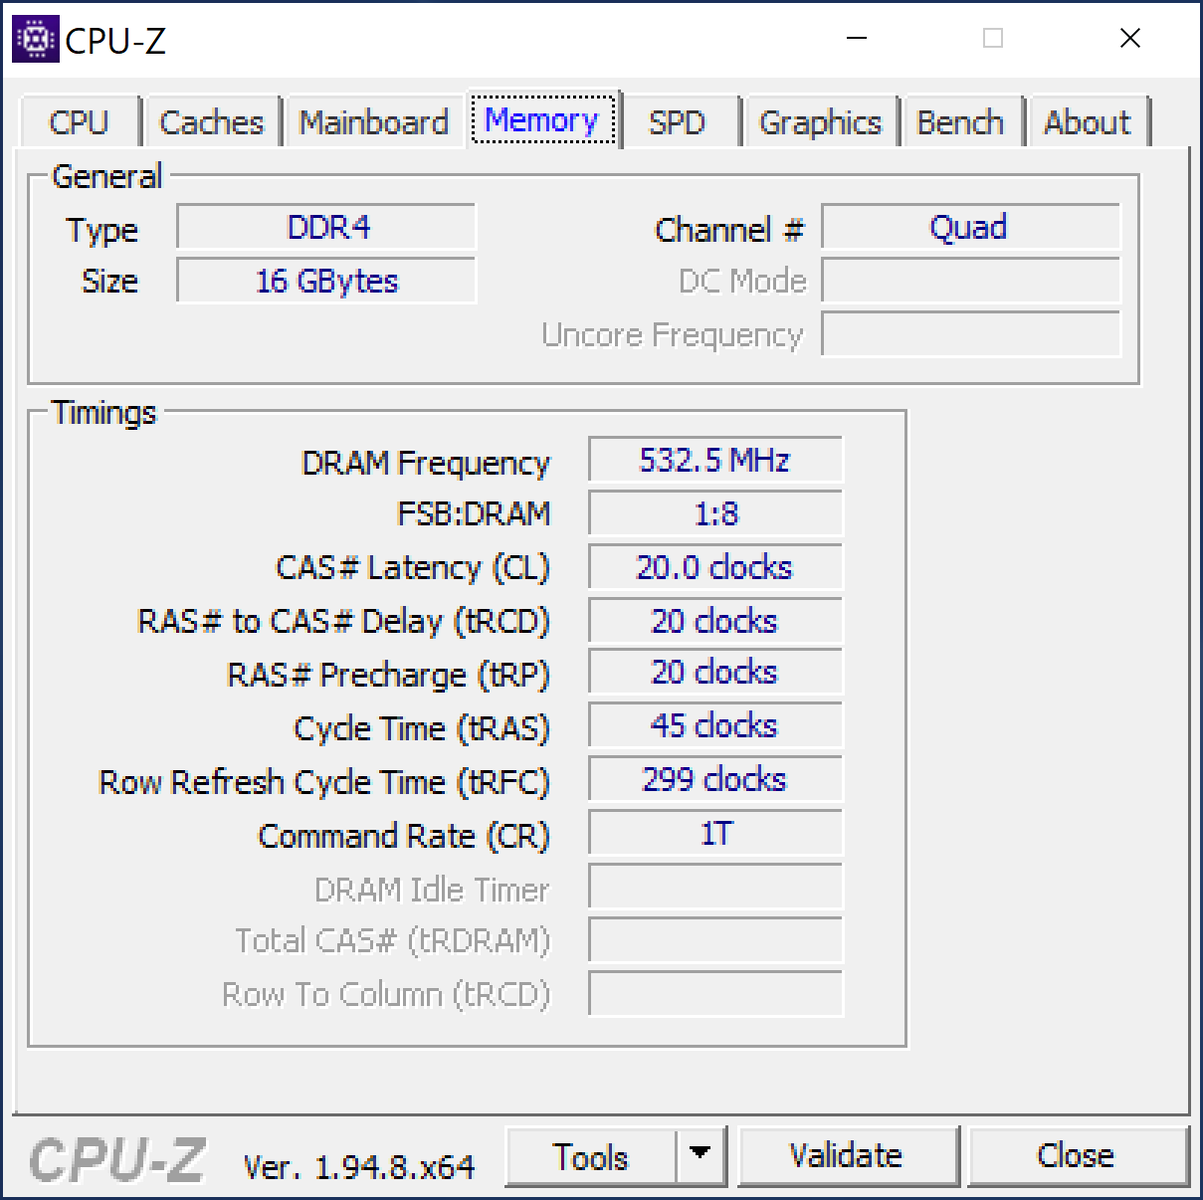
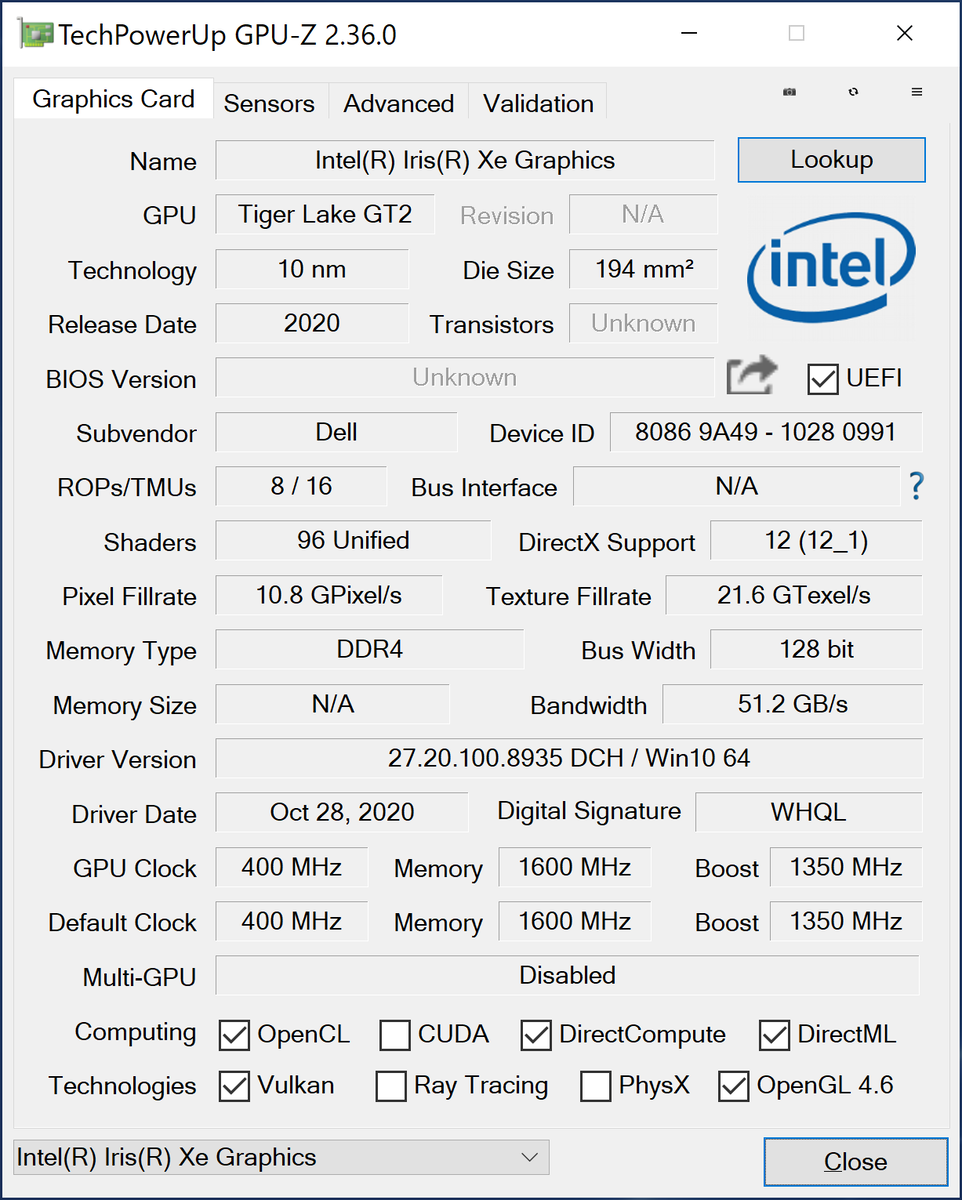
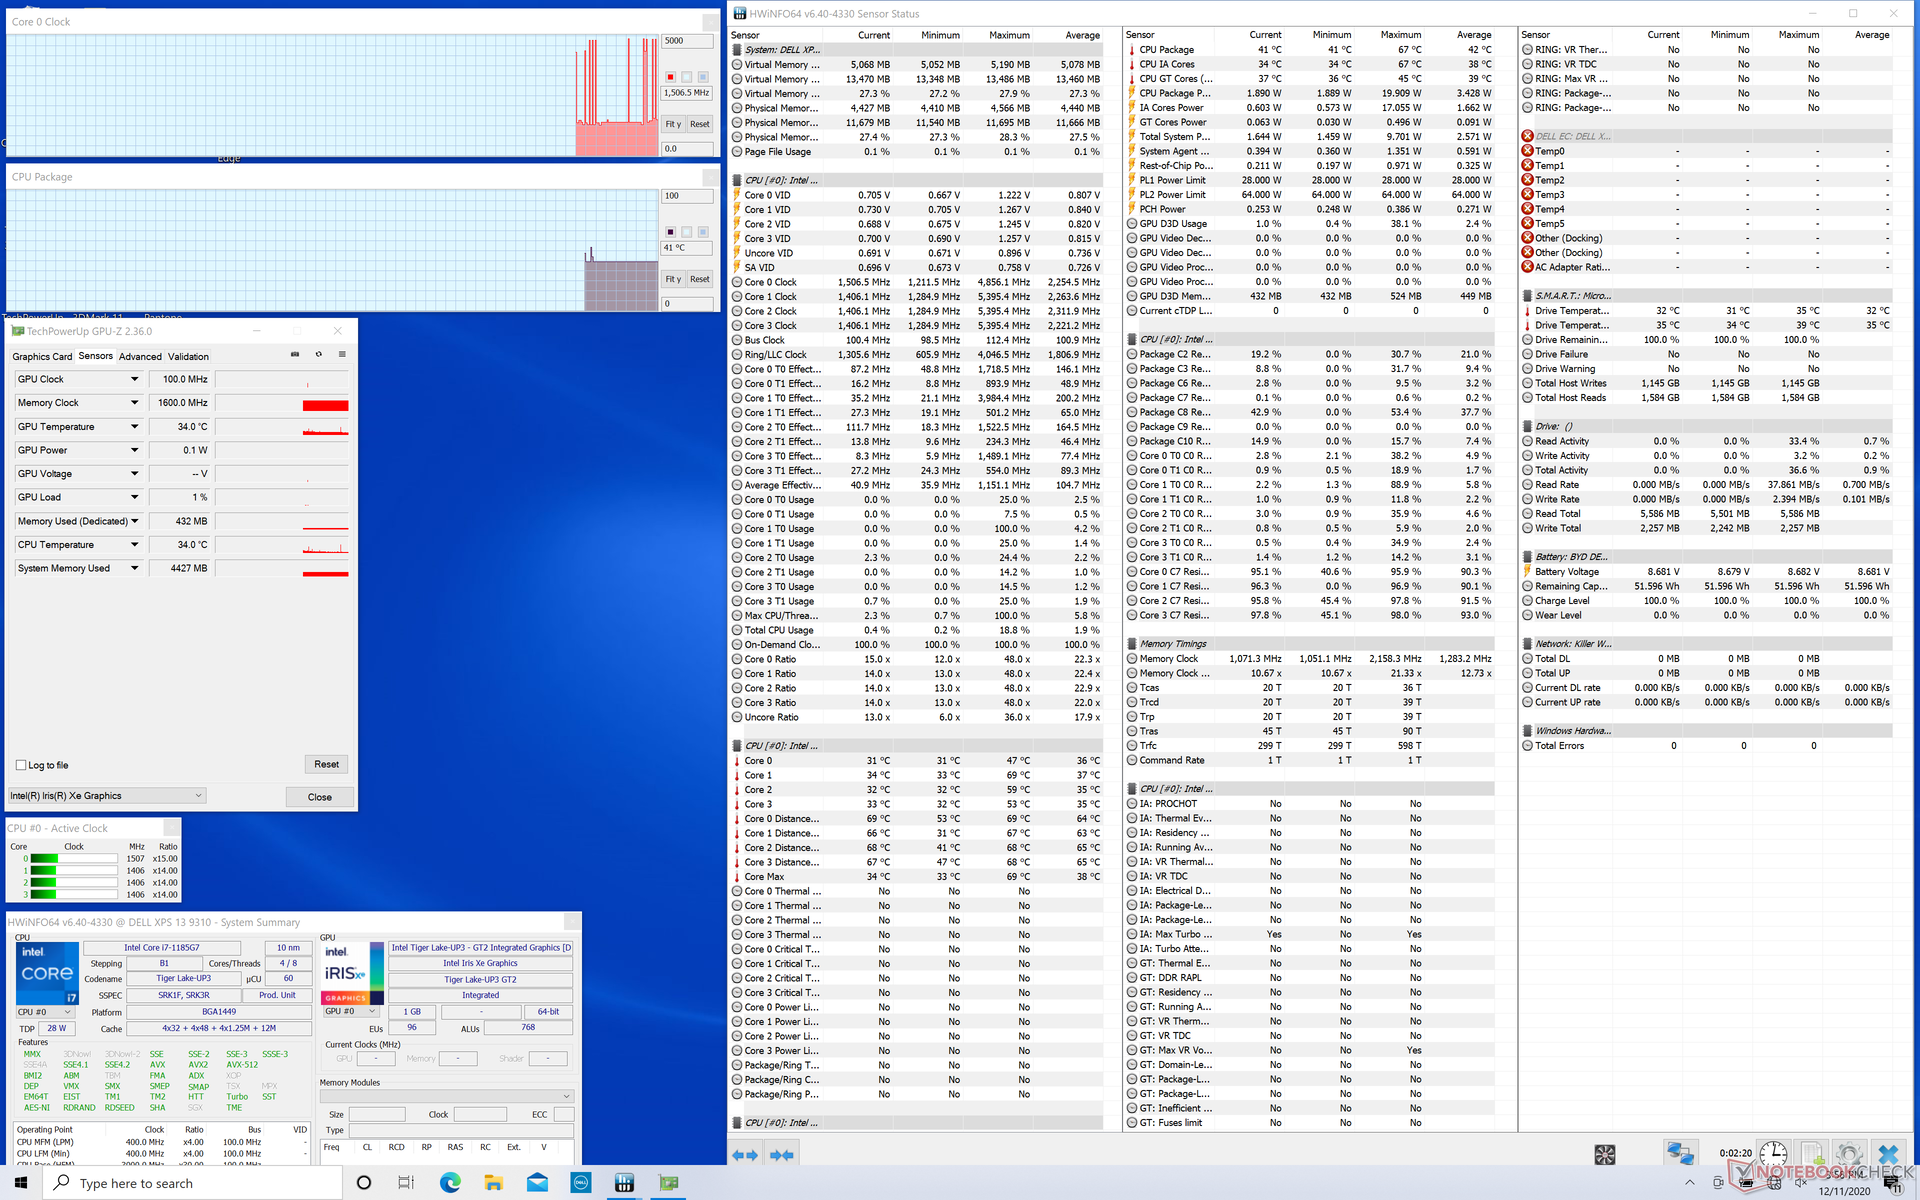
No papel, o Core i7-1185G7 tem taxas de relógio base ligeiramente mais rápidas e taxas de relógio Turbo Boost do que o Core i7-1165G7 (3,0 a 4,8 GHz vs. 2,8 a 4,7 GHz). Na prática, porém, vamos mostrar que estas especificações impressas não significam muito quando ambos os processadores estão à mercê da mesma solução de resfriamento de chassi. Não há outras grandes diferenças entre os dois processadores, pois seus tamanhos de cache, a faixa TDP e a contagem do núcleo são idênticos. GPU-Z relata algumas pequenas diferenças de taxa de preenchimento entre a GPU Iris Xe integrada, mas nada significativo.
Ajustamos nossa unidade para o modo Ultra Performance através do software Dell Power Manager antes de executar qualquer teste de performance abaixo para os melhores números possíveis. Os proprietários devem se familiarizar com este software uma vez que muitas opções específicas de XPS são encontradas aqui.

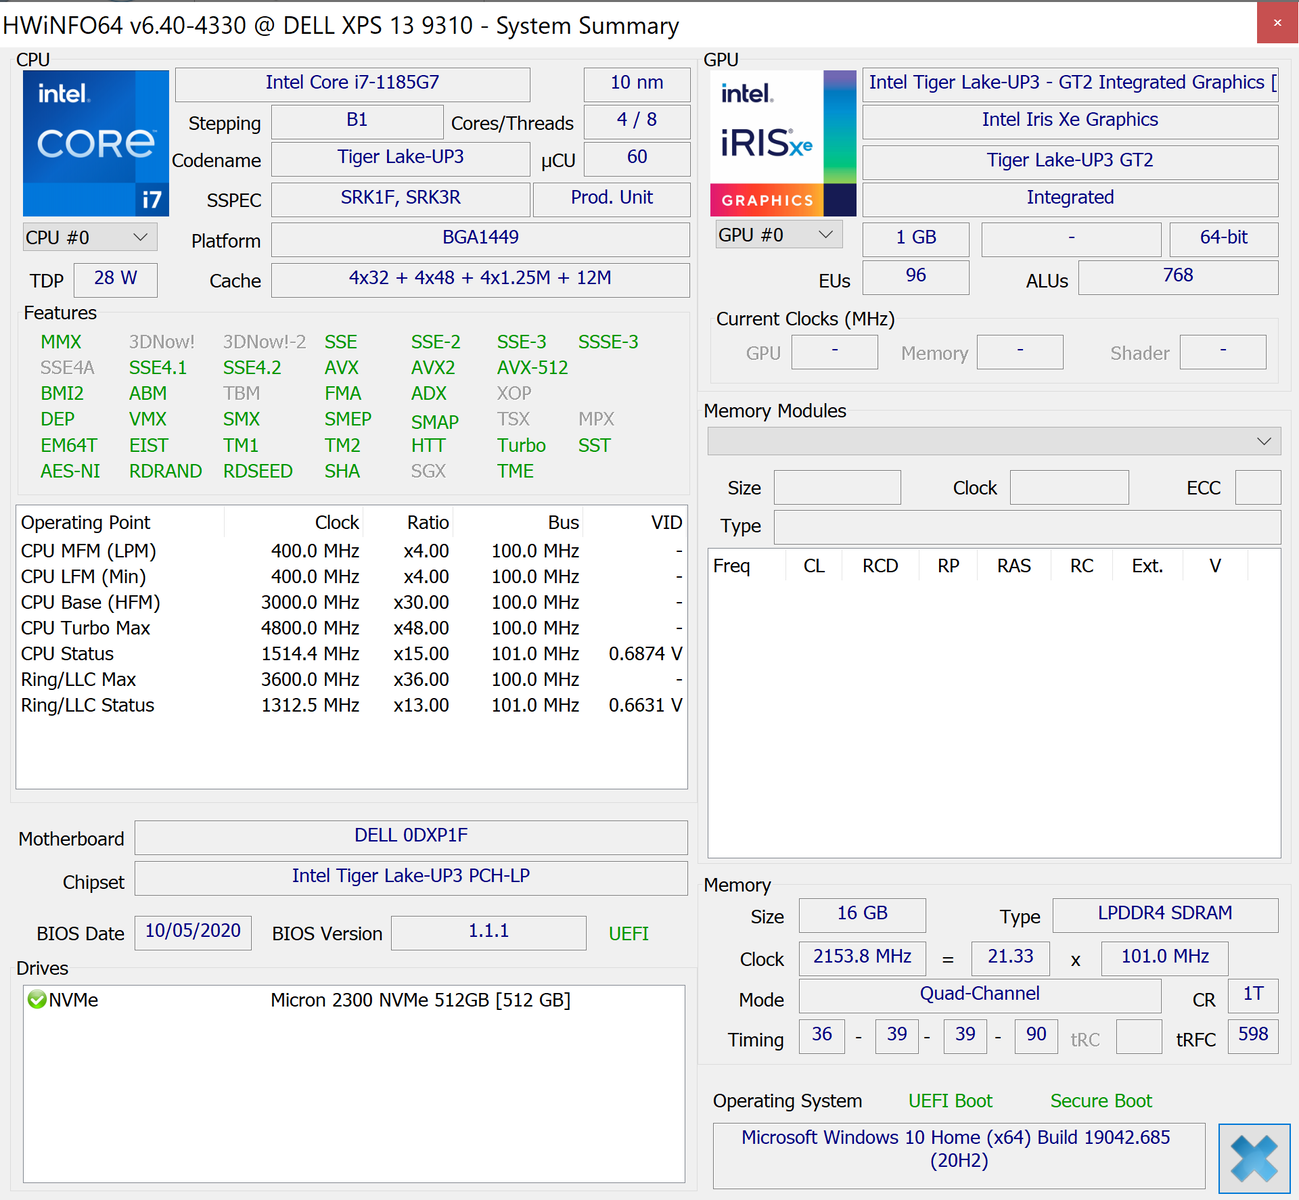
Processador
Muito parecido com o que observamos entre o XPS 15 Core i7-8750H e XPS 15 Core i9-8950HK, as diferenças de desempenho entre nossas configurações do XPS 13 Core i7-1185G7 e Core i7-1165G7 são, na melhor das hipóteses, mínimas. Os resultados de referência são quase idênticos entre eles ao ponto em que o Core i7-1165G7 pode, às vezes, até mesmo ficar à frente do Core i7-1185G7 como na codificação HWBOT x265. Ao executar o CineBench R15 xT em um loop, ocorrem as mesmas flutuações da taxa de clock para pontuações instáveis devido à implementação da Política de Energia Dinâmica da Dell.
É uma pena que o XPS 13 não ofereça opções AMD Ryzen, pois o Ryzen 5 4500U ou Ryzen 7 4700U tem um desempenho multi-tarefa ainda mais rápido do que estas CPUs Intel Tiger Lake, embora ao custo de um desempenho mais lento de uma única linha.
Cinebench R15: CPU Multi 64Bit | CPU Single 64Bit
Blender: v2.79 BMW27 CPU
7-Zip 18.03: 7z b 4 -mmt1 | 7z b 4
Geekbench 5.5: Single-Core | Multi-Core
HWBOT x265 Benchmark v2.2: 4k Preset
LibreOffice : 20 Documents To PDF
R Benchmark 2.5: Overall mean
| LibreOffice / 20 Documents To PDF | |
| Dell XPS 13 9300 4K UHD | |
| Lenovo Yoga Slim 7 14ARE05 82A20008GE | |
| HP Envy x360 13-ay0010nr | |
| Lenovo Yoga Slim 7-14ARE | |
| Huawei MateBook X Pro 2020 i7 | |
| Média Intel Core i7-1185G7 (41.3 - 61.7, n=26) | |
| Razer Book 13 FHD | |
| Asus Zenbook S UX393JA | |
| Dell XPS 13 9310 Core i7 4K | |
| Dell XPS 13 9310 Core i7 FHD | |
Cinebench R15: CPU Multi 64Bit | CPU Single 64Bit
Blender: v2.79 BMW27 CPU
7-Zip 18.03: 7z b 4 -mmt1 | 7z b 4
Geekbench 5.5: Single-Core | Multi-Core
HWBOT x265 Benchmark v2.2: 4k Preset
LibreOffice : 20 Documents To PDF
R Benchmark 2.5: Overall mean
* ... menor é melhor
Desempenho do sistema
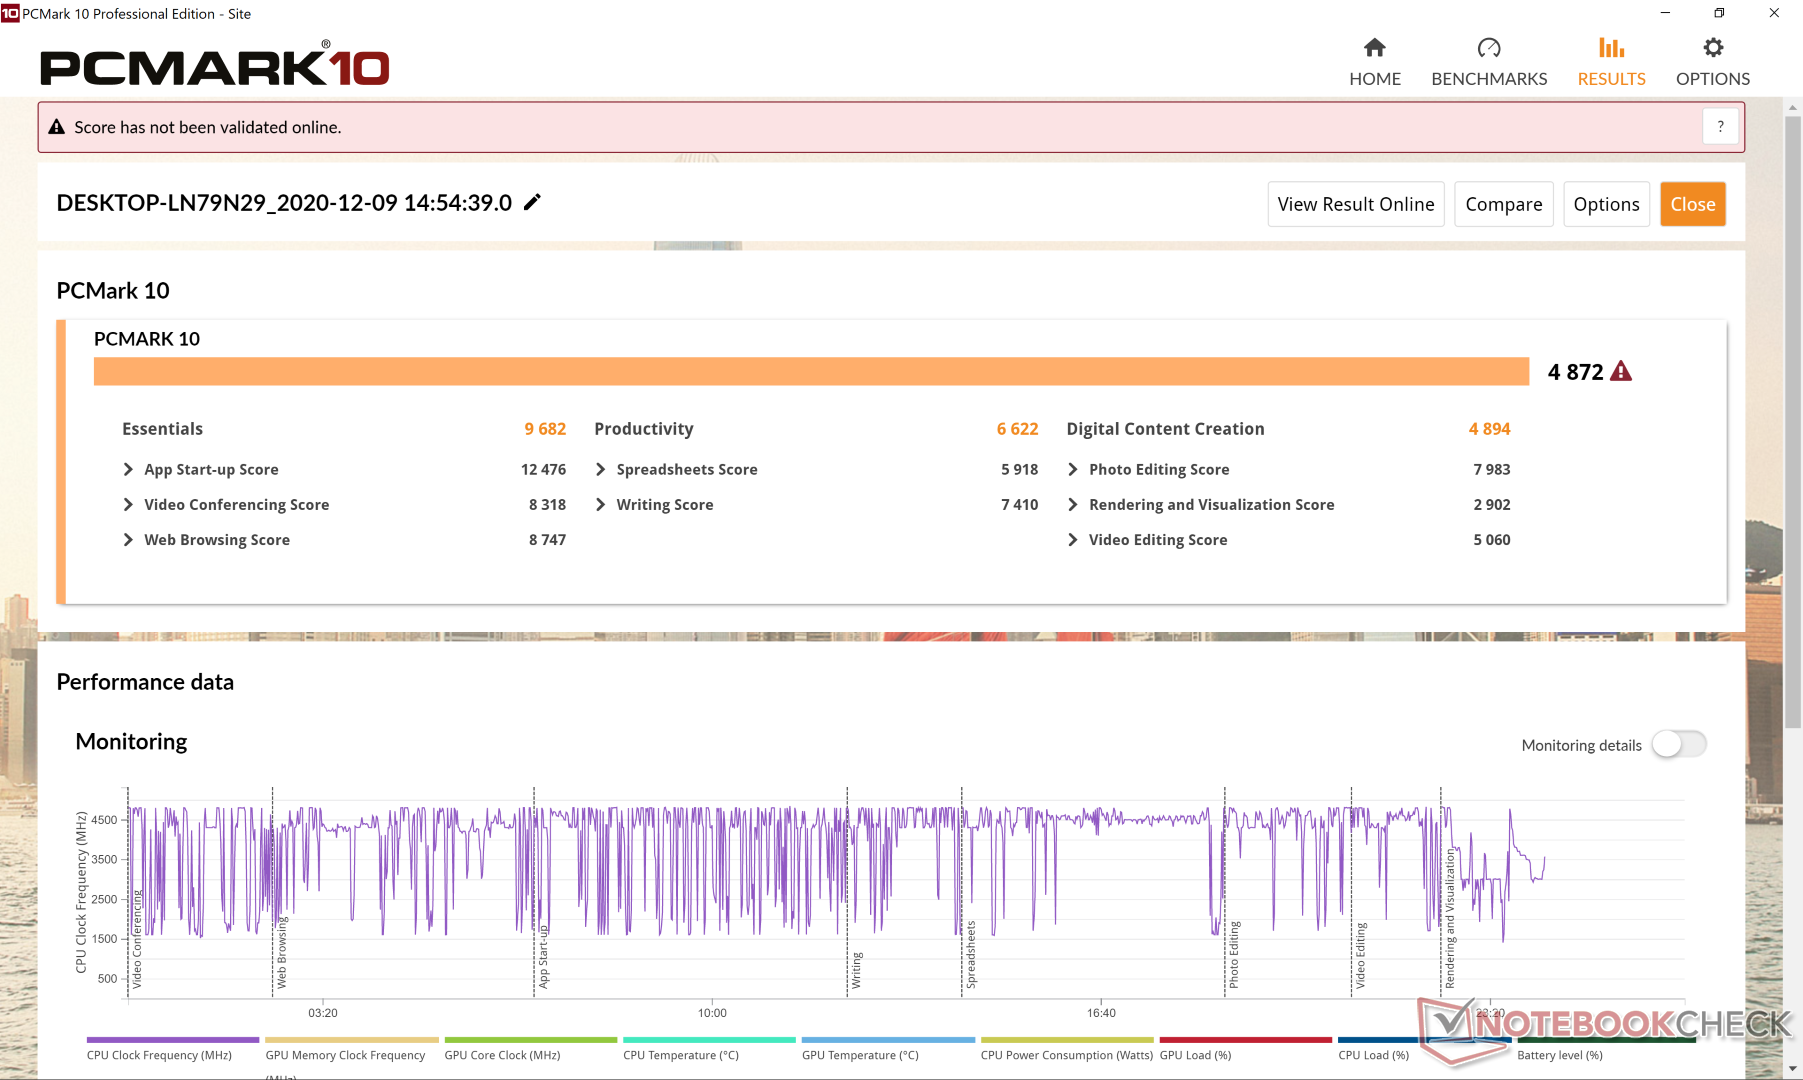
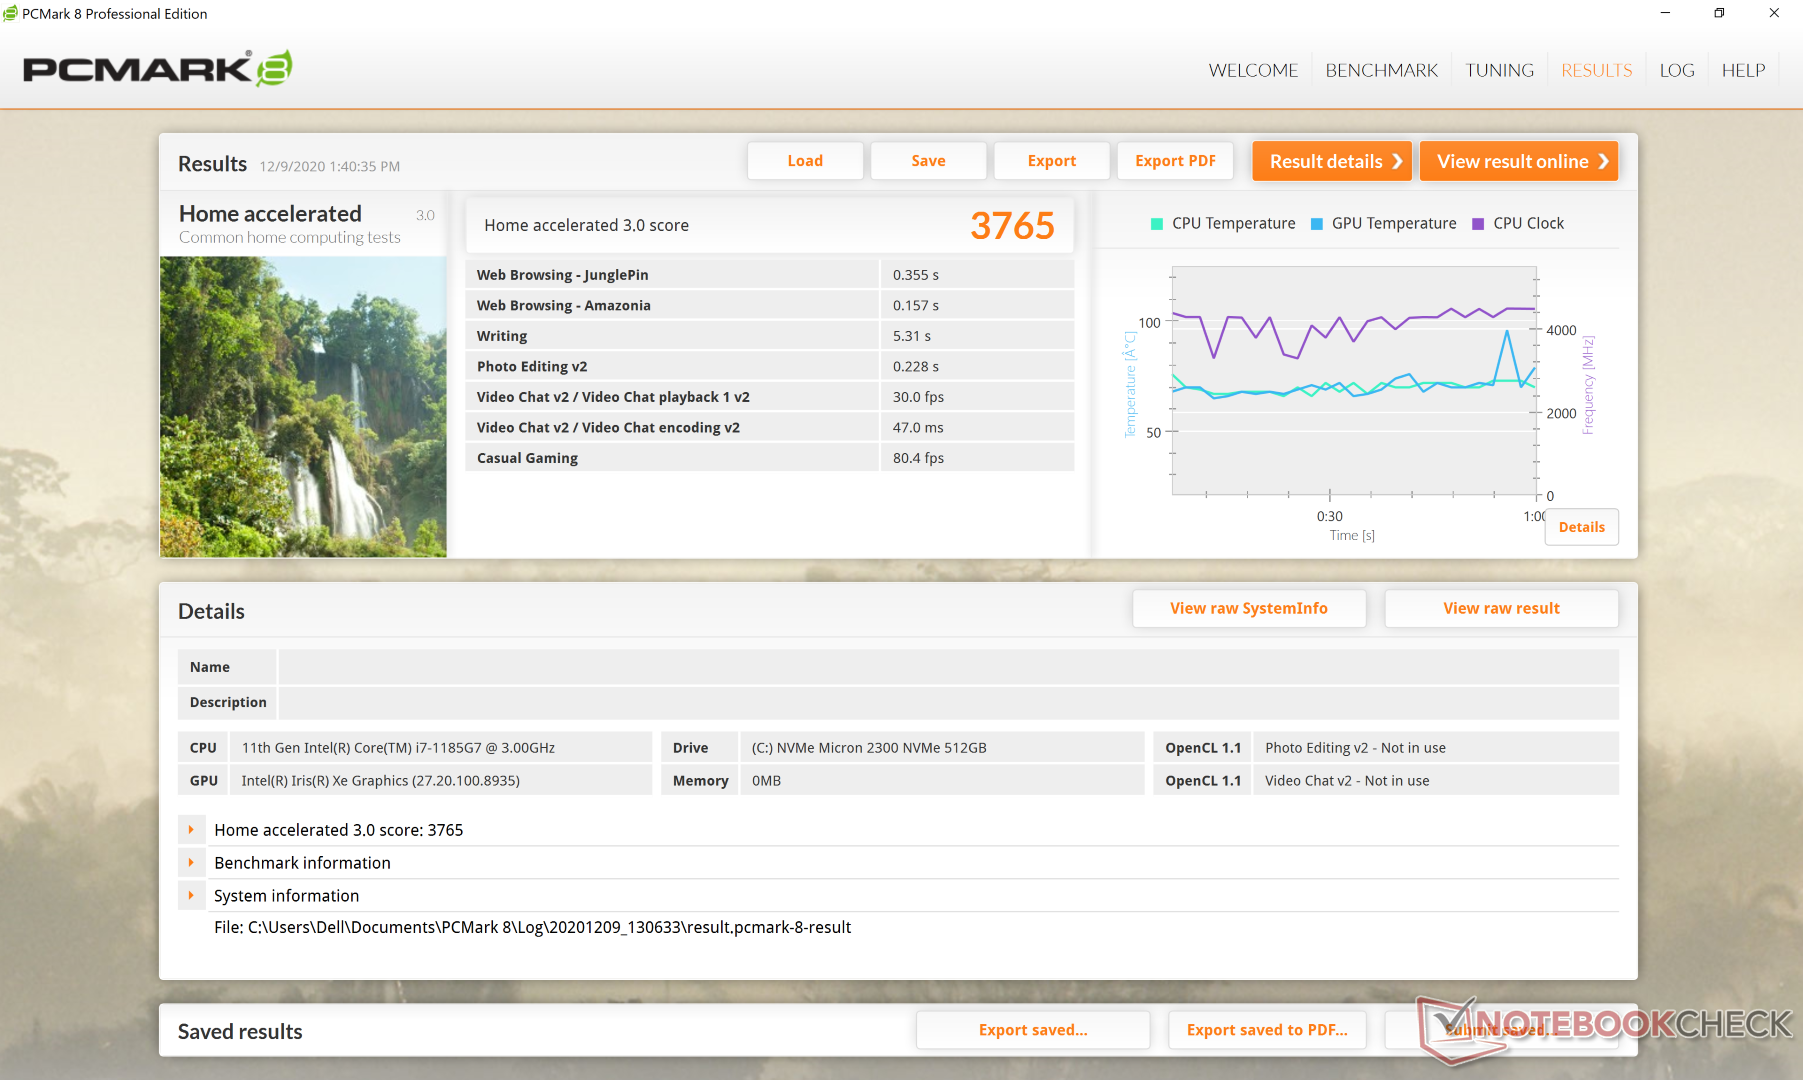
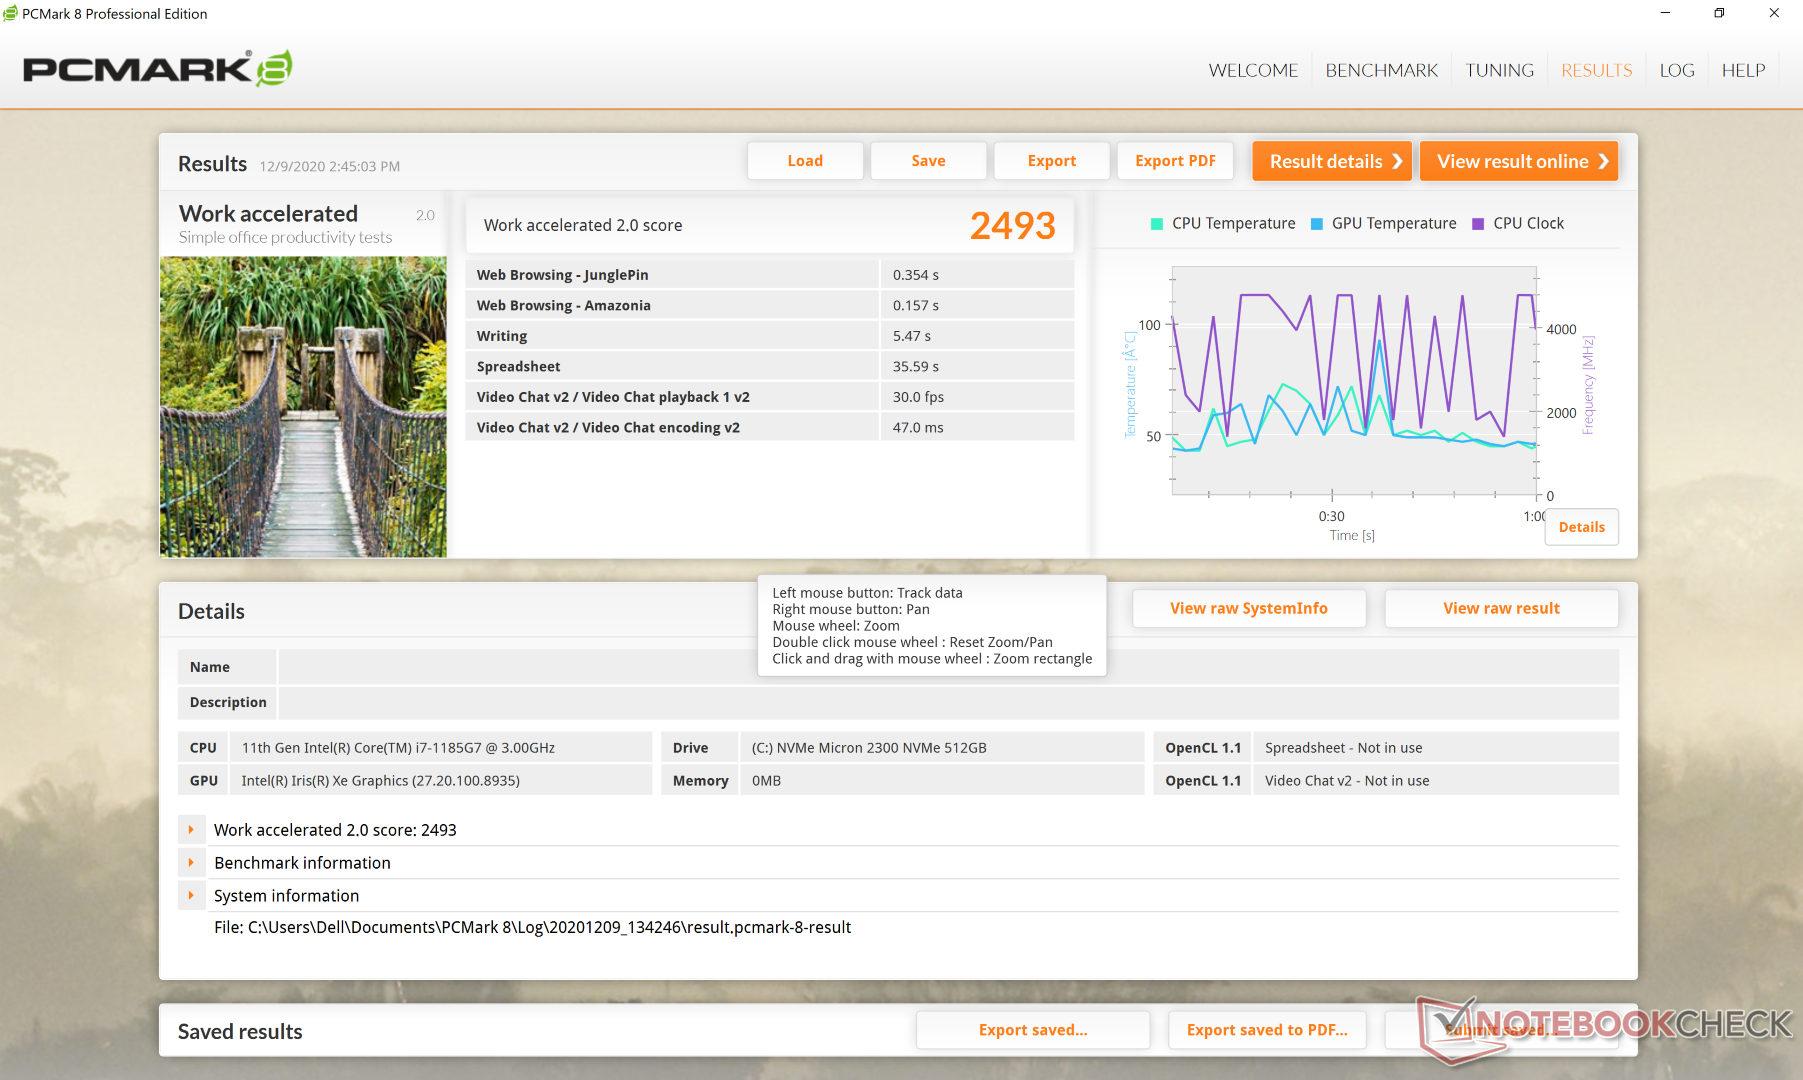
| PCMark 8 Home Score Accelerated v2 | 3765 pontos | |
| PCMark 8 Work Score Accelerated v2 | 2493 pontos | |
| PCMark 10 Score | 4872 pontos | |
Ajuda | ||
Latência do DPC
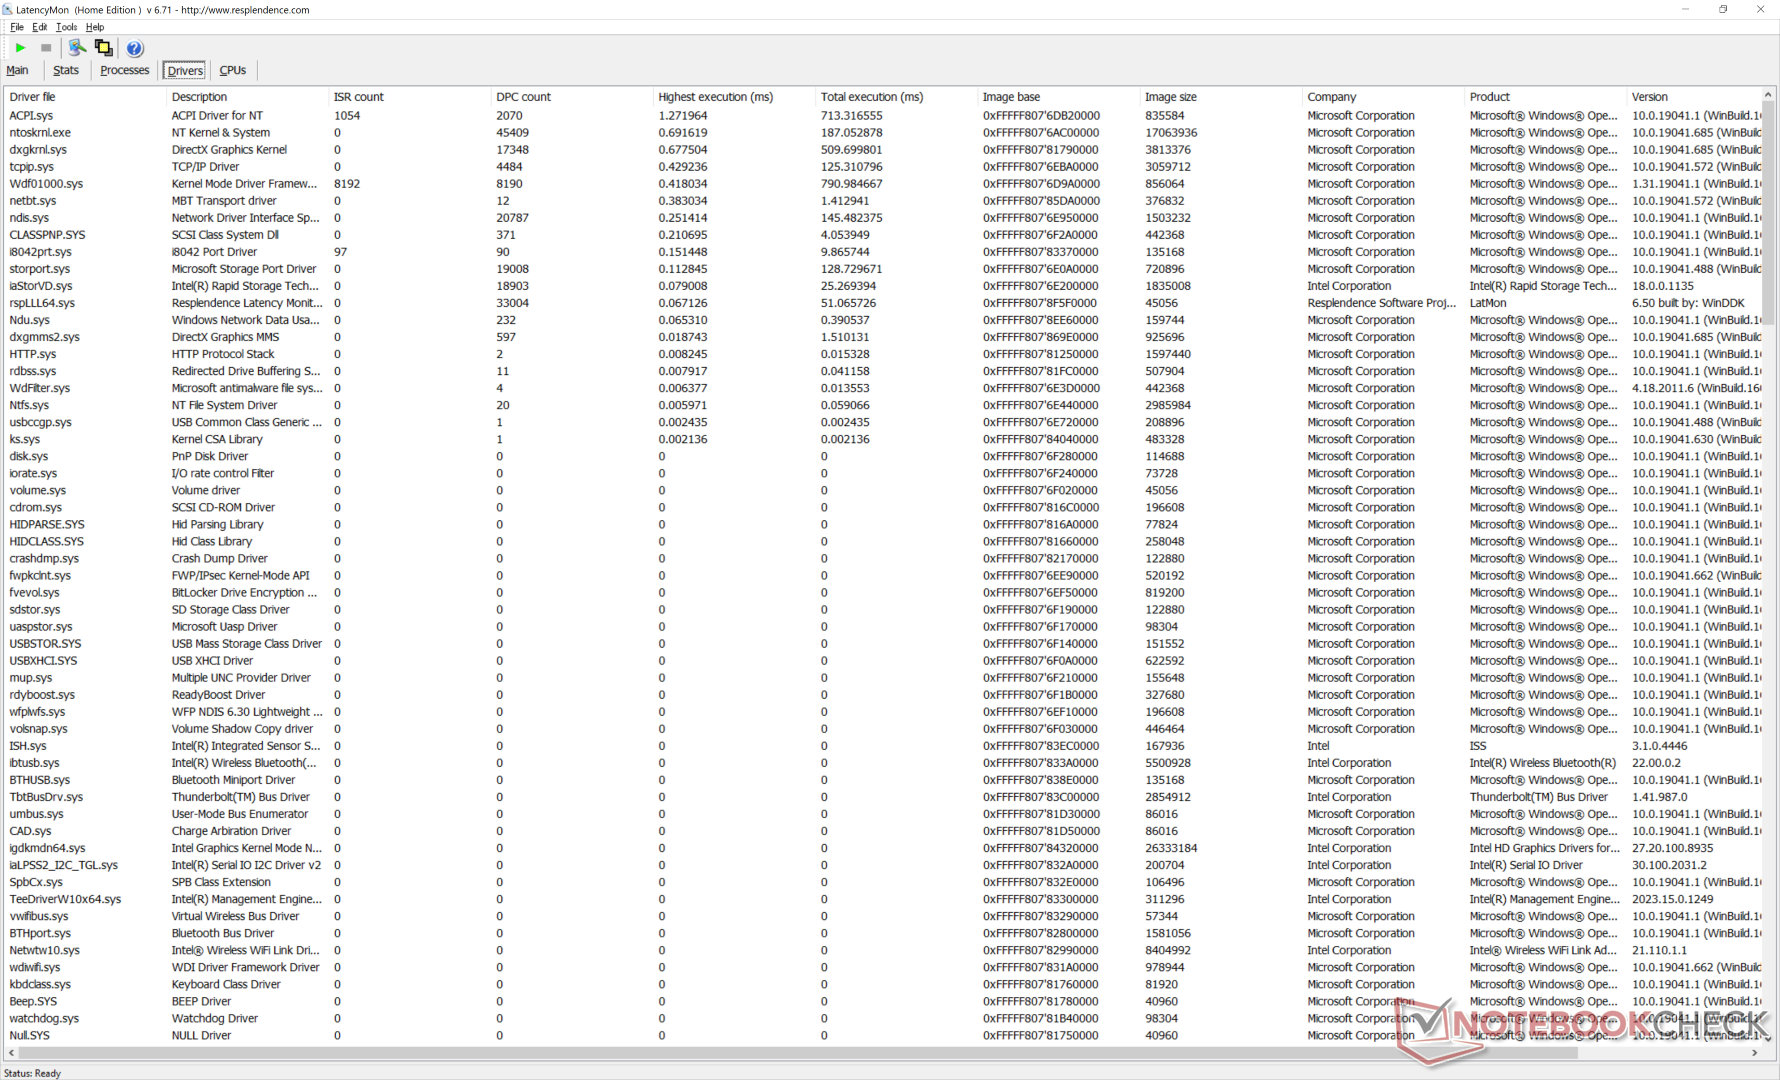
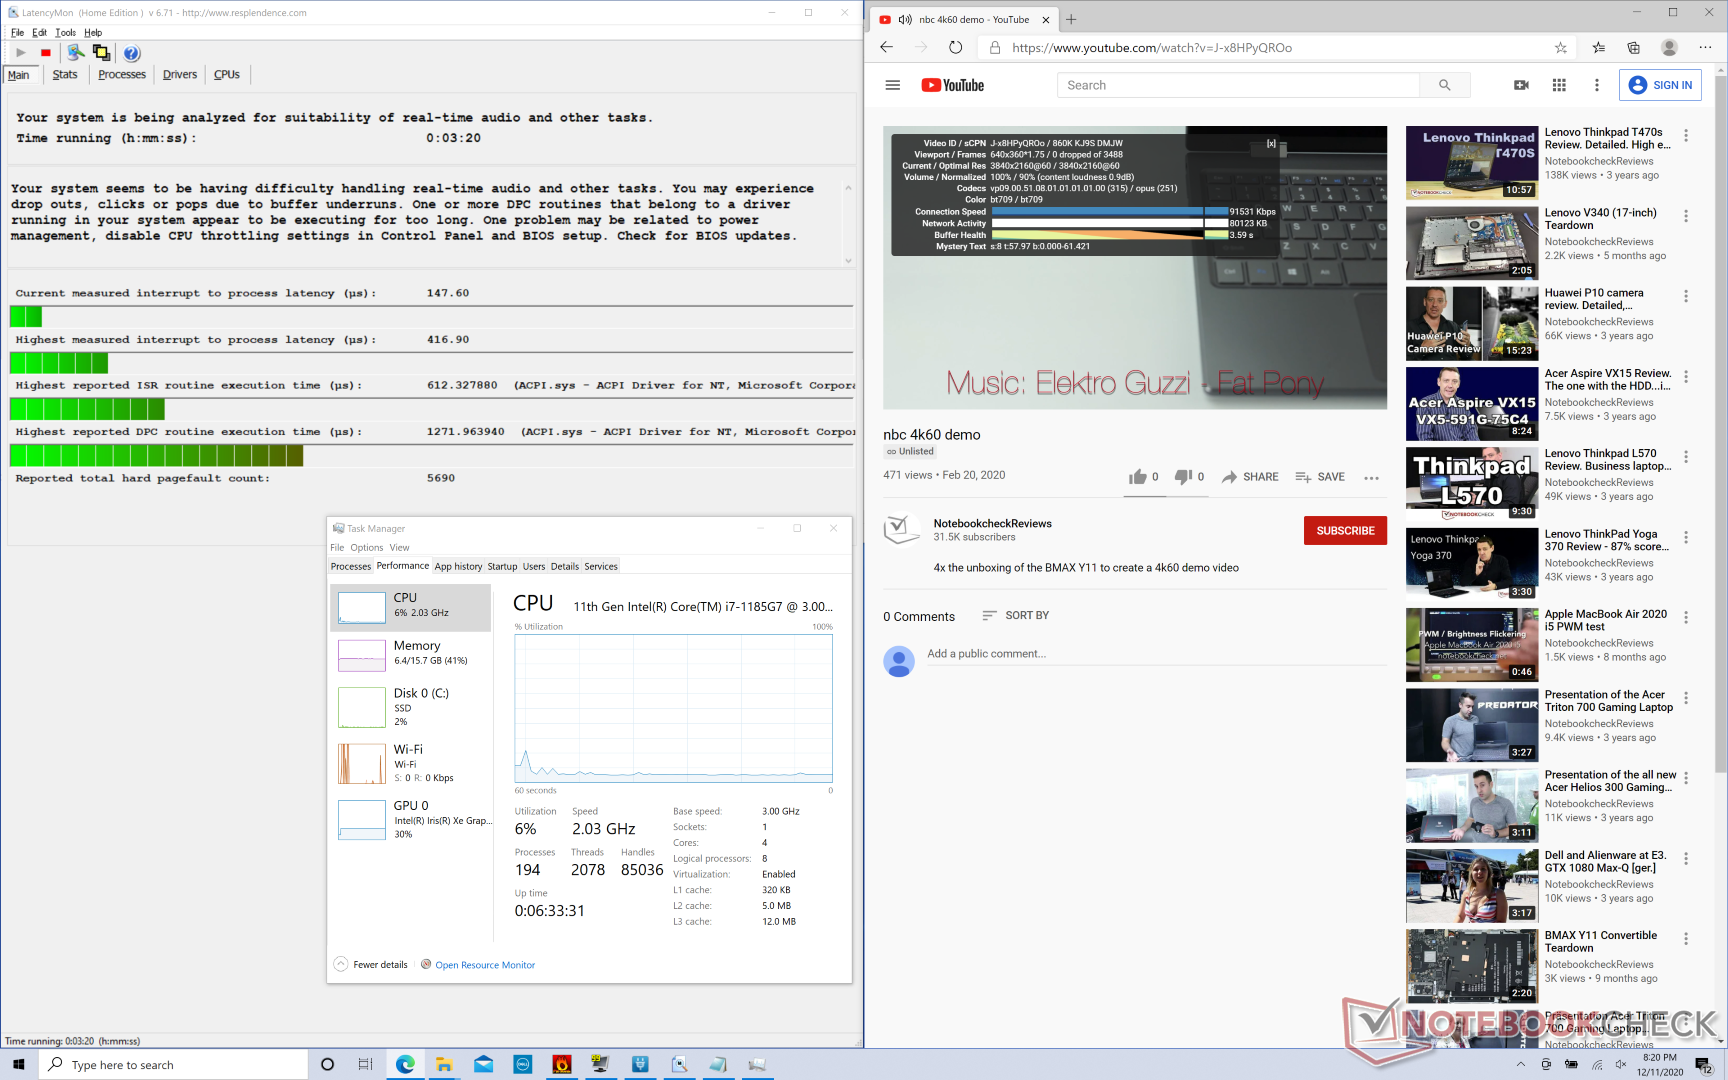
| DPC Latencies / LatencyMon - interrupt to process latency (max), Web, Youtube, Prime95 | |
| Dell XPS 13 9300 Core i7-1065G7 | |
| Asus Zenbook S UX393JA | |
| Lenovo Yoga Slim 7-14ARE | |
| Dell XPS 13 9310 Core i7 4K | |
| Dell XPS 13 9310 Core i7 FHD | |
* ... menor é melhor
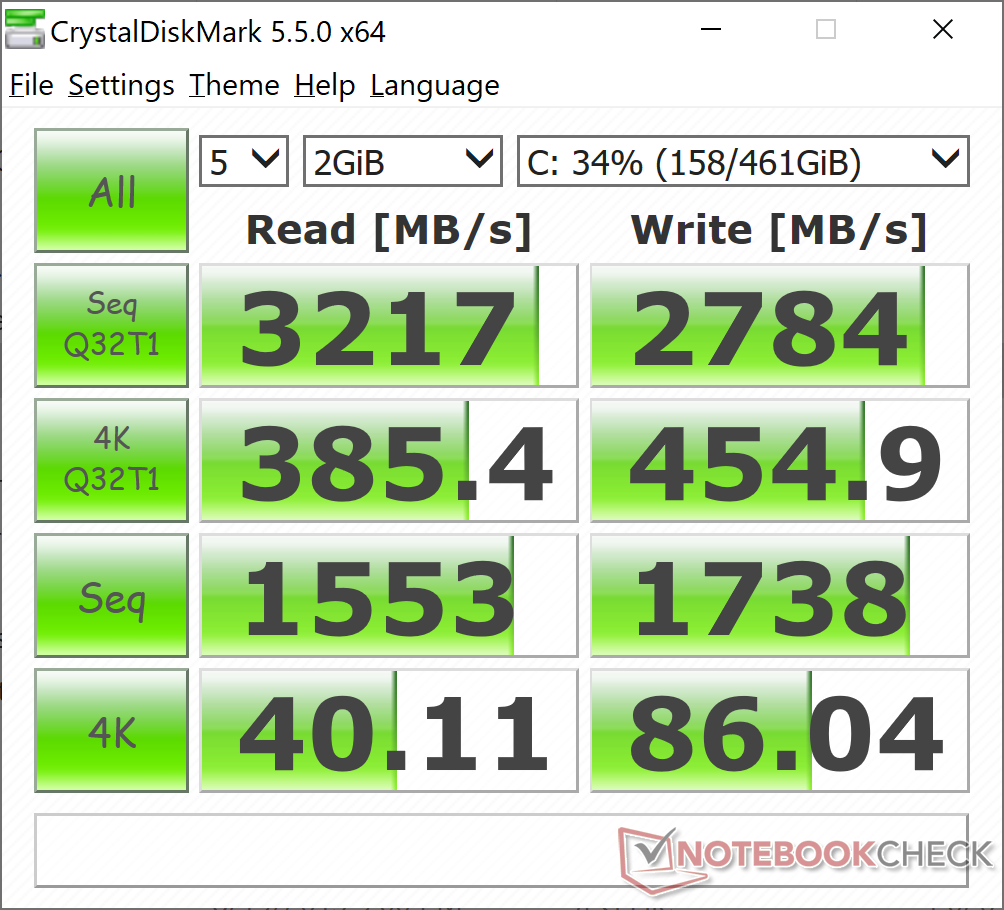
Dispositivos de armazenamento
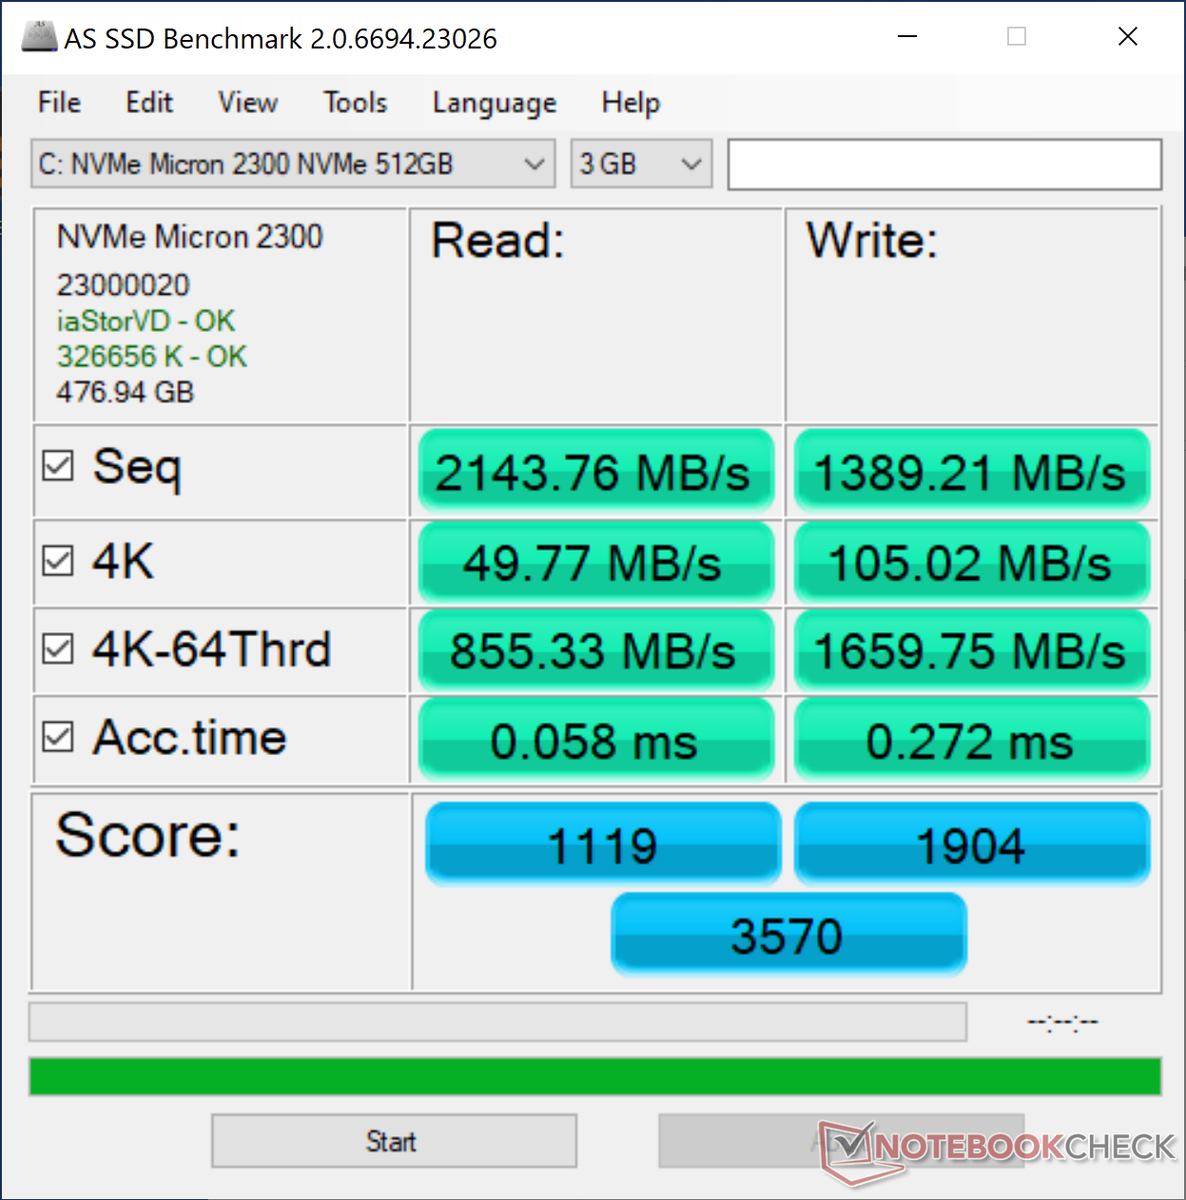
| Dell XPS 13 9310 Core i7 4K Micron 2300 512GB MTFDHBA512TDV | Asus Zenbook S UX393JA Intel SSD 660p 1TB SSDPEKNW010T8 | Huawei MateBook X Pro 2020 i7 Samsung PM981a MZVLB1T0HBLR | Dell XPS 13 9300 Core i7-1065G7 Intel SSDPEMKF512G8 NVMe SSD | Lenovo Yoga Slim 7-14ARE Samsung SSD PM981a MZVLB512HBJQ | HP Spectre x360 13-aw0013dx Intel Optane Memory H10 with Solid State Storage 32GB + 512GB HBRPEKNX0202A(L/H) | |
|---|---|---|---|---|---|---|
| AS SSD | -16% | 45% | -21% | 23% | -36% | |
| Seq Read (MB/s) | 2144 | 1405 -34% | 2737 28% | 1956 -9% | 1658 -23% | 1039 -52% |
| Seq Write (MB/s) | 1389 | 1062 -24% | 2530 82% | 1227 -12% | 2464 77% | 310.1 -78% |
| 4K Read (MB/s) | 49.77 | 50.8 2% | 54 8% | 63 27% | 59.5 20% | 76 53% |
| 4K Write (MB/s) | 105 | 124.9 19% | 152.5 45% | 156.6 49% | 128.6 22% | 118 12% |
| 4K-64 Read (MB/s) | 855 | 590 -31% | 2011 135% | 475.6 -44% | 1576 84% | 371.8 -57% |
| 4K-64 Write (MB/s) | 1660 | 840 -49% | 1260 -24% | 539 -68% | 1986 20% | 469.5 -72% |
| Access Time Read * (ms) | 0.058 | 0.041 29% | 0.066 -14% | 0.042 28% | 0.049 16% | 0.067 -16% |
| Access Time Write * (ms) | 0.272 | 0.118 57% | 0.024 91% | 0.105 61% | 0.087 68% | 0.138 49% |
| Score Read (Points) | 1119 | 781 -30% | 2339 109% | 734 -34% | 1802 61% | 552 -51% |
| Score Write (Points) | 1904 | 1071 -44% | 1666 -12% | 818 -57% | 2361 24% | 618 -68% |
| Score Total (Points) | 3570 | 2251 -37% | 5191 45% | 1915 -46% | 5133 44% | 1448 -59% |
| Copy ISO MB/s (MB/s) | 1929 | 1459 -24% | 1022 -47% | 1588 -18% | 764 -60% | |
| Copy Program MB/s (MB/s) | 1012 | 600 -41% | 302.8 -70% | 550 -46% | 465.8 -54% | |
| Copy Game MB/s (MB/s) | 1737 | 1411 -19% | 491.4 -72% | 1329 -23% | 764 -56% | |
| CrystalDiskMark 5.2 / 6 | -6% | 24% | 27% | 35% | 6% | |
| Write 4K (MB/s) | 86 | 129.5 51% | 165.6 93% | 186.8 117% | 146.1 70% | 112.6 31% |
| Read 4K (MB/s) | 40.11 | 54 35% | 50.2 25% | 71.4 78% | 47.18 18% | 131 227% |
| Write Seq (MB/s) | 1738 | 1265 -27% | 1905 10% | 1203 -31% | 2896 67% | 458.9 -74% |
| Read Seq (MB/s) | 1553 | 1410 -9% | 1669 7% | 2600 67% | 2754 77% | 1355 -13% |
| Write 4K Q32T1 (MB/s) | 454.9 | 420.3 -8% | 474.6 4% | 514 13% | 425.8 -6% | 341.3 -25% |
| Read 4K Q32T1 (MB/s) | 385.4 | 357.7 -7% | 508 32% | 570 48% | 514 33% | 320.6 -17% |
| Write Seq Q32T1 (MB/s) | 2784 | 1799 -35% | 3007 8% | 786 -72% | 2989 7% | 1219 -56% |
| Read Seq Q32T1 (MB/s) | 3217 | 1616 -50% | 3556 11% | 2947 -8% | 3568 11% | 2462 -23% |
| Média Total (Programa/Configurações) | -11% /
-13% | 35% /
36% | 3% /
-4% | 29% /
27% | -15% /
-21% |
* ... menor é melhor

Disk Throttling: DiskSpd Read Loop, Queue Depth 8
Desempenho da GPU
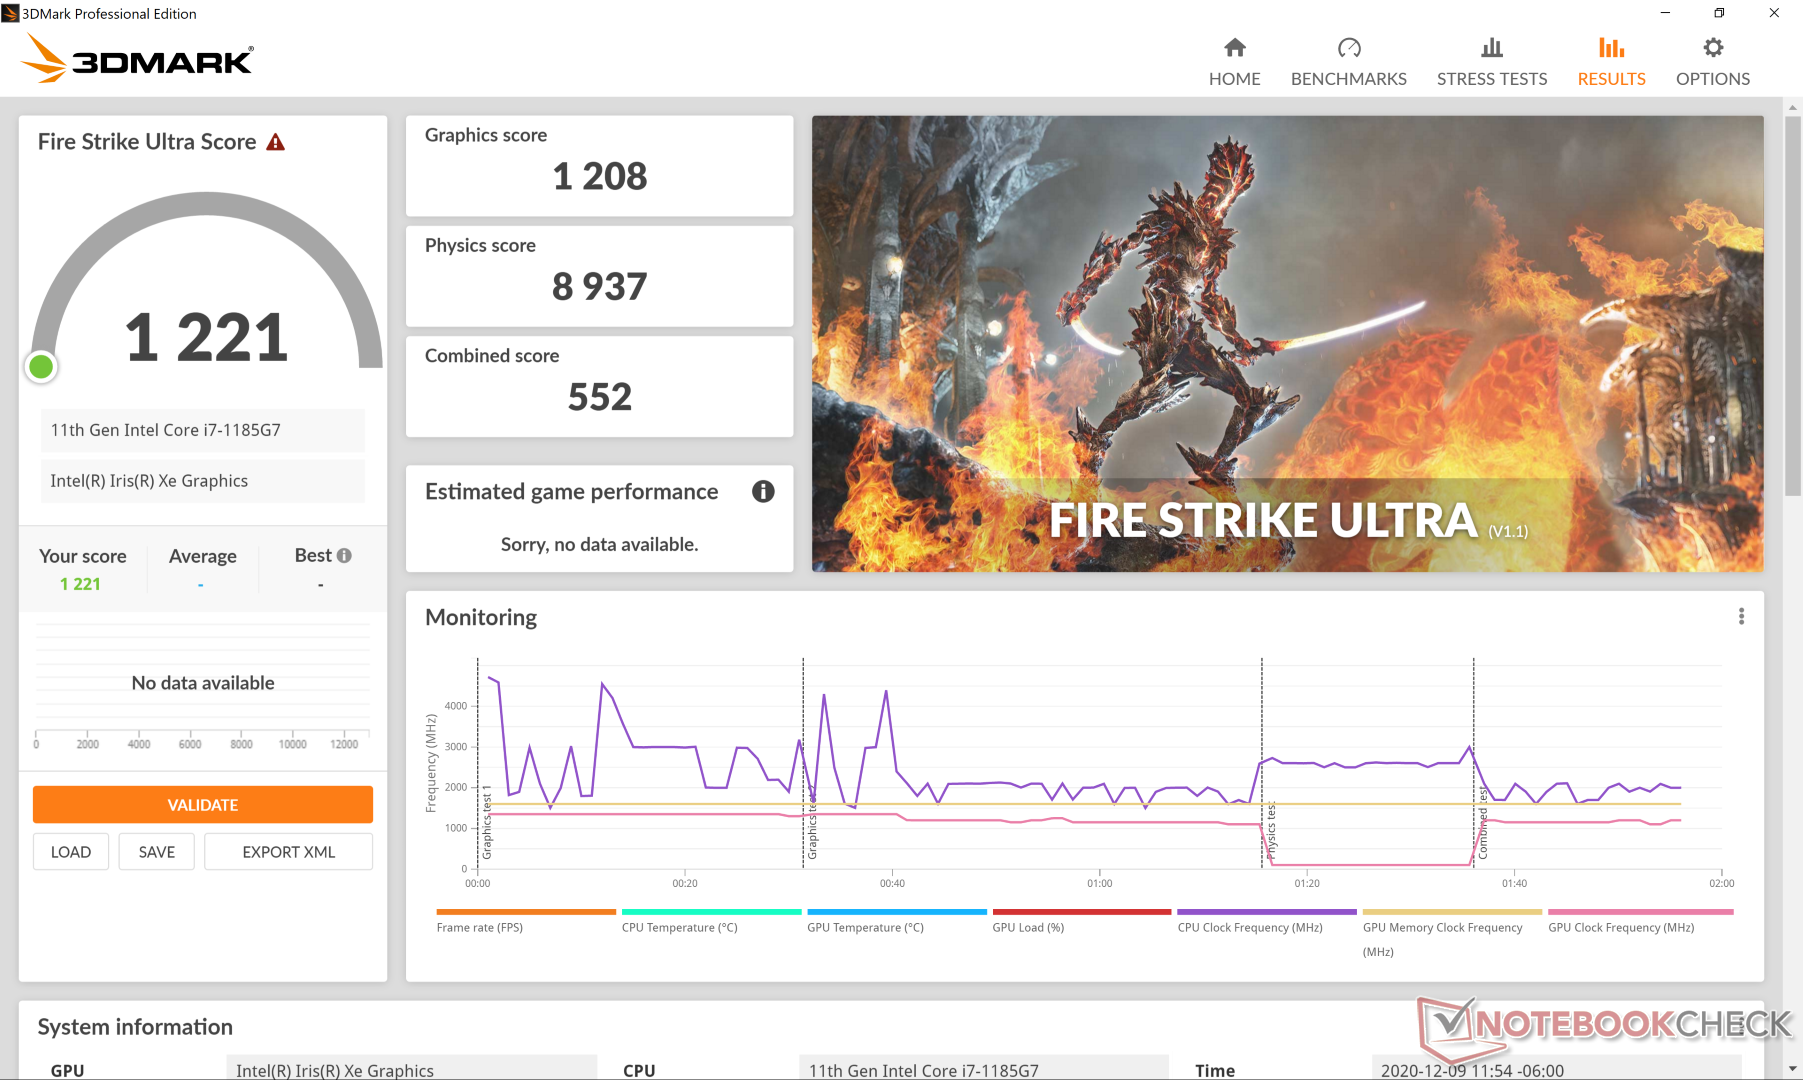
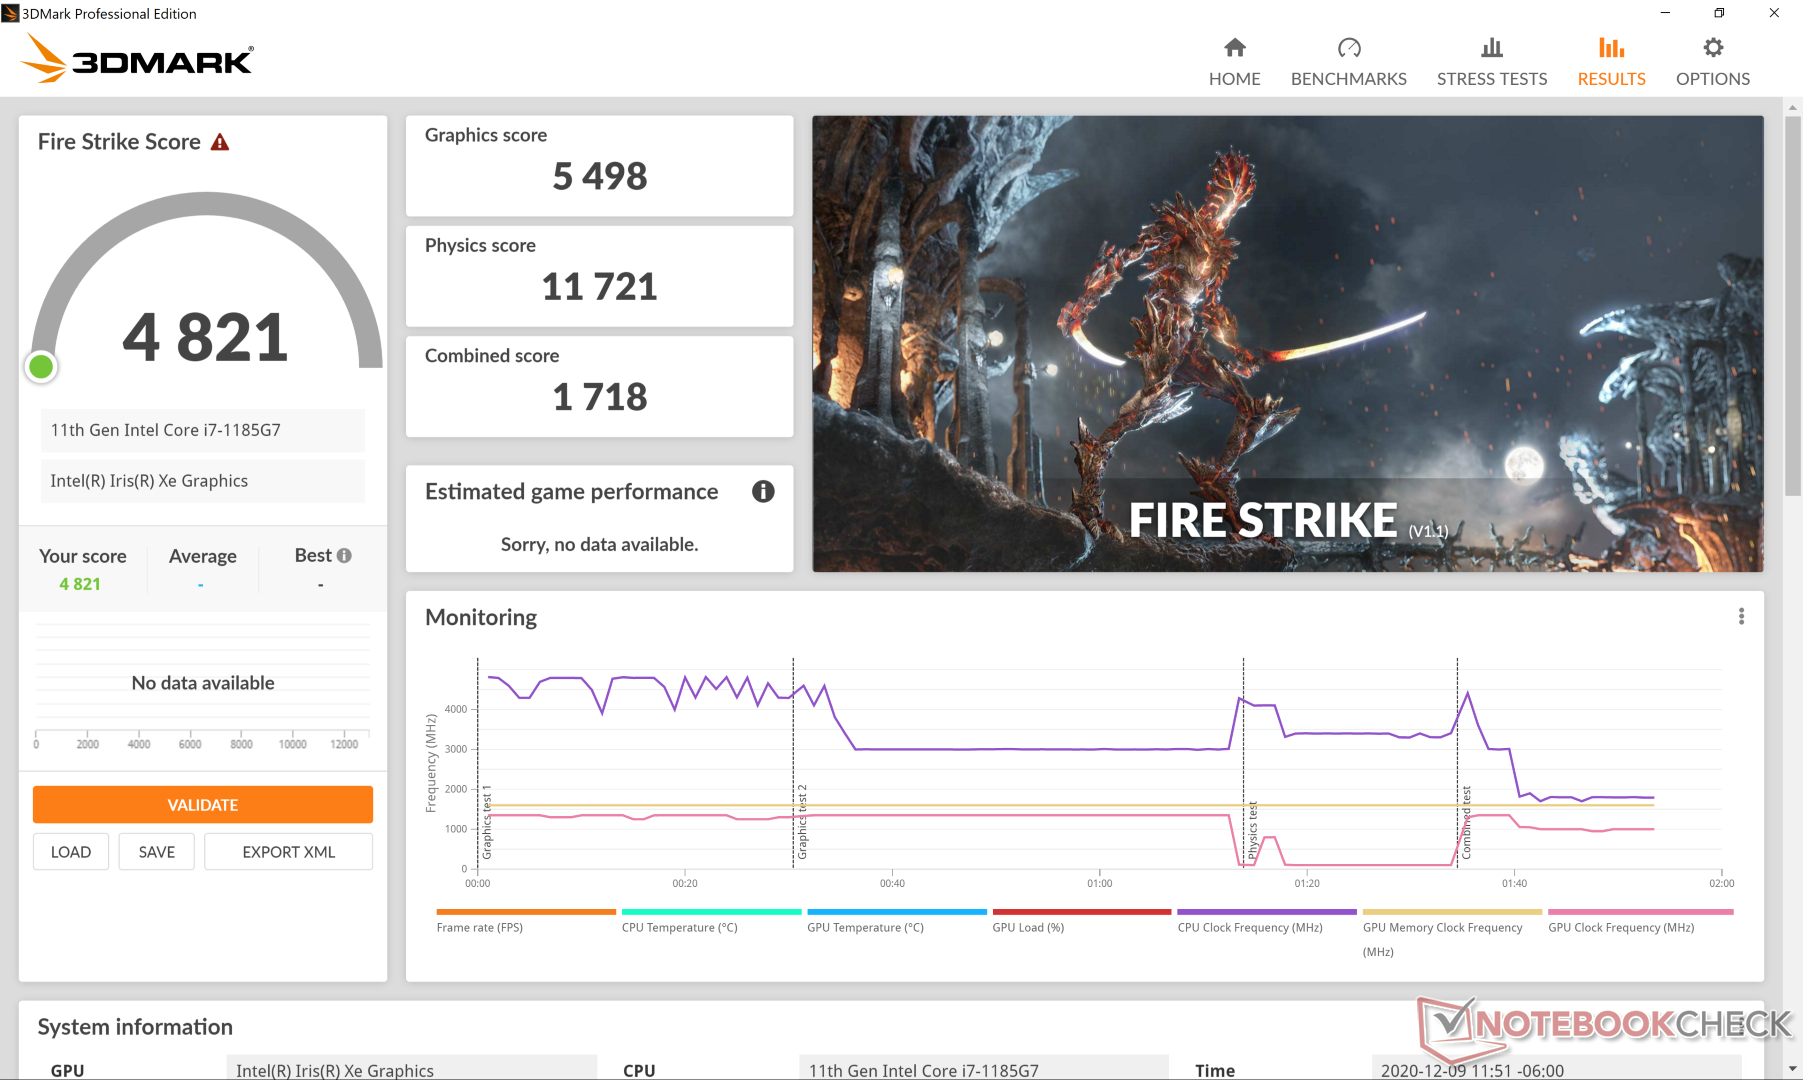
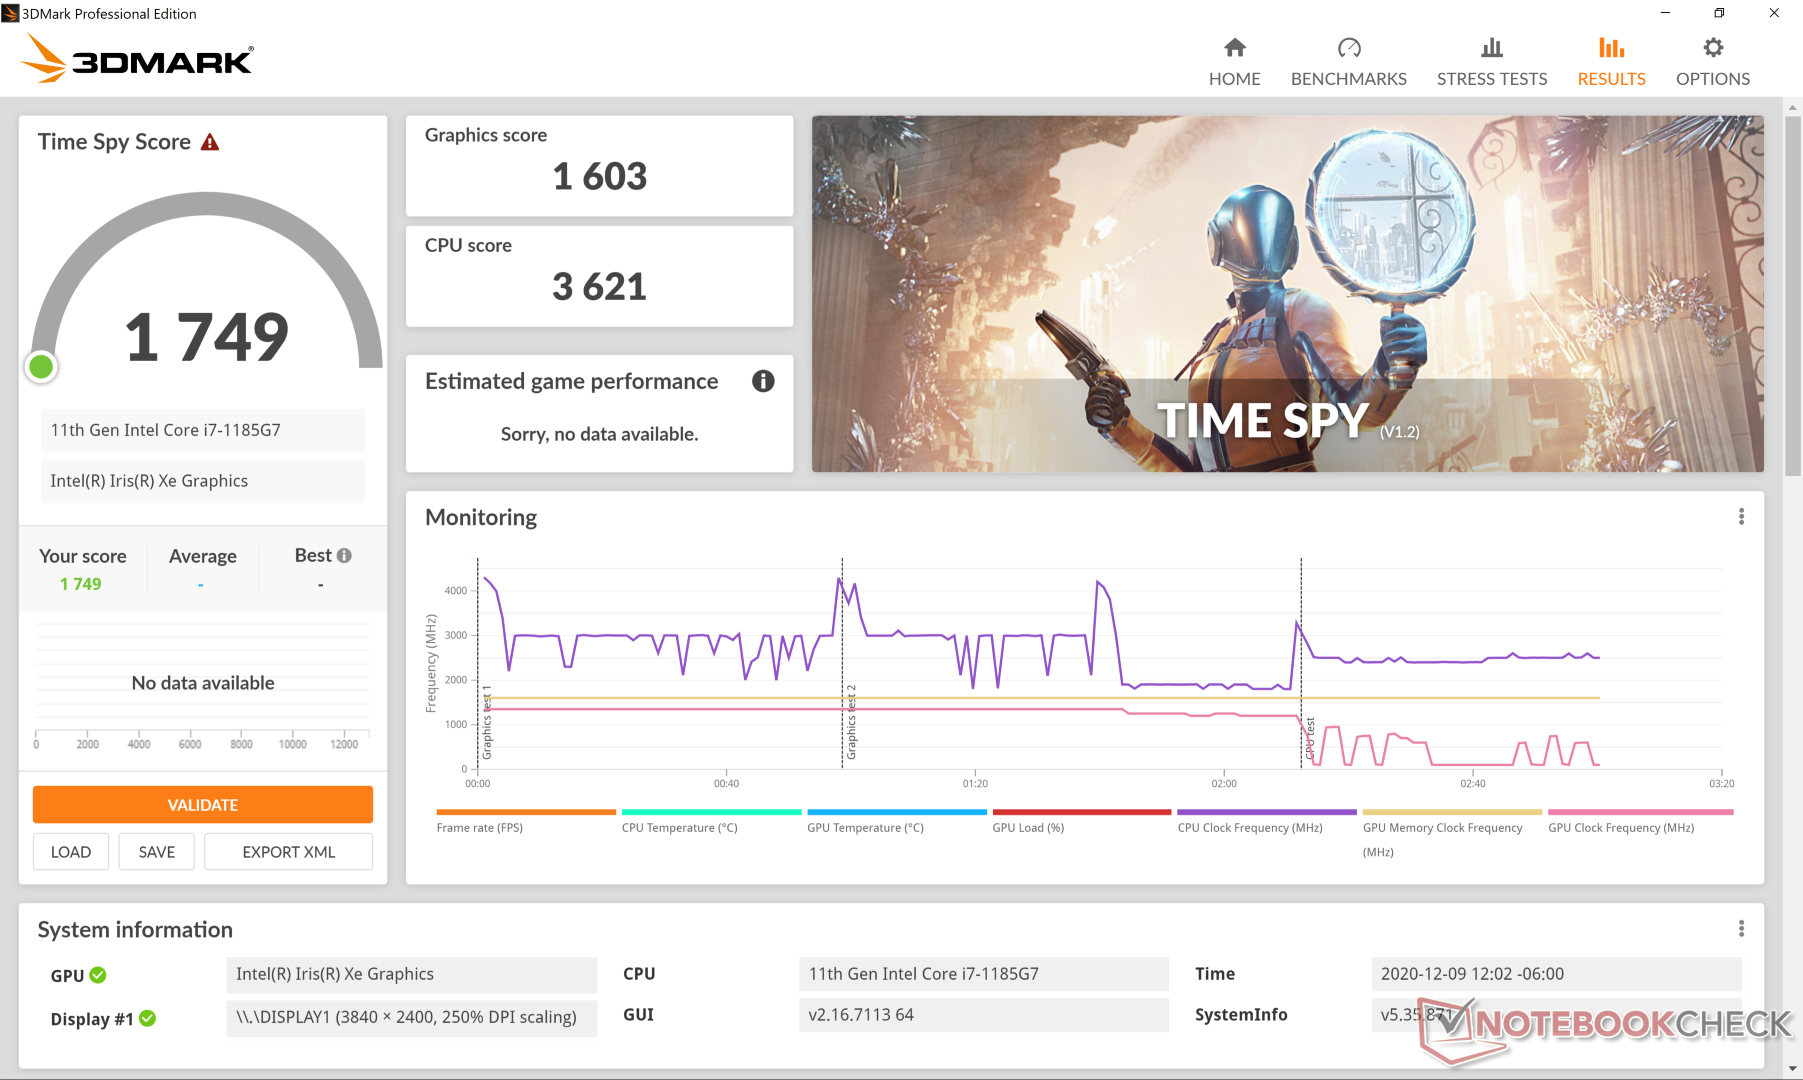
Estranhamente, os resultados do 3DMark são consistentemente mais altos do que o que registramos no XPS 13 Core i7-1165G7, embora os jogos pareçam rodar um pouco mais rápido nesta última configuração. Time Spy gráficos, por exemplo, é 30% mais alto para nosso XPS 13 Core i7-1185G7 SKU enquanto as taxas de quadros ao rodar jogos como DOTA 2, Final Fantasy XV e GTA Vsão alguns quadros mais baixos do que no XPS 13 Core i7-1165G7. Não temos uma explicação firme sobre as discrepâncias, mas elas significam que os usuários devem esperar aproximadamente o mesmo desempenho gráfico que o XPS 13 Core i7-1165G7 em cenários mais reais fora do 3DMark. Suspeitamos que as taxas flutuantes do relógio e as diferenças no estado frio antes da execução dos testes podem ter influenciado as notas finais.
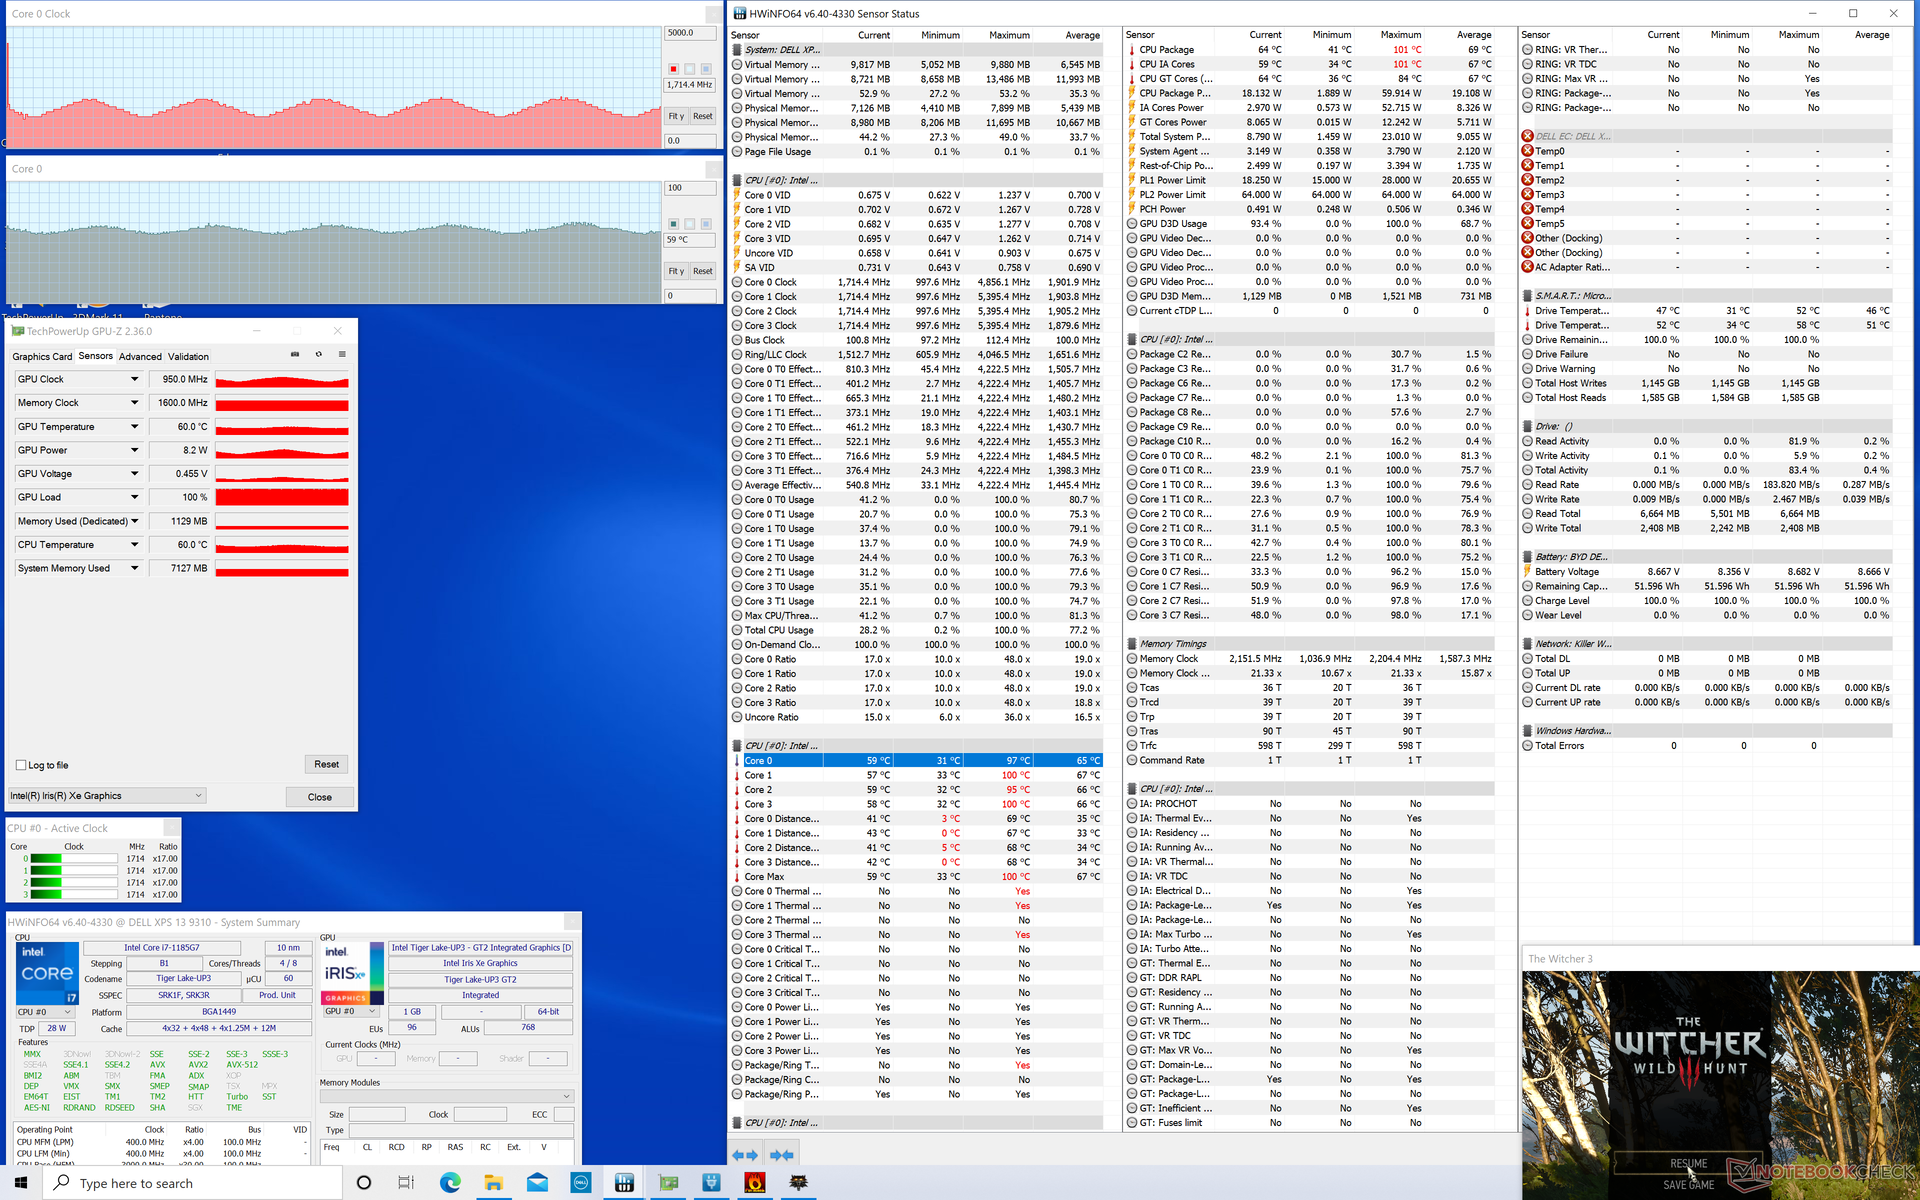
Manuseio em Witcher 3 em configurações baixas mostra as mesmas flutuações sinusoidais nas taxas de estrutura muito parecidas com o que observamos no teste de loop do XPS 13 9310 Core i7-1165G7 e CineBench R15 xT acima. Neste exemplo, as taxas de quadros cicatrizariam entre 50 FPS e 90 FPS devido às taxas do relógio de ciclismo.
Consulte nossa página dedicada no Iris Xe para obter mais informações técnicas e comparações de benchmark.
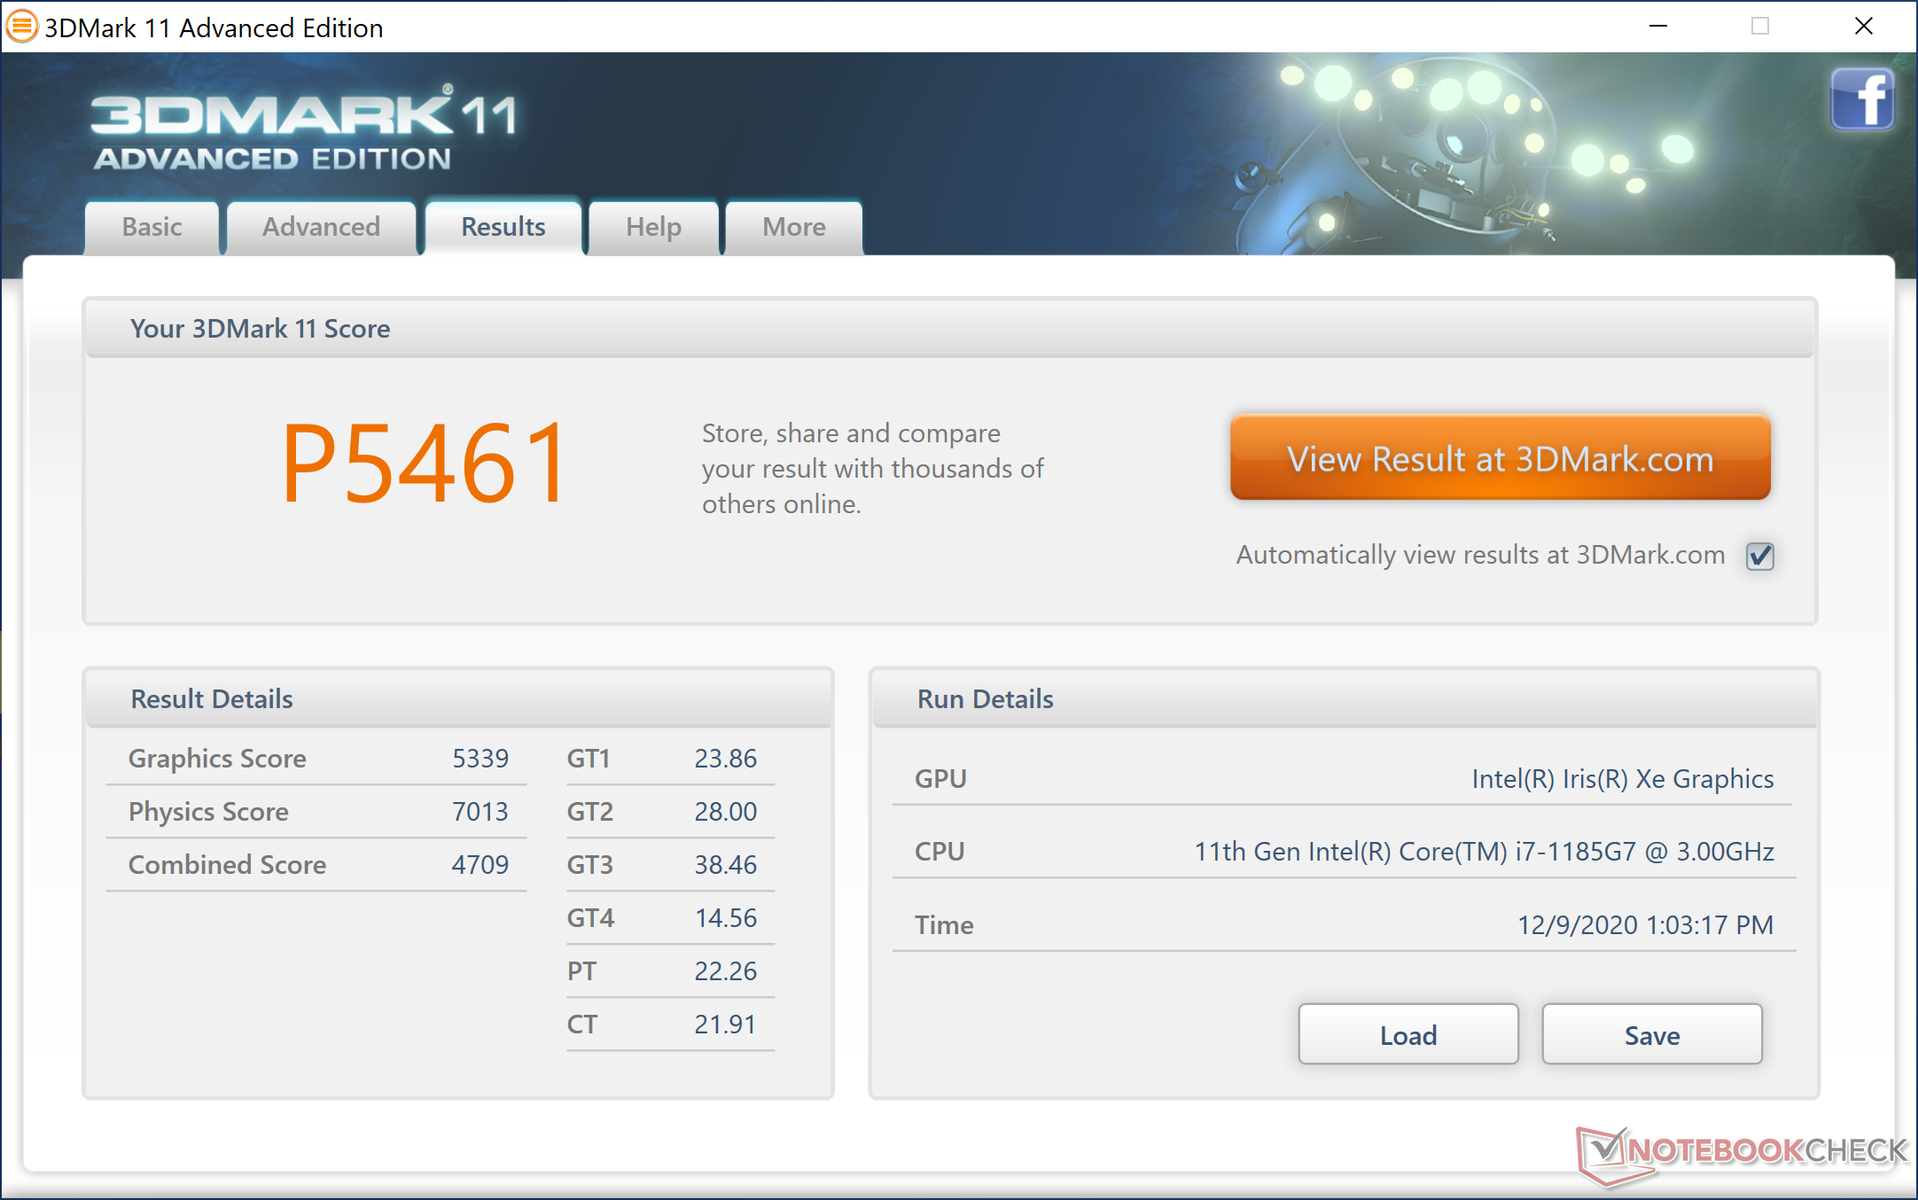
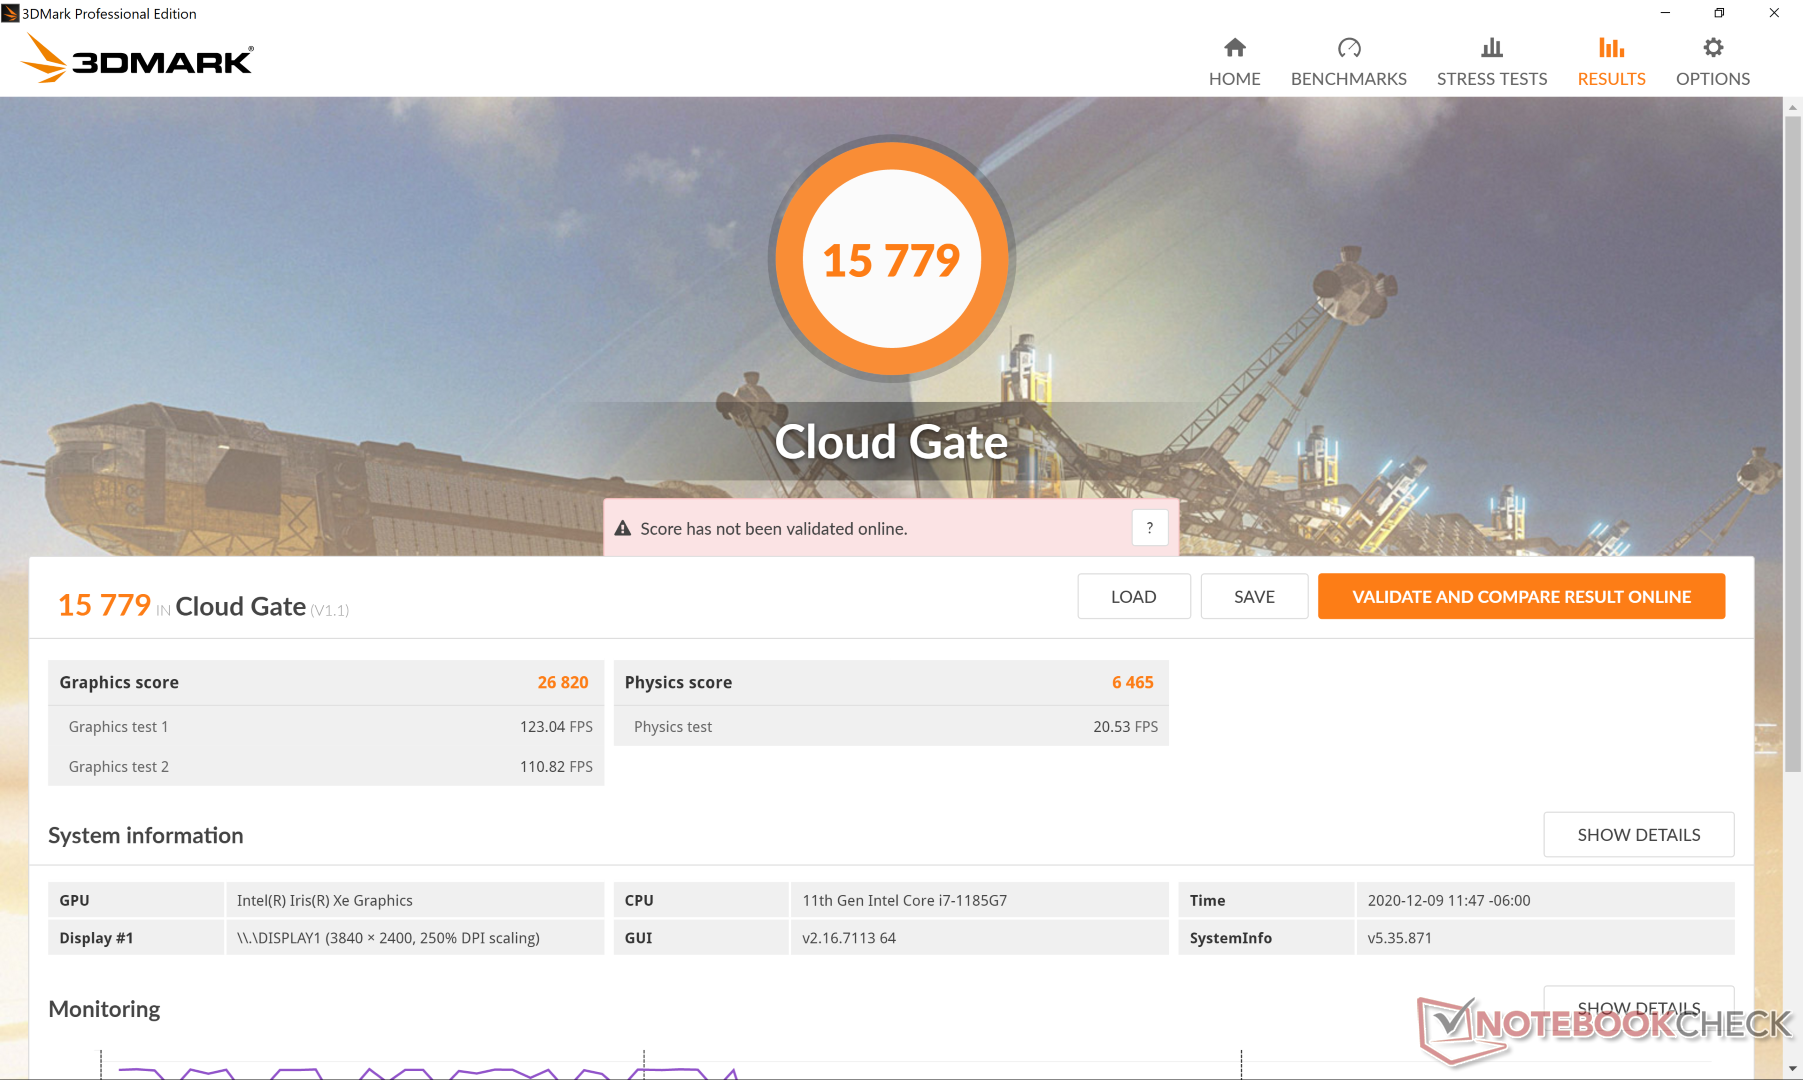
| 3DMark 11 Performance | 5461 pontos | |
| 3DMark Cloud Gate Standard Score | 15779 pontos | |
| 3DMark Fire Strike Score | 4821 pontos | |
| 3DMark Time Spy Score | 1749 pontos | |
Ajuda | ||
| GTA V | |
| 1024x768 Lowest Settings possible | |
| Lenovo Yoga Slim 7-14ARE | |
| Razer Book 13 FHD | |
| Média Intel Iris Xe Graphics G7 96EUs (52 - 166.4, n=168) | |
| Dell XPS 13 9310 Core i7 FHD | |
| Dell XPS 13 9310 Core i7 4K | |
| 1920x1080 Lowest Settings possible | |
| Média Intel Iris Xe Graphics G7 96EUs (34.7 - 132.1, n=141) | |
| Dell XPS 13 9310 Core i7 FHD | |
| Razer Book 13 FHD | |
| Lenovo Yoga Slim 7-14ARE | |
| Dell XPS 13 9310 Core i7 4K | |
| 1920x1080 Normal/Off AF:4x | |
| Lenovo Yoga Slim 7-14ARE | |
| Dell XPS 13 9310 Core i7 FHD | |
| Média Intel Iris Xe Graphics G7 96EUs (20 - 119.3, n=142) | |
| Razer Book 13 FHD | |
| Dell XPS 13 9310 Core i7 4K | |
| 1920x1080 High/On (Advanced Graphics Off) AA:2xMSAA + FX AF:8x | |
| Lenovo Yoga Slim 7-14ARE | |
| Razer Book 13 FHD | |
| Dell XPS 13 9310 Core i7 FHD | |
| Média Intel Iris Xe Graphics G7 96EUs (9.39 - 51.6, n=162) | |
| Dell XPS 13 9310 Core i7 4K | |
| 1920x1080 Highest AA:4xMSAA + FX AF:16x | |
| Razer Book 13 FHD | |
| Lenovo Yoga Slim 7-14ARE | |
| Dell XPS 13 9310 Core i7 FHD | |
| Dell XPS 13 9310 Core i7 4K | |
| Média Intel Iris Xe Graphics G7 96EUs (4.13 - 22.9, n=156) | |
| baixo | média | alto | ultra | QHD | 4K | |
|---|---|---|---|---|---|---|
| GTA V (2015) | 80.8 | 64.6 | 20.5 | 9.75 | ||
| The Witcher 3 (2015) | 107 | 61.9 | 34.5 | 15.3 | ||
| Dota 2 Reborn (2015) | 80.7 | 51.4 | 38.2 | 38.6 | 20 | |
| Final Fantasy XV Benchmark (2018) | 31.3 | 18.8 | 14.6 | 11.4 | 7.54 | |
| X-Plane 11.11 (2018) | 26 | 27.8 | 31.8 | 14.9 |
Emissions
Ruído do sistema
Embora as taxas de relógio estejam sempre flutuando quando sob carga, felizmente o ruído do ventilador permanece estável. Na verdade, o sistema é sempre silencioso ou inaudível até que cargas mais pesadas como jogos sejam introduzidas. Realisticamente, a maioria dos usuários não ouvirá nada além de 33 dB(A), a menos que o processador esteja estressado ao máximo por períodos mais longos.
| Dell XPS 13 9310 Core i7 4K Iris Xe G7 96EUs, i7-1185G7, Micron 2300 512GB MTFDHBA512TDV | Asus Zenbook S UX393JA Iris Plus Graphics G7 (Ice Lake 64 EU), i7-1065G7, Intel SSD 660p 1TB SSDPEKNW010T8 | Huawei MateBook X Pro 2020 i7 GeForce MX250, i7-10510U, Samsung PM981a MZVLB1T0HBLR | Dell XPS 13 9300 Core i7-1065G7 Iris Plus Graphics G7 (Ice Lake 64 EU), i7-1065G7, Intel SSDPEMKF512G8 NVMe SSD | Lenovo Yoga Slim 7-14ARE Vega 8, R7 4800U, Samsung SSD PM981a MZVLB512HBJQ | HP Spectre x360 13-aw0013dx Iris Plus Graphics G7 (Ice Lake 64 EU), i7-1065G7, Intel Optane Memory H10 with Solid State Storage 32GB + 512GB HBRPEKNX0202A(L/H) | |
|---|---|---|---|---|---|---|
| Noise | -10% | -12% | -7% | 0% | -2% | |
| desligado / ambiente * (dB) | 27.7 | 26.9 3% | 29.6 -7% | 28.3 -2% | 26.3 5% | 28.5 -3% |
| Idle Minimum * (dB) | 27.8 | 26.9 3% | 29.6 -6% | 28.3 -2% | 26.5 5% | 28.5 -3% |
| Idle Average * (dB) | 27.8 | 29 -4% | 29.6 -6% | 28.3 -2% | 26.5 5% | 28.5 -3% |
| Idle Maximum * (dB) | 27.8 | 31.1 -12% | 30.3 -9% | 28.3 -2% | 26.5 5% | 28.5 -3% |
| Load Average * (dB) | 27.9 | 37.7 -35% | 38 -36% | 32.5 -16% | 31.8 -14% | 28.5 -2% |
| Witcher 3 ultra * (dB) | 32.8 | 40.2 -23% | 38 -16% | 39.3 -20% | 35.9 -9% | 35.3 -8% |
| Load Maximum * (dB) | 37 | 38.1 -3% | 38 -3% | 39.3 -6% | 35.9 3% | 35.3 5% |
* ... menor é melhor
Barulho
| Ocioso |
| 27.8 / 27.8 / 27.8 dB |
| Carga |
| 27.9 / 37 dB |
 | ||
30 dB silencioso 40 dB(A) audível 50 dB(A) ruidosamente alto |
||
min: | ||
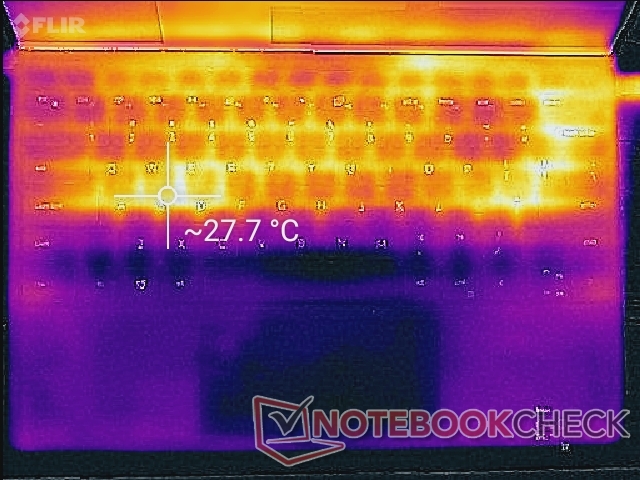
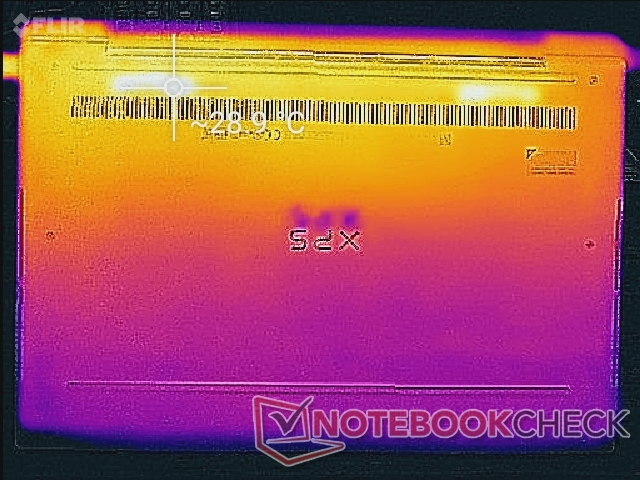
Temperatura
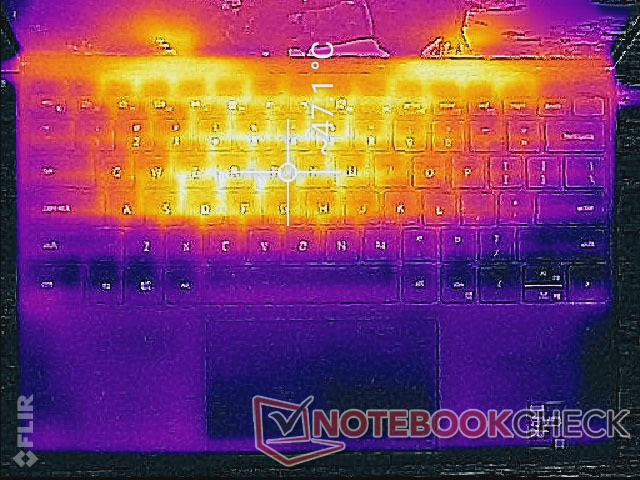
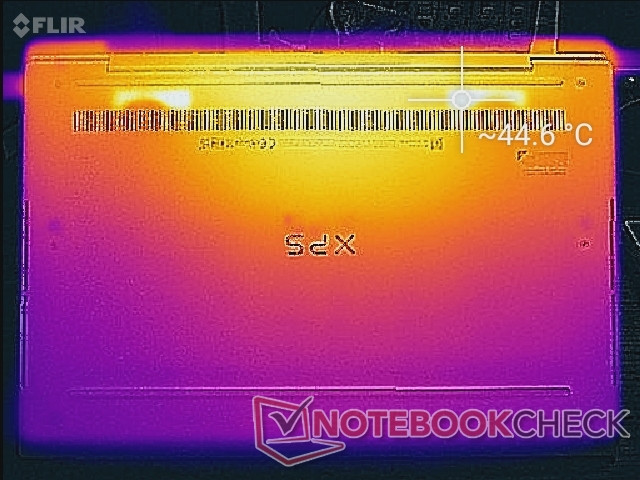
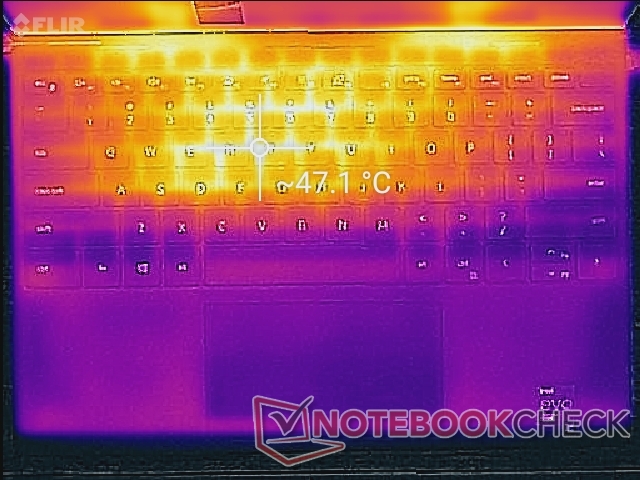
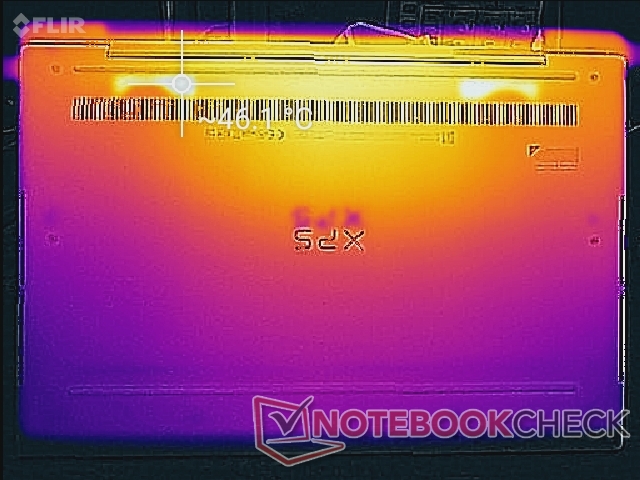
Os pontos quentes são quase os mesmos que registramos no XPS 13 9310 com o menor CPU Core i7-1165G7. Assim, a atualização para a opção Core i7-1185G7 não significa necessariamente que o laptop vai se sentir mais quente ao toque.
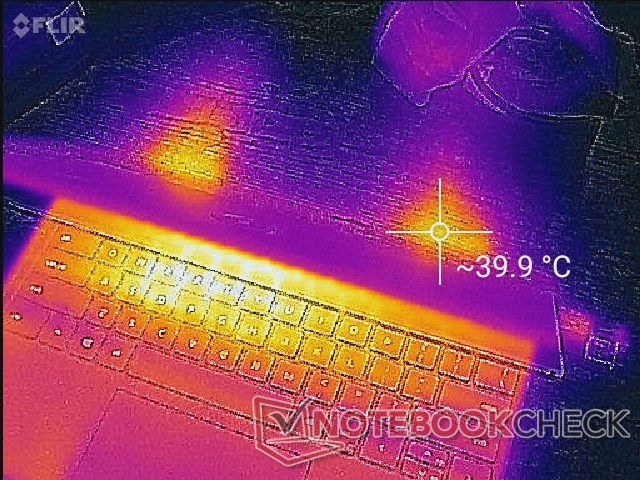

(-) A temperatura máxima no lado superior é 47 °C / 117 F, em comparação com a média de 35.9 °C / 97 F , variando de 21.4 a 59 °C para a classe Subnotebook.
(±) A parte inferior aquece até um máximo de 45 °C / 113 F, em comparação com a média de 39.2 °C / 103 F
(+) Em uso inativo, a temperatura média para o lado superior é 26.1 °C / 79 F, em comparação com a média do dispositivo de 30.8 °C / ### class_avg_f### F.
(±) Jogando The Witcher 3, a temperatura média para o lado superior é 34.4 °C / 94 F, em comparação com a média do dispositivo de 30.8 °C / ## #class_avg_f### F.
(+) Os apoios para as mãos e o touchpad são mais frios que a temperatura da pele, com um máximo de 28.8 °C / 83.8 F e, portanto, são frios ao toque.
(±) A temperatura média da área do apoio para as mãos de dispositivos semelhantes foi 28.2 °C / 82.8 F (-0.6 °C / -1 F).
Teste de estresse
Quando estressado com Prime95, o sistema aumentaria para a faixa de 3,9 GHz a 4,3 GHz por apenas alguns segundos até atingir uma temperatura central de 101 C. Depois disso, as taxas de relógio diminuiriam constantemente até começarem a pedalar indefinidamente entre 2,1 GHz a 3 GHz e 63 C a 81 C. Estas taxas estão muito próximas do que observamos no XPS 13 Core i7-1165G7, onde as taxas de relógio cicatrizariam entre 1,9 GHz e 3,1 GHz na faixa de temperatura central de 71 C a 78 C
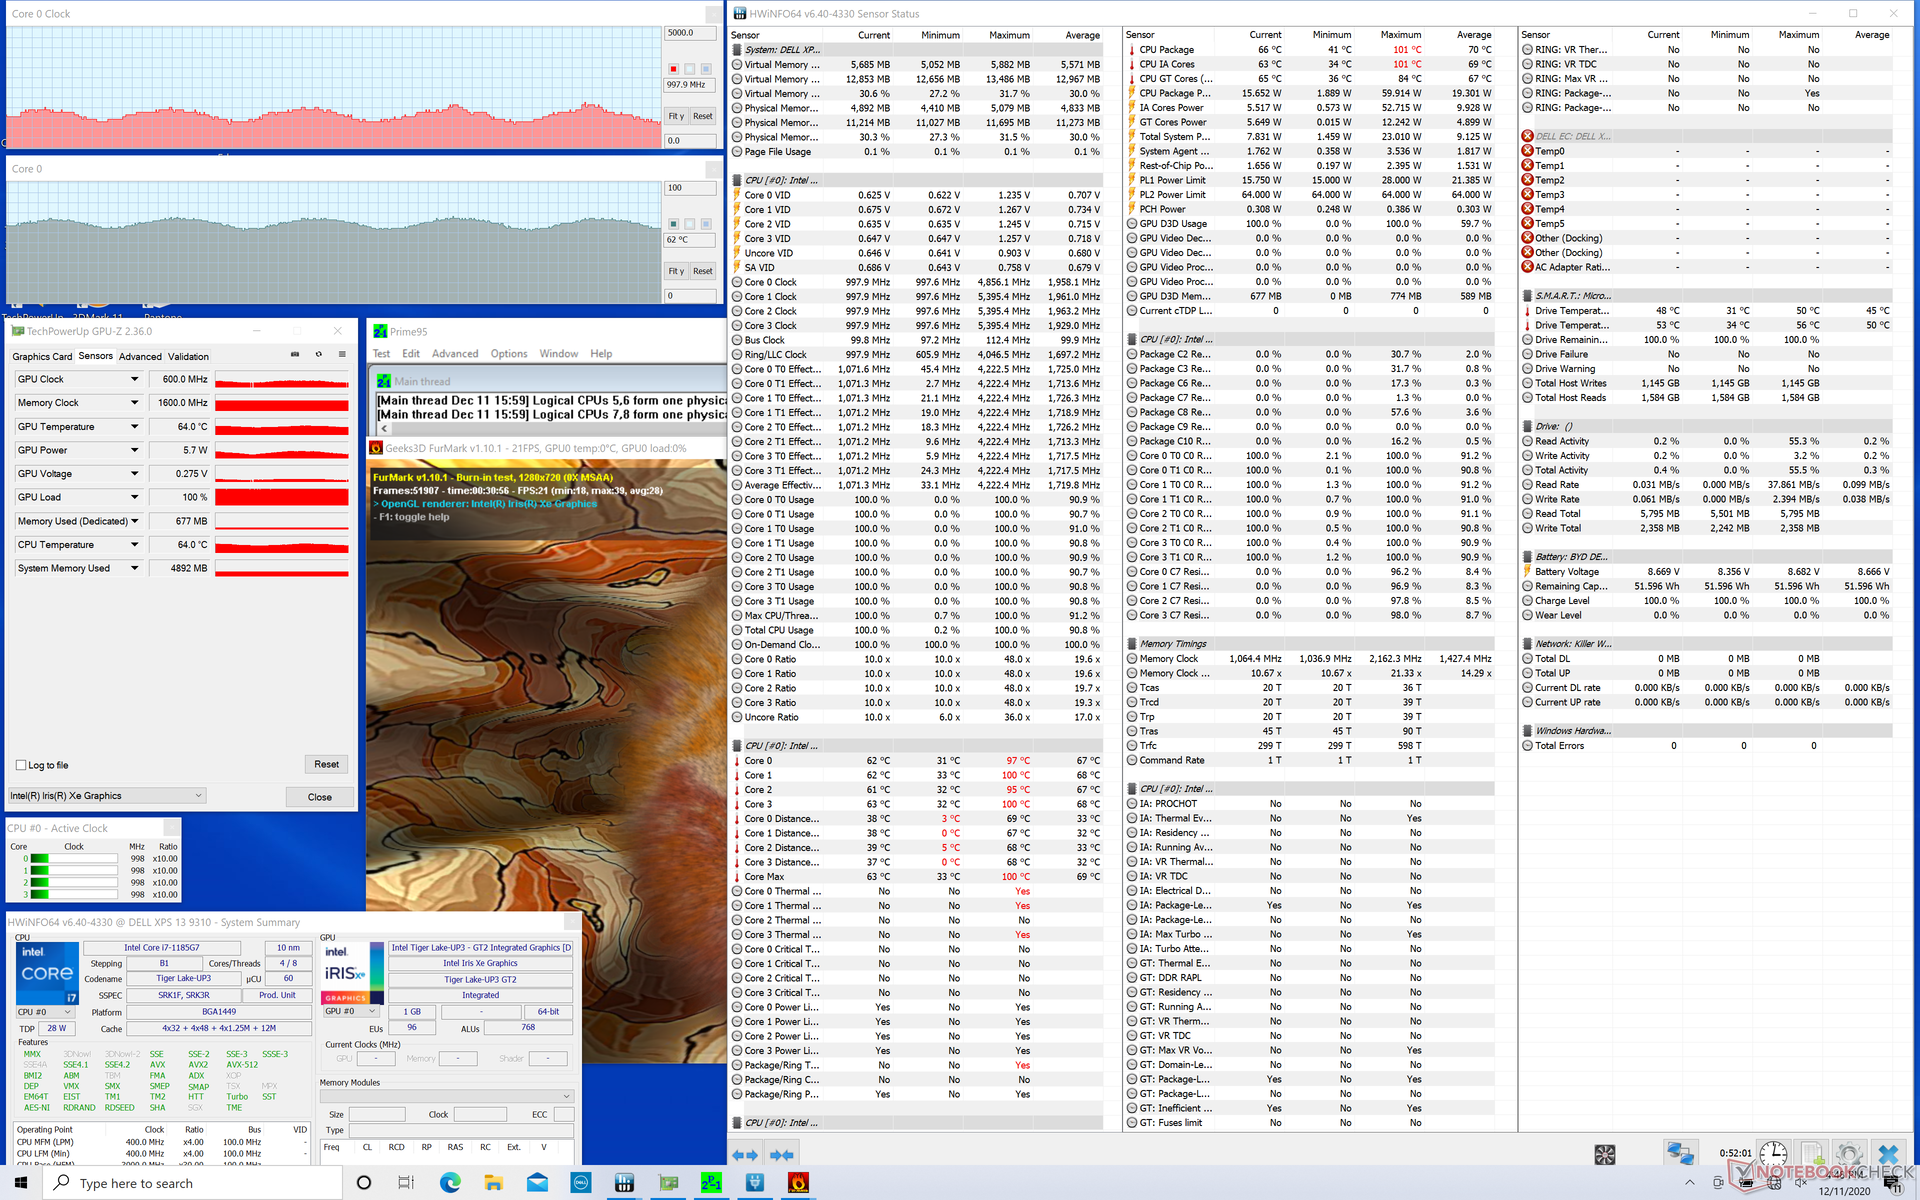
As taxas de relógio da CPU e da GPU cicatrizariam muito quando em funcionamento Witcher 3 bem como que têm efeitos profundos nas taxas de quadros, como mencionado acima. A potência da GPU fluiria entre 5,7 W e 9,2 W também de acordo com a GPU-Z.
Não há grandes déficits de desempenho se a bateria estiver funcionando com energia. Um teste 3DMark 11 com baterias retornaria resultados de Física e Gráficos de 10181 e 6463 pontos, respectivamente, em comparação com 7013 e 5339 pontos quando em rede elétrica. As pontuações mais altas na energia da bateria podem ser atribuídas a um estado mais frio do sistema antes de executar o teste.
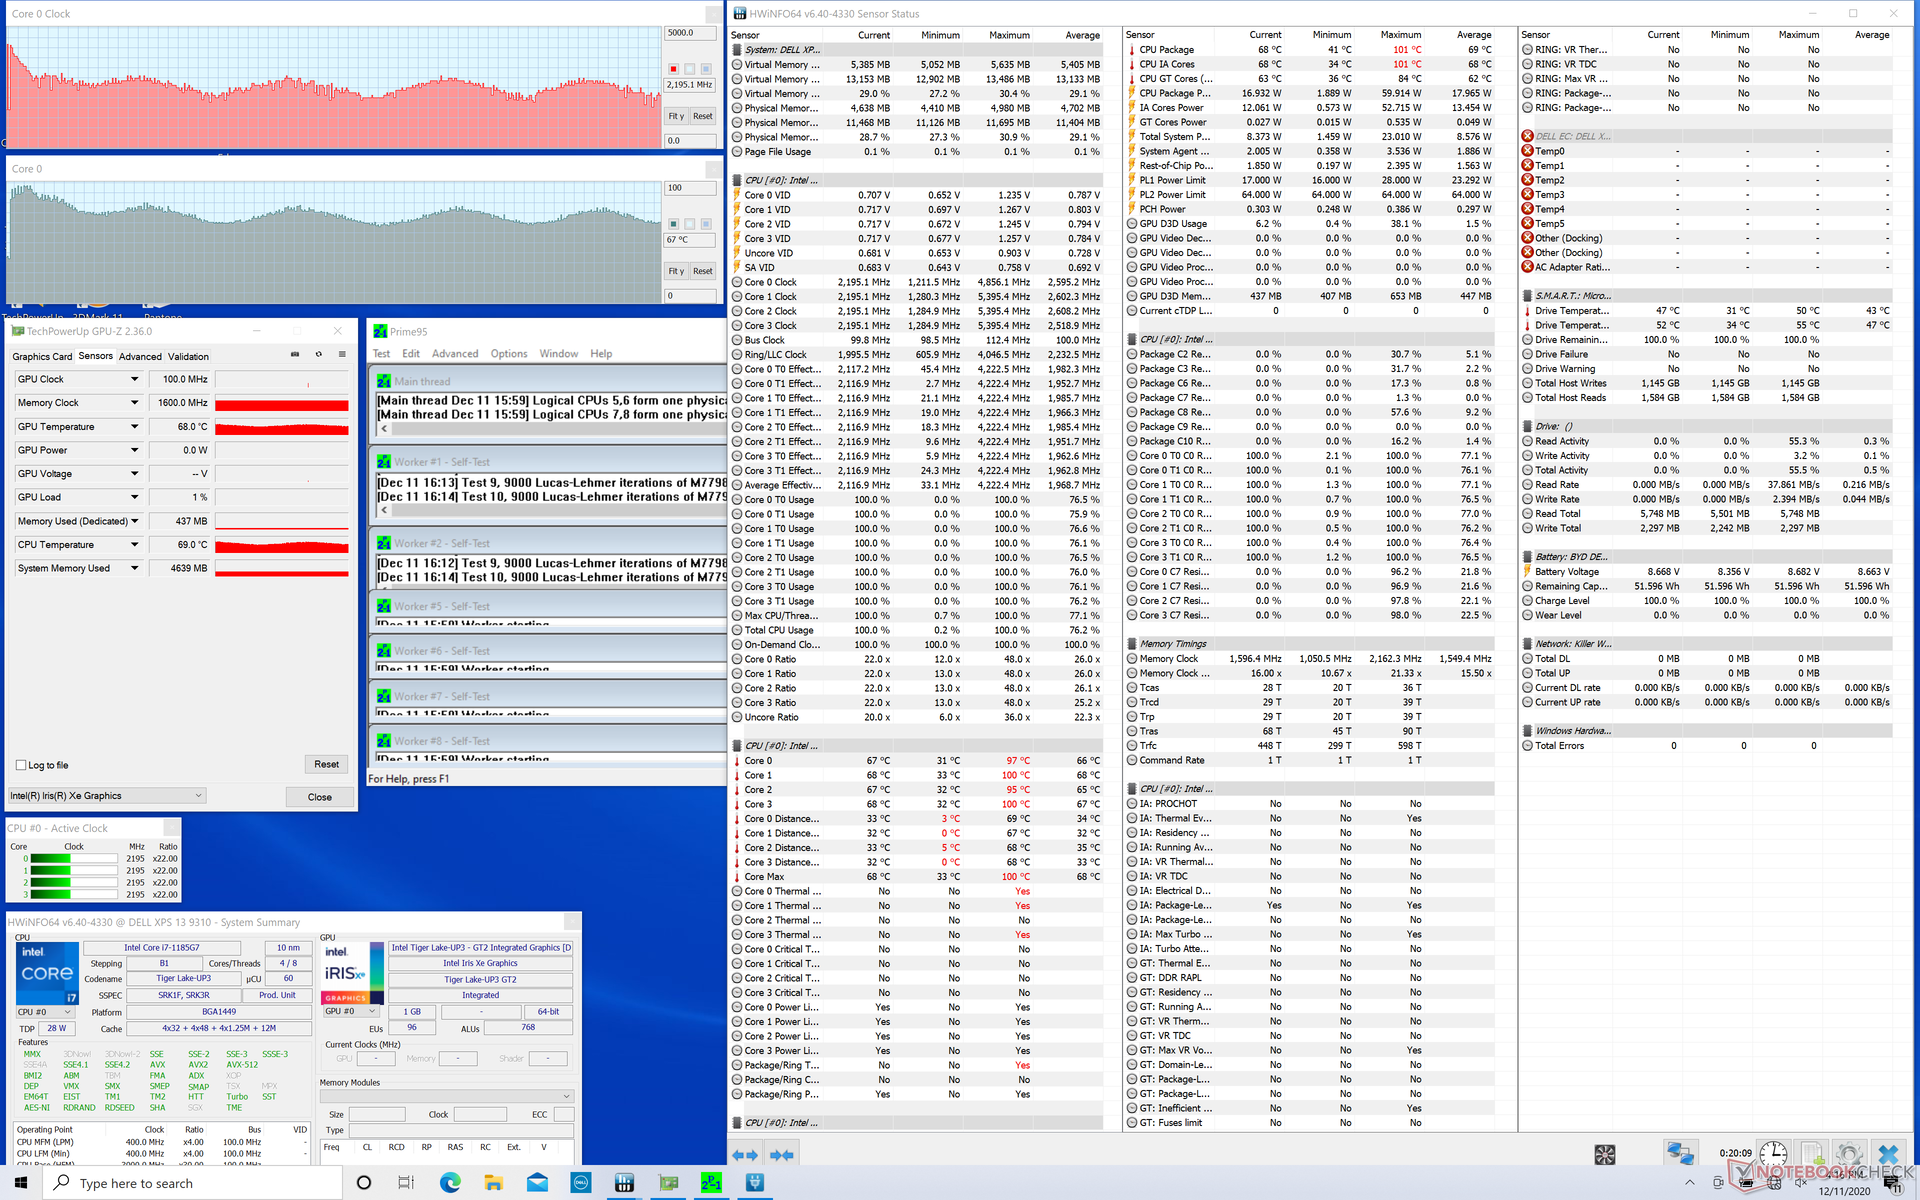
| RelógioCPU (GHz) | RelógioGPU (MHz) | Temperaturamédiada CPU (°C) | |
| System Idle | -- | --41 | |
| Prime95 Stress | 2.1 - 3 | ||
| Prime95 + FurMark Stress | 0.9 - 1.8 | 600 - 1000 | 61 - 71 |
| Witcher 3 Stress | 1.3 - 2.1 | 700 - 1150 | 58 - 65 |
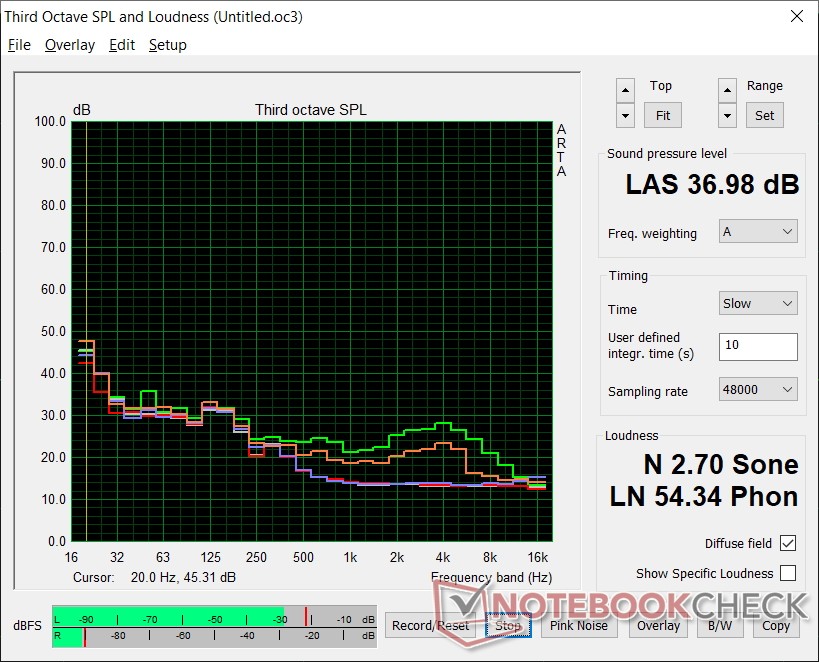
Oradores
Dell XPS 13 9310 Core i7 4K análise de áudio
(+) | os alto-falantes podem tocar relativamente alto (###valor### dB)
Graves 100 - 315Hz
(±) | graves reduzidos - em média 13.1% menor que a mediana
(±) | a linearidade dos graves é média (11.1% delta para a frequência anterior)
Médios 400 - 2.000 Hz
(+) | médios equilibrados - apenas 4.3% longe da mediana
(+) | médios são lineares (4.2% delta para frequência anterior)
Altos 2 - 16 kHz
(+) | agudos equilibrados - apenas 1.5% longe da mediana
(+) | os máximos são lineares (3.8% delta da frequência anterior)
Geral 100 - 16.000 Hz
(+) | o som geral é linear (10.9% diferença em relação à mediana)
Comparado com a mesma classe
» 10% de todos os dispositivos testados nesta classe foram melhores, 3% semelhantes, 87% piores
» O melhor teve um delta de 5%, a média foi 18%, o pior foi 53%
Comparado com todos os dispositivos testados
» 6% de todos os dispositivos testados foram melhores, 2% semelhantes, 92% piores
» O melhor teve um delta de 4%, a média foi 23%, o pior foi 134%
Apple MacBook 12 (Early 2016) 1.1 GHz análise de áudio
(+) | os alto-falantes podem tocar relativamente alto (###valor### dB)
Graves 100 - 315Hz
(±) | graves reduzidos - em média 11.3% menor que a mediana
(±) | a linearidade dos graves é média (14.2% delta para a frequência anterior)
Médios 400 - 2.000 Hz
(+) | médios equilibrados - apenas 2.4% longe da mediana
(+) | médios são lineares (5.5% delta para frequência anterior)
Altos 2 - 16 kHz
(+) | agudos equilibrados - apenas 2% longe da mediana
(+) | os máximos são lineares (4.5% delta da frequência anterior)
Geral 100 - 16.000 Hz
(+) | o som geral é linear (10.2% diferença em relação à mediana)
Comparado com a mesma classe
» 7% de todos os dispositivos testados nesta classe foram melhores, 2% semelhantes, 90% piores
» O melhor teve um delta de 5%, a média foi 18%, o pior foi 53%
Comparado com todos os dispositivos testados
» 5% de todos os dispositivos testados foram melhores, 1% semelhantes, 94% piores
» O melhor teve um delta de 4%, a média foi 23%, o pior foi 134%
Energy Management
Consumo de energia
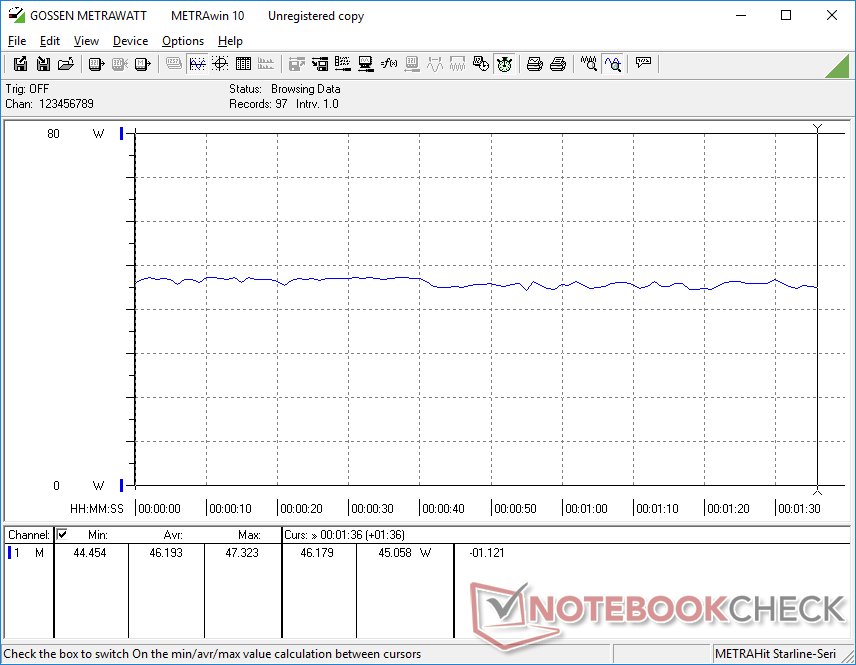
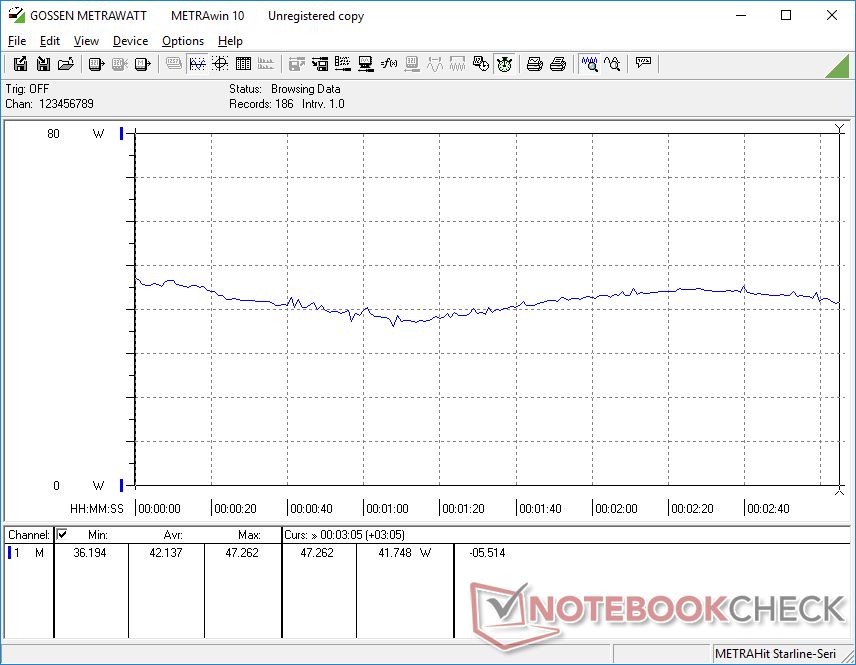
A manipulação na área de trabalho na configuração de maior brilho consome cerca de 8,3 W a 8,8 W em comparação com 5,9 W a 6,3 W na configuração FHD. O ligeiro aumento é provavelmente atribuído em parte ao painel de resolução 4K, mais exigente.
O consumo de energia é geralmente mais alto do que outros Core i7 Ultrabooks alimentados por gráficos integrados quando 3DMark 06. Somos capazes de medir uma média de 46 W em comparação com apenas 32 W a 37 W no HP Spectre x360 13, ZenBook S, ou XPS 13 9310 cada um equipado com o Core i7-1065G7 mais lento do ano passado. No entanto, o desempenho por watt ainda é incrível quando comparado com sistemas Whiskey Lake-U ou Comet Lake-U mais antigos.
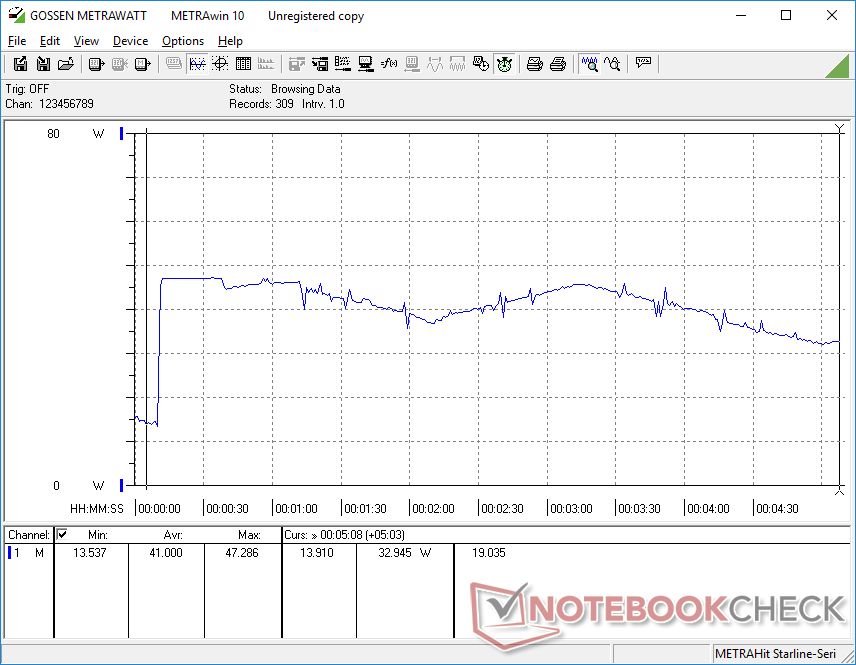
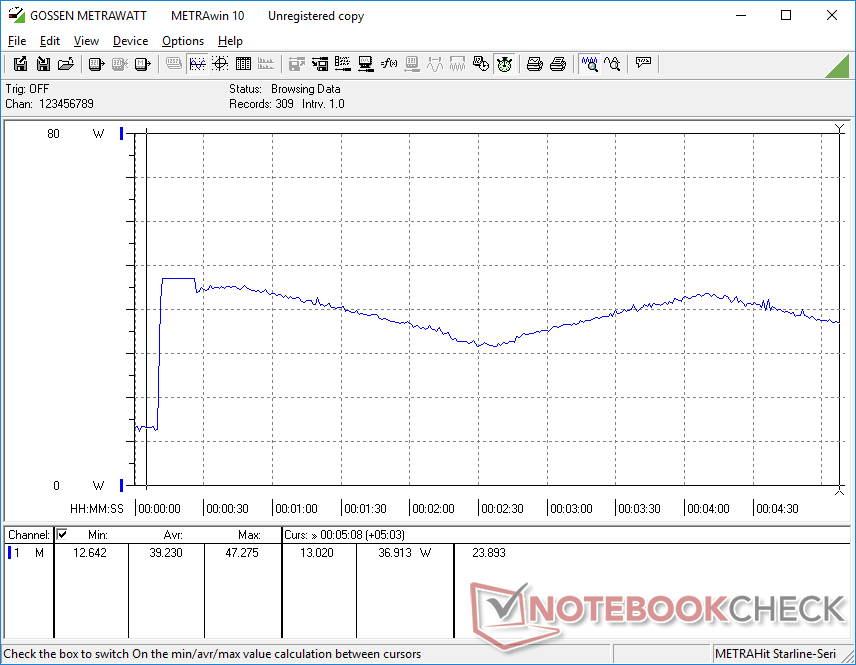
O Running Prime95 extrairia 47 W do pequeno (~6 x 5,5 x 2,3 cm) adaptador CA de 45 W. Entretanto, esta taxa duraria apenas alguns segundos antes de começar a pedalar, como mostram nossos gráficos abaixo, para corresponder às observações do relógio do nosso Teste de Estresse de cima.
| desligado | |
| Ocioso | |
| Carga |
|
Key:
min: | |
| Dell XPS 13 9310 Core i7 4K i7-1185G7, Iris Xe G7 96EUs, Micron 2300 512GB MTFDHBA512TDV, IPS, 3840x2400, 13.4" | Asus Zenbook S UX393JA i7-1065G7, Iris Plus Graphics G7 (Ice Lake 64 EU), Intel SSD 660p 1TB SSDPEKNW010T8, IPS, 3300x2200, 13.9" | Huawei MateBook X Pro 2020 i7 i7-10510U, GeForce MX250, Samsung PM981a MZVLB1T0HBLR, LTPS, 3000x2000, 13.9" | Dell XPS 13 9300 Core i7-1065G7 i7-1065G7, Iris Plus Graphics G7 (Ice Lake 64 EU), Intel SSDPEMKF512G8 NVMe SSD, IPS, 1920x1200, 13.4" | Lenovo Yoga Slim 7-14ARE R7 4800U, Vega 8, Samsung SSD PM981a MZVLB512HBJQ, IPS, 1920x1080, 14" | HP Spectre x360 13-aw0013dx i7-1065G7, Iris Plus Graphics G7 (Ice Lake 64 EU), Intel Optane Memory H10 with Solid State Storage 32GB + 512GB HBRPEKNX0202A(L/H), IPS, 1920x1080, 13.3" | |
|---|---|---|---|---|---|---|
| Power Consumption | 3% | -17% | 12% | 0% | 17% | |
| Idle Minimum * (Watt) | 4.3 | 4.1 5% | 4.3 -0% | 4.2 2% | 4 7% | 3.9 9% |
| Idle Average * (Watt) | 8.3 | 7.5 10% | 8.5 -2% | 6.9 17% | 6.3 24% | 6.3 24% |
| Idle Maximum * (Watt) | 8.8 | 8.5 3% | 12 -36% | 7.5 15% | 7.7 12% | 6.8 23% |
| Load Average * (Watt) | 46.2 | 36.8 20% | 54.8 -19% | 33.3 28% | 48.3 -5% | 32.6 29% |
| Witcher 3 ultra * (Watt) | 42.2 | 39.2 7% | 47.1 -12% | 37.1 12% | 49 -16% | 25.6 39% |
| Load Maximum * (Watt) | 47.3 | 61.6 -30% | 61.5 -30% | 48.4 -2% | 57.6 -22% | 59 -25% |
* ... menor é melhor
Vida útil da bateria
Os tempos de execução são muito mais curtos do que o que registramos no XPS 13 FHD. Enquanto nossa unidade FHD duraria mais de 12 horas de uso de WLAN no mundo real, nossa unidade 4K duraria apenas 7 horas quando no mesmo perfil de desempenho e ajuste de brilho Dell Optimized. Reanalisamos até mesmo nosso teste de vida útil da bateria apenas para verificar quaisquer discrepâncias, mas o tempo de execução aproximado de 7 horas não mudou.
A carga de capacidade vazia a plena é lenta de 2,5 a 3 horas. Muitos outros Ultrabooks podem recarregar quase duas vezes mais rápido, como o Razer Book 13.
| Dell XPS 13 9310 Core i7 4K i7-1185G7, Iris Xe G7 96EUs, 52 Wh | Asus Zenbook S UX393JA i7-1065G7, Iris Plus Graphics G7 (Ice Lake 64 EU), 67 Wh | Huawei MateBook X Pro 2020 i7 i7-10510U, GeForce MX250, 57.4 Wh | Dell XPS 13 9300 Core i7-1065G7 i7-1065G7, Iris Plus Graphics G7 (Ice Lake 64 EU), 52 Wh | Lenovo Yoga Slim 7-14ARE R7 4800U, Vega 8, 61 Wh | HP Spectre x360 13-aw0013dx i7-1065G7, Iris Plus Graphics G7 (Ice Lake 64 EU), 60 Wh | |
|---|---|---|---|---|---|---|
| Duração da bateria | 15% | 44% | 76% | 43% | 38% | |
| WiFi v1.3 (h) | 7.2 | 8.3 15% | 10.4 44% | 12.7 76% | 10.3 43% | 9.9 38% |
| Reader / Idle (h) | 38.4 | 27.1 | 37.1 | |||
| Load (h) | 2.7 | 2.4 | 1.3 | 2.7 |
Pro
Contra
Veredicto

Do ponto de vista de desempenho, o Core i7-1185G7 não oferece muita atualização em relação ao Core i7-1165G7 e, portanto, recomendamos economizar alguns dólares com o Core i7-1165G7. O dinheiro economizado pode, ao invés disso, ir para RAM ou armazenamento adicional ou para a opção de resolução mais alta 4K, onde os upgrades são mais tangíveis. A vida útil da bateria será um par de horas mais curta do que a opção FHD, porém, que é o preço a pagar por esses pixels mais densos.
Se pudéssemos fazer uma mudança no XPS 13 9310, então seria incluir uma opção para taxas de relógio mais estáveis no modo High Performance. As taxas de relógio de ciclismo funcionam bem para maximizar o desempenho médio da CPU quando a solução de resfriamento é o fator limitador, mas as flutuações de desempenho resultantes podem ser desfavoráveis para certas aplicações.
Investir em mais memória RAM ou armazenamento ou na tela de maior resolução 4K seria mais vantajoso do que o Core i7-1185G7, pois os ganhos de desempenho são mínimos na melhor das hipóteses sobre o Core i7-1165G7.
Dell XPS 13 9310 Core i7 4K
- 05/31/2021 v7 (old)
Allen Ngo
Price comparison

