Schenker Work 15 Tiger Lake-H Laptop Review: Iluminação RGB no escritório
Os laptops de trabalho da Schenker combinam hardware forte com muitas opções de configuração. Assim, os notebooks de escritório da empresa podem ser bem adaptados para o propósito desejado. Os Intel Core i5 e i7 da série H estão disponíveis como processadores acompanhados por até 64 GB de memória de trabalho. Uma caixa robusta, feita principalmente de alumínio, completa o quadro geral.
Nosso dispositivo de teste com 32 GB de memória de trabalho, Intel Core i7-11370He 1 TB NVMe SSD custa 1440 Euros sem uma licença Windows. A configuração mais barata através do website do fabricante custa cerca de 1000 Euros.
Vários dispositivos de escritório de 15 polegadas estão disponíveis como concorrentes para a Obra 15. Igualmente configuráveis são, por exemplo, osLenovo ThinkPad E15e oDell Inspiron 15 3501. Entretanto, nenhum outro laptop de escritório ostenta um teclado iluminado por RGB.
Possíveis concorrentes em comparação
Avaliação | Data | Modelo | Peso | Altura | Size | Resolução | Preço |
|---|---|---|---|---|---|---|---|
| 84.3 % v7 (old) | 02/2022 | Schenker Work 15 Tiger Lake-H i7-11370H, Iris Xe G7 96EUs | 1.7 kg | 19.9 mm | 15.60" | 1920x1080 | |
| 84.9 % v7 (old) | 01/2022 | LG Gram 15Z90P-G.AA89G i7-1165G7, Iris Xe G7 96EUs | 1.1 kg | 17.4 mm | 15.60" | 1920x1080 | |
| 80.5 % v7 (old) | 10/2021 | Dell Inspiron 15 3501 i7-1165G7, Iris Xe G7 96EUs | 2 kg | 19.9 mm | 15.60" | 1920x1080 | |
| 85.5 % v7 (old) | 08/2021 | Lenovo ThinkPad E15 G3-20YG003UGE R7 5700U, Vega 8 | 1.8 kg | 18.9 mm | 15.60" | 1920x1080 | |
| 82.1 % v7 (old) | 07/2021 | Asus VivoBook S15 D533UA R7 5700U, Vega 8 | 1.8 kg | 16.1 mm | 15.60" | 1920x1080 | |
| 80.8 % v7 (old) | 07/2021 | HP Pavilion x360 15-er0155ng i5-1135G7, Iris Xe G7 80EUs | 1.8 kg | 19.9 mm | 15.60" | 1920x1080 |
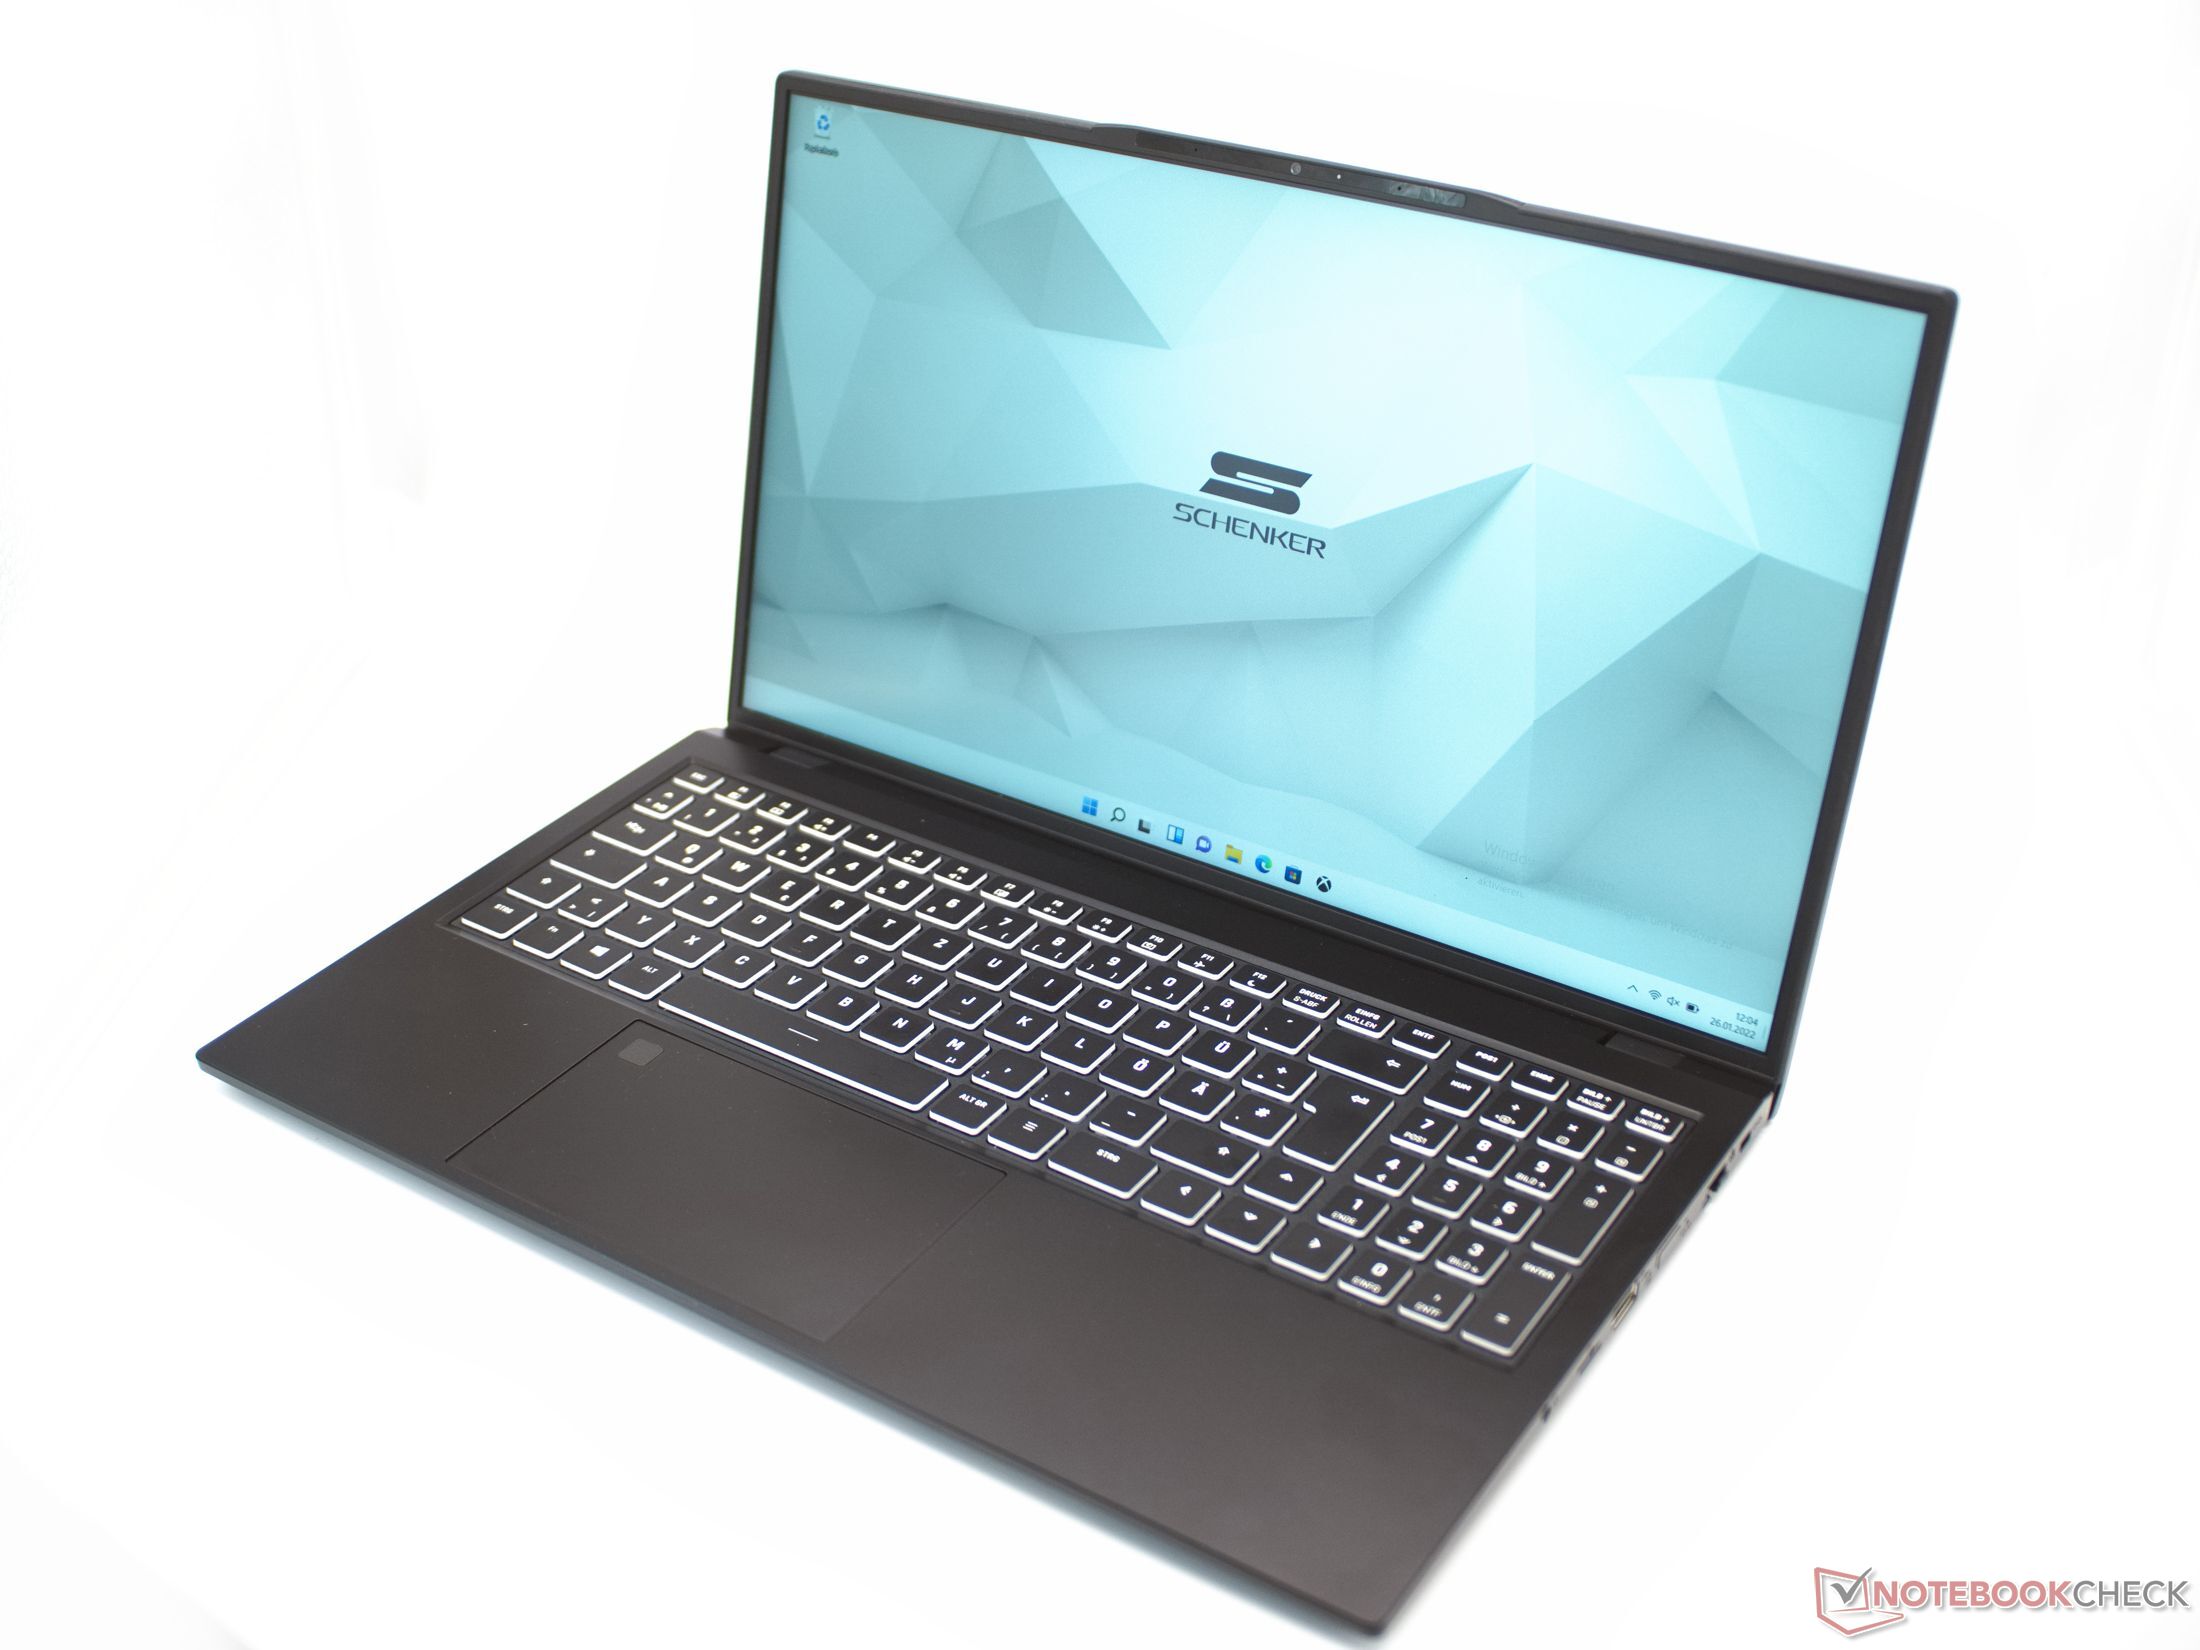
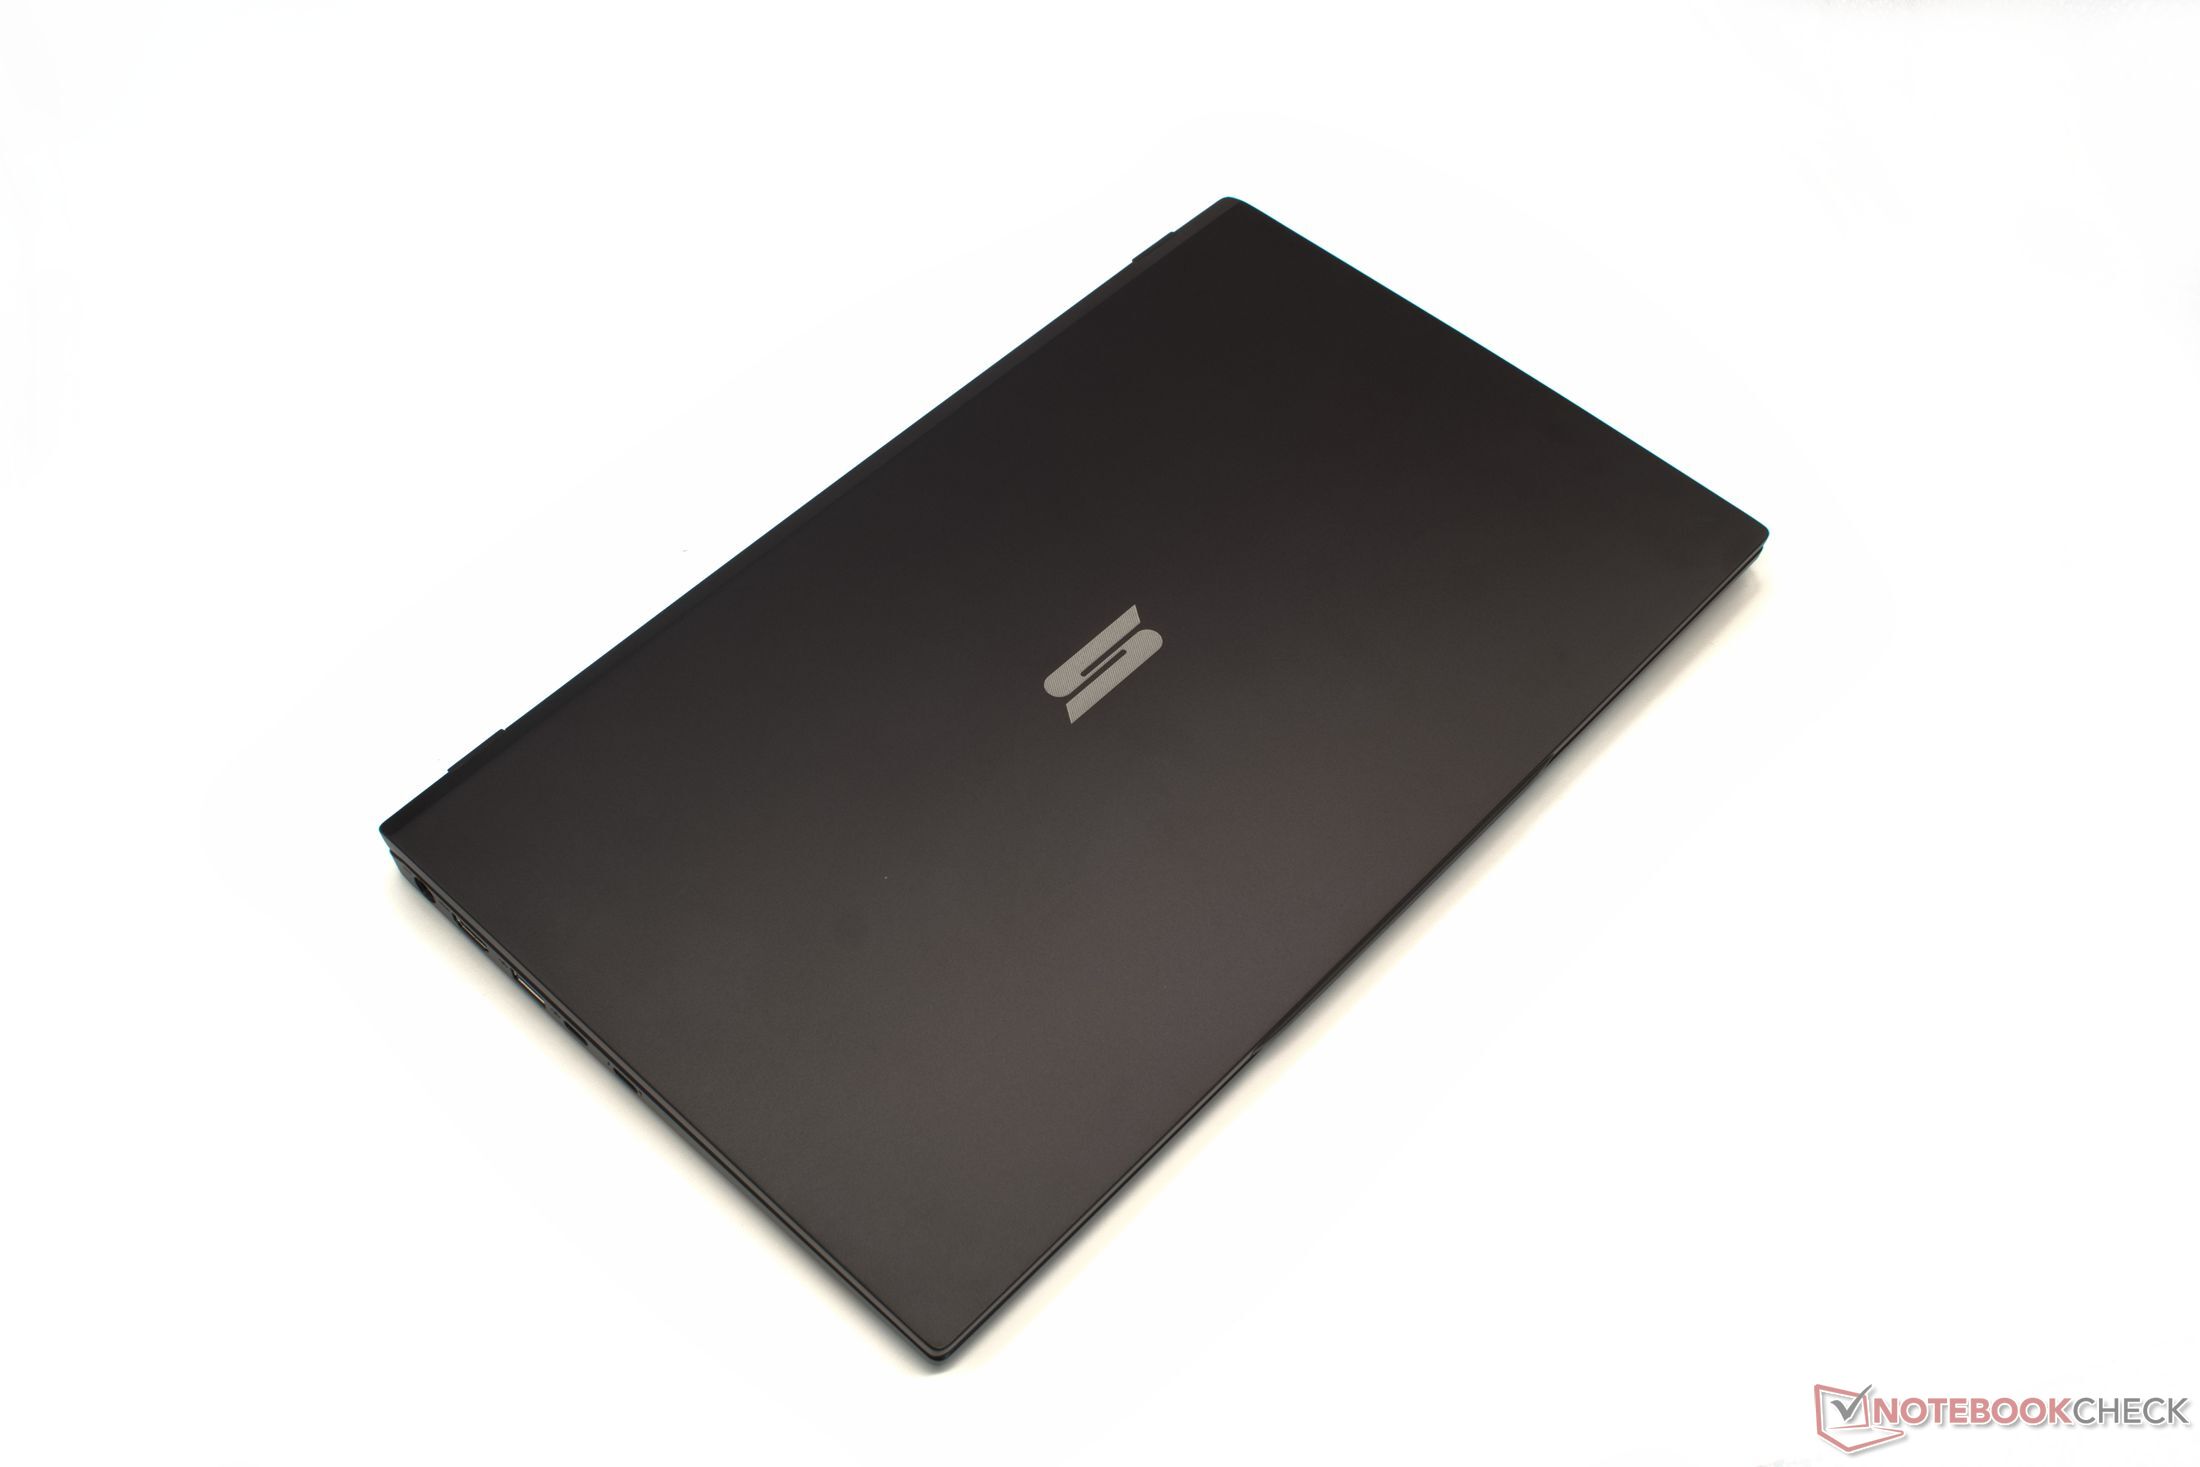
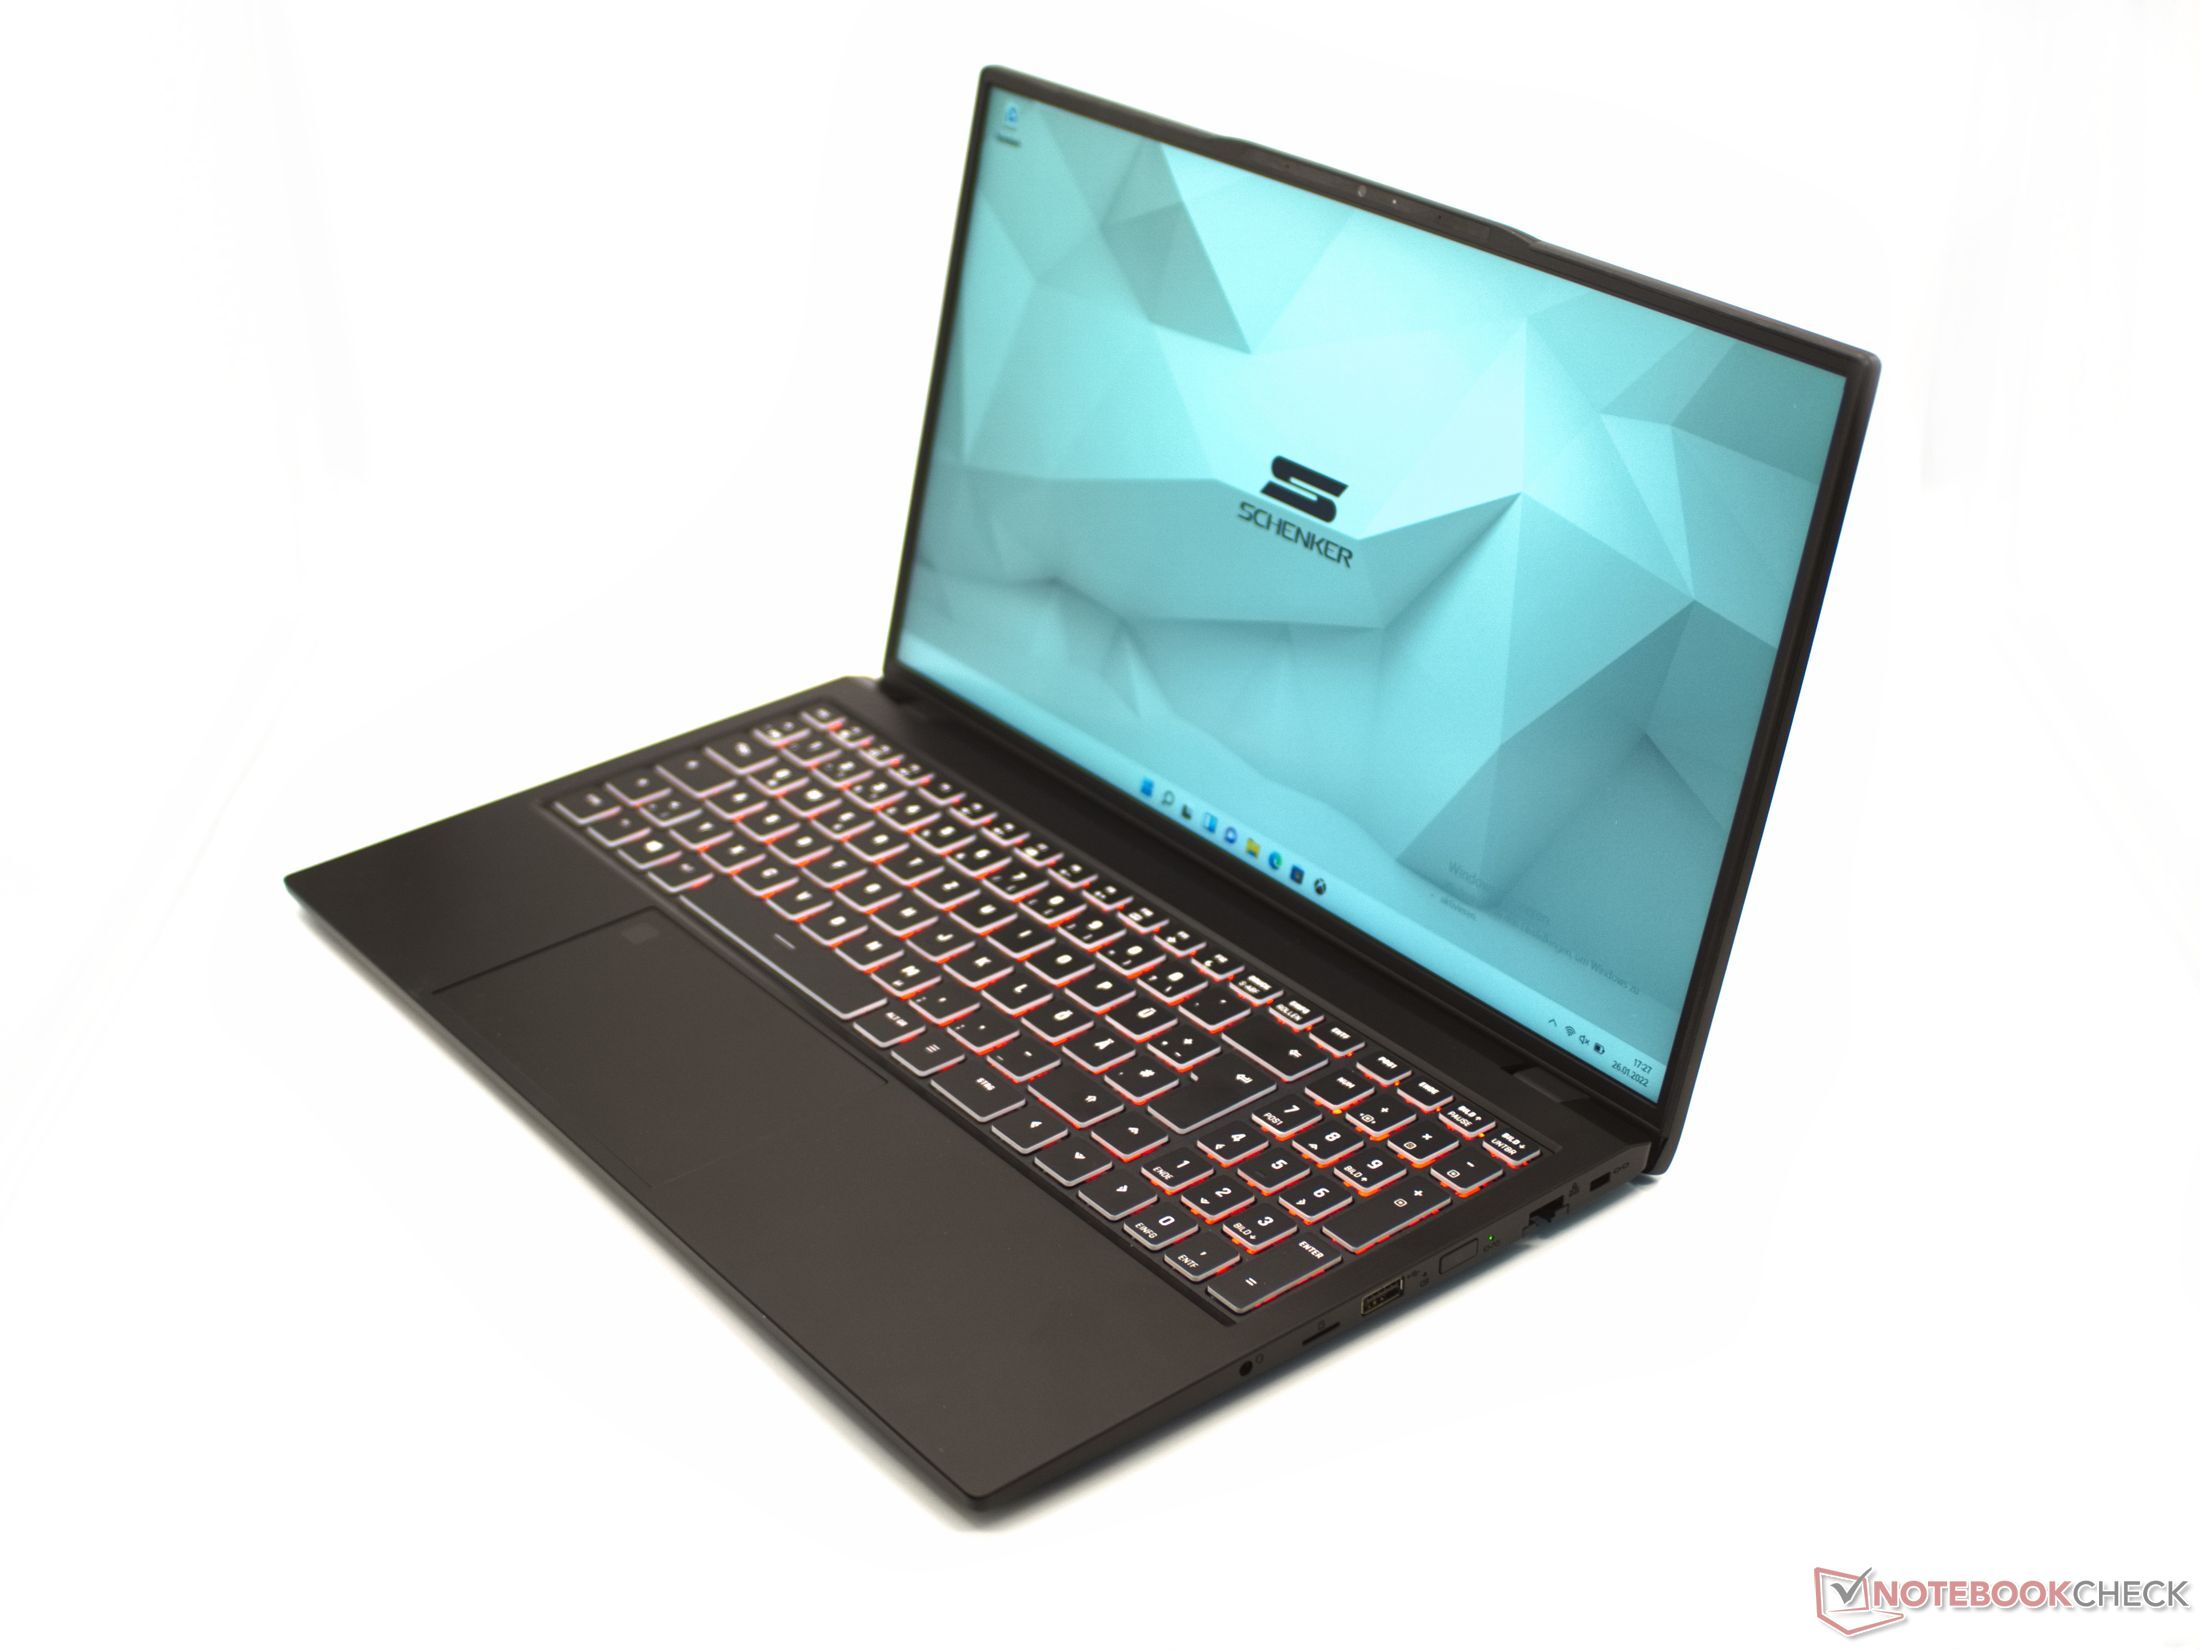
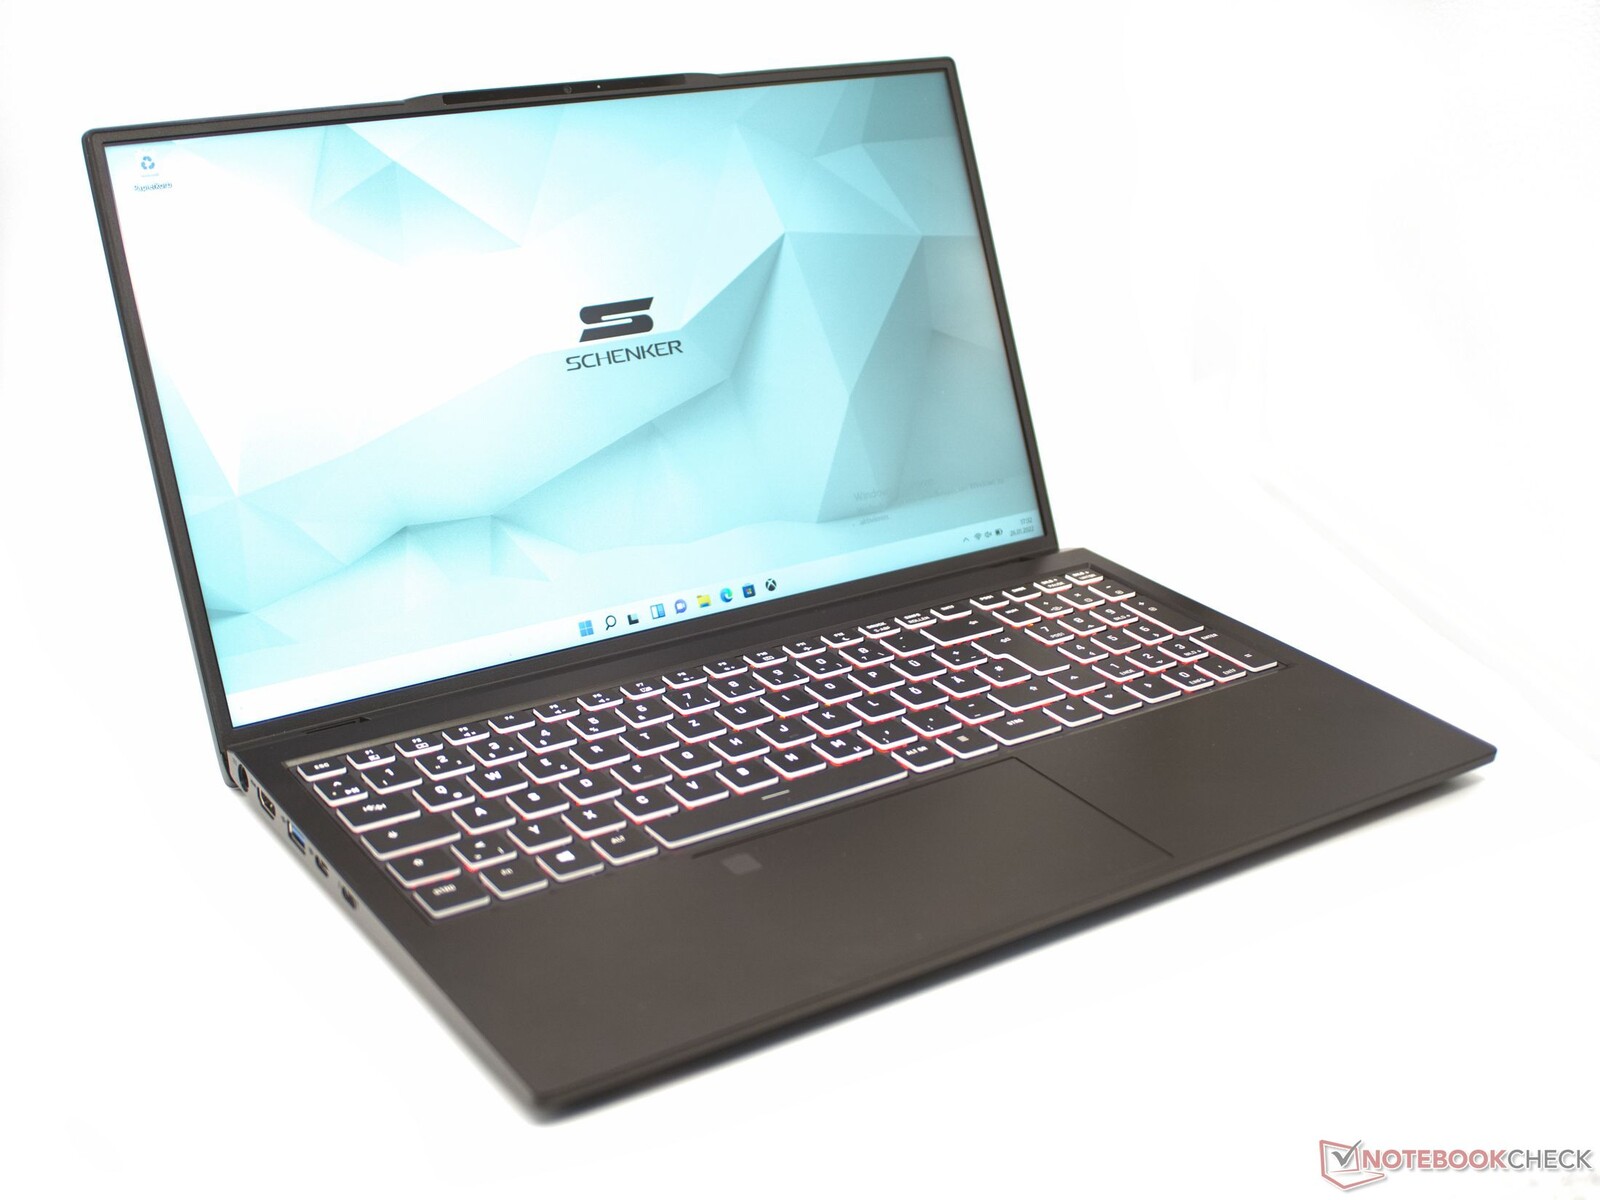
Estojo e equipamento: Estojo de alumínio e Thunderbolt 4
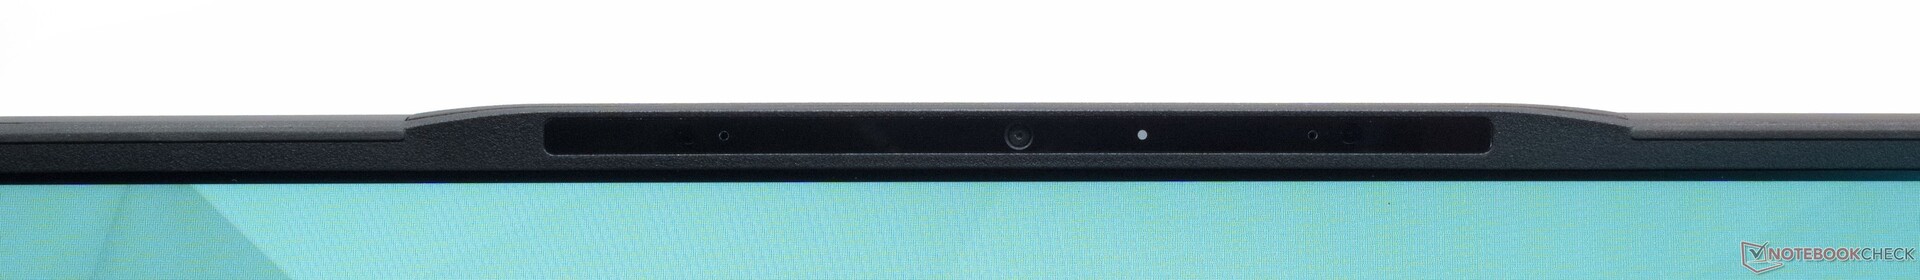
A caixa preta feita de metal e plástico é muito fina e ainda oferece alta conectividade. O display é rodeado por uma moldura de 6 mm de largura. A moldura é ampliada um pouco apenas para a webcam e os microfones. A superfície fosca não é suscetível a sujeira e oferece uma sensação agradável. Bordas claras e pequenos raios determinam o exterior do laptop. O design da Schenker é muito simples e parece de alta qualidade ao mesmo tempo. A parte inferior da base e a tampa do visor são feitas de metal, enquanto que a parte superior da base é feita de plástico.
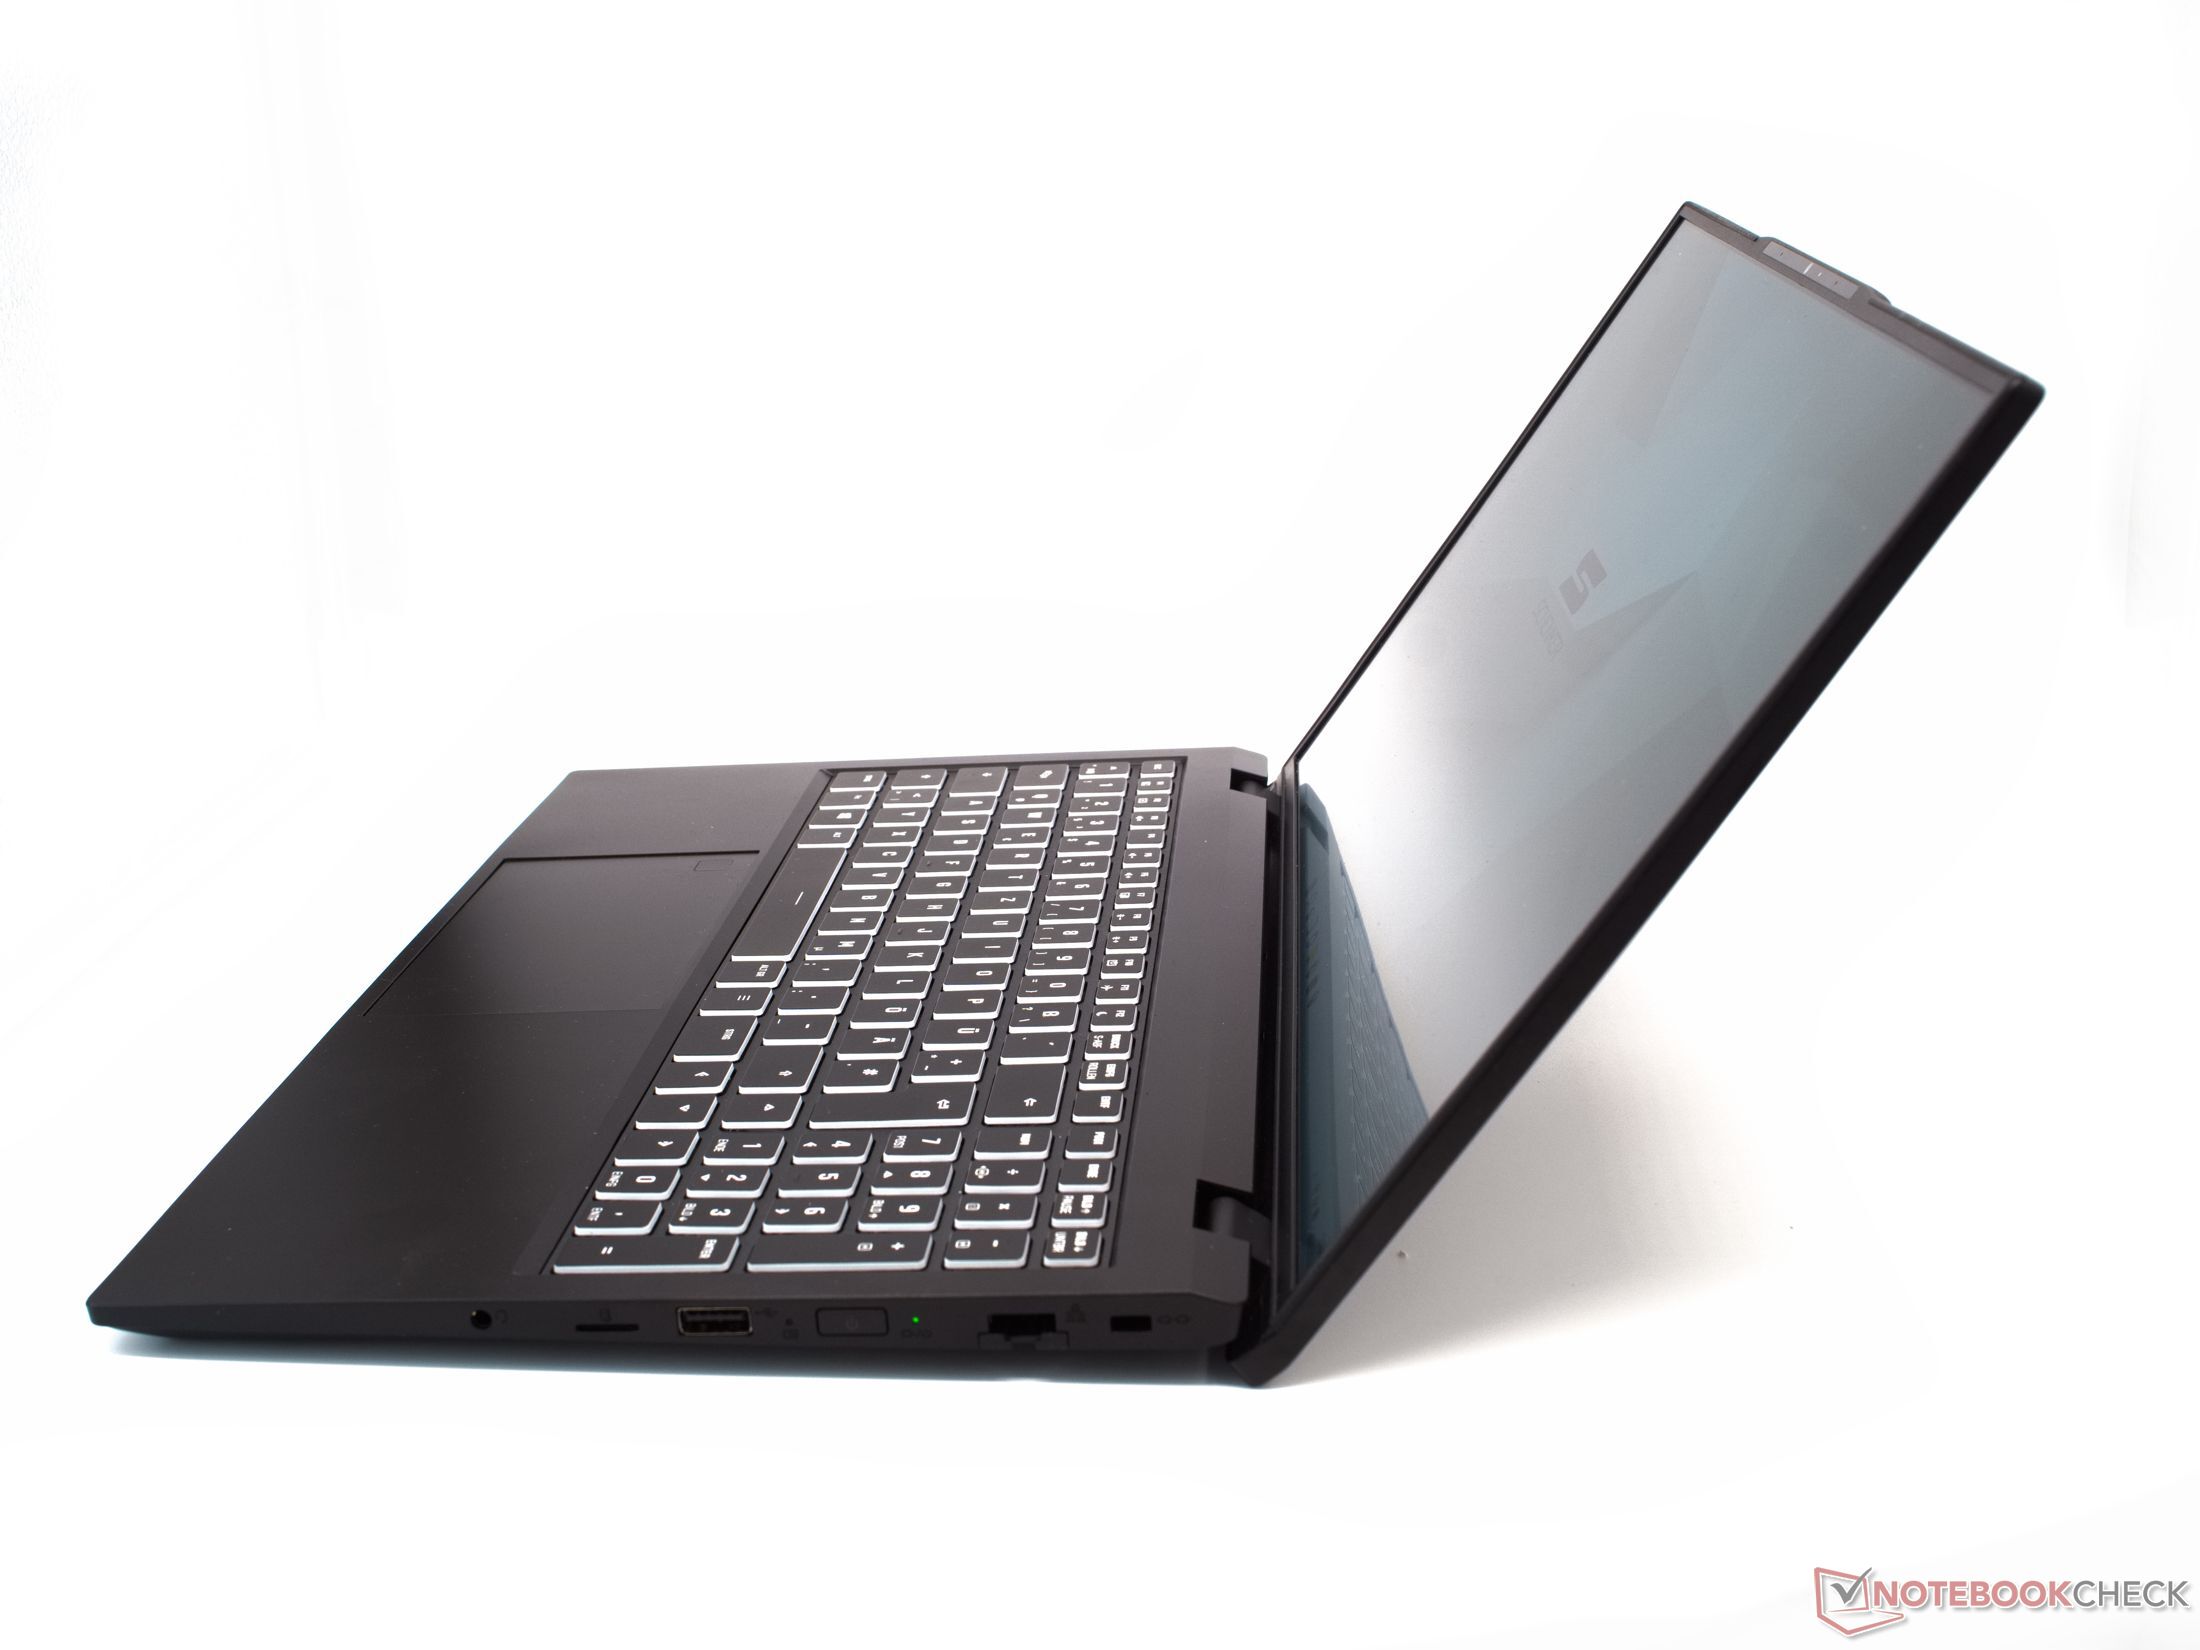
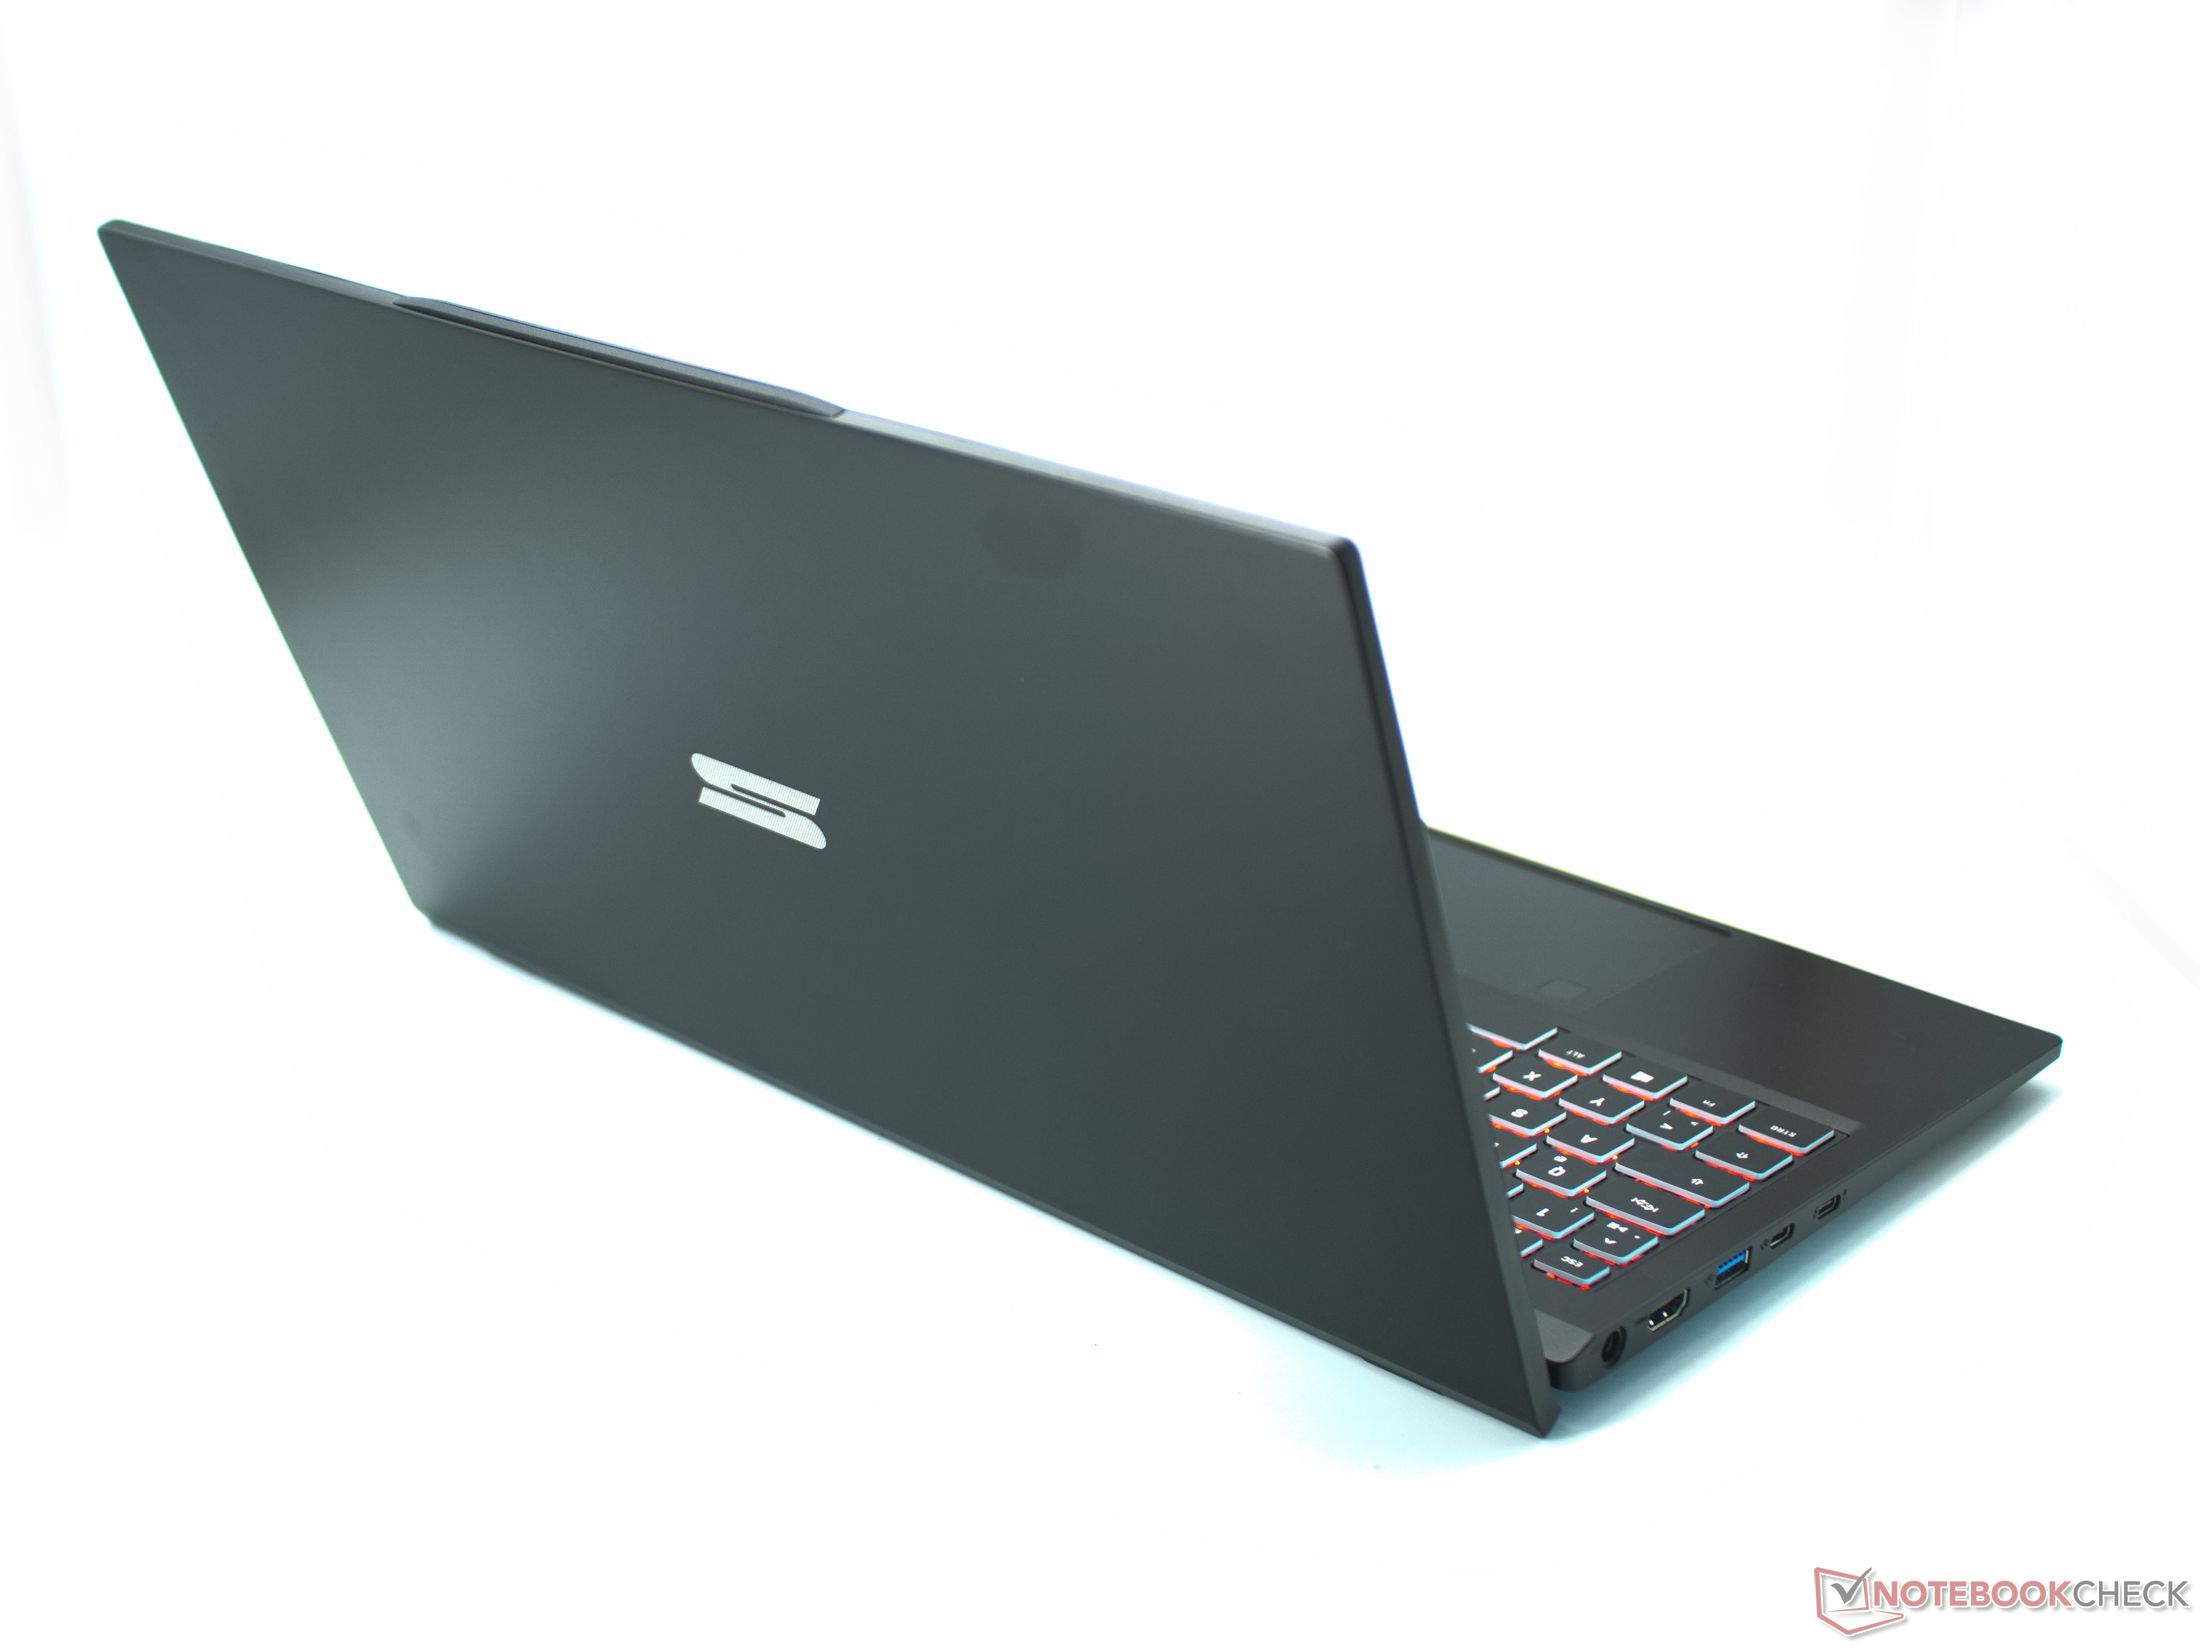

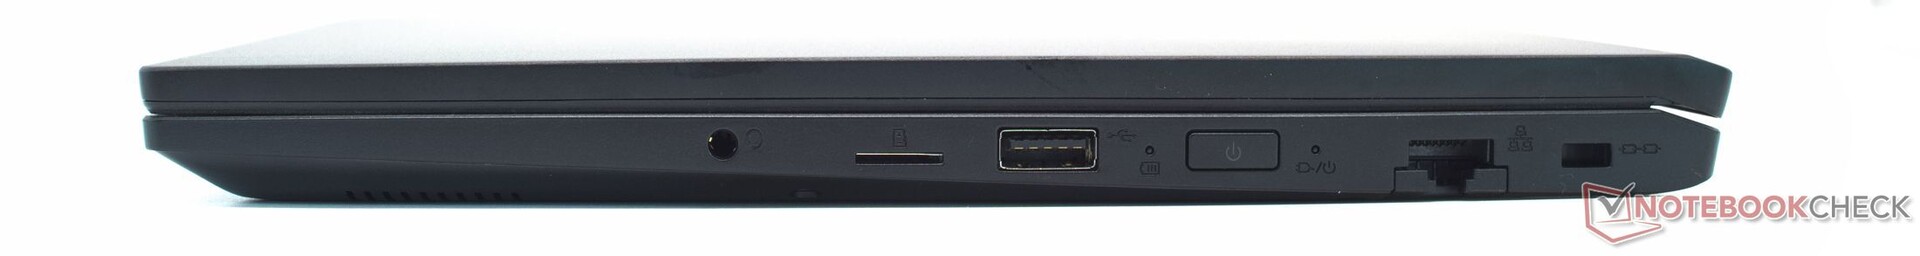
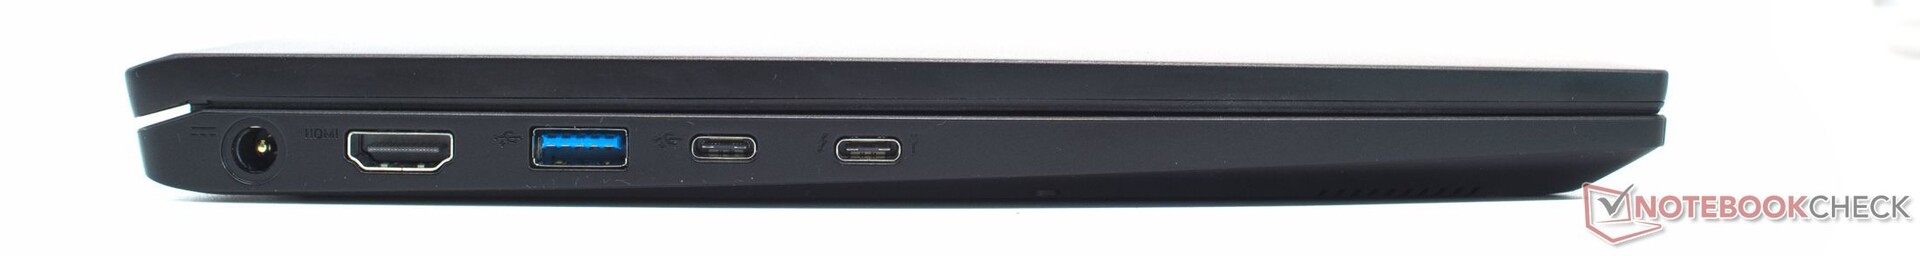
A Schenker Work 15 oferece uma ampla gama de opções de conectividade. O leitor de cartões microSD e Wi-Fi 6 funcionam com uma velocidade esperada de alta. Graças ao Thunderbolt 4 e PowerDelivery, ambas as portas USB-C oferecem a gama completa de funções. HDMI e Gigabit LAN também estão disponíveis. Para segurança, os recursos de segurança do Intel Core i7-11370H estão disponíveis junto com o sensor de impressão digital e o slot de trava Kensington. A webcam mostra a típica baixa qualidade das webcams de laptop.
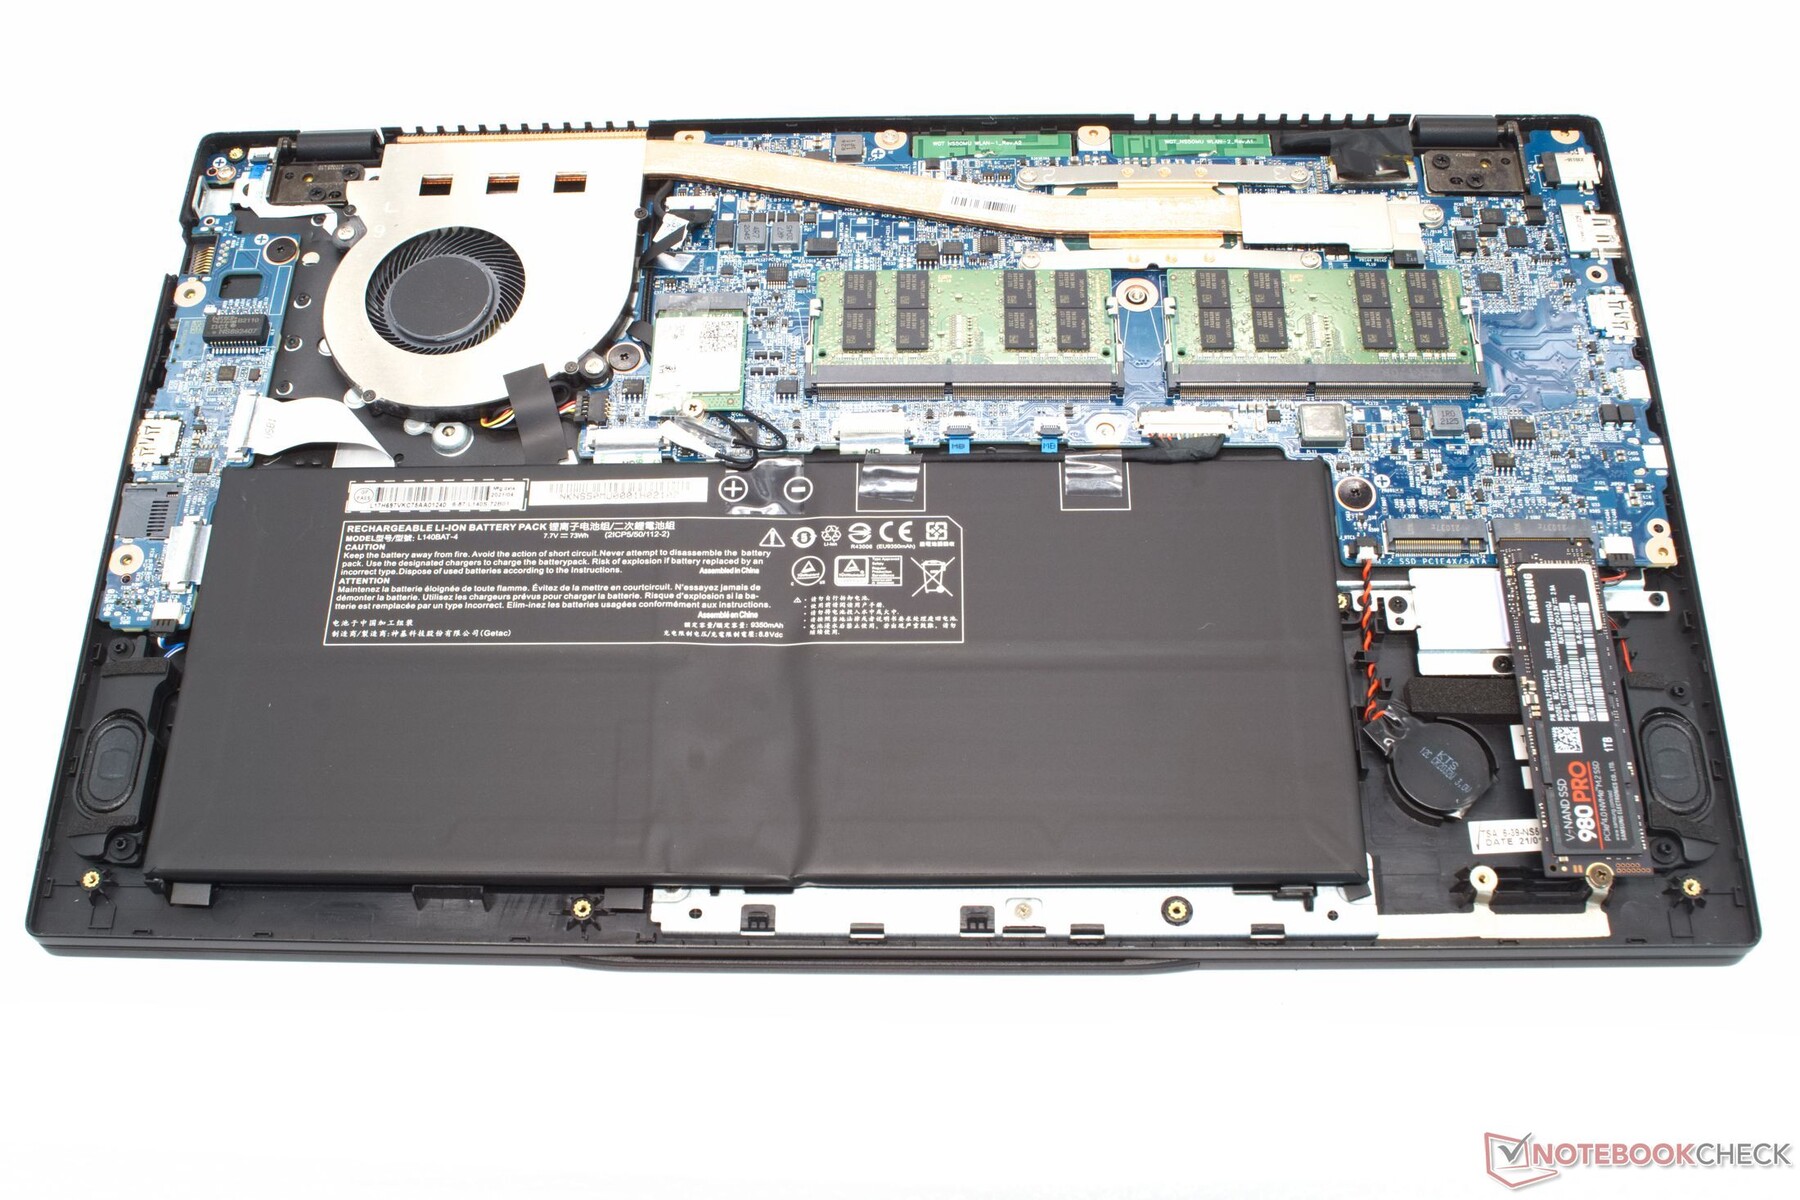
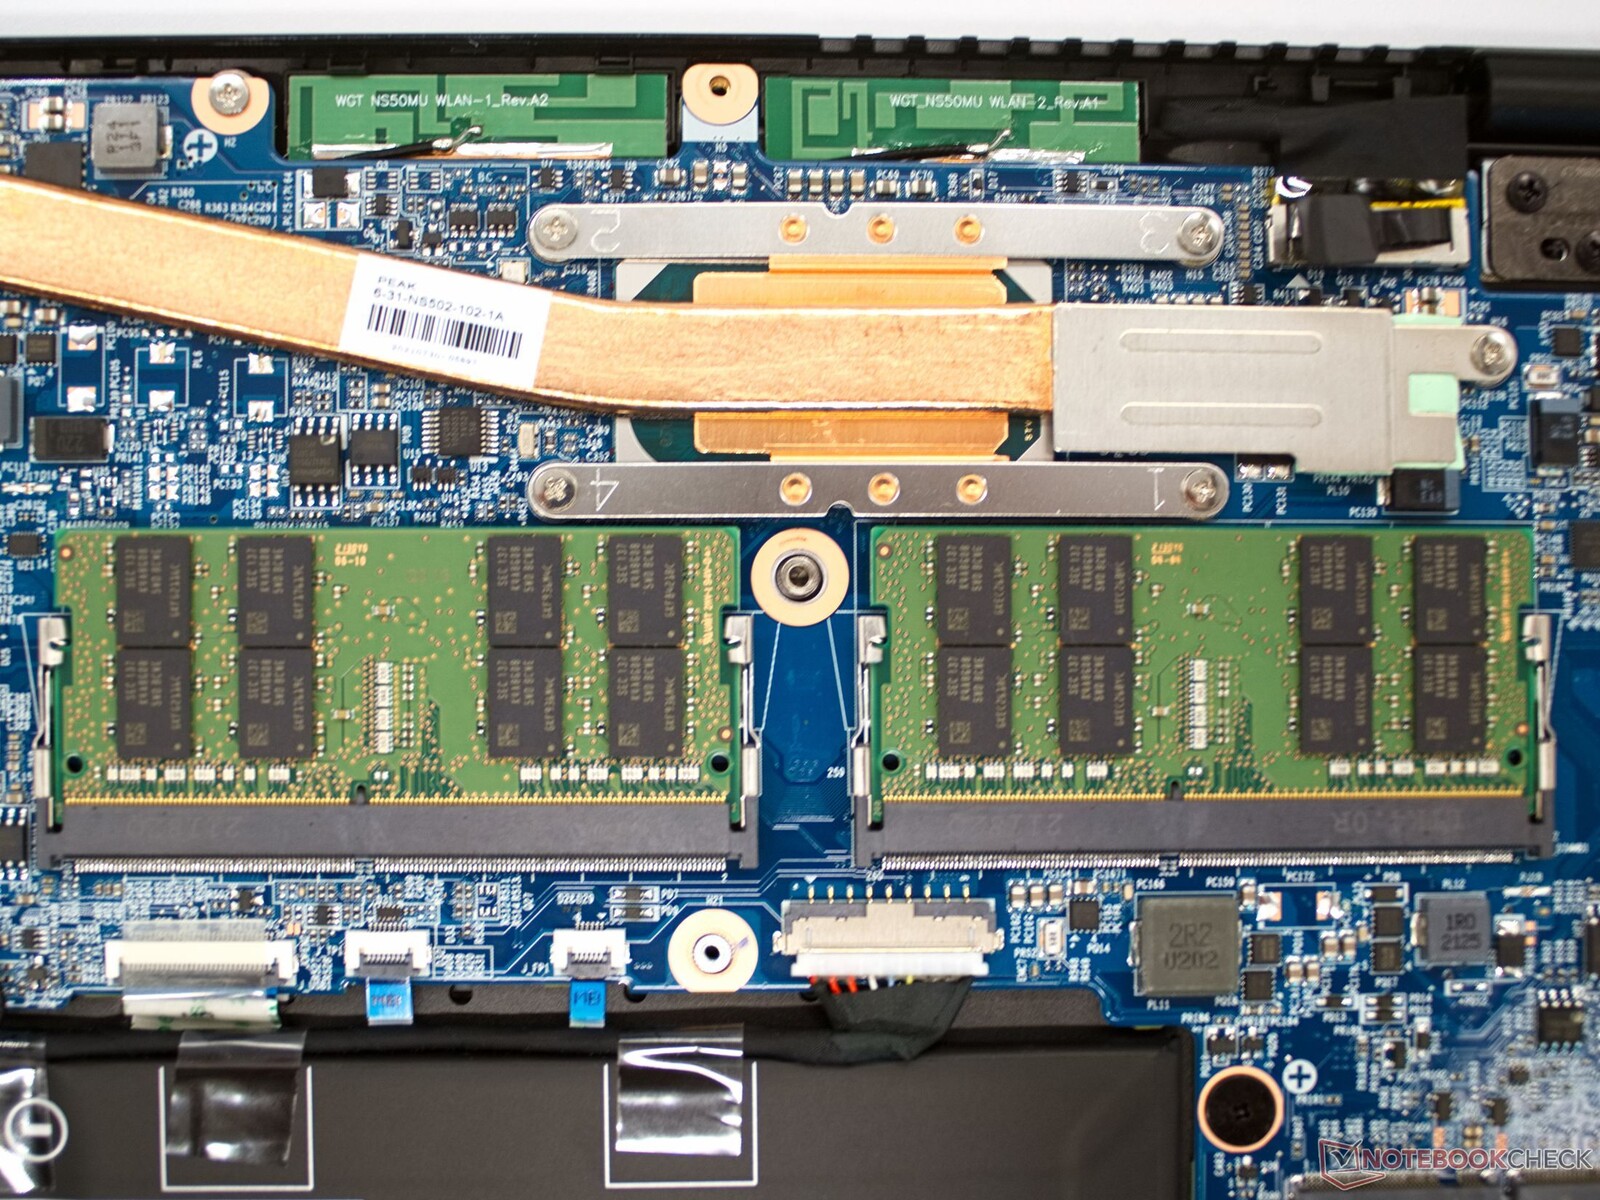
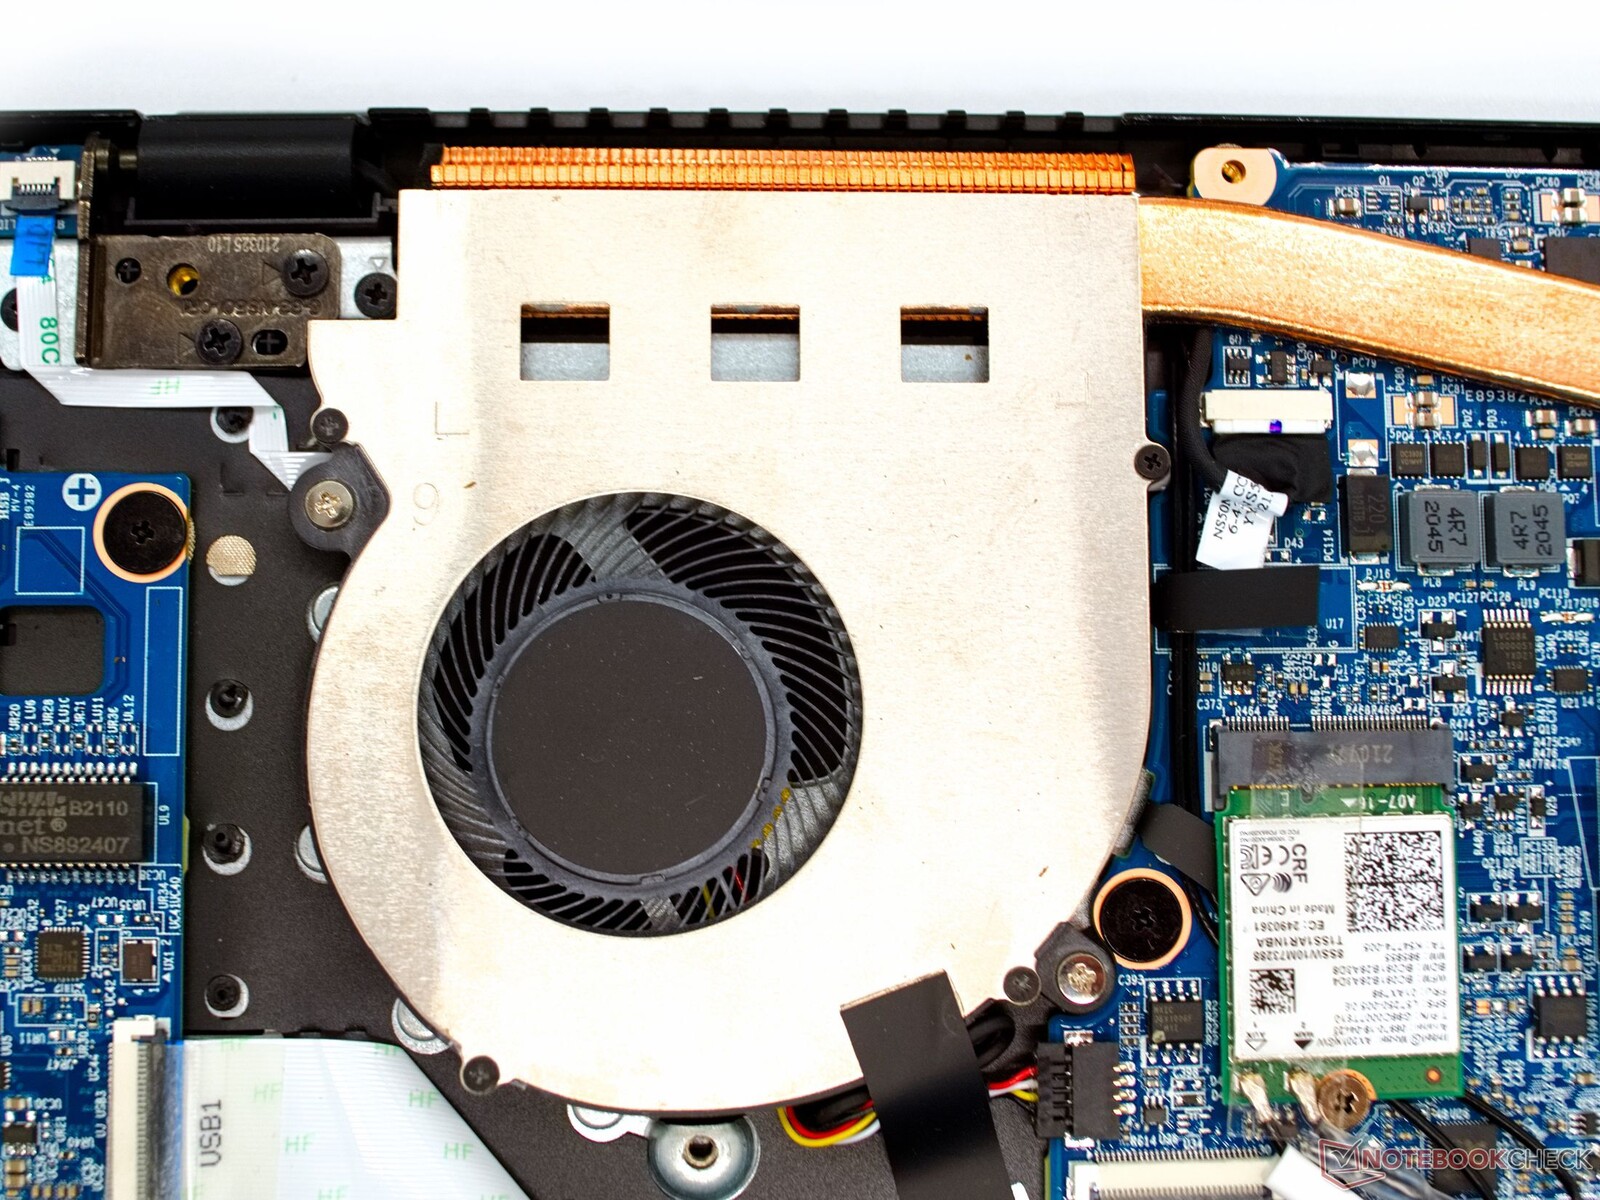
A tampa da caixa no fundo é mantida no lugar por muitos parafusos, mas uma vez removida, a amostra de revisão é fácil de abrir. Abaixo estão a memória de trabalho atualizável e um slot M.2 livre para outro SSD
| SD Card Reader | |
| average JPG Copy Test (av. of 3 runs) | |
| LG Gram 15Z90P-G.AA89G (AV Pro SD microSD 128 GB V60) | |
| HP Pavilion x360 15-er0155ng (AV PRO microSD 128 GB V60) | |
| Schenker Work 15 Tiger Lake-H (Angelbird AV Pro V60) | |
| Média da turma Office (19.8 - 198.5, n=22, últimos 2 anos) | |
| Asus VivoBook S15 D533UA (AV PRO microSD 128 GB V60) | |
| Dell Inspiron 15 3501 (AV Pro SD 128 GB V60) | |
| maximum AS SSD Seq Read Test (1GB) | |
| LG Gram 15Z90P-G.AA89G (AV Pro SD microSD 128 GB V60) | |
| HP Pavilion x360 15-er0155ng (AV PRO microSD 128 GB V60) | |
| Média da turma Office (27.4 - 249, n=21, últimos 2 anos) | |
| Schenker Work 15 Tiger Lake-H (Angelbird AV Pro V60) | |
| Asus VivoBook S15 D533UA (AV PRO microSD 128 GB V60) | |
| Dell Inspiron 15 3501 (AV Pro SD microSD 128 GB V60) | |


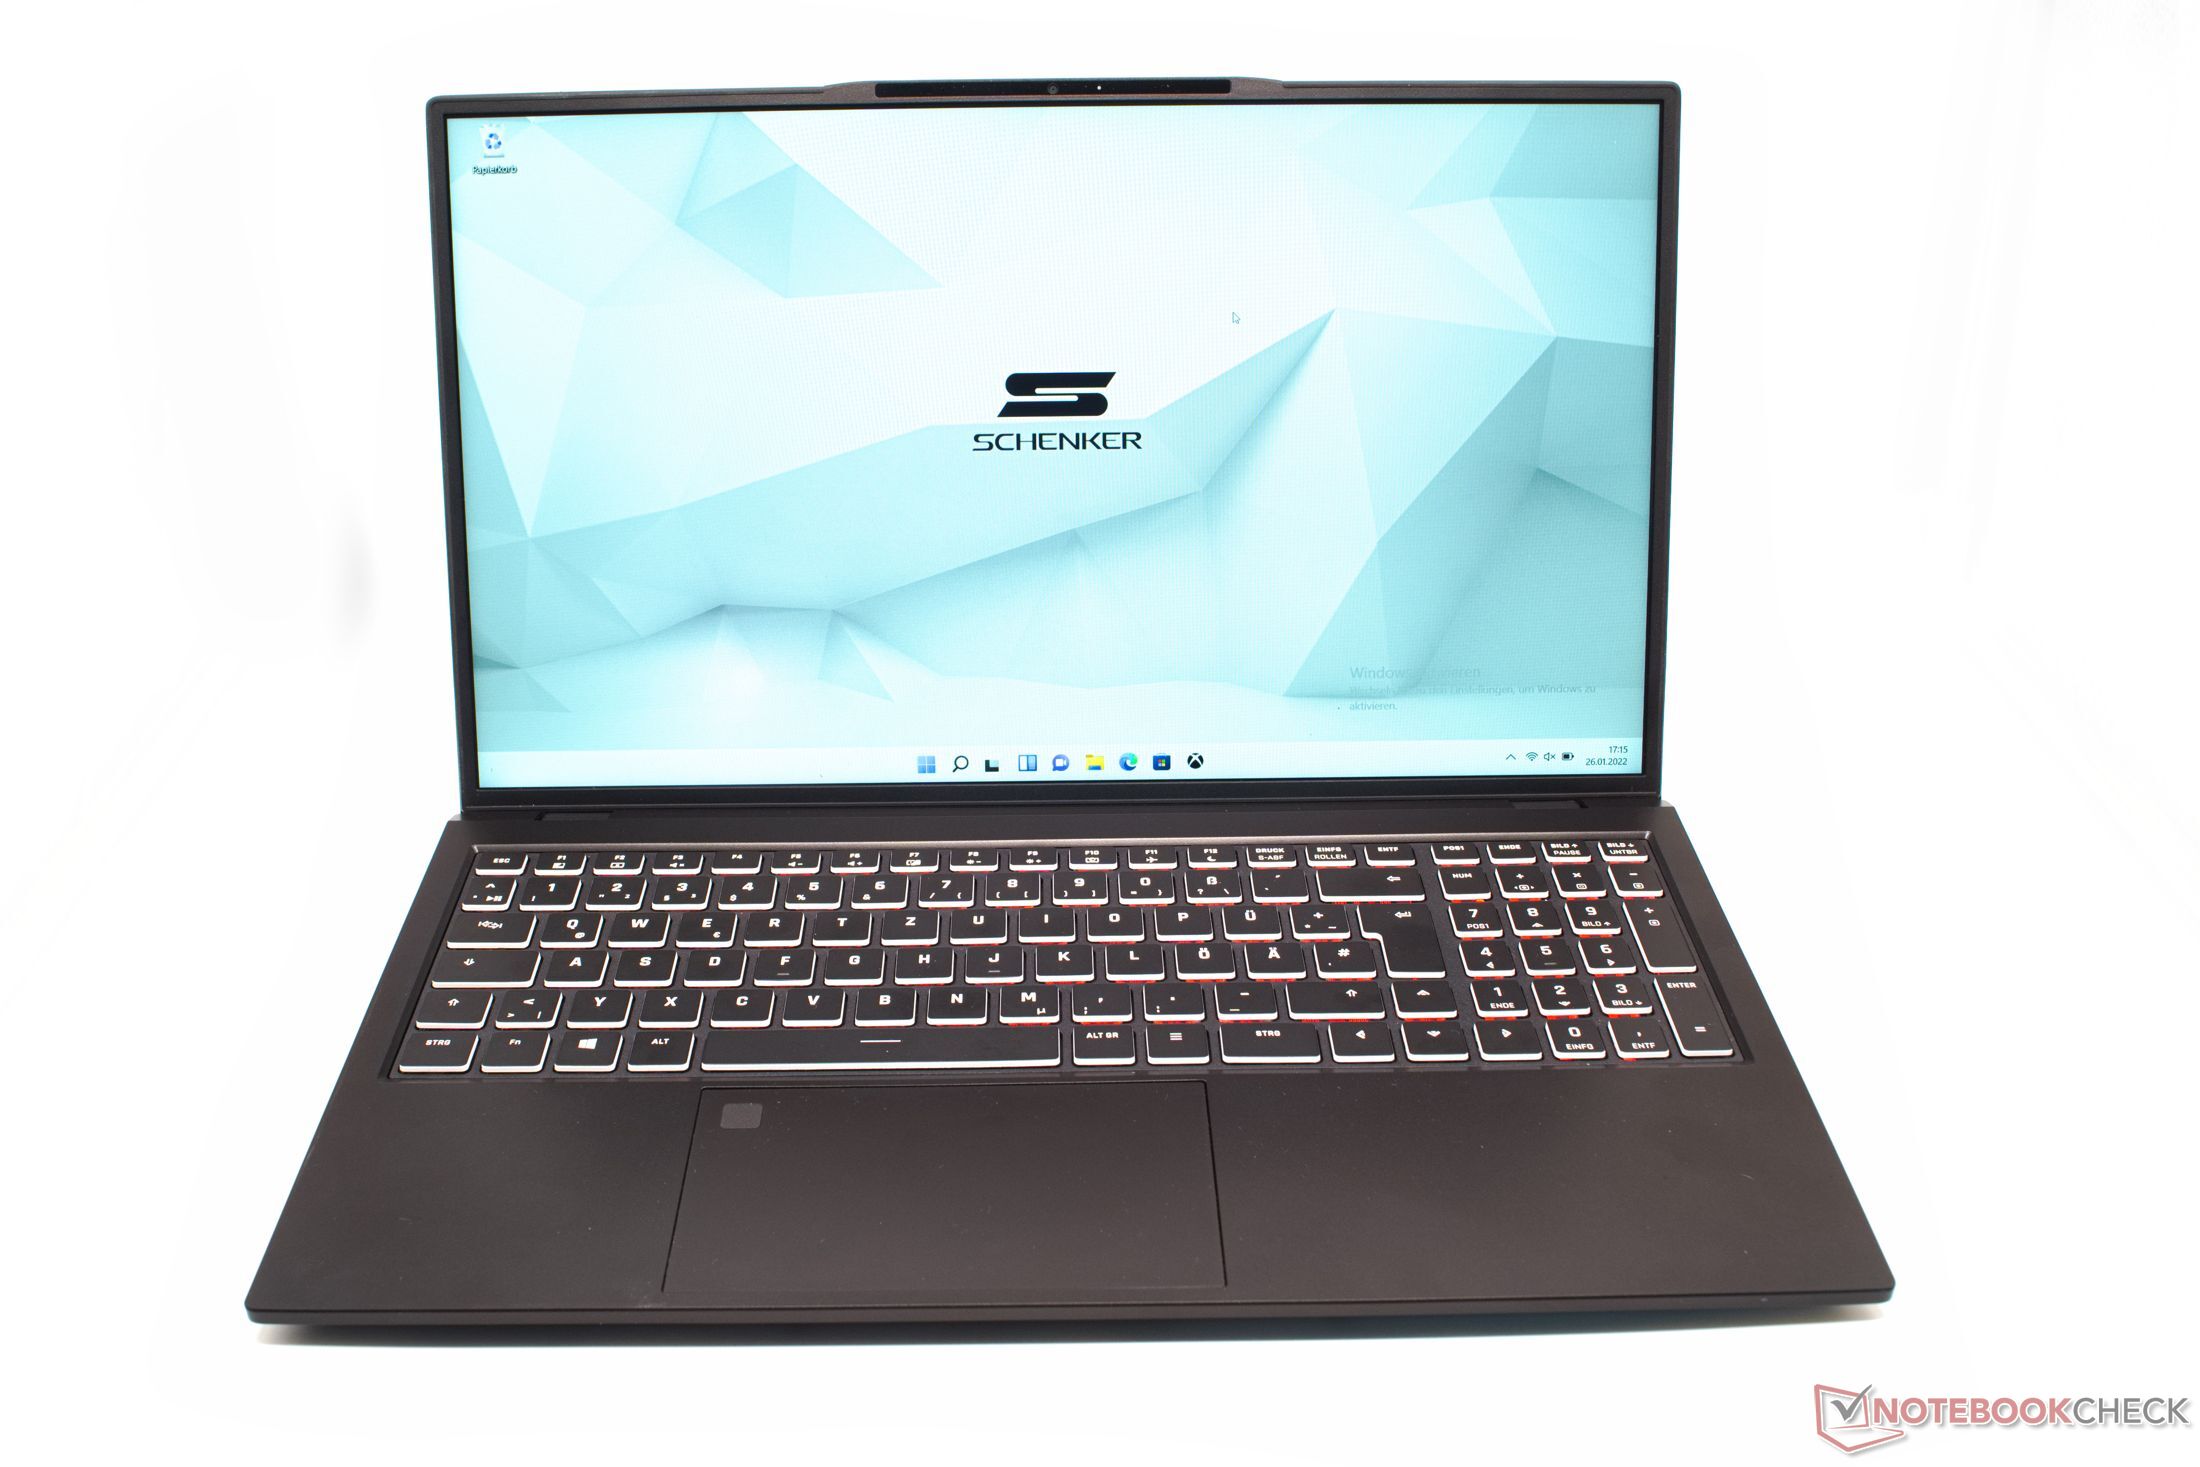
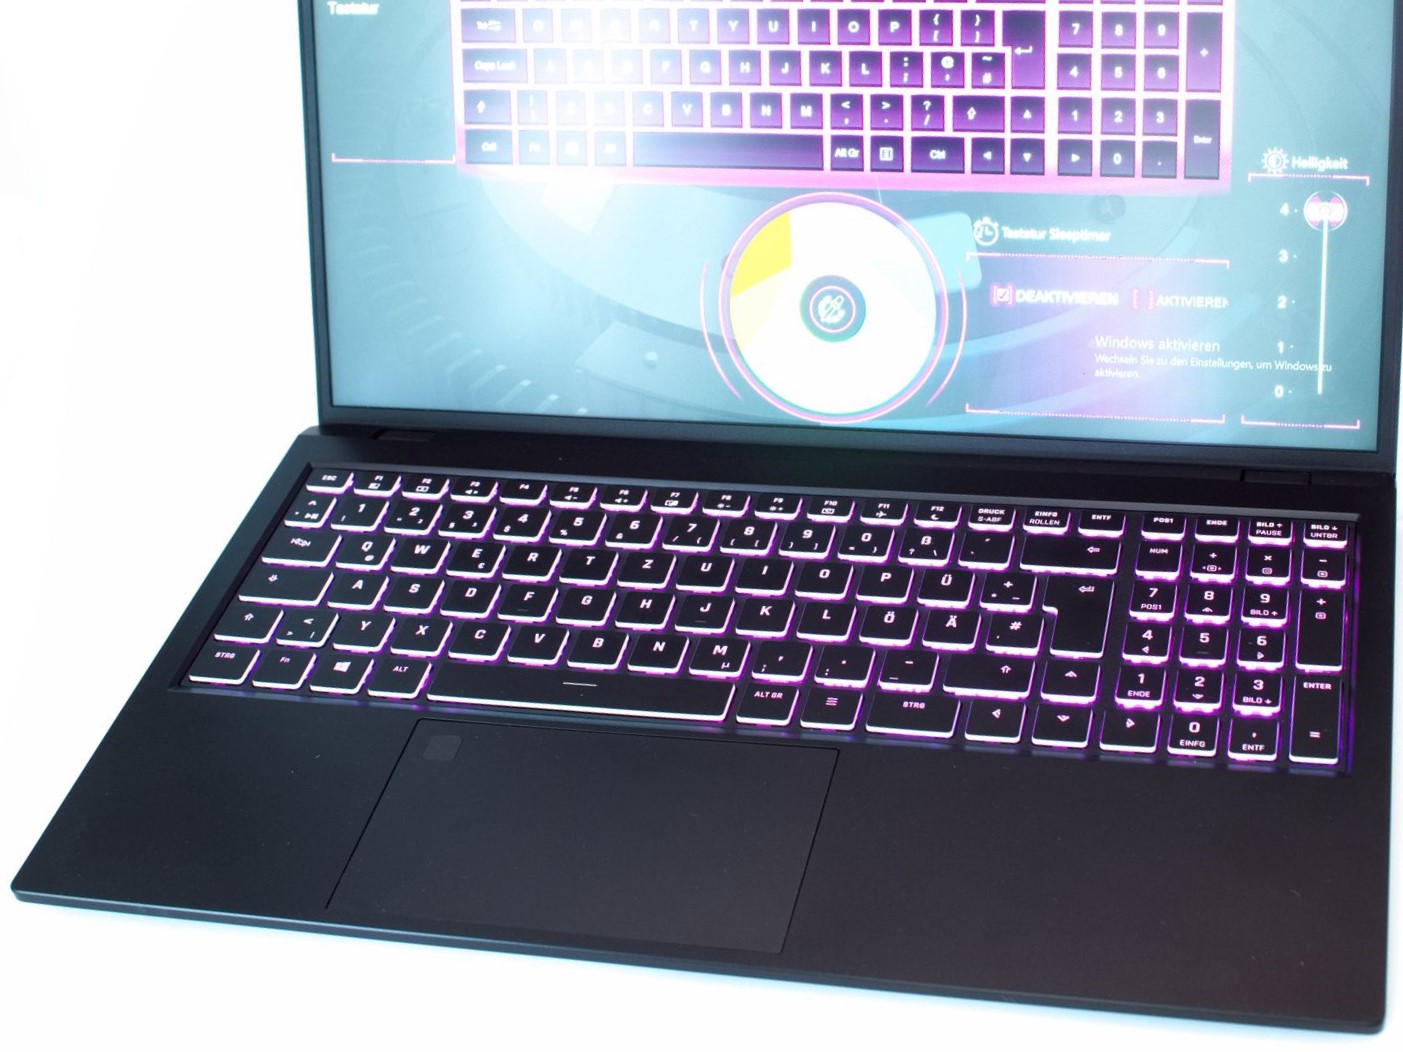
Dispositivos de entrada: Com luz RGB
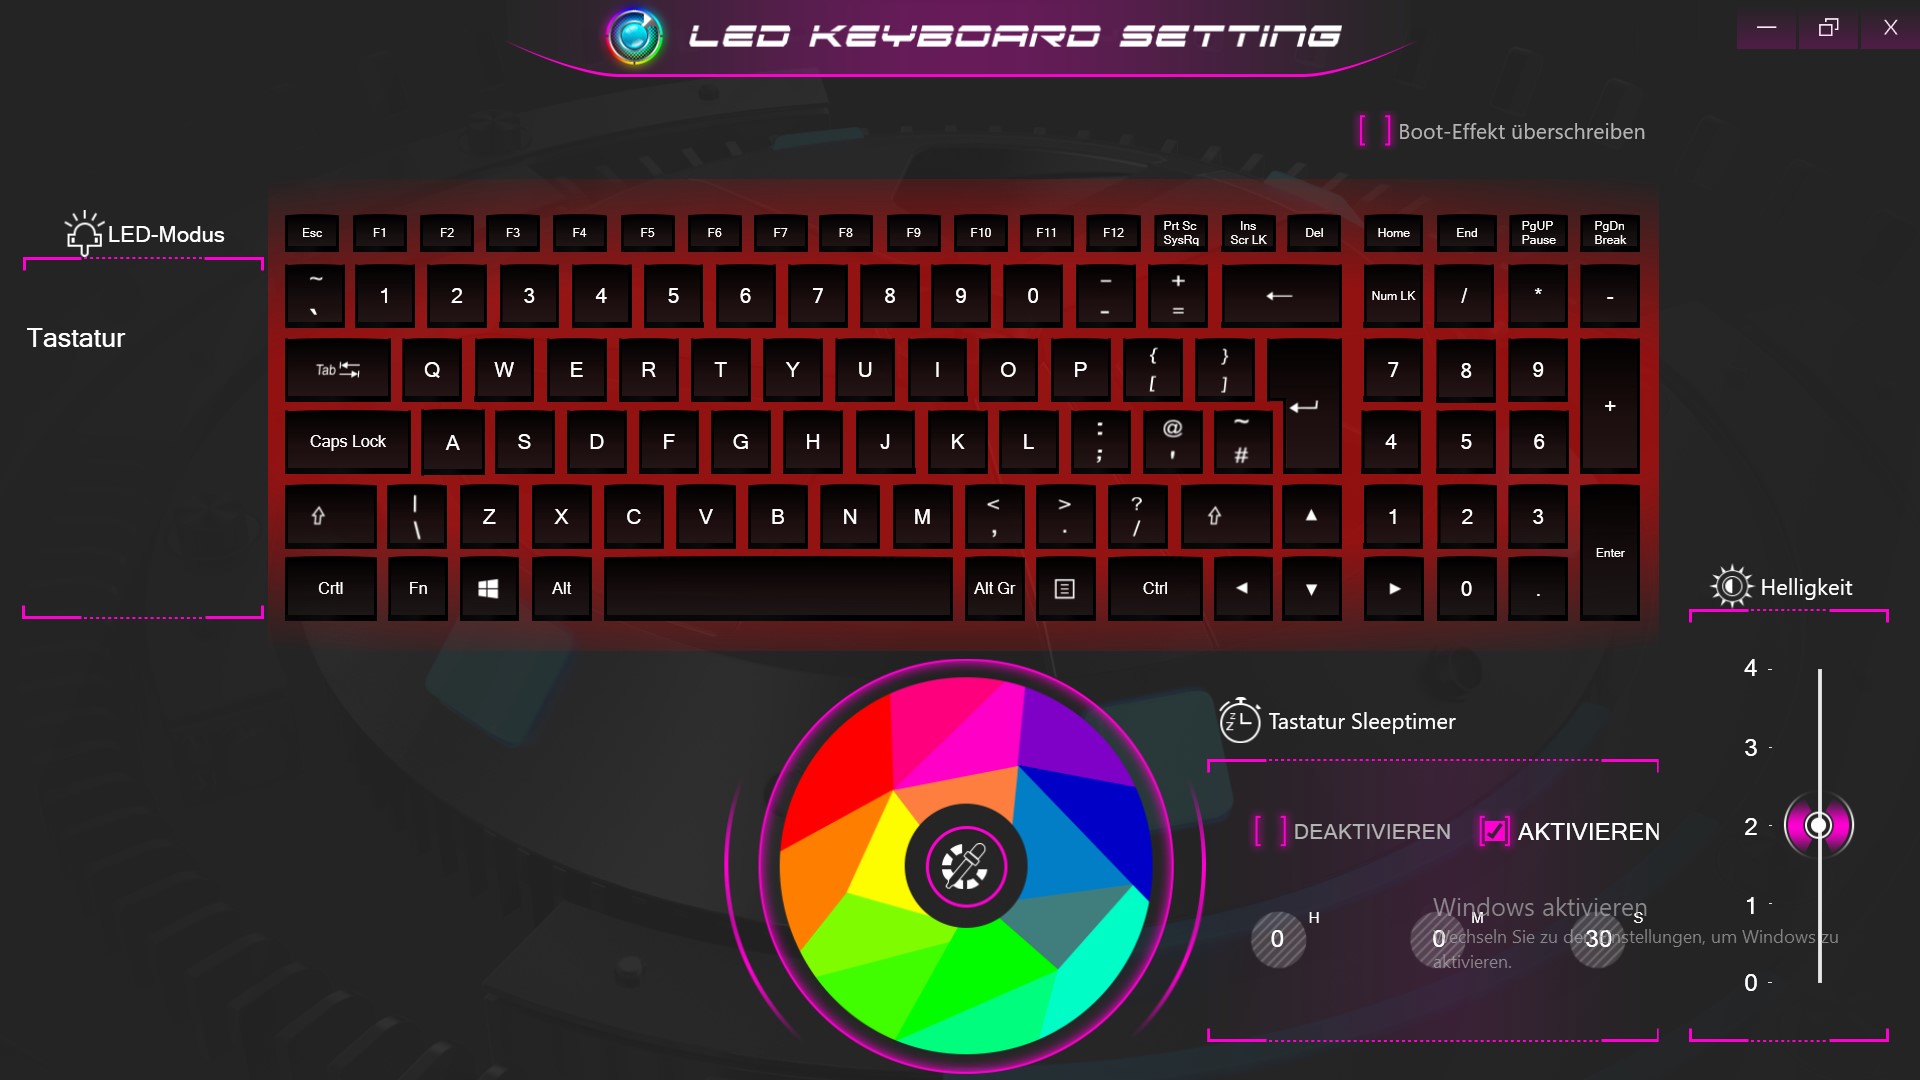
Teclas grandes com deslocamento adequado das teclas e bom feedback táctil dão ao teclado do Schenker Work 15 uma sensação agradável enquanto digita. A luz de fundo RGB parece um pouco incomum no início, mas pelo menos você pode ajustar a iluminação conforme a necessidade.
O touchpad de 12 cm × 7 cm tem uma superfície de deslizamento suave e fornece entradas precisas. Um sensor de impressão digital é integrado no canto superior esquerdo do clickpad.
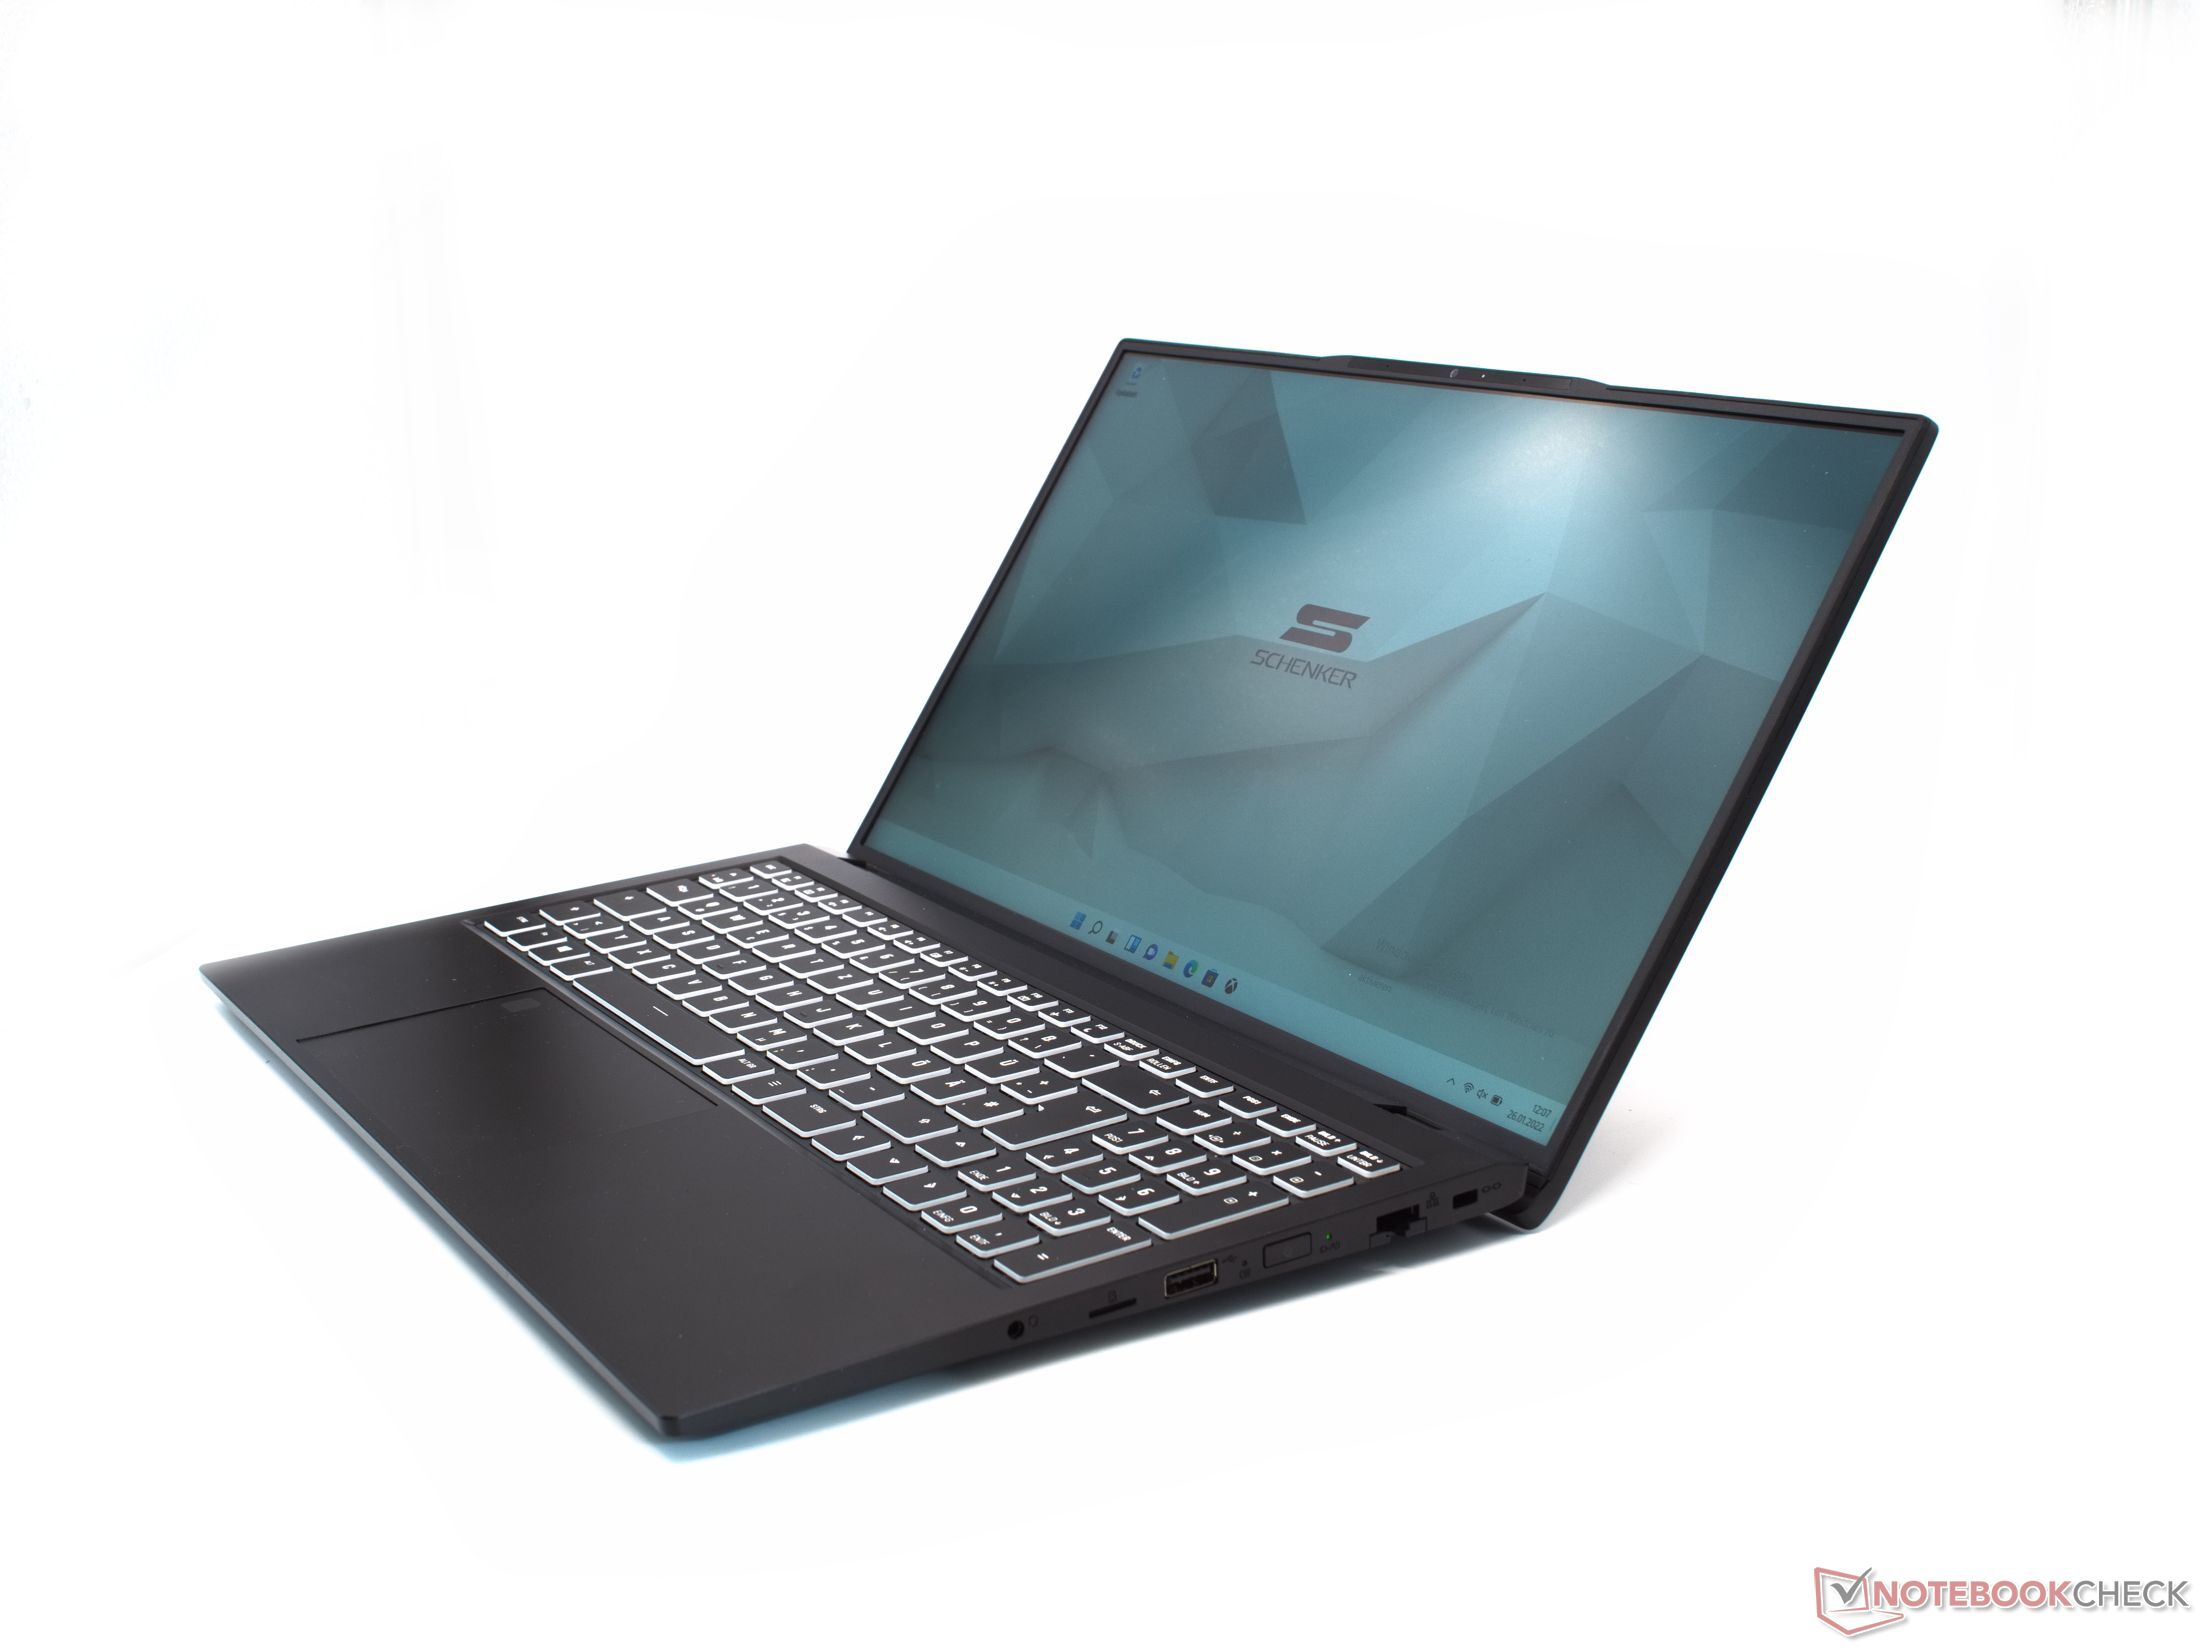
Mostrar: Trabalho 15 com painel IPS fosco
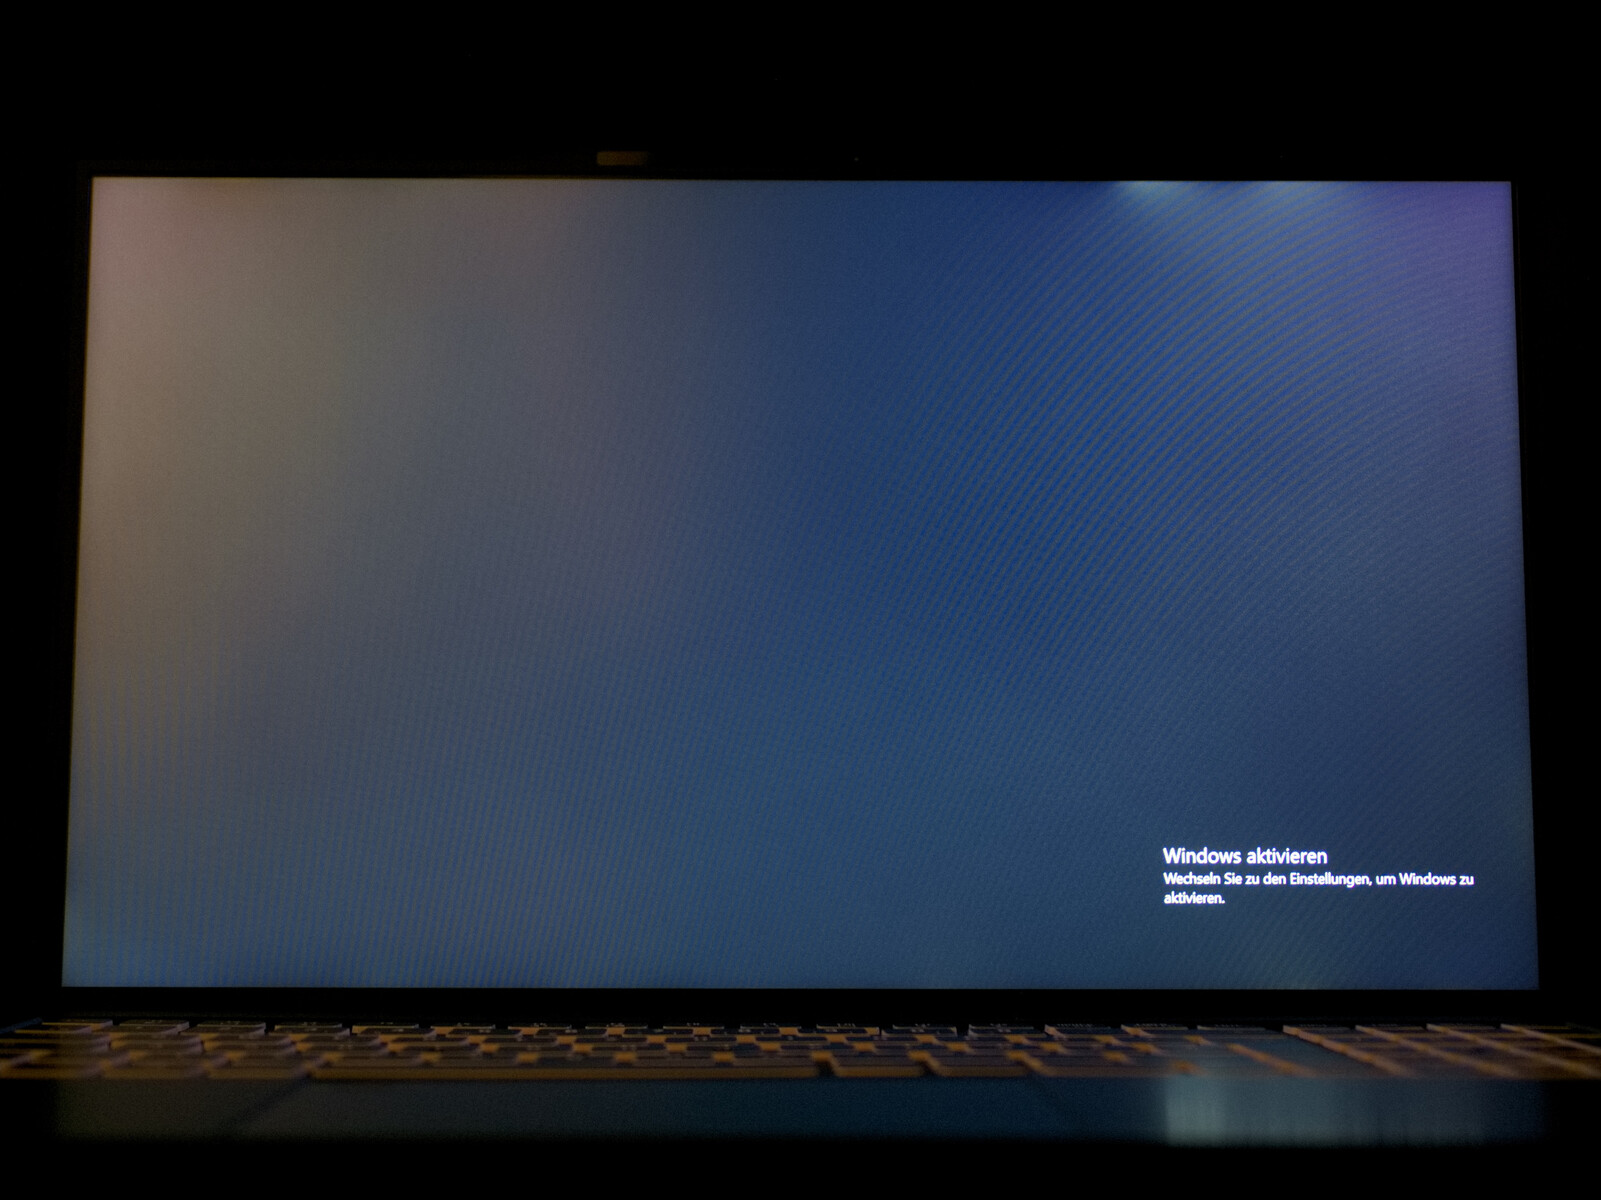
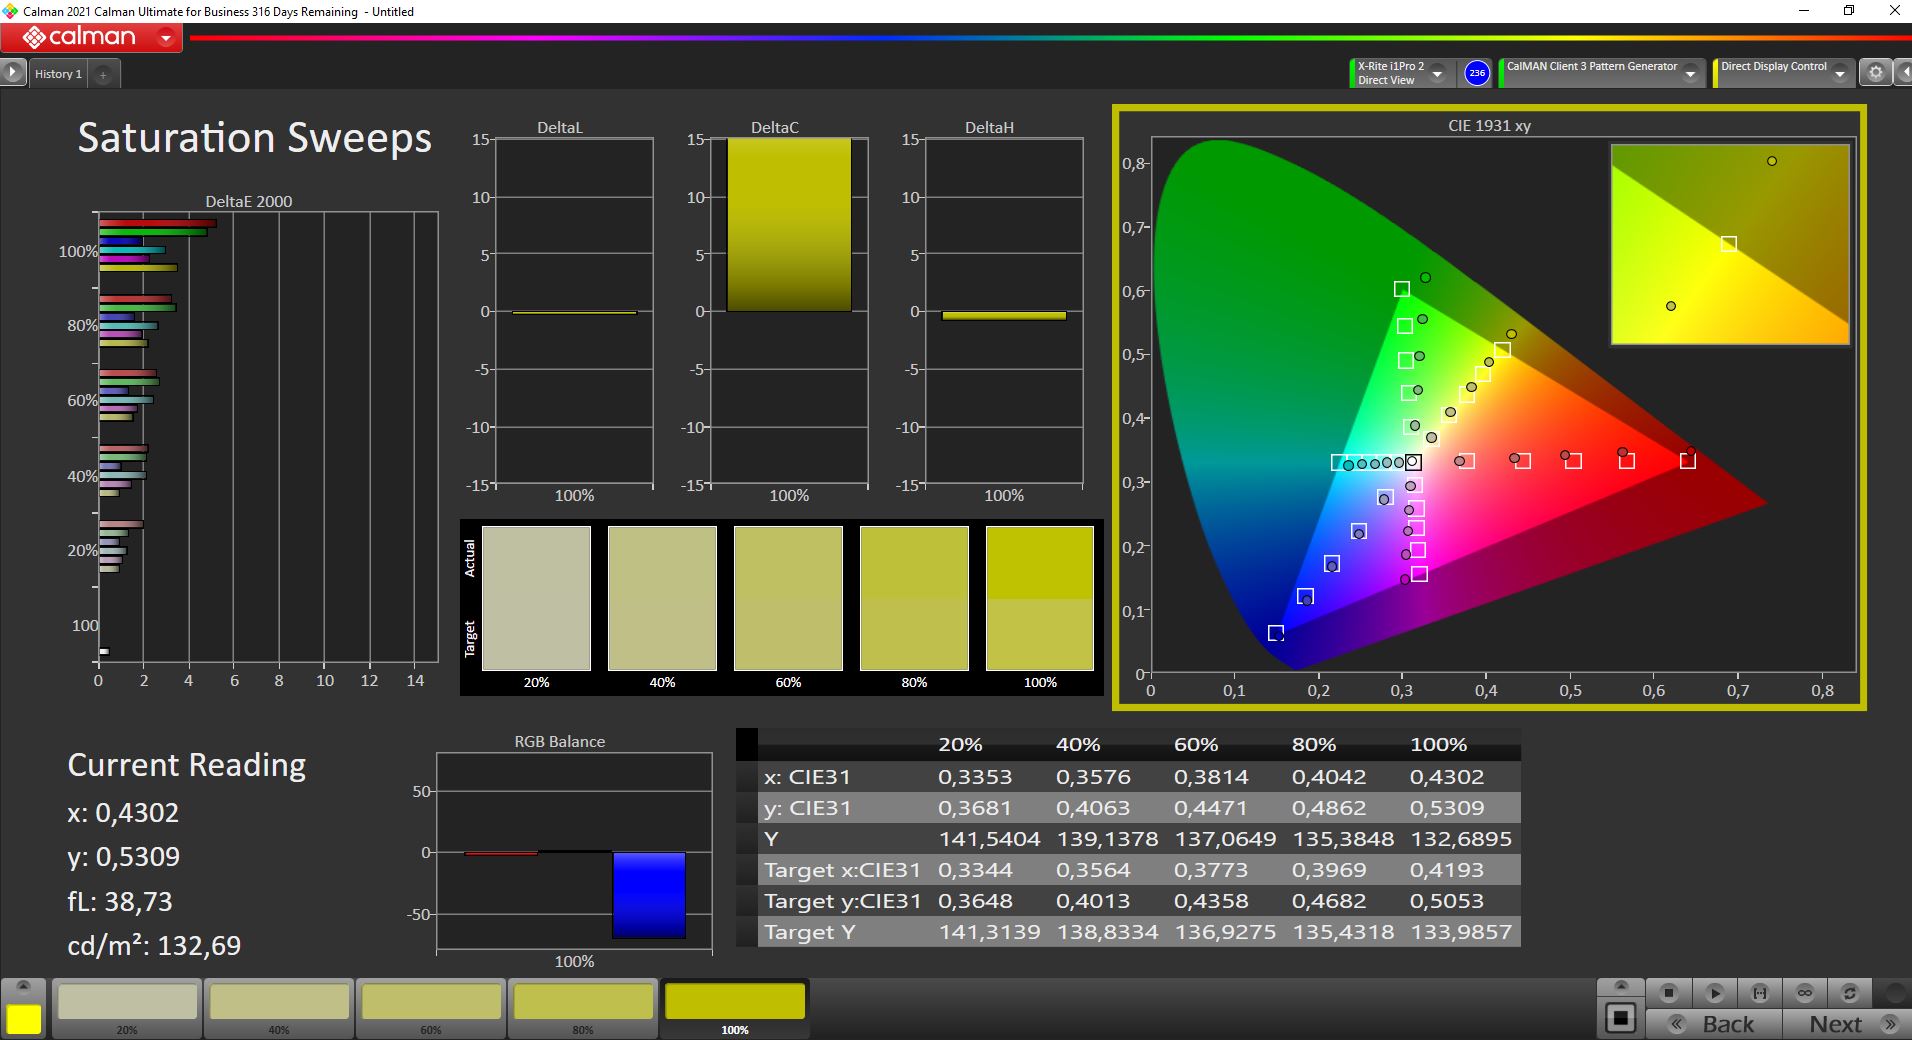
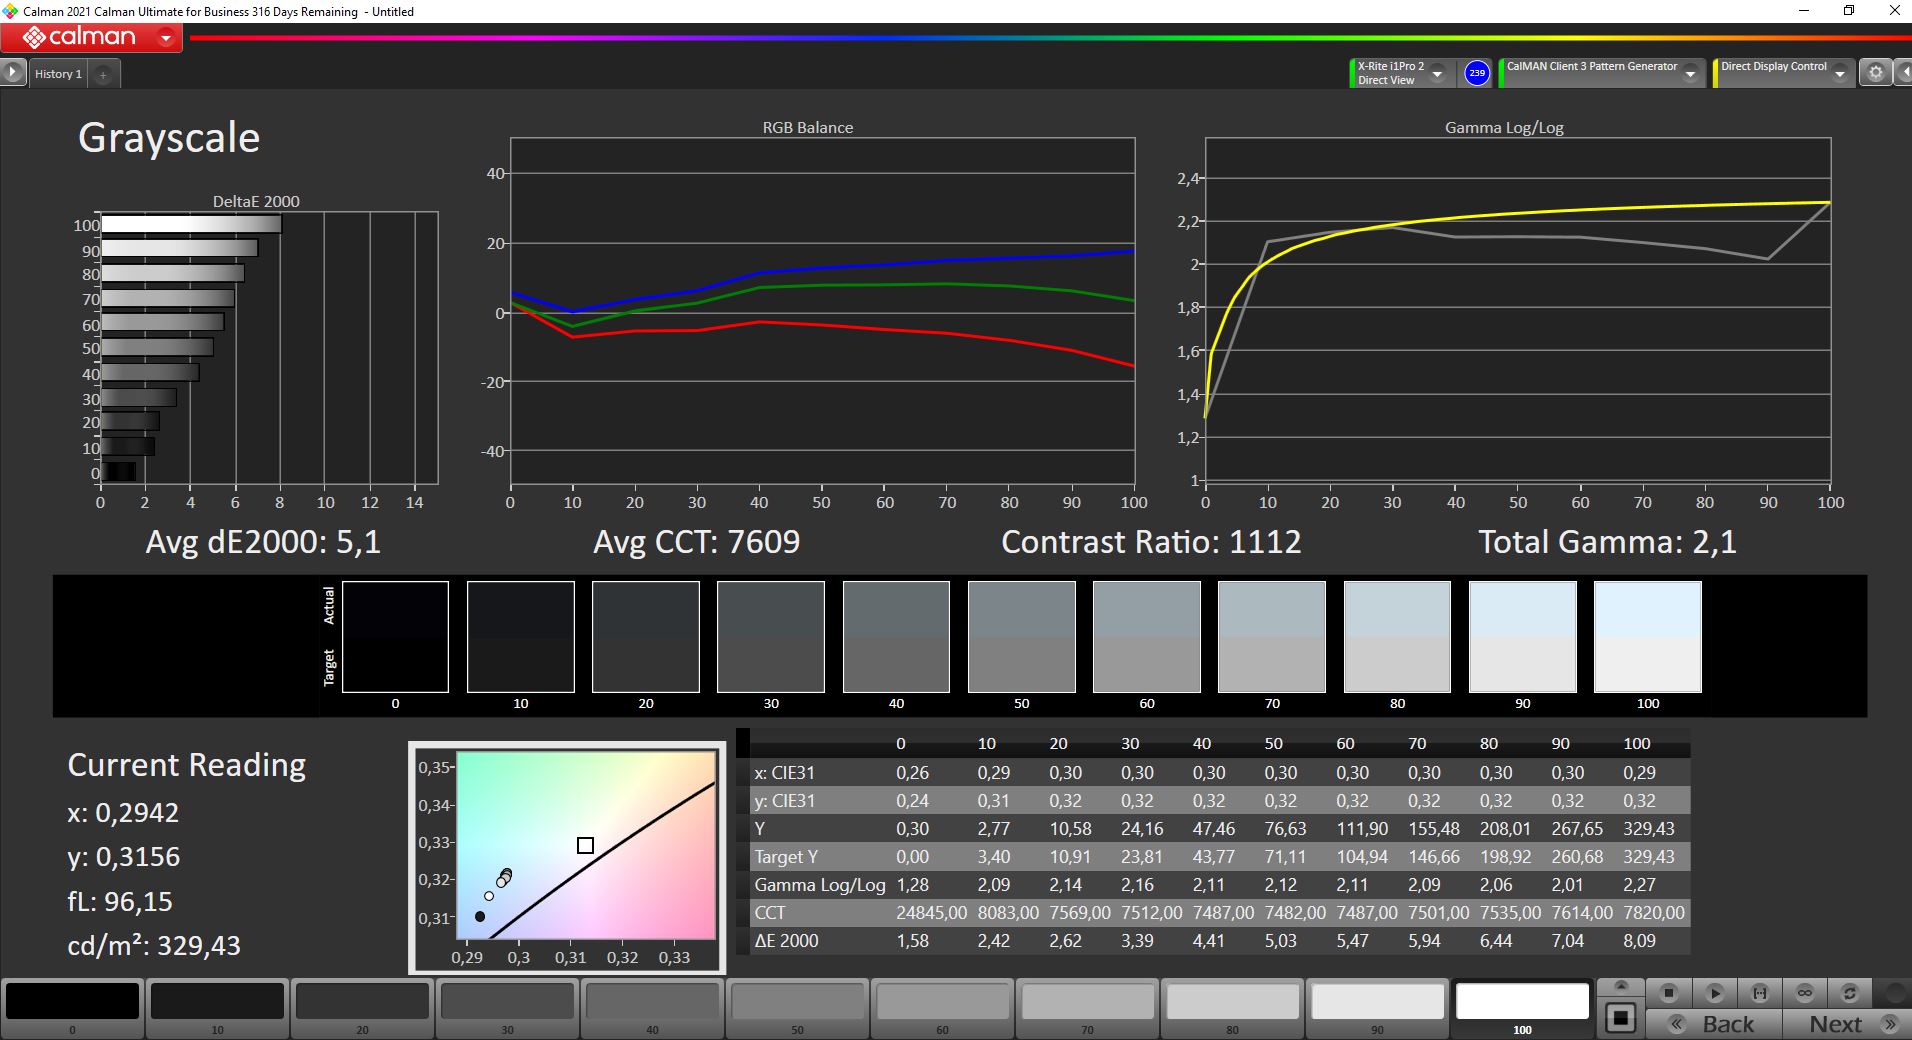
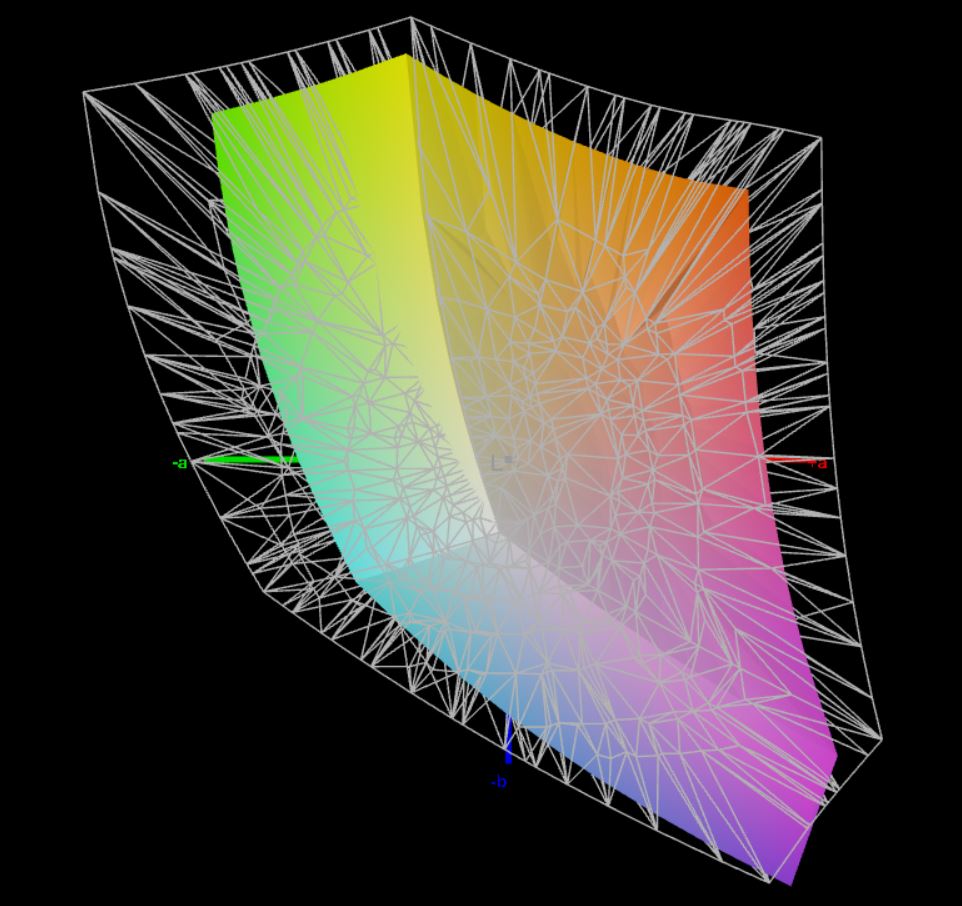
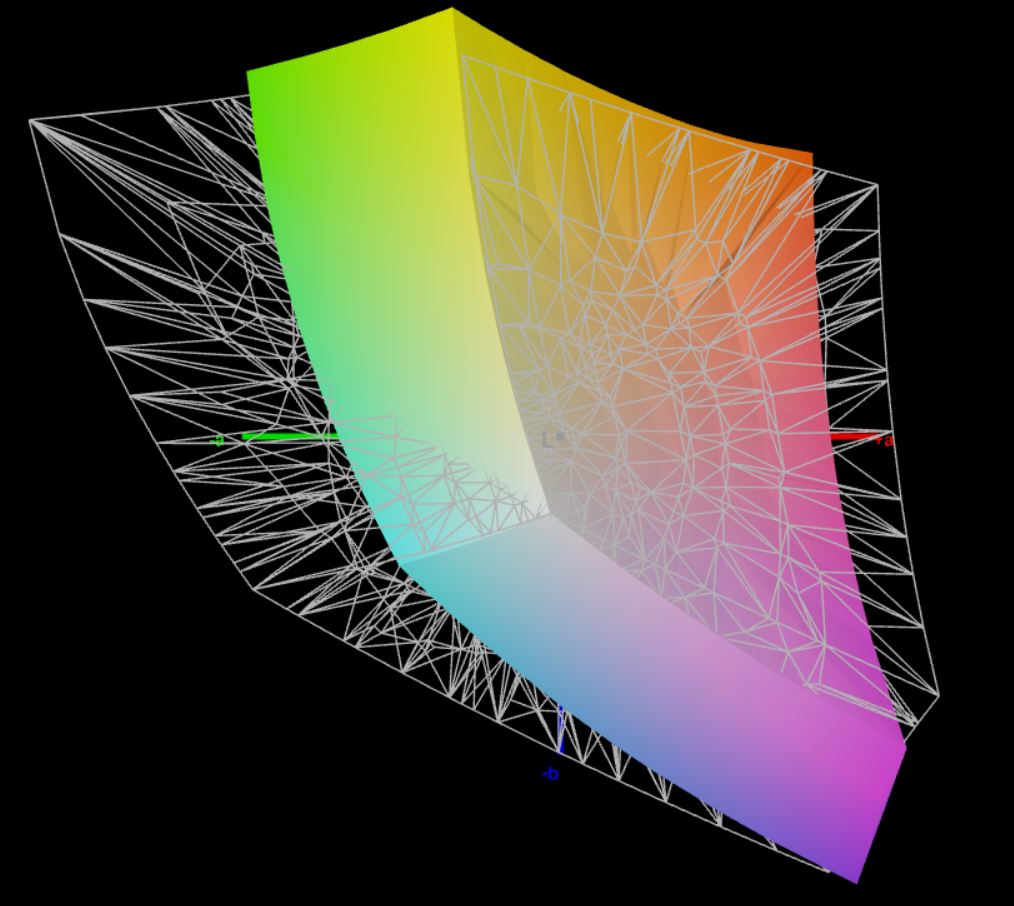
A tela mate do Schenker Work 15 fornece uma boa imagem geral com resolução Full HD. O brilho de mais de 300 cd/m² garante uma boa legibilidade, mesmo ao ar livre. A iluminação é tão uniforme que o sangramento da tela não é perceptível, a menos que seja observado com uma câmera com longos tempos de exposição. A cobertura do espaço de cor de 86,2% sRGB e os desvios de cor são suficientes para o trabalho de escritório, mas não são adequados para a edição de imagens. A cintilação não pôde ser detectada na tela e a relação de contraste de 1097:1 também é decente.
| |||||||||||||||||||||||||
iluminação: 92 %
iluminação com acumulador: 329 cd/m²
Contraste: 1097:1 (Preto: 0.3 cd/m²)
ΔE ColorChecker Calman: 5.4 | ∀{0.5-29.43 Ø4.71}
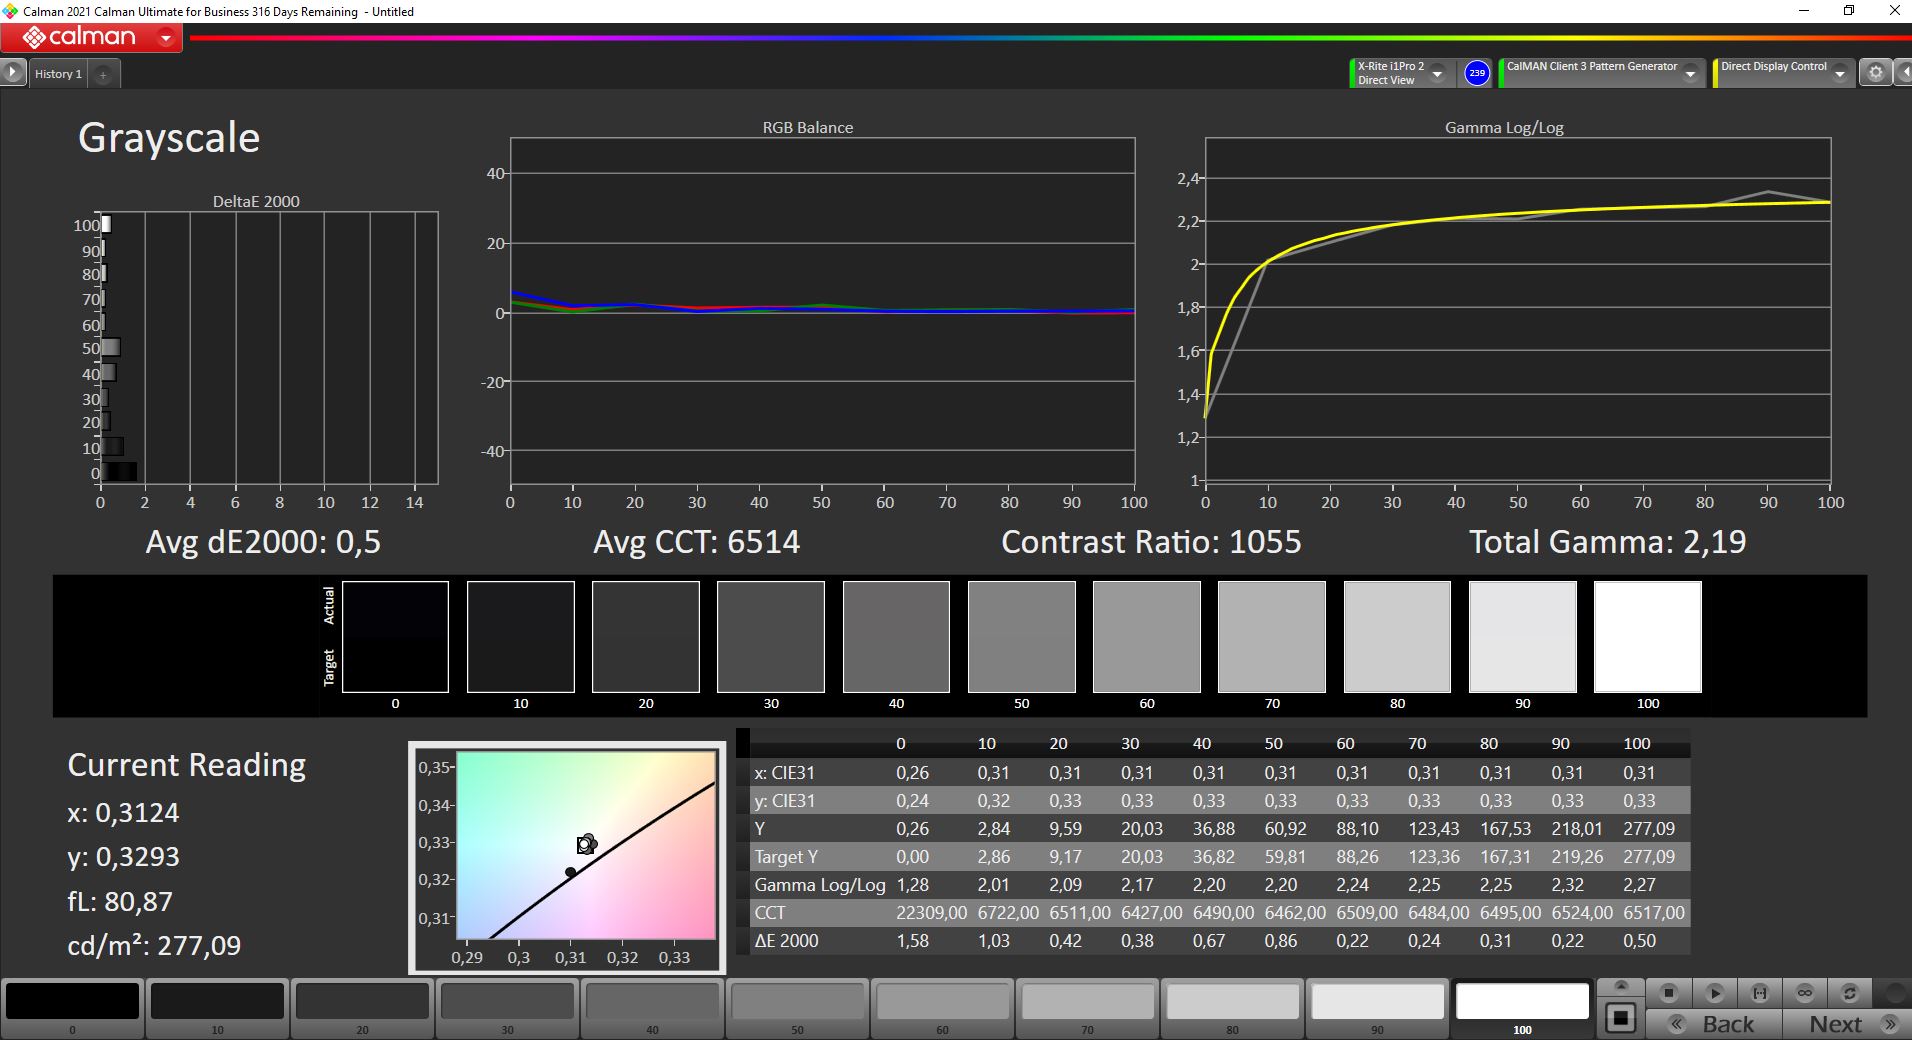
calibrated: 2.5
ΔE Greyscale Calman: 5.1 | ∀{0.09-98 Ø4.96}
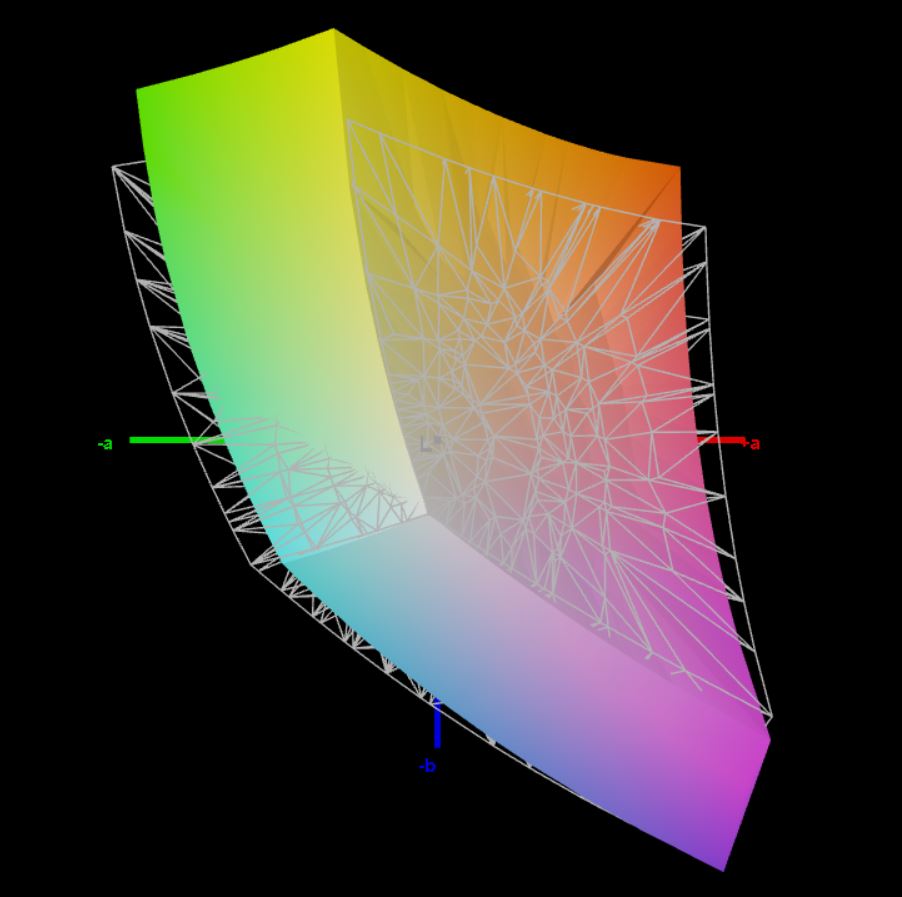
62.9% AdobeRGB 1998 (Argyll 3D)
86.2% sRGB (Argyll 3D)
64.5% Display P3 (Argyll 3D)
Gamma: 2.1
CCT: 7609 K
| Schenker Work 15 Tiger Lake-H BOE07D8, IPS, 1920x1080, 15.6" | LG Gram 15Z90P-G.AA89G LG Display LP156WFC-SPY1, IPS 99% sRGB, 1920x1080, 15.6" | Dell Inspiron 15 3501 BOE NV15N3D (Dell P/N: N39X1), IPS, 1920x1080, 15.6" | Lenovo ThinkPad E15 G3-20YG003UGE B156HAN02.1, IPS, 1920x1080, 15.6" | Asus VivoBook S15 D533UA Chi Mei N156HCA-EAB, IPS, 1920x1080, 15.6" | HP Pavilion x360 15-er0155ng AU Optronics AUOC48A, IPS, 1920x1080, 15.6" | |
|---|---|---|---|---|---|---|
| Display | 2% | -35% | -34% | -28% | -35% | |
| Display P3 Coverage (%) | 64.5 | 62 -4% | 39.4 -39% | 40.3 -38% | 43.6 -32% | 39.8 -38% |
| sRGB Coverage (%) | 86.2 | 92 7% | 58.7 -32% | 60.2 -30% | 65.2 -24% | 59.7 -31% |
| AdobeRGB 1998 Coverage (%) | 62.9 | 64 2% | 40.7 -35% | 41.6 -34% | 45 -28% | 41.1 -35% |
| Response Times | 44% | 18% | 20% | 58% | 24% | |
| Response Time Grey 50% / Grey 80% * (ms) | 58.4 ? | 36 ? 38% | 43 ? 26% | 44 ? 25% | 18 ? 69% | 42 ? 28% |
| Response Time Black / White * (ms) | 35.2 ? | 18 ? 49% | 32 ? 9% | 30.4 ? 14% | 19 ? 46% | 28 ? 20% |
| PWM Frequency (Hz) | 1000 ? | |||||
| Screen | 6% | 20% | -4% | -10% | -10% | |
| Brightness middle (cd/m²) | 329 | 343 4% | 271 -18% | 347 5% | 289 -12% | 249 -24% |
| Brightness (cd/m²) | 316 | 311 -2% | 263 -17% | 329 4% | 267 -16% | 246 -22% |
| Brightness Distribution (%) | 92 | 86 -7% | 92 0% | 93 1% | 85 -8% | 93 1% |
| Black Level * (cd/m²) | 0.3 | 0.46 -53% | 0.15 50% | 0.25 17% | 0.56 -87% | 0.29 3% |
| Contrast (:1) | 1097 | 746 -32% | 1807 65% | 1388 27% | 516 -53% | 859 -22% |
| Colorchecker dE 2000 * | 5.4 | 3.5 35% | 4.83 11% | 4.7 13% | 3.96 27% | 6.01 -11% |
| Colorchecker dE 2000 max. * | 10.1 | 6.25 38% | 7 31% | 19.4 -92% | 6.76 33% | 11.01 -9% |
| Colorchecker dE 2000 calibrated * | 2.5 | 1.17 53% | 4.4 -76% | |||
| Greyscale dE 2000 * | 5.1 | 4.35 15% | 3.36 34% | 1.7 67% | 3.43 33% | 4.67 8% |
| Gamma | 2.1 105% | 2.55 86% | 2.56 86% | 2.2 100% | 2.28 96% | 2.79 79% |
| CCT | 7609 85% | 6016 108% | 6764 96% | 6475 100% | 7191 90% | 6390 102% |
| Color Space (Percent of AdobeRGB 1998) (%) | 42 | 38 | ||||
| Color Space (Percent of sRGB) (%) | 65 | 59 | ||||
| Média Total (Programa/Configurações) | 17% /
10% | 1% /
7% | -6% /
-7% | 7% /
-4% | -7% /
-10% |
* ... menor é melhor
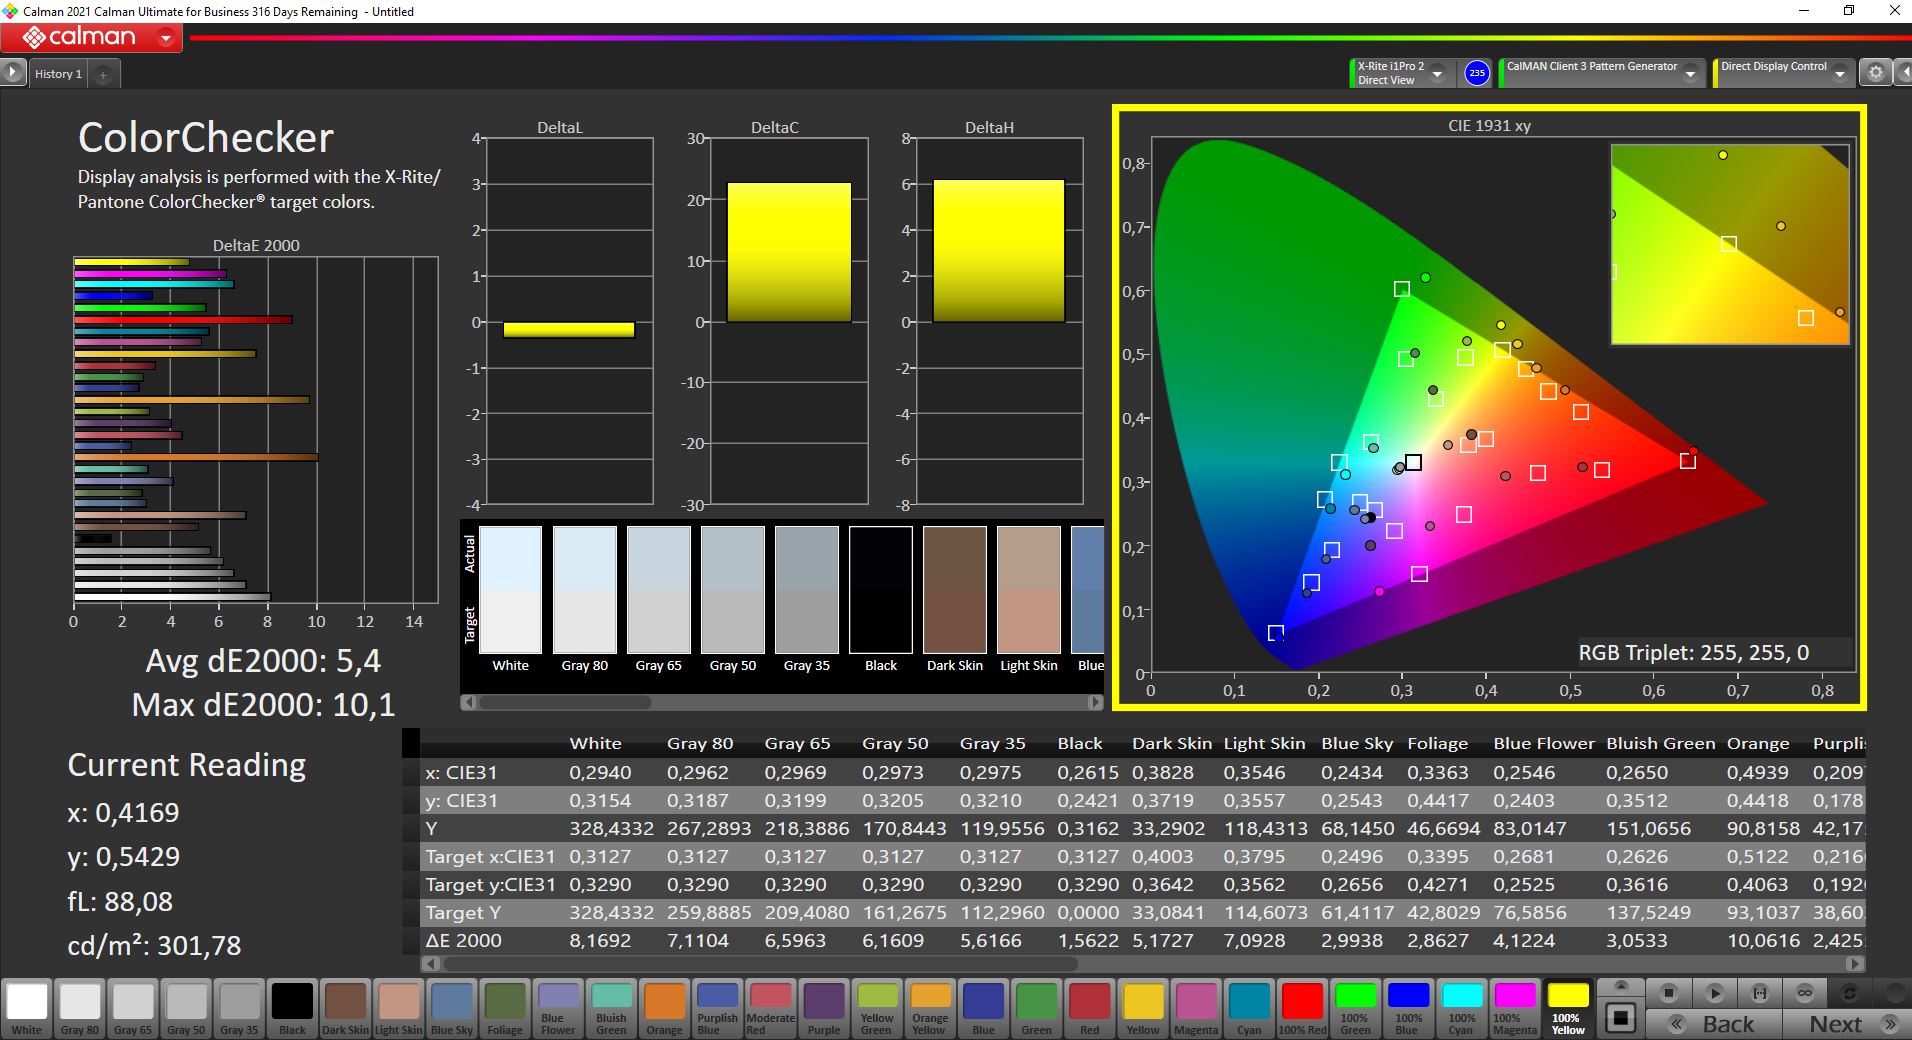
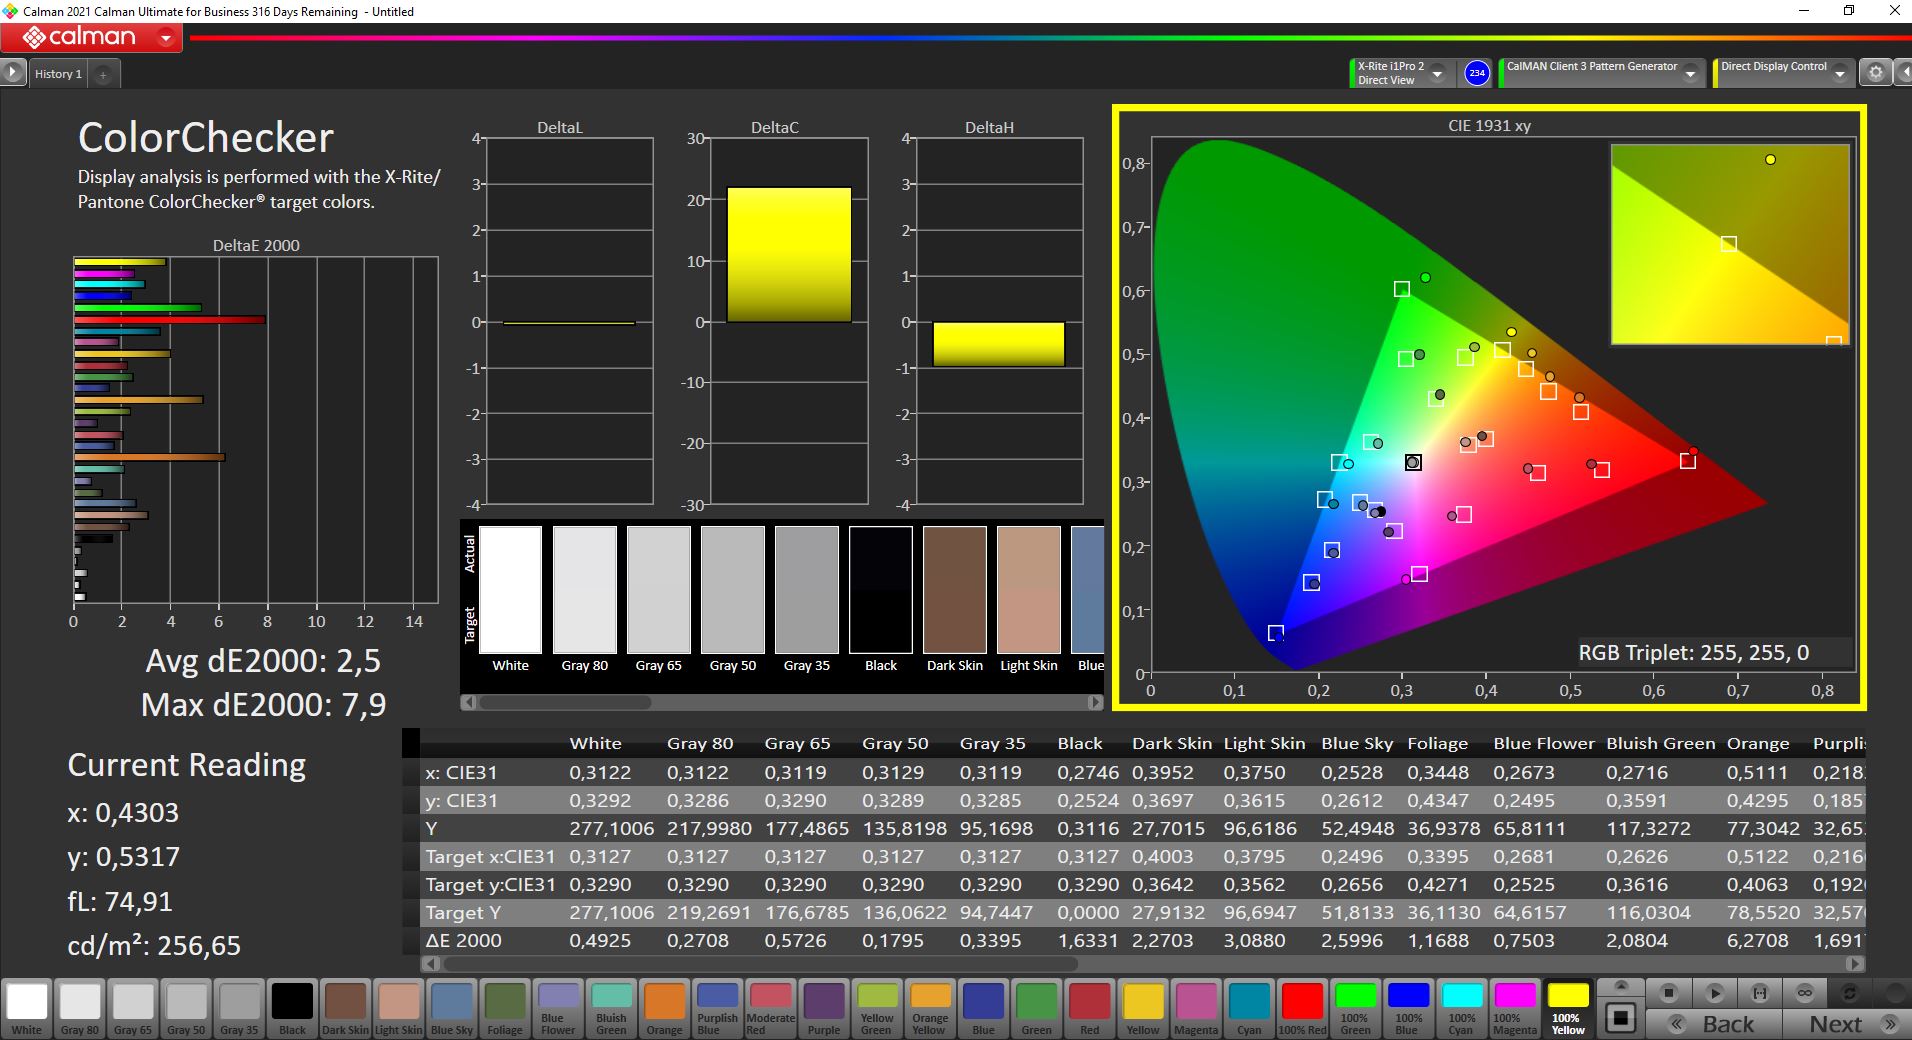
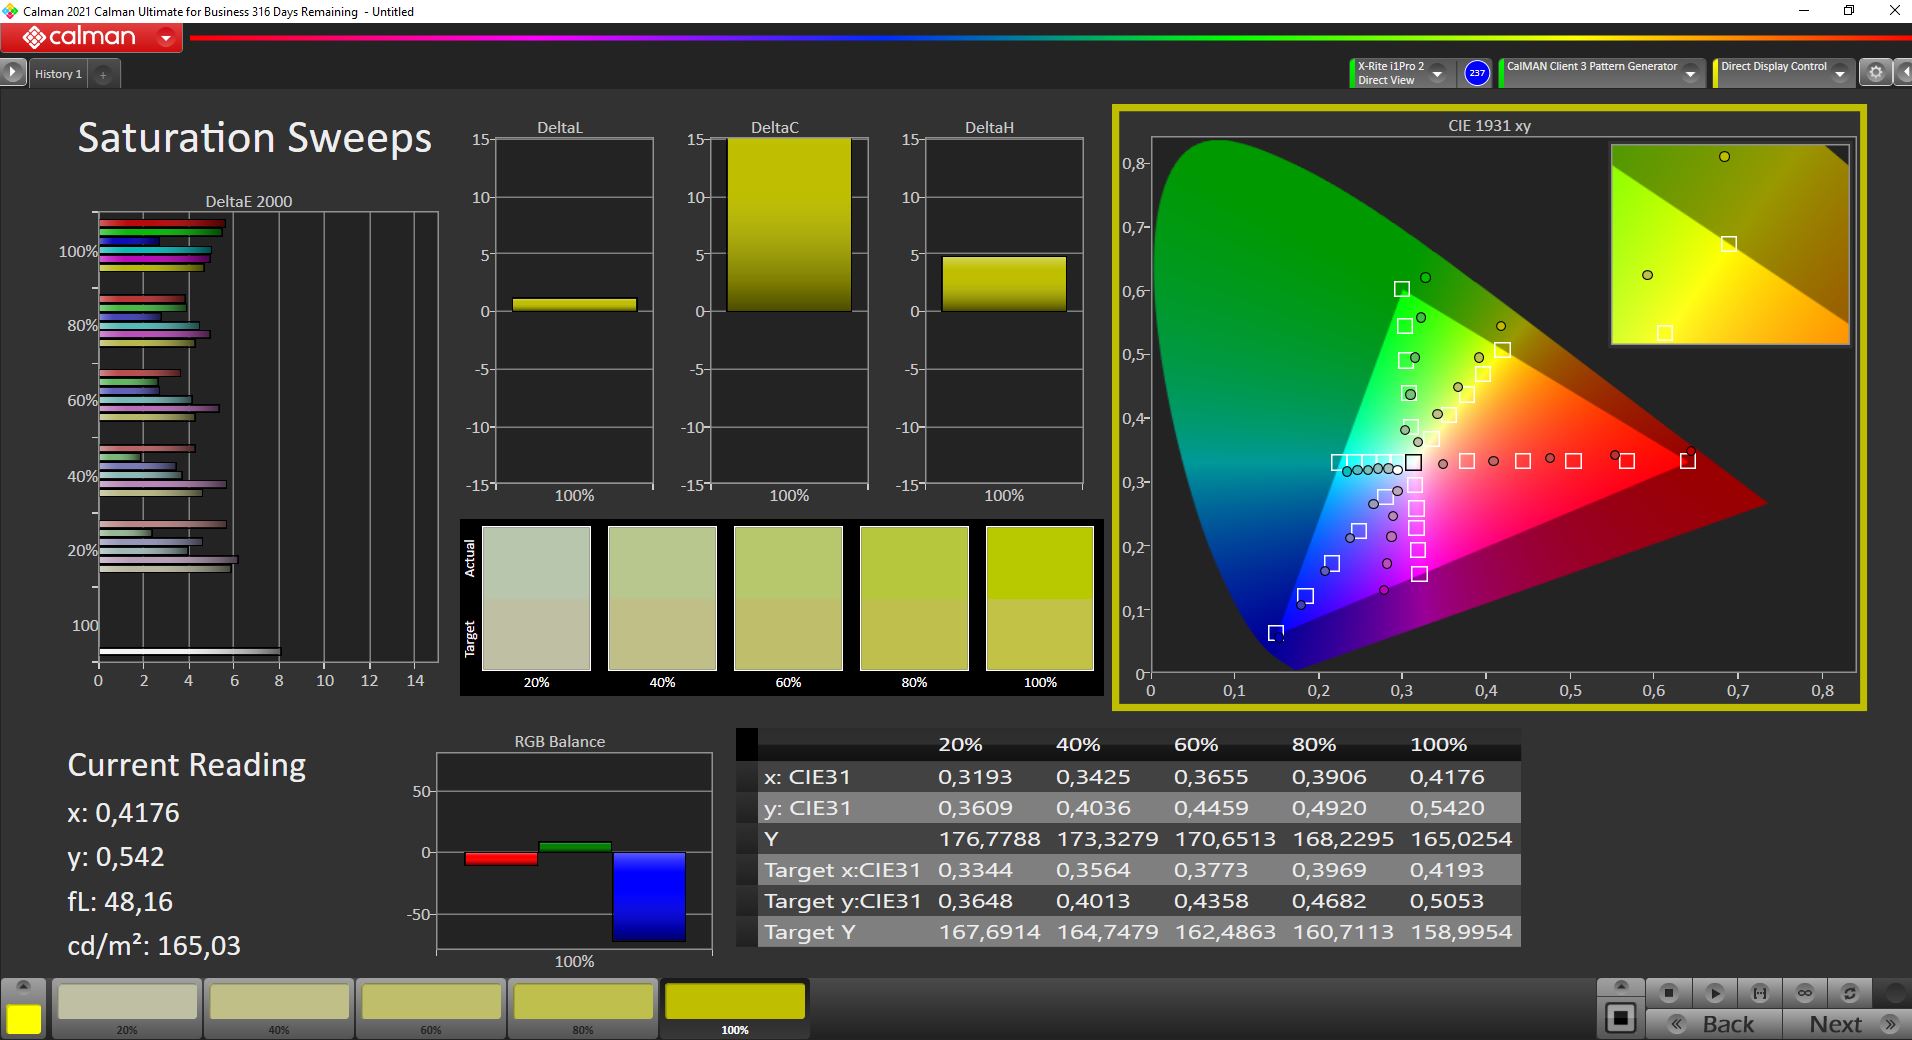
As verificações de cor out-of-the-box com CalMan mostram verde e vermelho a ser ligeiramente deslocado. Isto mostra que a tela não atinge a cobertura sRGB completa, e mantém um desvio máximo de cor relativamente alto, mesmo após a calibração. Entretanto, o desvio médio de cor com um ΔΕ 2,5 ainda está abaixo da marca alvo de 3
Exibir tempos de resposta
| ↔ Tempo de resposta preto para branco | ||
|---|---|---|
| 35.2 ms ... ascensão ↗ e queda ↘ combinadas | ↗ 18 ms ascensão | 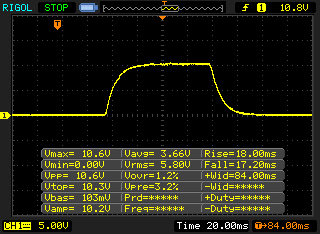 |
| ↘ 17.2 ms queda | ||
| A tela mostra taxas de resposta lentas em nossos testes e será insatisfatória para os jogadores. Em comparação, todos os dispositivos testados variam de 0.1 (mínimo) a 240 (máximo) ms. » 93 % de todos os dispositivos são melhores. Isso significa que o tempo de resposta medido é pior que a média de todos os dispositivos testados (19.8 ms). | ||
| ↔ Tempo de resposta 50% cinza a 80% cinza | ||
| 58.4 ms ... ascensão ↗ e queda ↘ combinadas | ↗ 26.8 ms ascensão | 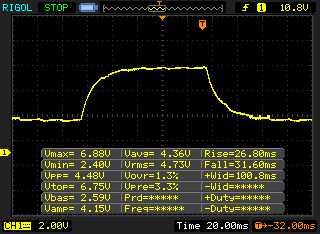 |
| ↘ 31.6 ms queda | ||
| A tela mostra taxas de resposta lentas em nossos testes e será insatisfatória para os jogadores. Em comparação, todos os dispositivos testados variam de 0.165 (mínimo) a 636 (máximo) ms. » 95 % de todos os dispositivos são melhores. Isso significa que o tempo de resposta medido é pior que a média de todos os dispositivos testados (31 ms). | ||
Cintilação da tela / PWM (modulação por largura de pulso)
| Tela tremeluzindo / PWM não detectado | 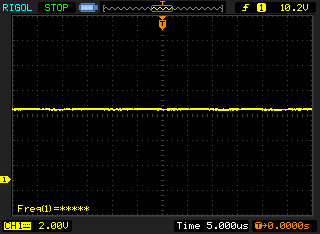 | ||
[pwm_comparison] Em comparação: 52 % de todos os dispositivos testados não usam PWM para escurecer a tela. Se PWM foi detectado, uma média de 7751 (mínimo: 5 - máximo: 343500) Hz foi medida. | |||
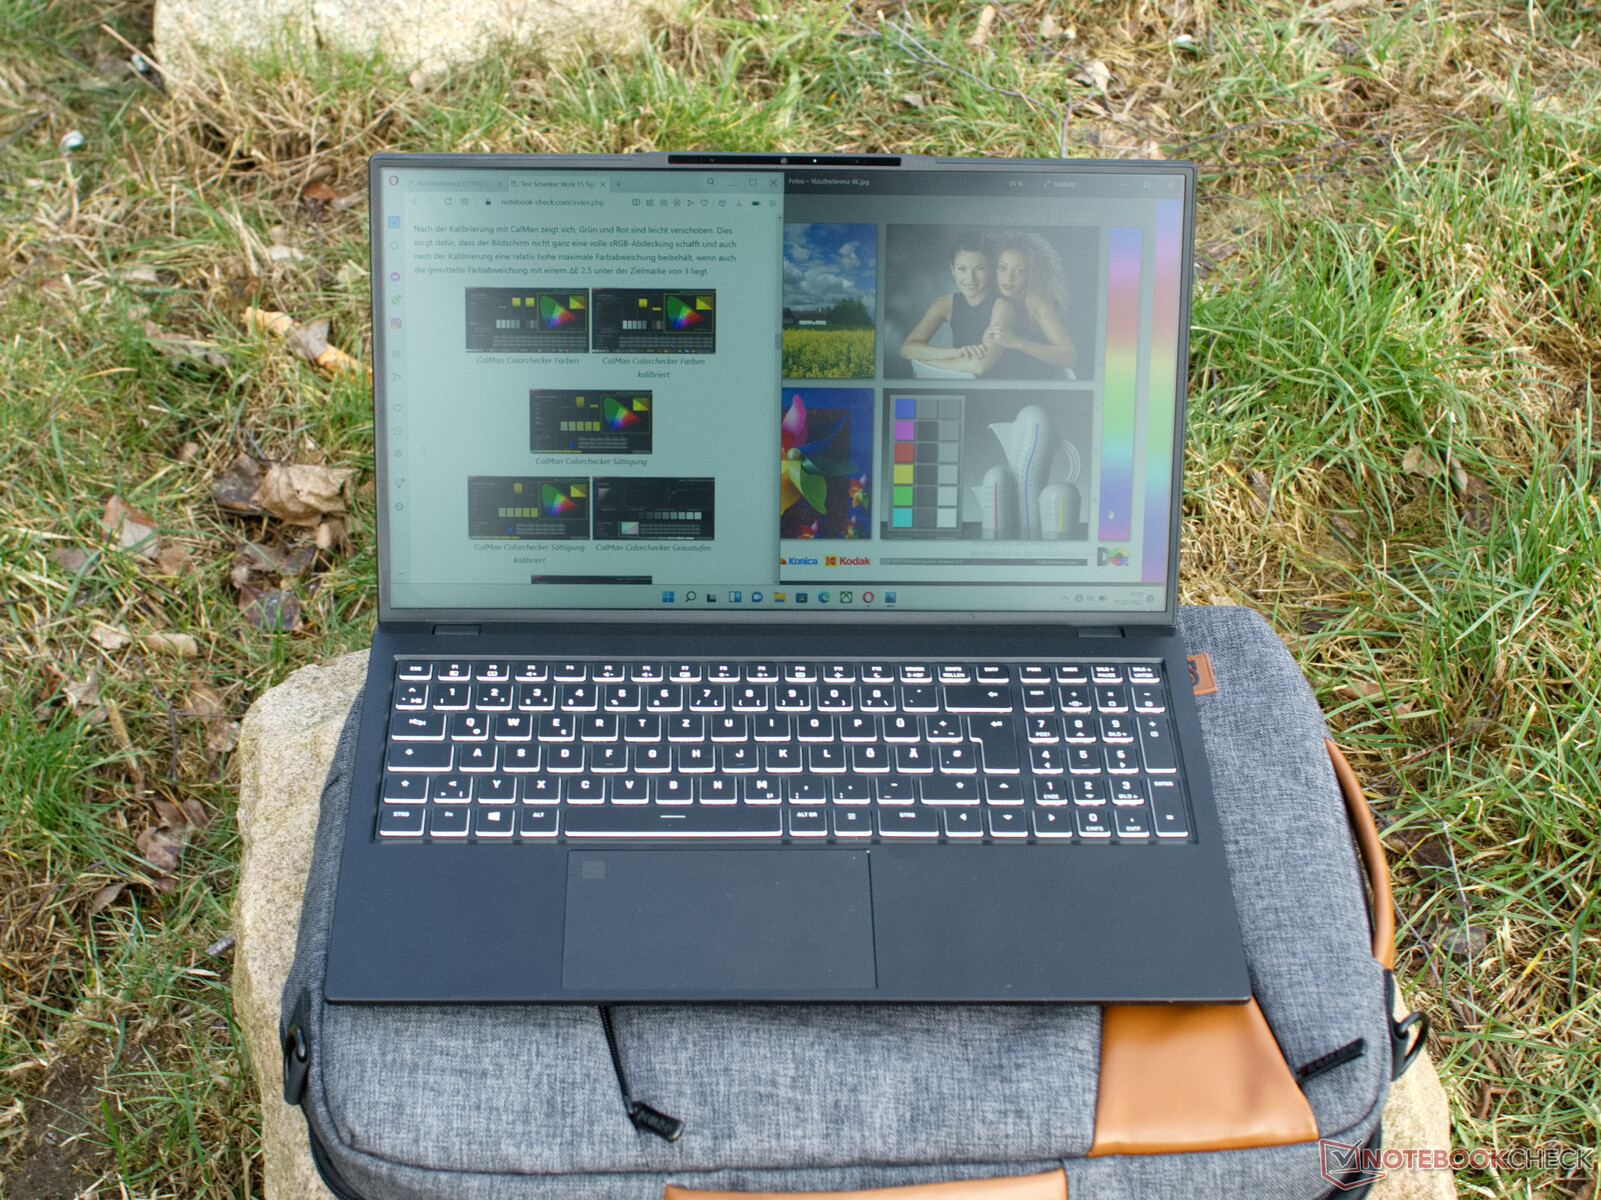
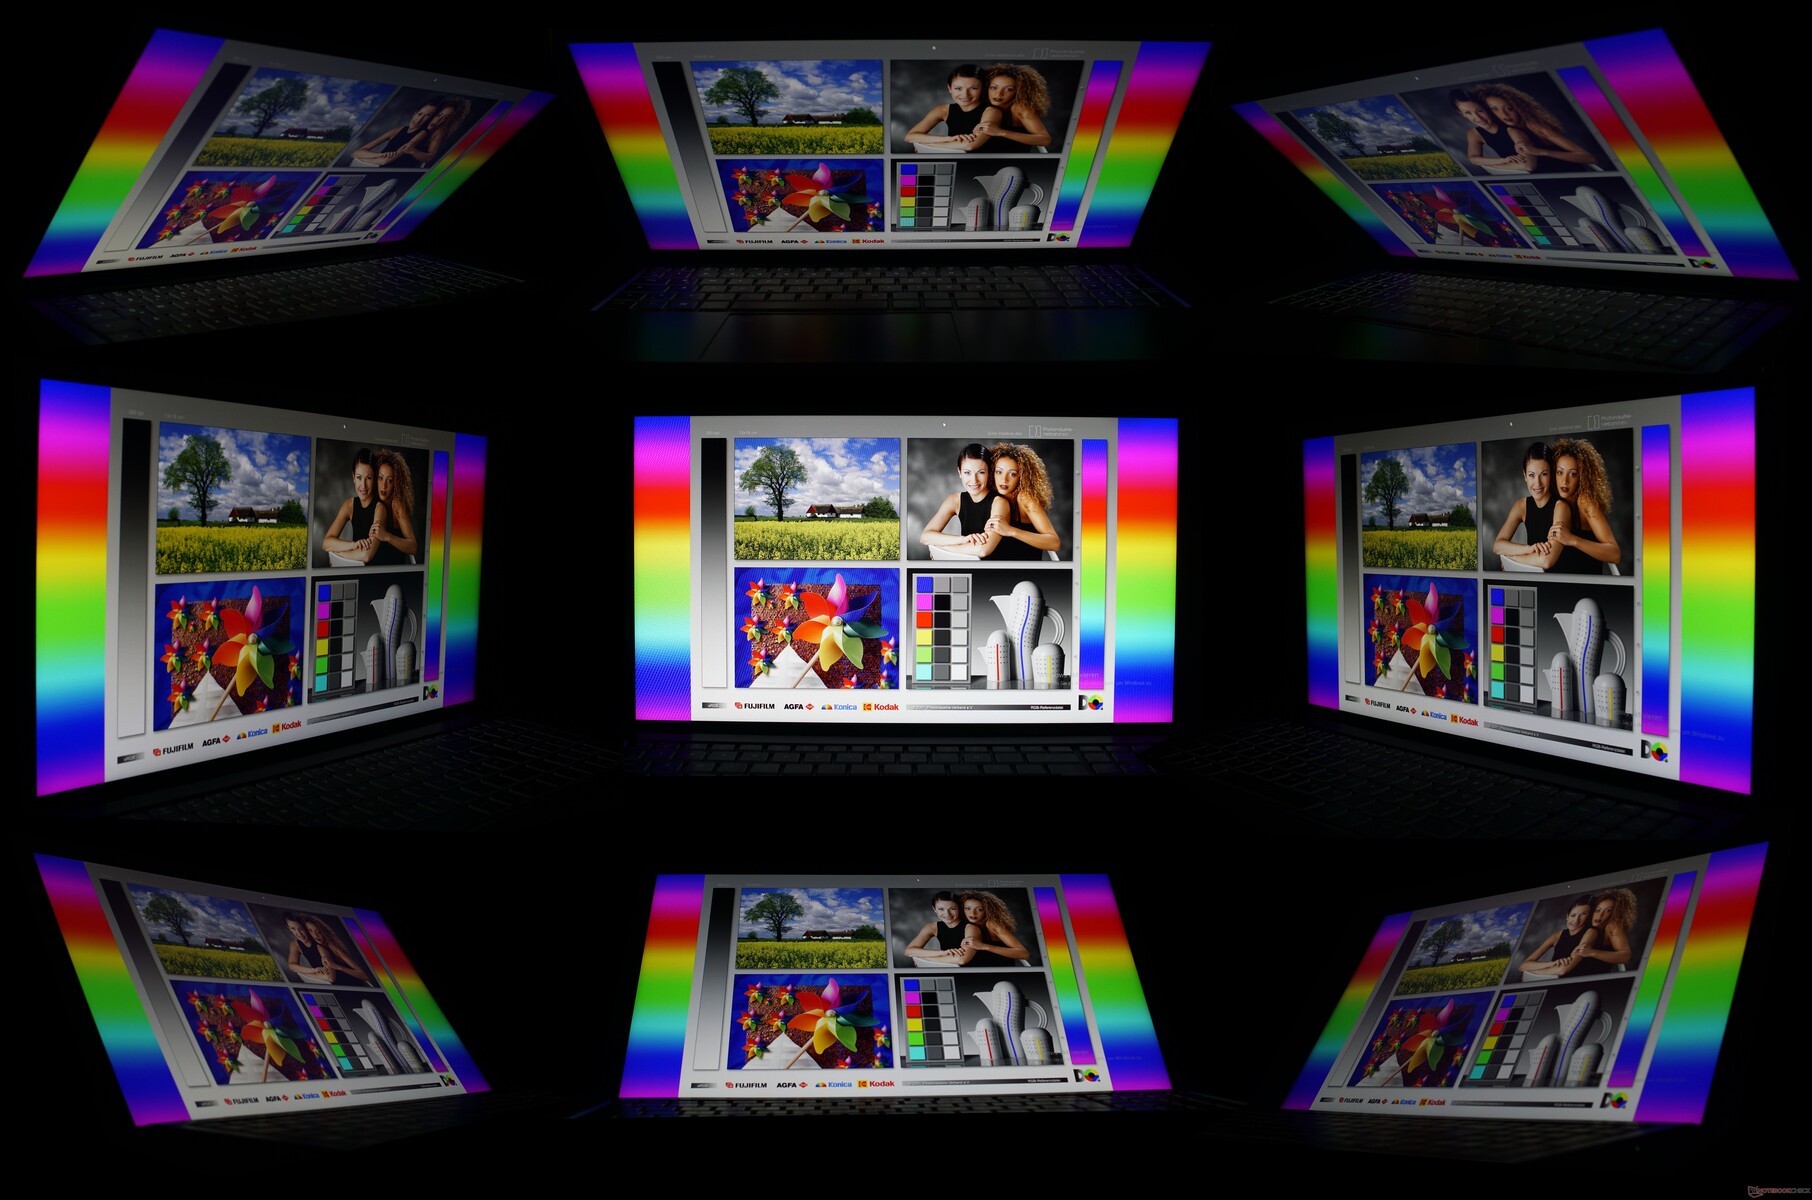
A leitura ao ar livre torna-se difícil somente quando o sol reflete diretamente sobre a superfície mate da tela. O portátil de escritório mostra uma boa imagem tanto ao ar livre quanto de vários ângulos.
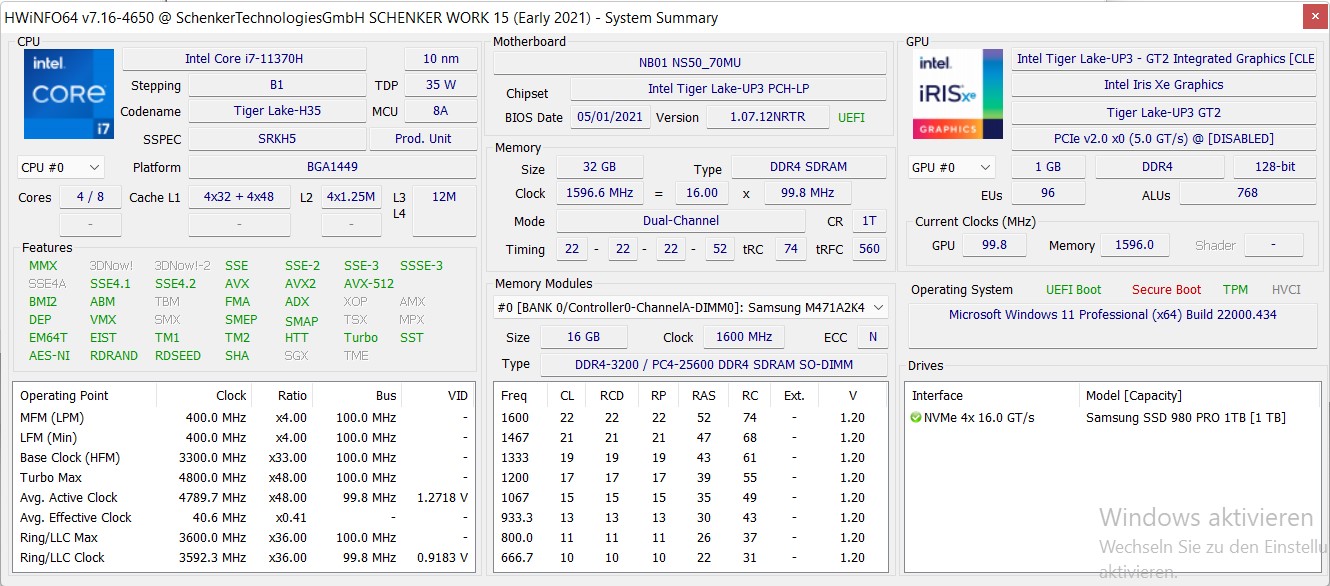
Desempenho: Uma questão de atitude
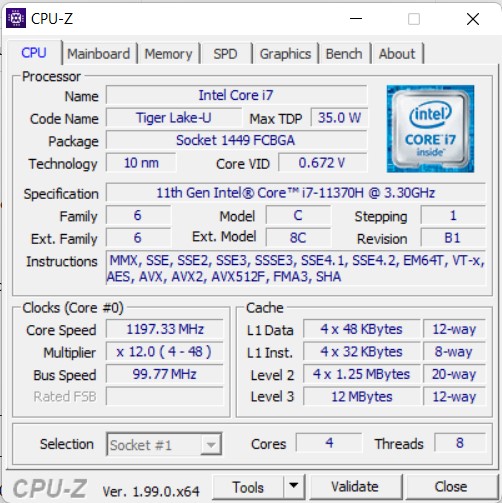
Graças a muitas configurações livremente selecionáveis, a Obra 15 da Schenker pode ser adaptada a muitos campos de uso. Nosso dispositivo de teste é equipado com oIntel Core i7-11370H32 GB de memória de trabalho, e 1 TB de SSD NVMe rápido. Outras opções de configuração estão disponíveis com o Intel Core i5-11300H, 8 a 32 GB de memória de trabalho, armazenamento SSD diferente com até 8 TB, e muitas outras opções de garantia, WLAN, teclado, e o sistema operacional
Condições de teste
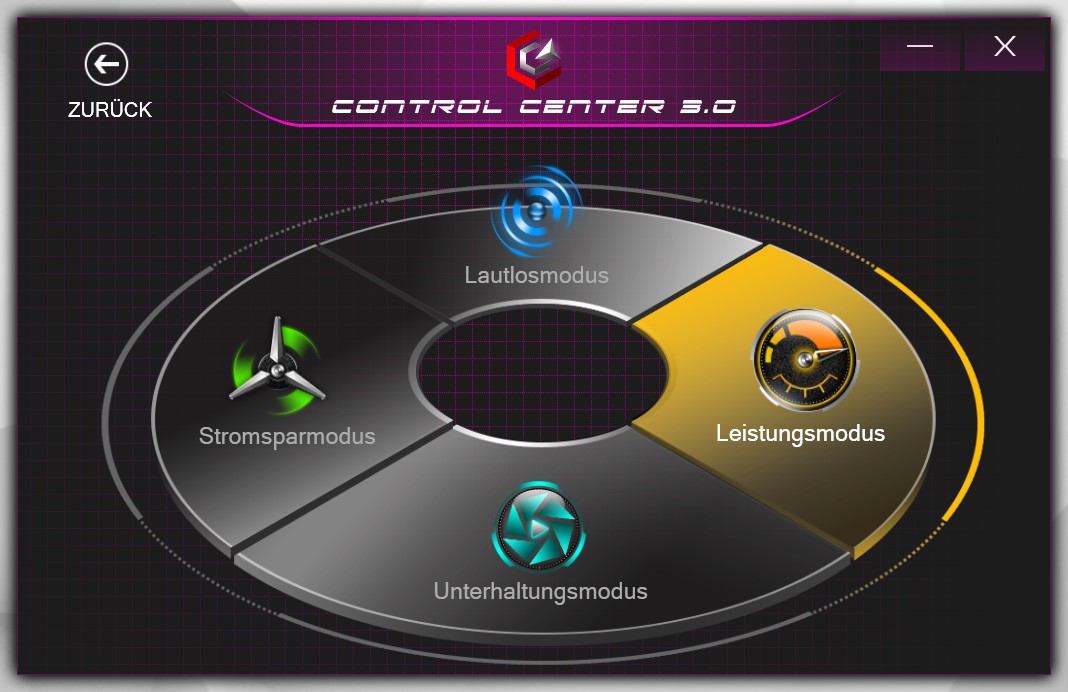
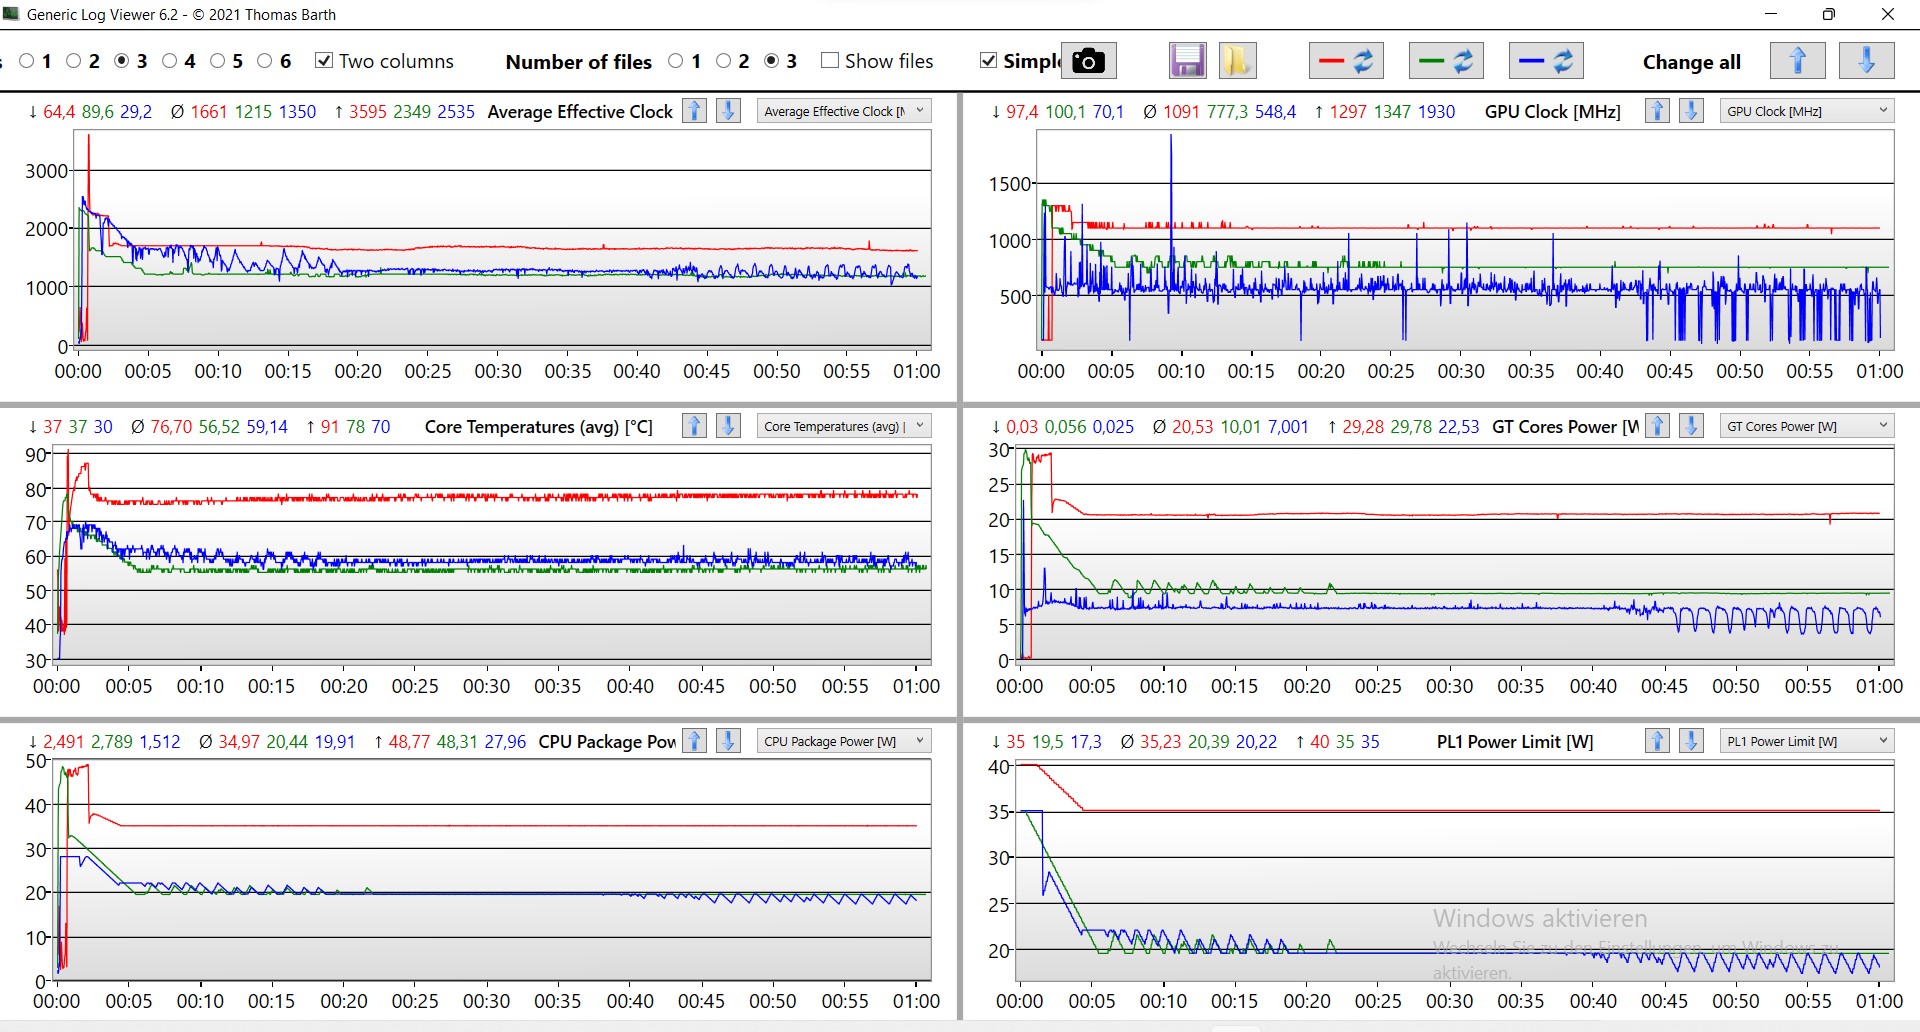
Todos os benchmarks foram executados no plano Windows "Best Performance" enery. O "modo de entretenimento" predefinido foi selecionado no Centro de Controle Schenker. Isto resulta em um PL2 de 42 W e um PL1 de cerca de 22 W para o Intel Core i7.
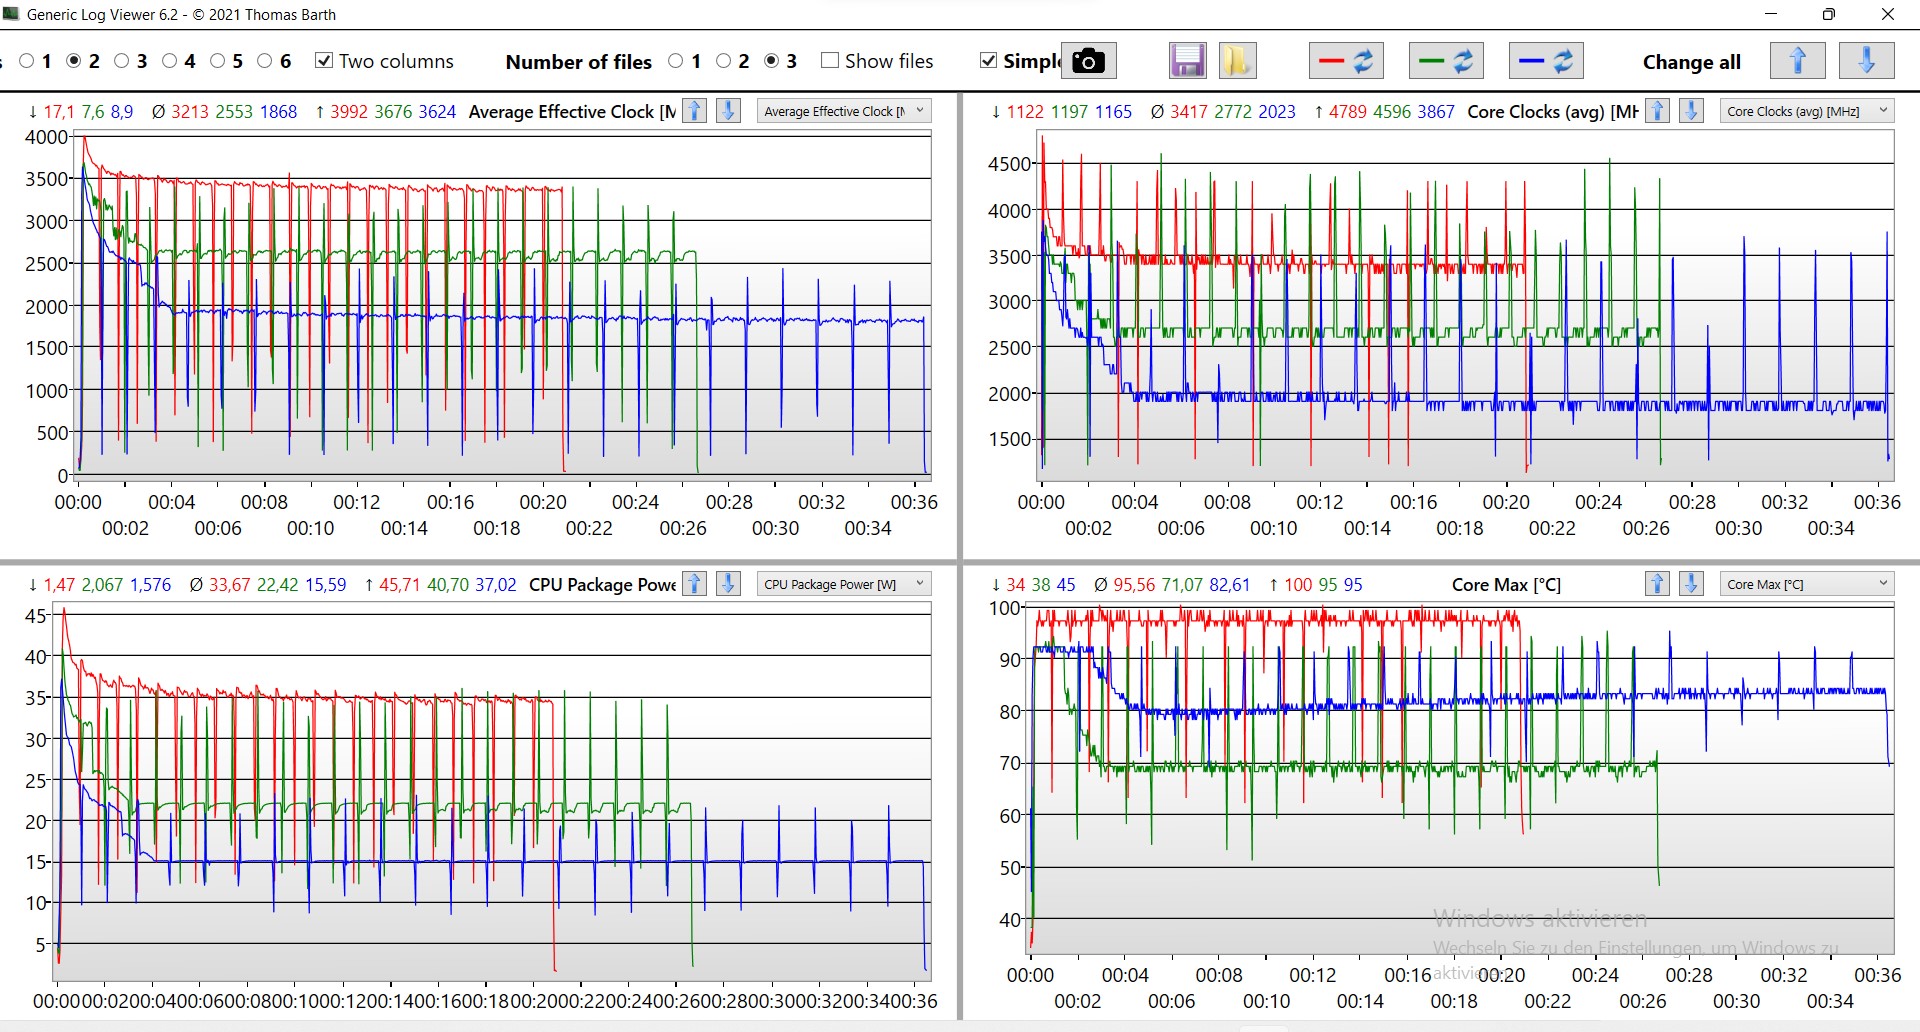
O Centro de Controle também oferece outros modos de desempenho. Assim, um PL1 consideravelmente maior de 35 W pode ser alcançado no modo de desempenho. Entretanto, a temperatura do núcleo também aumenta aqui até 100 °C. Além de alguns benchmarks genéricos de processador, como o Cinebench, não se vê um ganho claro de desempenho com este modo.
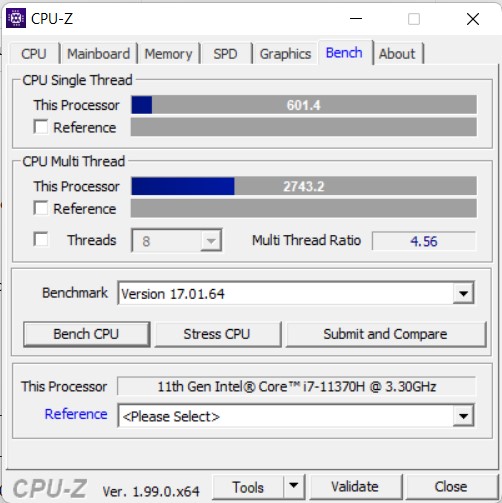
Processador
O Intel Core i7-11370H é particularmente comum em estações de trabalho finas e cadernos de jogos. Dependendo do modo de desempenho definido, o processador mostra um desempenho ligeiramente abaixo da média nos pontos de referência com carga de longo prazo. O processador só consegue convencer totalmente no modo de desempenho. No entanto, graças ao desempenho relativamente alto de Boost e ao desempenho tipicamente forte de um único núcleo, o Schenker Work 15 sempre fornece boas pontuações em testes, com exceção do Cinebench.
No modo de bateria, o processador pode trabalhar com cerca de 16 W. Em comparação com o modo de desempenho, pouco mais da metade da potência de computação está disponível no benchmark Cinebench R15.
Cinebench R15 Multi Dauertest
Cinebench R23: Multi Core | Single Core
Cinebench R20: CPU (Multi Core) | CPU (Single Core)
Cinebench R15: CPU Multi 64Bit | CPU Single 64Bit
Blender: v2.79 BMW27 CPU
7-Zip 18.03: 7z b 4 | 7z b 4 -mmt1
Geekbench 5.5: Multi-Core | Single-Core
HWBOT x265 Benchmark v2.2: 4k Preset
LibreOffice : 20 Documents To PDF
R Benchmark 2.5: Overall mean
| CPU Performance rating | |
| Média da turma Office | |
| Asus VivoBook S15 D533UA | |
| Lenovo ThinkPad E15 G3-20YG003UGE | |
| Média Intel Core i7-11370H | |
| Schenker Work 15 Tiger Lake-H | |
| Dell Inspiron 15 3501 | |
| HP Pavilion x360 15-er0155ng | |
| LG Gram 15Z90P-G.AA89G | |
| Cinebench R23 / Multi Core | |
| Média da turma Office (1673 - 22808, n=76, últimos 2 anos) | |
| Asus VivoBook S15 D533UA | |
| Lenovo ThinkPad E15 G3-20YG003UGE | |
| Média Intel Core i7-11370H (3696 - 6646, n=12) | |
| Dell Inspiron 15 3501 | |
| Schenker Work 15 Tiger Lake-H | |
| HP Pavilion x360 15-er0155ng | |
| LG Gram 15Z90P-G.AA89G | |
| Cinebench R23 / Single Core | |
| Média da turma Office (708 - 2130, n=76, últimos 2 anos) | |
| Média Intel Core i7-11370H (1081 - 1556, n=11) | |
| Schenker Work 15 Tiger Lake-H | |
| Dell Inspiron 15 3501 | |
| HP Pavilion x360 15-er0155ng | |
| Asus VivoBook S15 D533UA | |
| Lenovo ThinkPad E15 G3-20YG003UGE | |
| LG Gram 15Z90P-G.AA89G | |
| Cinebench R20 / CPU (Multi Core) | |
| Média da turma Office (648 - 8840, n=75, últimos 2 anos) | |
| Asus VivoBook S15 D533UA | |
| Lenovo ThinkPad E15 G3-20YG003UGE | |
| Média Intel Core i7-11370H (1438 - 2578, n=11) | |
| Dell Inspiron 15 3501 | |
| HP Pavilion x360 15-er0155ng | |
| Schenker Work 15 Tiger Lake-H | |
| LG Gram 15Z90P-G.AA89G | |
| Cinebench R20 / CPU (Single Core) | |
| Média da turma Office (345 - 816, n=75, últimos 2 anos) | |
| Média Intel Core i7-11370H (475 - 601, n=11) | |
| Dell Inspiron 15 3501 | |
| Schenker Work 15 Tiger Lake-H | |
| HP Pavilion x360 15-er0155ng | |
| Asus VivoBook S15 D533UA | |
| Lenovo ThinkPad E15 G3-20YG003UGE | |
| LG Gram 15Z90P-G.AA89G | |
| Cinebench R15 / CPU Multi 64Bit | |
| Média da turma Office (250 - 3380, n=77, últimos 2 anos) | |
| Asus VivoBook S15 D533UA | |
| Lenovo ThinkPad E15 G3-20YG003UGE | |
| Média Intel Core i7-11370H (606 - 1086, n=17) | |
| Schenker Work 15 Tiger Lake-H | |
| Schenker Work 15 Tiger Lake-H | |
| Schenker Work 15 Tiger Lake-H | |
| Dell Inspiron 15 3501 | |
| LG Gram 15Z90P-G.AA89G | |
| HP Pavilion x360 15-er0155ng | |
| Cinebench R15 / CPU Single 64Bit | |
| Média da turma Office (99.5 - 316, n=77, últimos 2 anos) | |
| Média Intel Core i7-11370H (162.9 - 233, n=15) | |
| Schenker Work 15 Tiger Lake-H | |
| Schenker Work 15 Tiger Lake-H | |
| HP Pavilion x360 15-er0155ng | |
| Asus VivoBook S15 D533UA | |
| Lenovo ThinkPad E15 G3-20YG003UGE | |
| LG Gram 15Z90P-G.AA89G | |
| Dell Inspiron 15 3501 | |
| Blender / v2.79 BMW27 CPU | |
| LG Gram 15Z90P-G.AA89G | |
| Schenker Work 15 Tiger Lake-H | |
| HP Pavilion x360 15-er0155ng | |
| Dell Inspiron 15 3501 | |
| Média Intel Core i7-11370H (432 - 762, n=11) | |
| Média da turma Office (158 - 1940, n=76, últimos 2 anos) | |
| Asus VivoBook S15 D533UA | |
| Lenovo ThinkPad E15 G3-20YG003UGE | |
| 7-Zip 18.03 / 7z b 4 | |
| Média da turma Office (7098 - 76886, n=77, últimos 2 anos) | |
| Asus VivoBook S15 D533UA | |
| Lenovo ThinkPad E15 G3-20YG003UGE | |
| Média Intel Core i7-11370H (18961 - 28520, n=11) | |
| Dell Inspiron 15 3501 | |
| HP Pavilion x360 15-er0155ng | |
| Schenker Work 15 Tiger Lake-H | |
| LG Gram 15Z90P-G.AA89G | |
| 7-Zip 18.03 / 7z b 4 -mmt1 | |
| Média da turma Office (3387 - 6469, n=77, últimos 2 anos) | |
| Média Intel Core i7-11370H (5074 - 5550, n=11) | |
| Schenker Work 15 Tiger Lake-H | |
| Dell Inspiron 15 3501 | |
| HP Pavilion x360 15-er0155ng | |
| LG Gram 15Z90P-G.AA89G | |
| Asus VivoBook S15 D533UA | |
| Lenovo ThinkPad E15 G3-20YG003UGE | |
| Geekbench 5.5 / Multi-Core | |
| Média da turma Office (1483 - 16999, n=73, últimos 2 anos) | |
| Asus VivoBook S15 D533UA | |
| Lenovo ThinkPad E15 G3-20YG003UGE | |
| Schenker Work 15 Tiger Lake-H | |
| Média Intel Core i7-11370H (3828 - 6115, n=10) | |
| HP Pavilion x360 15-er0155ng | |
| LG Gram 15Z90P-G.AA89G | |
| Dell Inspiron 15 3501 | |
| Geekbench 5.5 / Single-Core | |
| Média da turma Office (811 - 2175, n=73, últimos 2 anos) | |
| Schenker Work 15 Tiger Lake-H | |
| Média Intel Core i7-11370H (1376 - 1607, n=10) | |
| LG Gram 15Z90P-G.AA89G | |
| Dell Inspiron 15 3501 | |
| HP Pavilion x360 15-er0155ng | |
| Asus VivoBook S15 D533UA | |
| Lenovo ThinkPad E15 G3-20YG003UGE | |
| HWBOT x265 Benchmark v2.2 / 4k Preset | |
| Média da turma Office (2.21 - 26, n=76, últimos 2 anos) | |
| Asus VivoBook S15 D533UA | |
| Lenovo ThinkPad E15 G3-20YG003UGE | |
| Média Intel Core i7-11370H (4.98 - 8.82, n=11) | |
| Dell Inspiron 15 3501 | |
| HP Pavilion x360 15-er0155ng | |
| Schenker Work 15 Tiger Lake-H | |
| LG Gram 15Z90P-G.AA89G | |
| LibreOffice / 20 Documents To PDF | |
| Lenovo ThinkPad E15 G3-20YG003UGE | |
| Asus VivoBook S15 D533UA | |
| Média da turma Office (39.9 - 102.3, n=76, últimos 2 anos) | |
| LG Gram 15Z90P-G.AA89G | |
| Dell Inspiron 15 3501 | |
| HP Pavilion x360 15-er0155ng | |
| Média Intel Core i7-11370H (23.6 - 56.5, n=11) | |
| Schenker Work 15 Tiger Lake-H | |
| R Benchmark 2.5 / Overall mean | |
| LG Gram 15Z90P-G.AA89G | |
| HP Pavilion x360 15-er0155ng | |
| Dell Inspiron 15 3501 | |
| Lenovo ThinkPad E15 G3-20YG003UGE | |
| Asus VivoBook S15 D533UA | |
| Schenker Work 15 Tiger Lake-H | |
| Média Intel Core i7-11370H (0.544 - 0.596, n=11) | |
| Média da turma Office (0.393 - 0.888, n=76, últimos 2 anos) | |
* ... menor é melhor
AIDA64: FP32 Ray-Trace | FPU Julia | CPU SHA3 | CPU Queen | FPU SinJulia | FPU Mandel | CPU AES | CPU ZLib | FP64 Ray-Trace | CPU PhotoWorxx
| Performance rating | |
| Média da turma Office | |
| Asus VivoBook S15 D533UA | |
| Lenovo ThinkPad E15 G3-20YG003UGE | |
| Schenker Work 15 Tiger Lake-H | |
| Média Intel Core i7-11370H | |
| Dell Inspiron 15 3501 | |
| HP Pavilion x360 15-er0155ng | |
| LG Gram 15Z90P-G.AA89G | |
| AIDA64 / FP32 Ray-Trace | |
| Média da turma Office (2083 - 31245, n=83, últimos 2 anos) | |
| Asus VivoBook S15 D533UA | |
| Lenovo ThinkPad E15 G3-20YG003UGE | |
| Média Intel Core i7-11370H (5204 - 8413, n=10) | |
| Schenker Work 15 Tiger Lake-H | |
| Dell Inspiron 15 3501 | |
| HP Pavilion x360 15-er0155ng | |
| LG Gram 15Z90P-G.AA89G | |
| AIDA64 / FPU Julia | |
| Média da turma Office (8191 - 125394, n=83, últimos 2 anos) | |
| Asus VivoBook S15 D533UA | |
| Lenovo ThinkPad E15 G3-20YG003UGE | |
| Média Intel Core i7-11370H (23958 - 34020, n=10) | |
| Schenker Work 15 Tiger Lake-H | |
| Dell Inspiron 15 3501 | |
| HP Pavilion x360 15-er0155ng | |
| LG Gram 15Z90P-G.AA89G | |
| AIDA64 / CPU SHA3 | |
| Média da turma Office (433 - 5755, n=83, últimos 2 anos) | |
| Média Intel Core i7-11370H (1656 - 2297, n=10) | |
| Schenker Work 15 Tiger Lake-H | |
| Asus VivoBook S15 D533UA | |
| Lenovo ThinkPad E15 G3-20YG003UGE | |
| Dell Inspiron 15 3501 | |
| HP Pavilion x360 15-er0155ng | |
| LG Gram 15Z90P-G.AA89G | |
| AIDA64 / CPU Queen | |
| Asus VivoBook S15 D533UA | |
| Lenovo ThinkPad E15 G3-20YG003UGE | |
| Média da turma Office (22784 - 115197, n=67, últimos 2 anos) | |
| Schenker Work 15 Tiger Lake-H | |
| Média Intel Core i7-11370H (42086 - 52930, n=10) | |
| Dell Inspiron 15 3501 | |
| HP Pavilion x360 15-er0155ng | |
| LG Gram 15Z90P-G.AA89G | |
| AIDA64 / FPU SinJulia | |
| Asus VivoBook S15 D533UA | |
| Lenovo ThinkPad E15 G3-20YG003UGE | |
| Média da turma Office (1378 - 18321, n=83, últimos 2 anos) | |
| Schenker Work 15 Tiger Lake-H | |
| Média Intel Core i7-11370H (3755 - 5027, n=10) | |
| Dell Inspiron 15 3501 | |
| HP Pavilion x360 15-er0155ng | |
| LG Gram 15Z90P-G.AA89G | |
| AIDA64 / FPU Mandel | |
| Média da turma Office (4601 - 66922, n=83, últimos 2 anos) | |
| Asus VivoBook S15 D533UA | |
| Lenovo ThinkPad E15 G3-20YG003UGE | |
| Média Intel Core i7-11370H (14433 - 20417, n=10) | |
| Schenker Work 15 Tiger Lake-H | |
| Dell Inspiron 15 3501 | |
| HP Pavilion x360 15-er0155ng | |
| LG Gram 15Z90P-G.AA89G | |
| AIDA64 / CPU AES | |
| Schenker Work 15 Tiger Lake-H | |
| Média Intel Core i7-11370H (44267 - 76866, n=10) | |
| Dell Inspiron 15 3501 | |
| Asus VivoBook S15 D533UA | |
| Lenovo ThinkPad E15 G3-20YG003UGE | |
| HP Pavilion x360 15-er0155ng | |
| Média da turma Office (4854 - 155900, n=83, últimos 2 anos) | |
| LG Gram 15Z90P-G.AA89G | |
| AIDA64 / CPU ZLib | |
| Média da turma Office (114.6 - 1366, n=83, últimos 2 anos) | |
| Asus VivoBook S15 D533UA | |
| Lenovo ThinkPad E15 G3-20YG003UGE | |
| Schenker Work 15 Tiger Lake-H | |
| Média Intel Core i7-11370H (289 - 422, n=10) | |
| Dell Inspiron 15 3501 | |
| HP Pavilion x360 15-er0155ng | |
| LG Gram 15Z90P-G.AA89G | |
| AIDA64 / FP64 Ray-Trace | |
| Média da turma Office (1109 - 17834, n=83, últimos 2 anos) | |
| Asus VivoBook S15 D533UA | |
| Lenovo ThinkPad E15 G3-20YG003UGE | |
| Média Intel Core i7-11370H (2756 - 4551, n=10) | |
| Schenker Work 15 Tiger Lake-H | |
| Dell Inspiron 15 3501 | |
| HP Pavilion x360 15-er0155ng | |
| LG Gram 15Z90P-G.AA89G | |
| AIDA64 / CPU PhotoWorxx | |
| Média da turma Office (11090 - 65229, n=83, últimos 2 anos) | |
| LG Gram 15Z90P-G.AA89G | |
| Schenker Work 15 Tiger Lake-H | |
| Média Intel Core i7-11370H (15892 - 40069, n=10) | |
| HP Pavilion x360 15-er0155ng | |
| Dell Inspiron 15 3501 | |
| Asus VivoBook S15 D533UA | |
| Lenovo ThinkPad E15 G3-20YG003UGE | |
Desempenho do sistema
A Obra 15 da Schenker não compromete o desempenho do sistema. Um alto Boost e a generosa memória de trabalho de 32 GB permitem que o dispositivo de teste alcance um resultado ligeiramente acima da média no benchmark PCMark10. Assim, você obtém um dispositivo responsivo e poderoso para uso normal
| PCMark 10 / Score | |
| Média da turma Office (2601 - 9298, n=68, últimos 2 anos) | |
| Schenker Work 15 Tiger Lake-H | |
| Lenovo ThinkPad E15 G3-20YG003UGE | |
| Asus VivoBook S15 D533UA | |
| Média Intel Core i7-11370H, Intel Iris Xe Graphics G7 96EUs (5199 - 5459, n=6) | |
| Dell Inspiron 15 3501 | |
| LG Gram 15Z90P-G.AA89G | |
| HP Pavilion x360 15-er0155ng | |
| PCMark 10 / Essentials | |
| Schenker Work 15 Tiger Lake-H | |
| Média Intel Core i7-11370H, Intel Iris Xe Graphics G7 96EUs (9996 - 10650, n=6) | |
| Média da turma Office (3245 - 11594, n=68, últimos 2 anos) | |
| LG Gram 15Z90P-G.AA89G | |
| Dell Inspiron 15 3501 | |
| HP Pavilion x360 15-er0155ng | |
| Lenovo ThinkPad E15 G3-20YG003UGE | |
| Asus VivoBook S15 D533UA | |
| PCMark 10 / Productivity | |
| Média da turma Office (5336 - 17243, n=68, últimos 2 anos) | |
| Lenovo ThinkPad E15 G3-20YG003UGE | |
| Asus VivoBook S15 D533UA | |
| Média Intel Core i7-11370H, Intel Iris Xe Graphics G7 96EUs (6911 - 7388, n=6) | |
| Schenker Work 15 Tiger Lake-H | |
| Dell Inspiron 15 3501 | |
| LG Gram 15Z90P-G.AA89G | |
| HP Pavilion x360 15-er0155ng | |
| PCMark 10 / Digital Content Creation | |
| Média da turma Office (2049 - 13541, n=68, últimos 2 anos) | |
| Schenker Work 15 Tiger Lake-H | |
| Média Intel Core i7-11370H, Intel Iris Xe Graphics G7 96EUs (5483 - 5838, n=6) | |
| Asus VivoBook S15 D533UA | |
| Lenovo ThinkPad E15 G3-20YG003UGE | |
| Dell Inspiron 15 3501 | |
| LG Gram 15Z90P-G.AA89G | |
| HP Pavilion x360 15-er0155ng | |
| PCMark 10 Score | 5415 pontos | |
Ajuda | ||
| AIDA64 / Memory Copy | |
| Média da turma Office (20075 - 110930, n=80, últimos 2 anos) | |
| LG Gram 15Z90P-G.AA89G | |
| Schenker Work 15 Tiger Lake-H | |
| Média Intel Core i7-11370H (32035 - 64524, n=10) | |
| HP Pavilion x360 15-er0155ng | |
| Asus VivoBook S15 D533UA | |
| Lenovo ThinkPad E15 G3-20YG003UGE | |
| Dell Inspiron 15 3501 | |
| AIDA64 / Memory Read | |
| Média da turma Office (10084 - 128030, n=81, últimos 2 anos) | |
| LG Gram 15Z90P-G.AA89G | |
| Schenker Work 15 Tiger Lake-H | |
| Média Intel Core i7-11370H (37216 - 62417, n=10) | |
| HP Pavilion x360 15-er0155ng | |
| Asus VivoBook S15 D533UA | |
| Lenovo ThinkPad E15 G3-20YG003UGE | |
| Dell Inspiron 15 3501 | |
| AIDA64 / Memory Write | |
| Média da turma Office (20073 - 119858, n=81, últimos 2 anos) | |
| LG Gram 15Z90P-G.AA89G | |
| Média Intel Core i7-11370H (36920 - 65610, n=10) | |
| Schenker Work 15 Tiger Lake-H | |
| HP Pavilion x360 15-er0155ng | |
| Asus VivoBook S15 D533UA | |
| Lenovo ThinkPad E15 G3-20YG003UGE | |
| Dell Inspiron 15 3501 | |
| AIDA64 / Memory Latency | |
| LG Gram 15Z90P-G.AA89G | |
| Média da turma Office (7.6 - 162.9, n=76, últimos 2 anos) | |
| Lenovo ThinkPad E15 G3-20YG003UGE | |
| Asus VivoBook S15 D533UA | |
| Dell Inspiron 15 3501 | |
| Média Intel Core i7-11370H (73.4 - 103, n=10) | |
| Schenker Work 15 Tiger Lake-H | |
| HP Pavilion x360 15-er0155ng | |
* ... menor é melhor
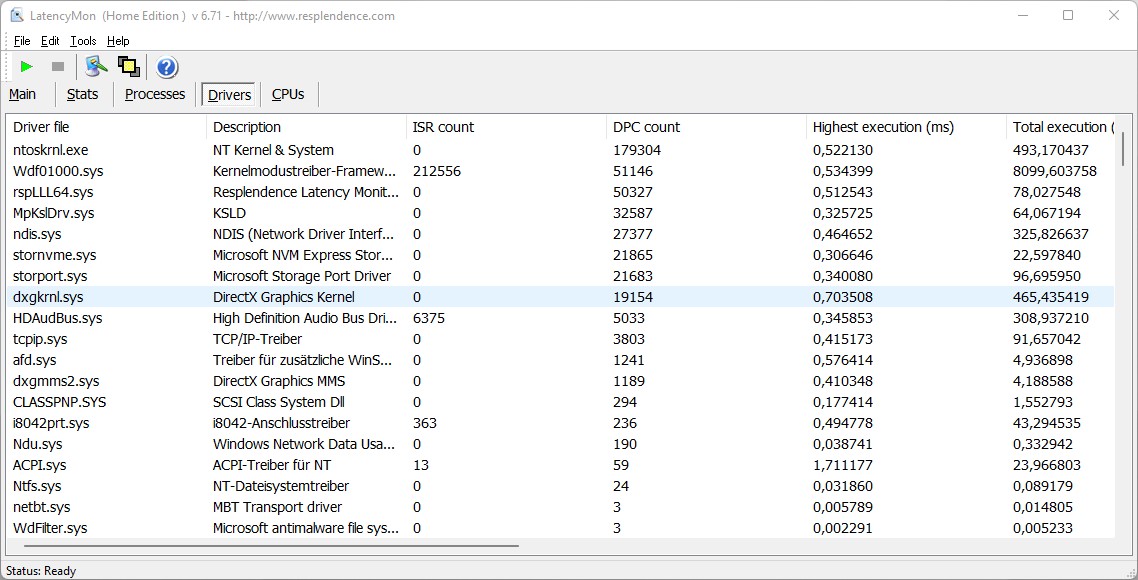
Latência do DPC
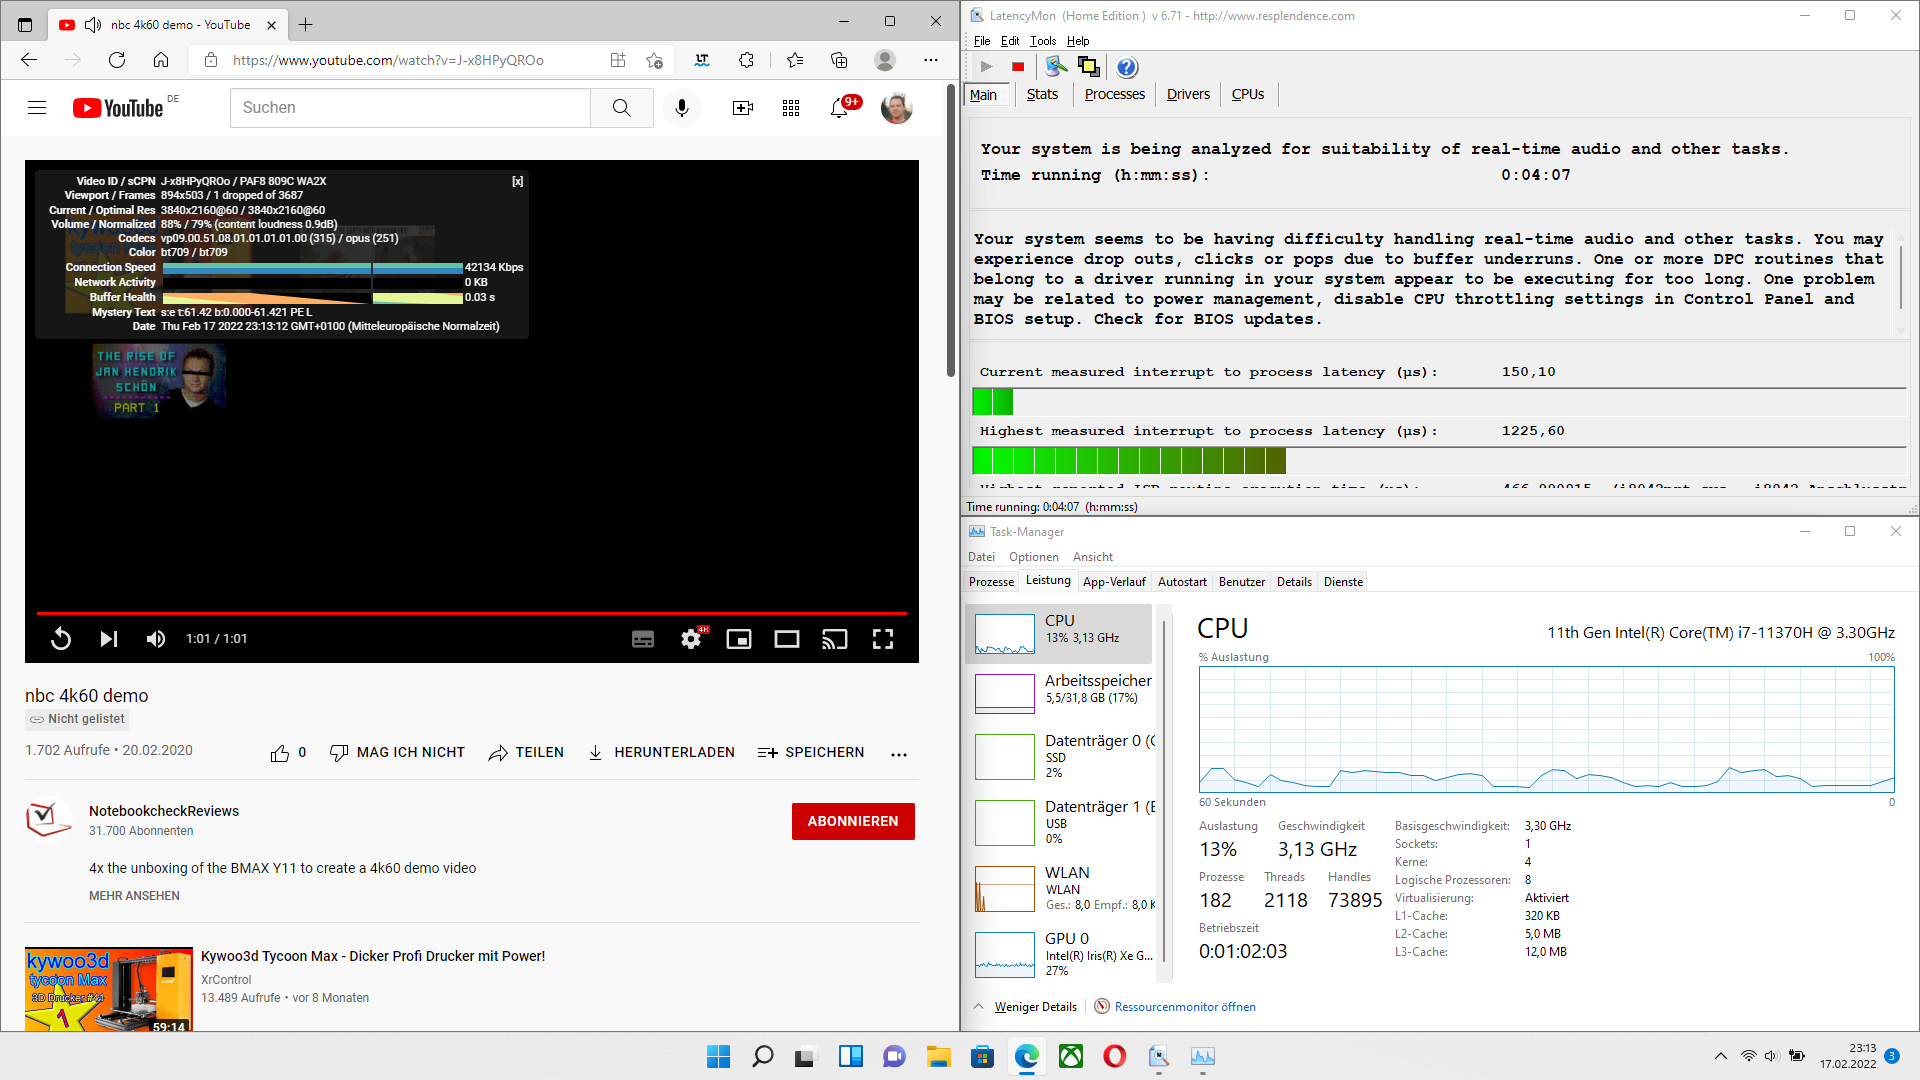
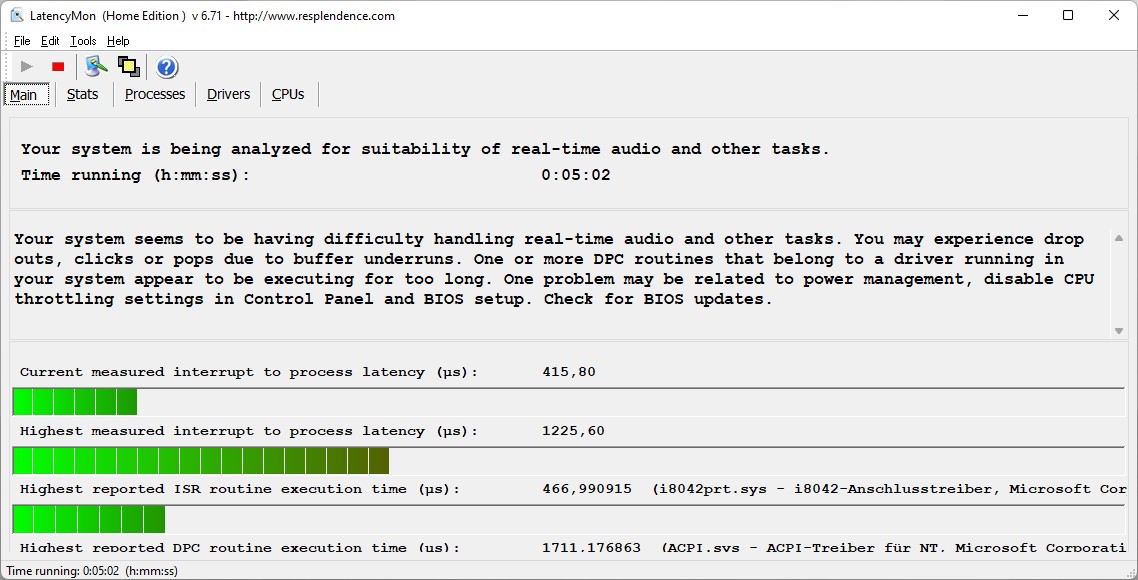
Com umLatência do DPC de mais de um milissegundo, a Obra Schenker 15 não está sozinha no campo de comparação. Este valor, longe de ser bom, reflete os problemas de muitos laptops atuais, mas isto pode flutuar muito com as atualizações dos drivers.
| DPC Latencies / LatencyMon - interrupt to process latency (max), Web, Youtube, Prime95 | |
| LG Gram 15Z90P-G.AA89G | |
| Schenker Work 15 Tiger Lake-H | |
| Dell Inspiron 15 3501 | |
| Lenovo ThinkPad E15 G3-20YG003UGE | |
| Asus VivoBook S15 D533UA | |
* ... menor é melhor
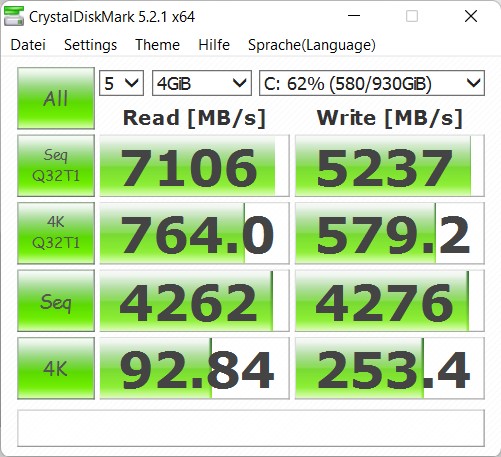
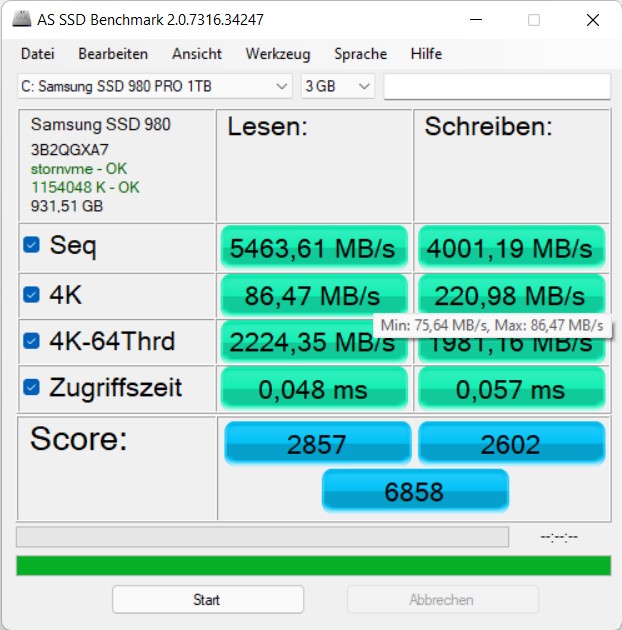
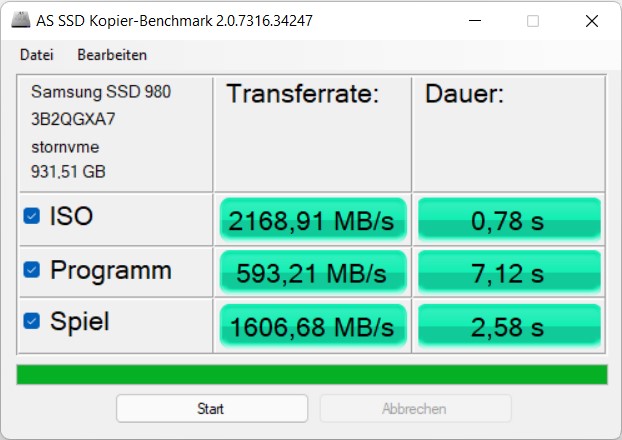
Armazenamento em massa
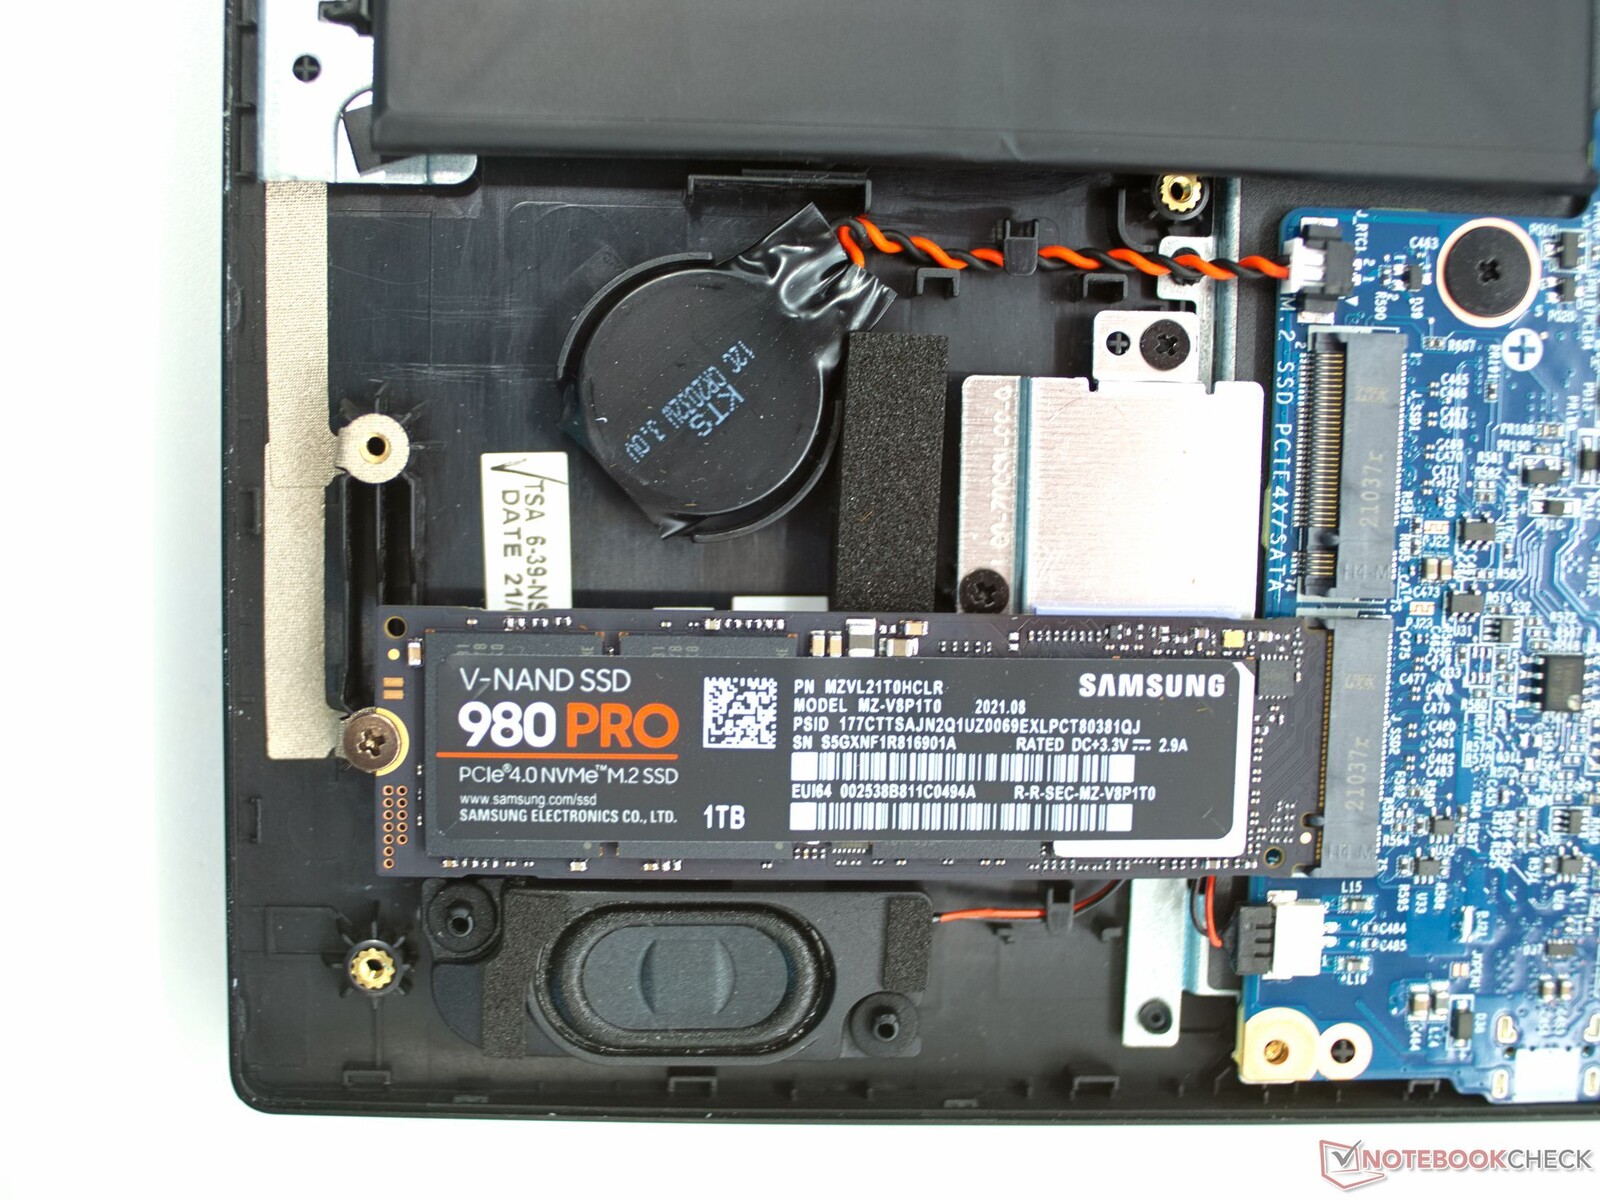
O Samsung 980 Pro com 1 TB de espaço de armazenamento é uma das opções de armazenamento mais rápidas, de acordo com nossa tabela de referência de SSDs e HDDs. A SSD funciona em alta velocidade esperada no laptop Schenker graças à PCIe 4.0 (o segundo slot M.2 usa uma interface PCIe 3.0 x4).

* ... menor é melhor
Dauerleistung Lesen: DiskSpd Read Loop, Queue Depth 8
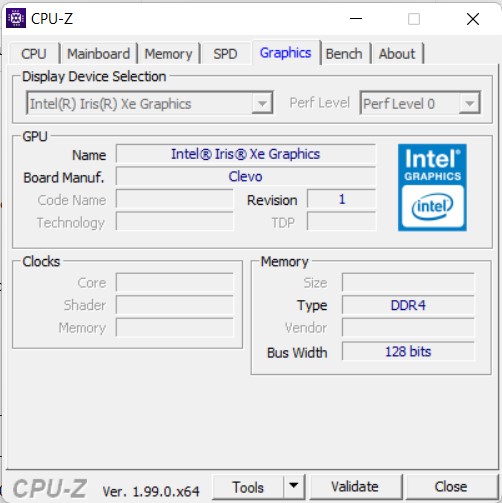
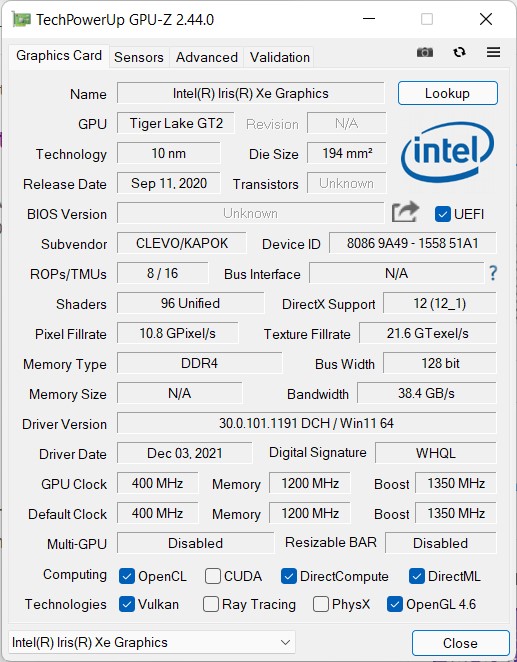
Placa gráfica
Com o Intel Iris Xe Graphics G7 com 96EUs o Schenker Work 15 não se torna um laptop para jogos, mas o notebook de escritório ainda pode render muitos jogos sem problemas. O notebook também fornece notas bastante boas nos 3DMark benchmarks, especialmente porque o iGPU tem muita memória de trabalho à sua disposição. Se você precisar de mais potência gráfica, você pode conectar uma placa gráfica externa através da porta Thunderbolt 4.
| 3DMark 06 Standard Score | 27110 pontos | |
| 3DMark Ice Storm Standard Score | 72531 pontos | |
| 3DMark Fire Strike Score | 4450 pontos | |
| 3DMark Time Spy Score | 1774 pontos | |
Ajuda | ||
| The Witcher 3 | |
| 1366x768 Medium Graphics & Postprocessing | |
| Média da turma Office (44.7 - 90.4, n=3, últimos 2 anos) | |
| Schenker Work 15 Tiger Lake-H | |
| Média Intel Iris Xe Graphics G7 96EUs (21.4 - 77.8, n=185) | |
| Dell Inspiron 15 3501 | |
| Asus VivoBook S15 D533UA | |
| LG Gram 15Z90P-G.AA89G | |
| 1920x1080 High Graphics & Postprocessing (Nvidia HairWorks Off) | |
| Média da turma Office (23.7 - 53.4, n=3, últimos 2 anos) | |
| Média Intel Iris Xe Graphics G7 96EUs (10.6 - 45.9, n=191) | |
| Schenker Work 15 Tiger Lake-H | |
| Lenovo ThinkPad E15 G3-20YG003UGE | |
| Asus VivoBook S15 D533UA | |
| LG Gram 15Z90P-G.AA89G | |
| Dell Inspiron 15 3501 | |
| F1 2021 | |
| 1920x1080 Medium Preset AA:T AF:16x | |
| Schenker Work 15 Tiger Lake-H | |
| Média Intel Iris Xe Graphics G7 96EUs (29.4 - 64.9, n=45) | |
| Lenovo ThinkPad E15 G3-20YG003UGE | |
| 1920x1080 High Preset AA:T AF:16x | |
| Schenker Work 15 Tiger Lake-H | |
| Média Intel Iris Xe Graphics G7 96EUs (24 - 50.8, n=45) | |
| Lenovo ThinkPad E15 G3-20YG003UGE | |
Witcher 3 FPS-Diagramm
| baixo | média | alto | ultra | |
|---|---|---|---|---|
| GTA V (2015) | 92 | 73.2 | 24.7 | 10.1 |
| The Witcher 3 (2015) | 91.2 | 59.2 | 22 | 12.6 |
| Dota 2 Reborn (2015) | 120 | 70 | 47 | 47.2 |
| X-Plane 11.11 (2018) | 40 | 34 | 30.4 | |
| Far Cry 5 (2018) | 47 | 25 | 22 | |
| Strange Brigade (2018) | 87 | 36.9 | 29.9 | 24.4 |
| F1 2021 (2021) | 99.1 | 48.2 | 38.1 | 26.9 |
Emissões e energia: Alto mas frio
Emissões sonoras
Com emissões sonoras em torno de 45 dB(A), o Schenker Work 15 não é realmente silencioso sob carga e é quase irritantemente barulhento. Entretanto, o ventilador permanece abaixo do limite de percepção ou pode desligar-se completamente, dependendo do modo de potência definido. Os ventiladores não produzem frequências desagradavelmente altas em nenhum caso.
Barulho
| Ocioso |
| 24.4 / 24.4 / 26.7 dB |
| Carga |
| 43.8 / 44.8 dB |
 | ||
30 dB silencioso 40 dB(A) audível 50 dB(A) ruidosamente alto |
||
min: | ||
| Schenker Work 15 Tiger Lake-H Iris Xe G7 96EUs, i7-11370H, Samsung SSD 980 Pro 1TB MZ-V8P1T0BW | LG Gram 15Z90P-G.AA89G Iris Xe G7 96EUs, i7-1165G7, SK Hynix HFM001TD3JX013N | Dell Inspiron 15 3501 Iris Xe G7 96EUs, i7-1165G7, Samsung PM991a MZ9LQ512HBLU-00BD1 | Lenovo ThinkPad E15 G3-20YG003UGE Vega 8, R7 5700U, SK Hynix PC711 1TB HFS001TDE9X084N | Asus VivoBook S15 D533UA Vega 8, R7 5700U, WDC PC SN530 SDBPNPZ-1T00 | HP Pavilion x360 15-er0155ng Iris Xe G7 80EUs, i5-1135G7, WDC PC SN530 SDBPNPZ-512G | |
|---|---|---|---|---|---|---|
| Noise | 8% | 3% | 8% | -5% | 2% | |
| desligado / ambiente * (dB) | 24.4 | 25 -2% | 26 -7% | 23.8 2% | 26 -7% | 26 -7% |
| Idle Minimum * (dB) | 24.4 | 25 -2% | 26 -7% | 23.8 2% | 26 -7% | 26 -7% |
| Idle Average * (dB) | 24.4 | 25 -2% | 26 -7% | 23.8 2% | 26 -7% | 26 -7% |
| Idle Maximum * (dB) | 26.7 | 26.7 -0% | 26 3% | 28 -5% | 28.8 -8% | 26 3% |
| Load Average * (dB) | 43.8 | 32.2 26% | 35.9 18% | 32.9 25% | 45 -3% | 35.1 20% |
| Witcher 3 ultra * (dB) | 43.8 | |||||
| Load Maximum * (dB) | 44.8 | 32.4 28% | 35.8 20% | 35 22% | 45 -0% | 39.6 12% |
* ... menor é melhor
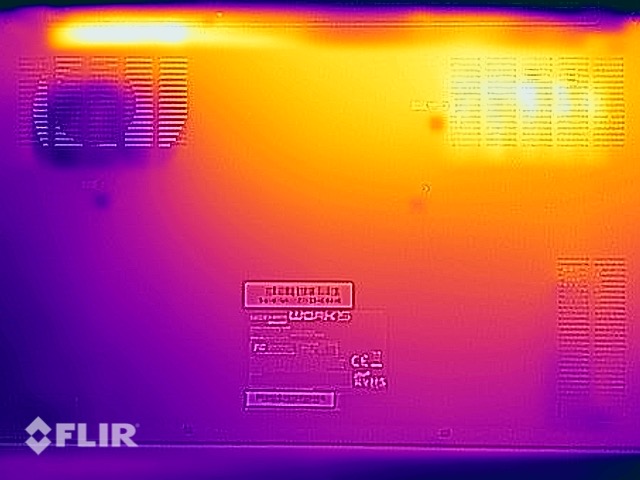
Temperatura
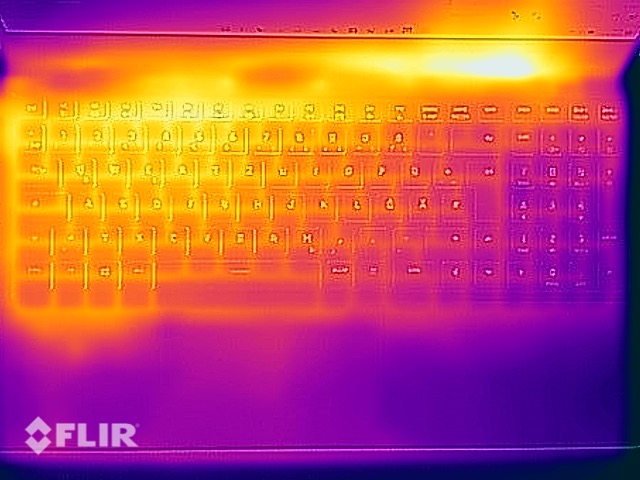
A temperatura da superfície do laptop mal está acima da temperatura do corpo humano no teste de estresse. O lado inferior fica visivelmente mais quente que o lado superior, mas os apoios das palmas permanecem sempre relativamente frios
No teste de estresse, o laptop pode manter o desempenho definido através do Centro de Controle a longo prazo. Assim, o laptop de escritório mostra uma grande resistência. Entretanto, é perceptível que pequenas flutuações do PL1 ocorrem no modo Entretenimento.
(+) A temperatura máxima no lado superior é 39.1 °C / 102 F, em comparação com a média de 34.3 °C / 94 F , variando de 21.2 a 62.5 °C para a classe Office.
(±) A parte inferior aquece até um máximo de 43.4 °C / 110 F, em comparação com a média de 36.8 °C / 98 F
(+) Em uso inativo, a temperatura média para o lado superior é 23.6 °C / 74 F, em comparação com a média do dispositivo de 29.5 °C / ### class_avg_f### F.
(+) Jogando The Witcher 3, a temperatura média para o lado superior é 31.6 °C / 89 F, em comparação com a média do dispositivo de 29.5 °C / ## #class_avg_f### F.
(+) Os apoios para as mãos e o touchpad são mais frios que a temperatura da pele, com um máximo de 29 °C / 84.2 F e, portanto, são frios ao toque.
(±) A temperatura média da área do apoio para as mãos de dispositivos semelhantes foi 27.5 °C / 81.5 F (-1.5 °C / -2.7 F).
| Schenker Work 15 Tiger Lake-H Intel Core i7-11370H, Intel Iris Xe Graphics G7 96EUs | LG Gram 15Z90P-G.AA89G Intel Core i7-1165G7, Intel Iris Xe Graphics G7 96EUs | Dell Inspiron 15 3501 Intel Core i7-1165G7, Intel Iris Xe Graphics G7 96EUs | Lenovo ThinkPad E15 G3-20YG003UGE AMD Ryzen 7 5700U, AMD Radeon RX Vega 8 (Ryzen 4000/5000) | Asus VivoBook S15 D533UA AMD Ryzen 7 5700U, AMD Radeon RX Vega 8 (Ryzen 4000/5000) | HP Pavilion x360 15-er0155ng Intel Core i5-1135G7, Intel Iris Xe Graphics G7 80EUs | |
|---|---|---|---|---|---|---|
| Heat | -1% | -11% | -20% | -13% | -5% | |
| Maximum Upper Side * (°C) | 39.1 | 42.9 -10% | 45.6 -17% | 46.4 -19% | 46.1 -18% | 39.9 -2% |
| Maximum Bottom * (°C) | 43.4 | 39.4 9% | 41 6% | 60.9 -40% | 46.6 -7% | 43.1 1% |
| Idle Upper Side * (°C) | 24.3 | 25.4 -5% | 28.2 -16% | 26.5 -9% | 27.4 -13% | 26.3 -8% |
| Idle Bottom * (°C) | 25.1 | 24.9 1% | 29.1 -16% | 27.5 -10% | 28.2 -12% | 27.4 -9% |
* ... menor é melhor
Alto-falante
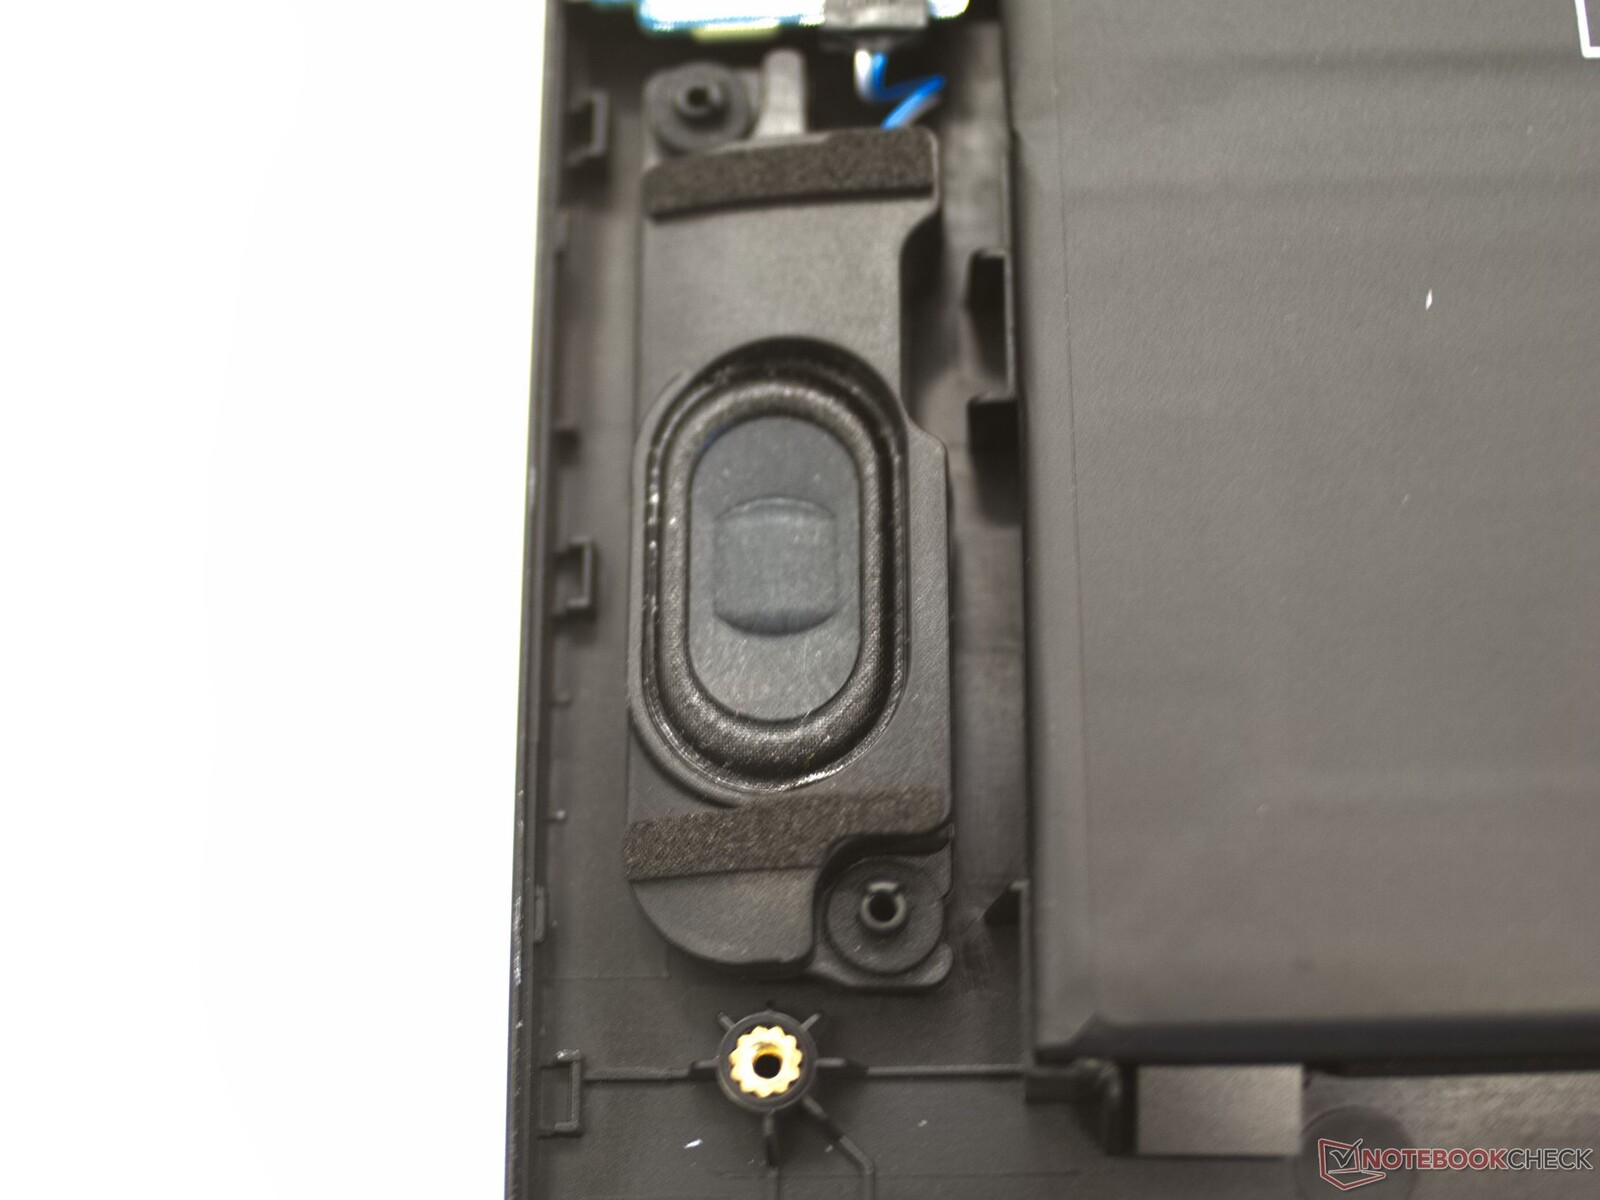
Os pequenos alto-falantes do Schenker Work 15 são suficientes para um laptop de escritório. Entretanto, devido a uma reprodução menos linear de diferentes freqüências e à falta de graves e sub-baixos, o som se apresenta como muito metálico.
Schenker Work 15 Tiger Lake-H análise de áudio
(+) | os alto-falantes podem tocar relativamente alto (###valor### dB)
Graves 100 - 315Hz
(-) | quase nenhum baixo - em média 27.2% menor que a mediana
(+) | o baixo é linear (6.5% delta para a frequência anterior)
Médios 400 - 2.000 Hz
(±) | médios mais altos - em média 10.1% maior que a mediana
(-) | médios não são lineares (15.1% delta para frequência anterior)
Altos 2 - 16 kHz
(+) | agudos equilibrados - apenas 4.1% longe da mediana
(+) | os máximos são lineares (6.9% delta da frequência anterior)
Geral 100 - 16.000 Hz
(±) | a linearidade do som geral é média (28.8% diferença em relação à mediana)
Comparado com a mesma classe
» 89% de todos os dispositivos testados nesta classe foram melhores, 2% semelhantes, 8% piores
» O melhor teve um delta de 7%, a média foi 21%, o pior foi 53%
Comparado com todos os dispositivos testados
» 86% de todos os dispositivos testados foram melhores, 3% semelhantes, 11% piores
» O melhor teve um delta de 4%, a média foi 23%, o pior foi 134%
LG Gram 15Z90P-G.AA89G análise de áudio
(+) | os alto-falantes podem tocar relativamente alto (###valor### dB)
Graves 100 - 315Hz
(-) | quase nenhum baixo - em média 19.7% menor que a mediana
(±) | a linearidade dos graves é média (13.4% delta para a frequência anterior)
Médios 400 - 2.000 Hz
(+) | médios equilibrados - apenas 2.1% longe da mediana
(+) | médios são lineares (3.7% delta para frequência anterior)
Altos 2 - 16 kHz
(±) | máximos mais altos - em média 7.4% maior que a mediana
(±) | a linearidade dos máximos é média (7.7% delta para frequência anterior)
Geral 100 - 16.000 Hz
(±) | a linearidade do som geral é média (16.6% diferença em relação à mediana)
Comparado com a mesma classe
» 43% de todos os dispositivos testados nesta classe foram melhores, 6% semelhantes, 51% piores
» O melhor teve um delta de 5%, a média foi 18%, o pior foi 53%
Comparado com todos os dispositivos testados
» 29% de todos os dispositivos testados foram melhores, 6% semelhantes, 65% piores
» O melhor teve um delta de 4%, a média foi 23%, o pior foi 134%
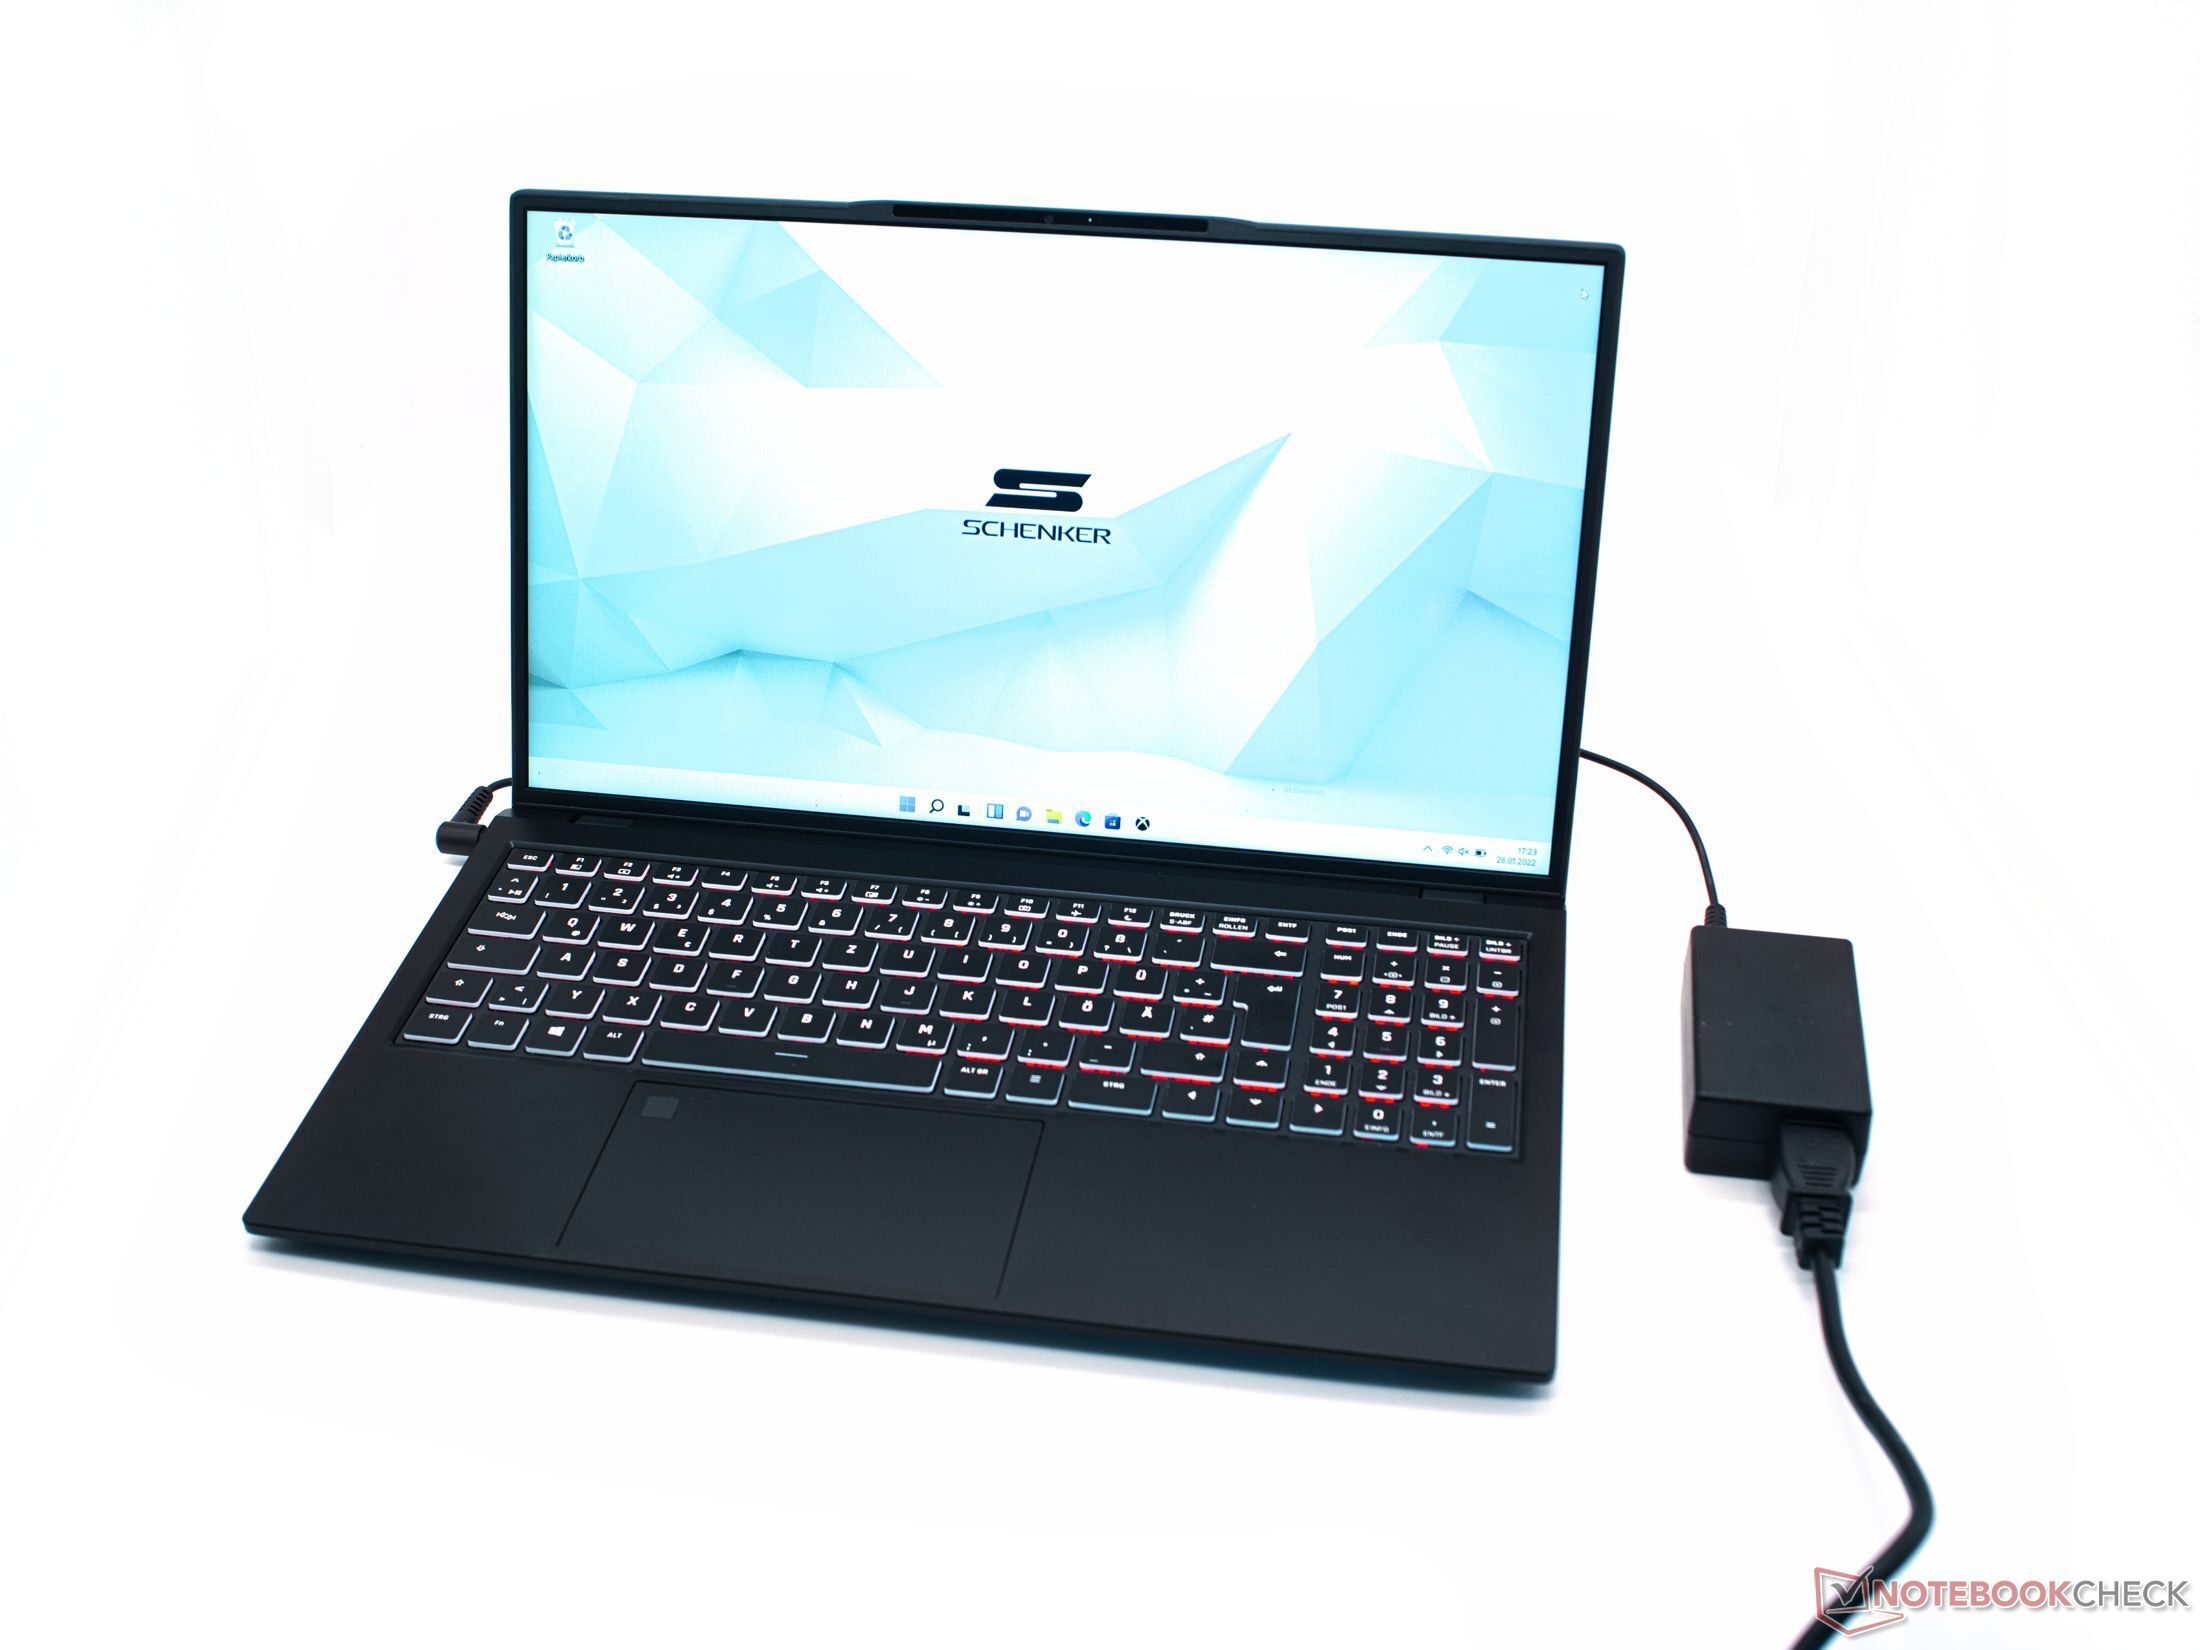
Gerenciamento de energia: Longos tempos de funcionamento da bateria
Absorção de energia
Com uma média de 8 W de consumo de energia ociosa, o laptop da Schenker é bastante economizador de energia. Sob carga, porém, ele também pode utilizar totalmente o limite de 65 W da fonte de energia incluída por vários minutos. Com um consumo máximo medido de 69,4 W, a fonte de energia é praticamente suficiente.
| desligado | |
| Ocioso | |
| Carga |
|
Key:
min: | |
Energieaufnahme Witcher 3 / Stresstest
Power consumption with external monitor
Duração da bateria
A bateria de íon-lítio de 74 Whr de dupla célula permite tempos de funcionamento relativamente longos para a Schenker Work 15. Oito a 10 horas em nosso prático teste de navegação na web Wi-Fi também deve resultar em tempos de trabalho correspondentemente longos no mundo real. Mesmo sob carga, os tempos de funcionamento são relativamente longos, mas com a restrição de que a potência de computação disponível é significativamente menor do que na operação da rede elétrica.
| Schenker Work 15 Tiger Lake-H i7-11370H, Iris Xe G7 96EUs, 73 Wh | LG Gram 15Z90P-G.AA89G i7-1165G7, Iris Xe G7 96EUs, 80 Wh | Dell Inspiron 15 3501 i7-1165G7, Iris Xe G7 96EUs, 42 Wh | Lenovo ThinkPad E15 G3-20YG003UGE R7 5700U, Vega 8, 57 Wh | Asus VivoBook S15 D533UA R7 5700U, Vega 8, 50 Wh | Média da turma Office | |
|---|---|---|---|---|---|---|
| Duração da bateria | 41% | -33% | -2% | -12% | 18% | |
| Reader / Idle (h) | 24.5 | 26 6% | 24.5 ? 0% | |||
| H.264 (h) | 9.6 | 15.5 ? 61% | ||||
| WiFi v1.3 (h) | 10.2 | 13.7 34% | 6.8 -33% | 10 -2% | 9 -12% | 13.2 ? 29% |
| Load (h) | 2.2 | 4 82% | 1.808 ? -18% |
Pro
Contra
Veredicto: Excitantes opções de configuração com potencial de economia
Um excelente teclado, longos tempos de bateria e muitas portas fazem do Schenker Work 15 um excelente laptop de escritório. Entretanto, o bom desempenho do Intel Core i7-11370H é acompanhado por um nível de ruído relativamente alto. Muitas opções de configuração em software e hardware permitem aos compradores adaptar o notebook às suas próprias necessidades
As aplicações de Internet e escritório, assim como muitos jogos, não representam um grande desafio para a APU. O notebook não apresenta nenhuma fraqueza importante. Somente a tela poderia ser um pouco melhor, mas é adequada para um dispositivo de escritório
O Schenker Work 15 é um laptop de escritório incomum com muitas opções de configuração
Os usuários que não querem pagar o alto preço de compra podem economizar muito dinheiro no configurador com uma i5 e menos memória de trabalho. Presumivelmente, o Core i5-11300H ligeiramente mais fraco não deve ter um impacto negativo significativo sobre o desempenho computacional. Entretanto, o preço de compra também pode ser reduzido em alguns euros, escolhendo um período de garantia mais curto ou uma SSD diferente.
Preço e disponibilidade
A Obra 15 Schenker está disponível no fabricante em várias configurações a partir de 927 euros.
Schenker Work 15 Tiger Lake-H
- 02/18/2022 v7 (old)
Marc Herter
Price comparison
