Schenker Work 17 laptop em revisão: Tela grande e um teclado colorido

Hardware poderoso que vem com muitas características personalizáveis é provavelmente o conceito central por trás dos laptops Schenker. O fabricante alemão oferece laptops que atendem a todas as exigências. O Work 17 é um laptop de escritório que vem com muitas opções de memória e armazenamento. Há também vários layouts de teclado disponíveis, e o período de garantia pode ser definido para dois ou três anos.
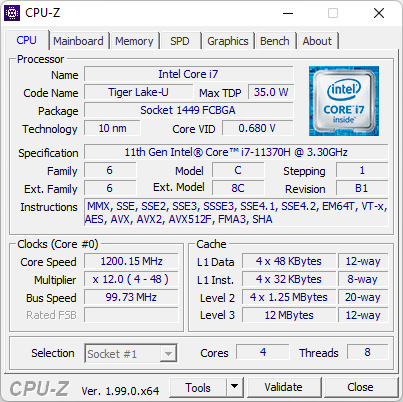
Nossa amostra de revisão está equipada com 32 GB de RAM, Intel Core i7-11370H e 1 TB NVMe SSD. Sem licença do Windows, esta configuração é de cerca de 1.470 Euros. A configuração mais acessível atualmente disponível é de cerca de 1.180 Euros (~$1.273)
Os laptops de escritório de grande formato são raros hoje em dia, portanto aLG Gram 17e o Acer Aspire 5 estão entre os contendores. Se você preferir algo menor, oSchenker Work 15 poderia ser uma alternativa.
Atualização 17.04..: Repetimos o teste de bateria no modo Performance com a nova BIOS. Todos os detalhes estão disponíveis na seção referente à vida útil da bateria.
Possíveis concorrentes em comparação
Avaliação | Data | Modelo | Peso | Altura | Size | Resolução | Preço |
|---|---|---|---|---|---|---|---|
| 84.3 % v7 (old) | 04/2022 | Schenker Work 17 Tiger Lake-H i7-11370H, Iris Xe G7 96EUs | 2.3 kg | 19.8 mm | 17.30" | 1920x1080 | |
| 86.7 % v7 (old) | 09/2021 | LG Gram 17Z90P-G.AA56G i5-1135G7, Iris Xe G7 80EUs | 1.4 kg | 17.8 mm | 17.00" | 2560x1600 | |
| 82.7 % v7 (old) | 03/2021 | Acer Aspire 5 A517-52G-79Z5 i7-1165G7, GeForce MX350 | 2.2 kg | 19.9 mm | 17.30" | 1920x1080 | |
| 76.4 % v7 (old) | Acer Aspire 3 A317-51G-72MD i7-10510U, GeForce MX250 | 2.8 kg | 24.65 mm | 17.30" | 1920x1080 | ||
| 75.9 % v7 (old) | 04/2022 | Dell Inspiron 15 3505-PXHPW R5 3450U, Vega 8 | 2 kg | 19.89 mm | 15.60" | 1920x1080 | |
| 84.3 % v7 (old) | 02/2022 | Schenker Work 15 Tiger Lake-H i7-11370H, Iris Xe G7 96EUs | 1.7 kg | 19.9 mm | 15.60" | 1920x1080 |
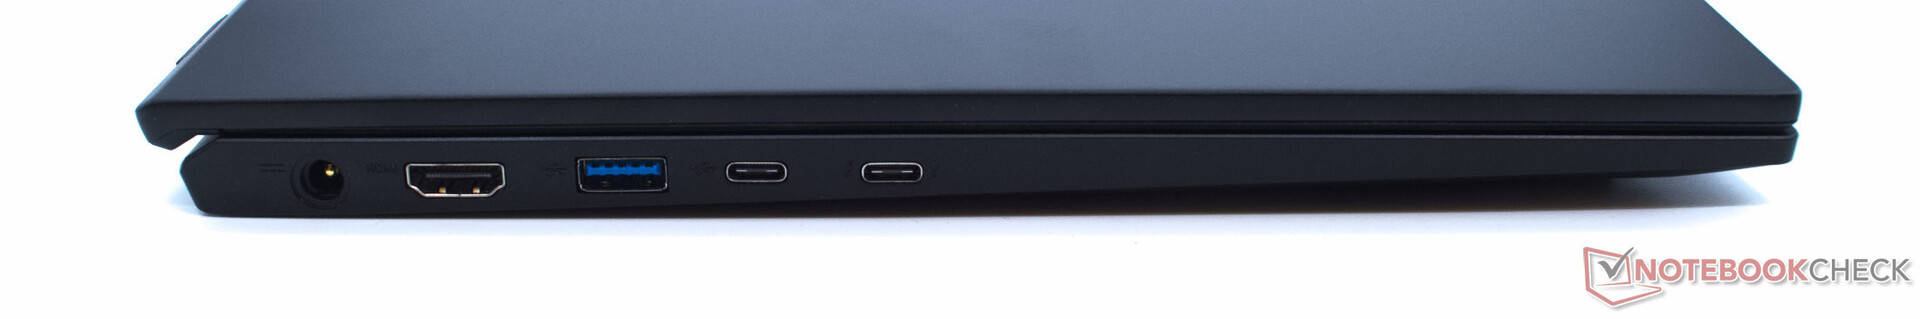
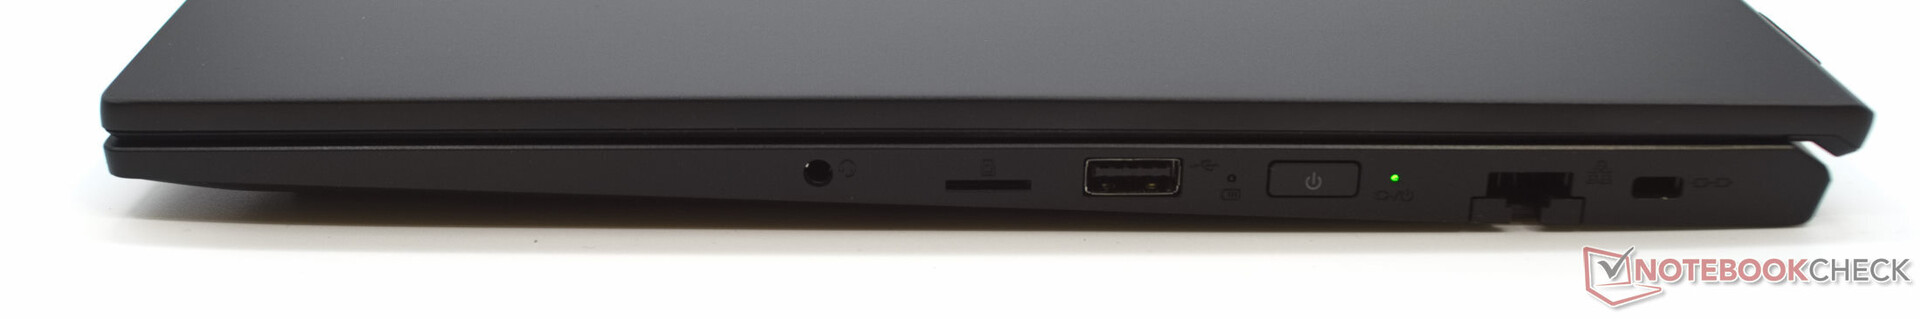
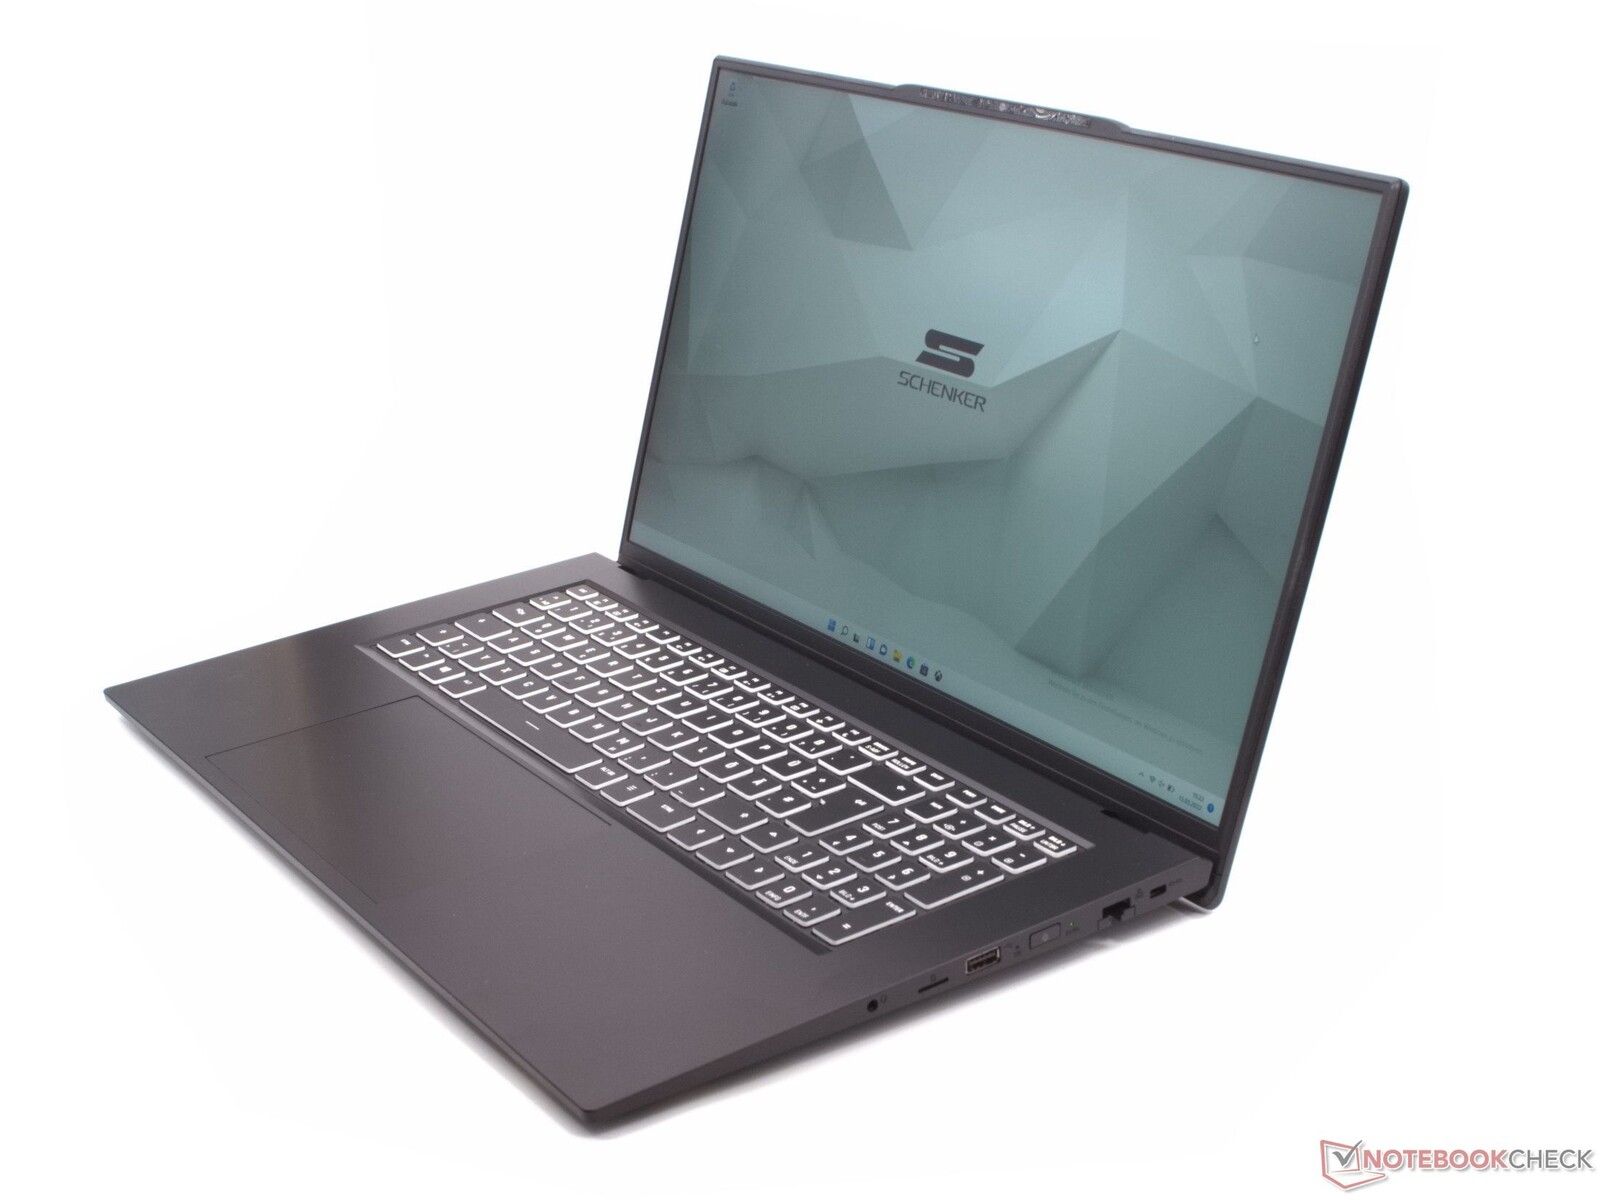
Caixa e conectividade - Alumínio resistente e muitos portos
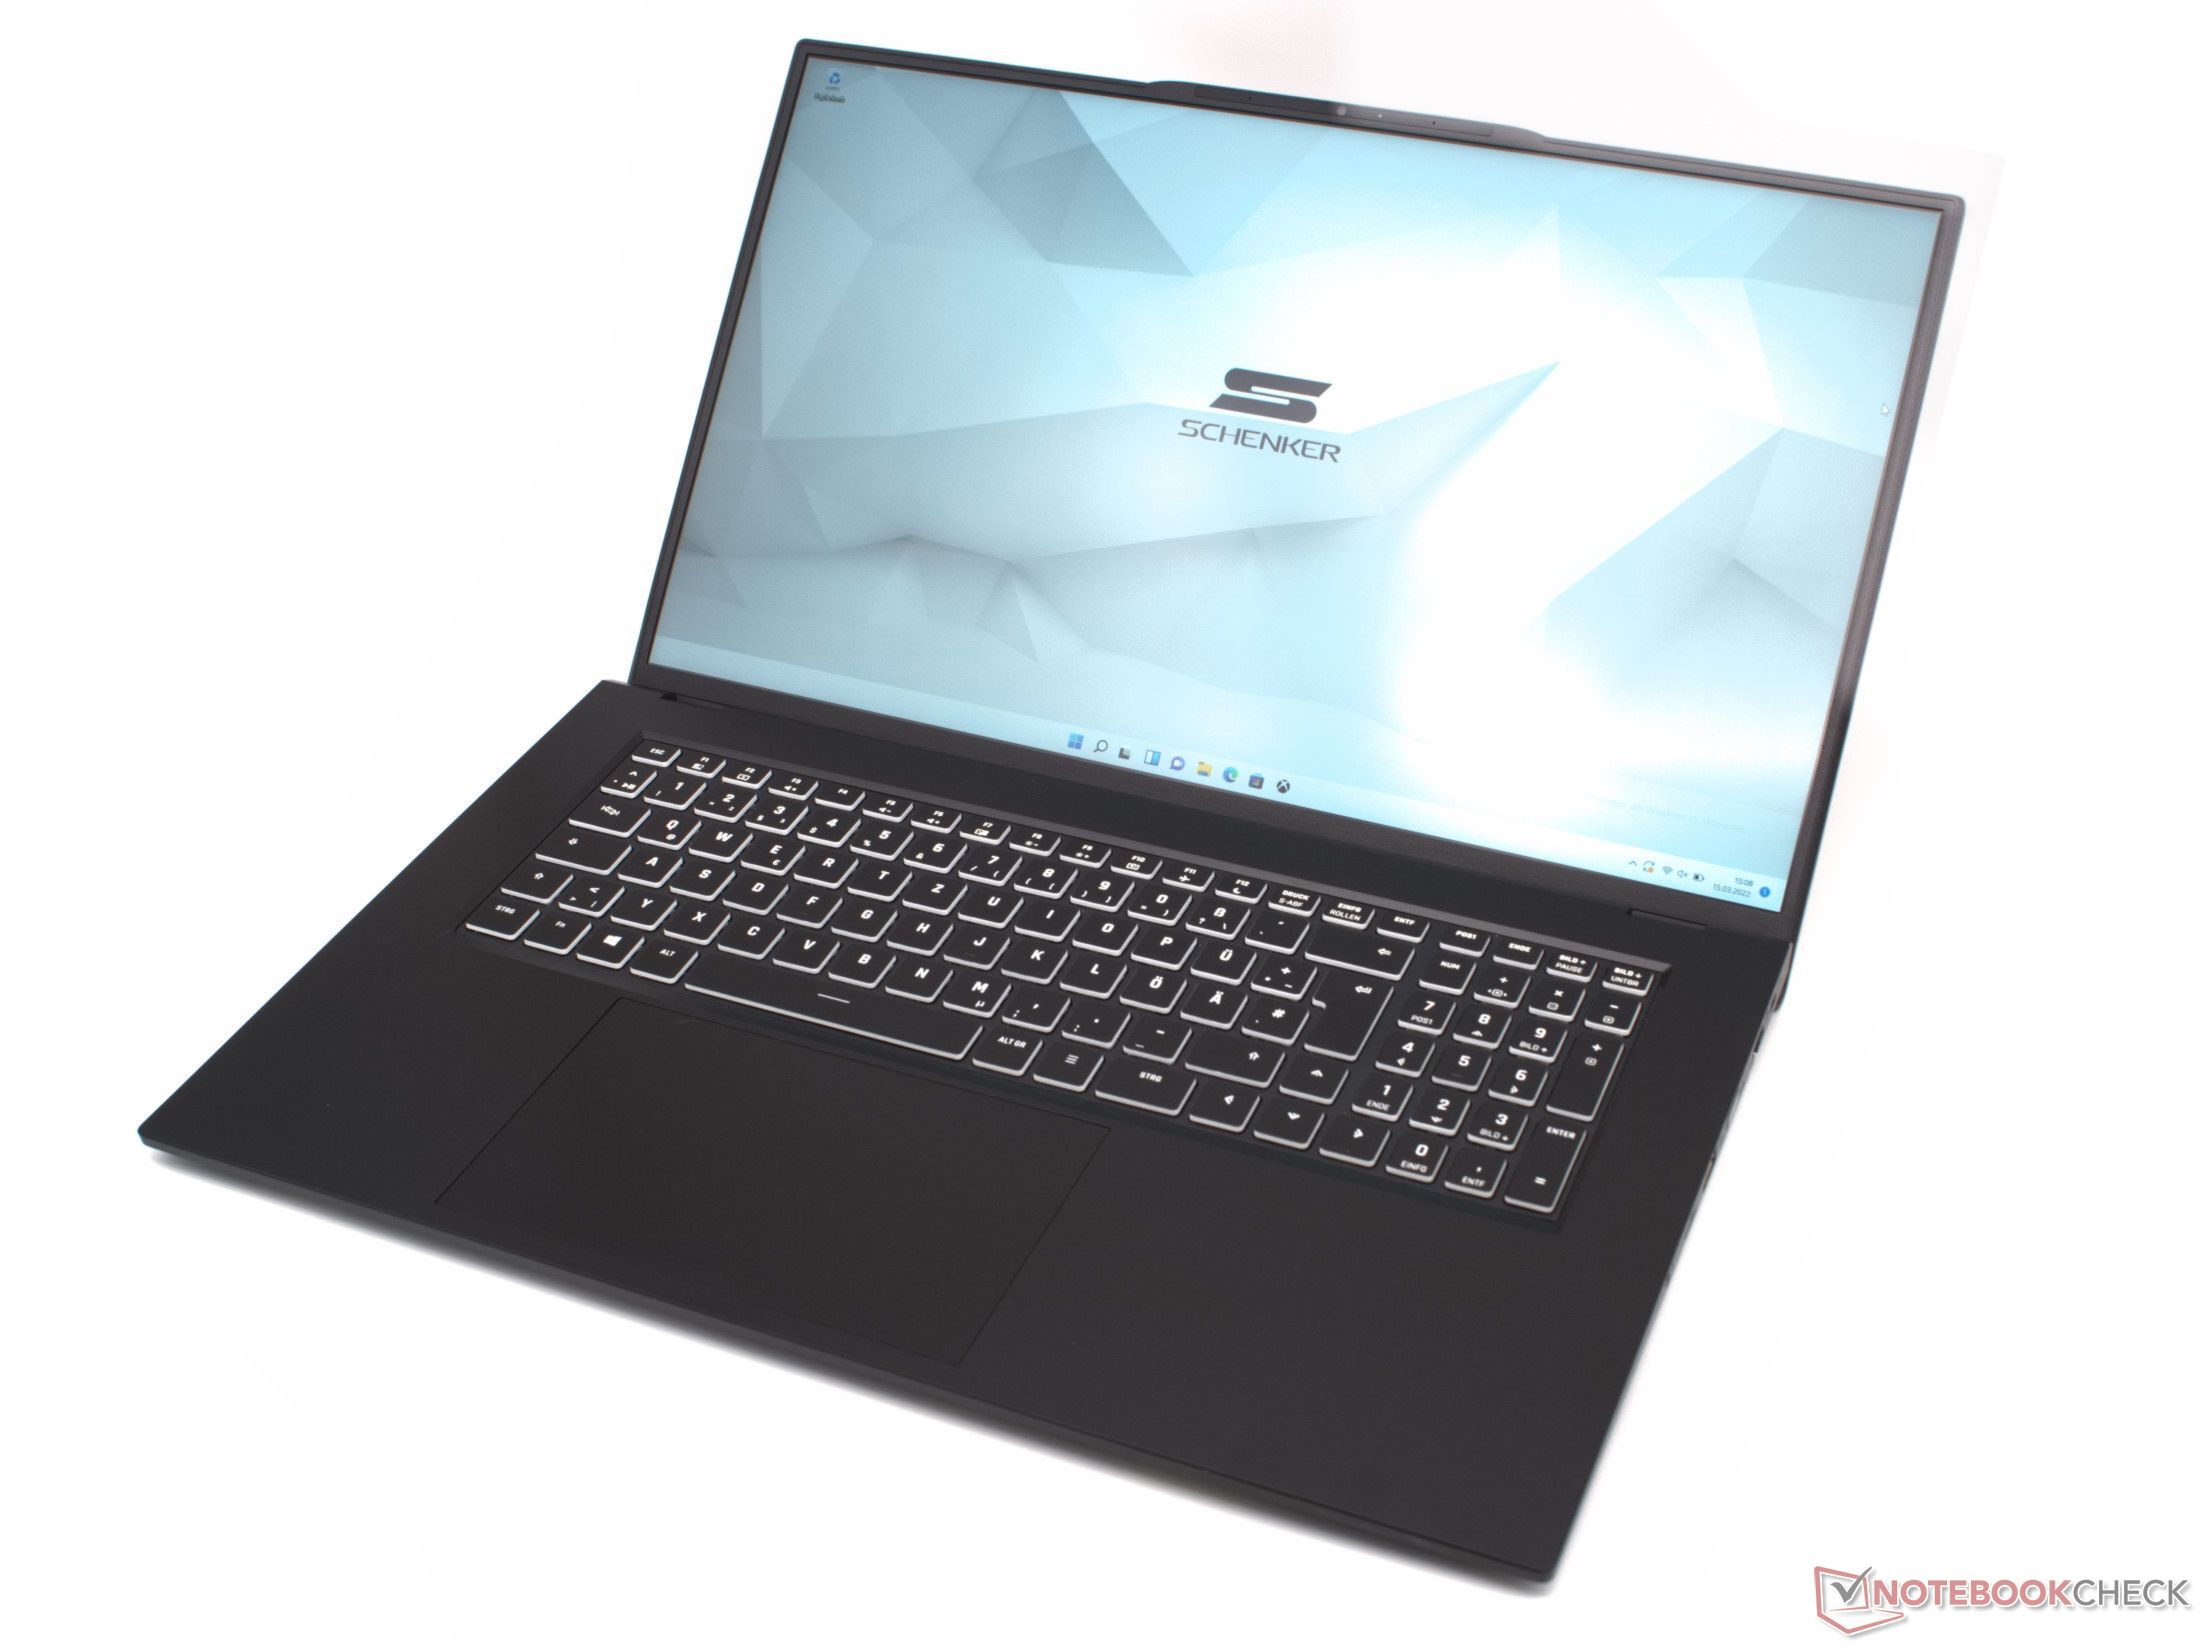
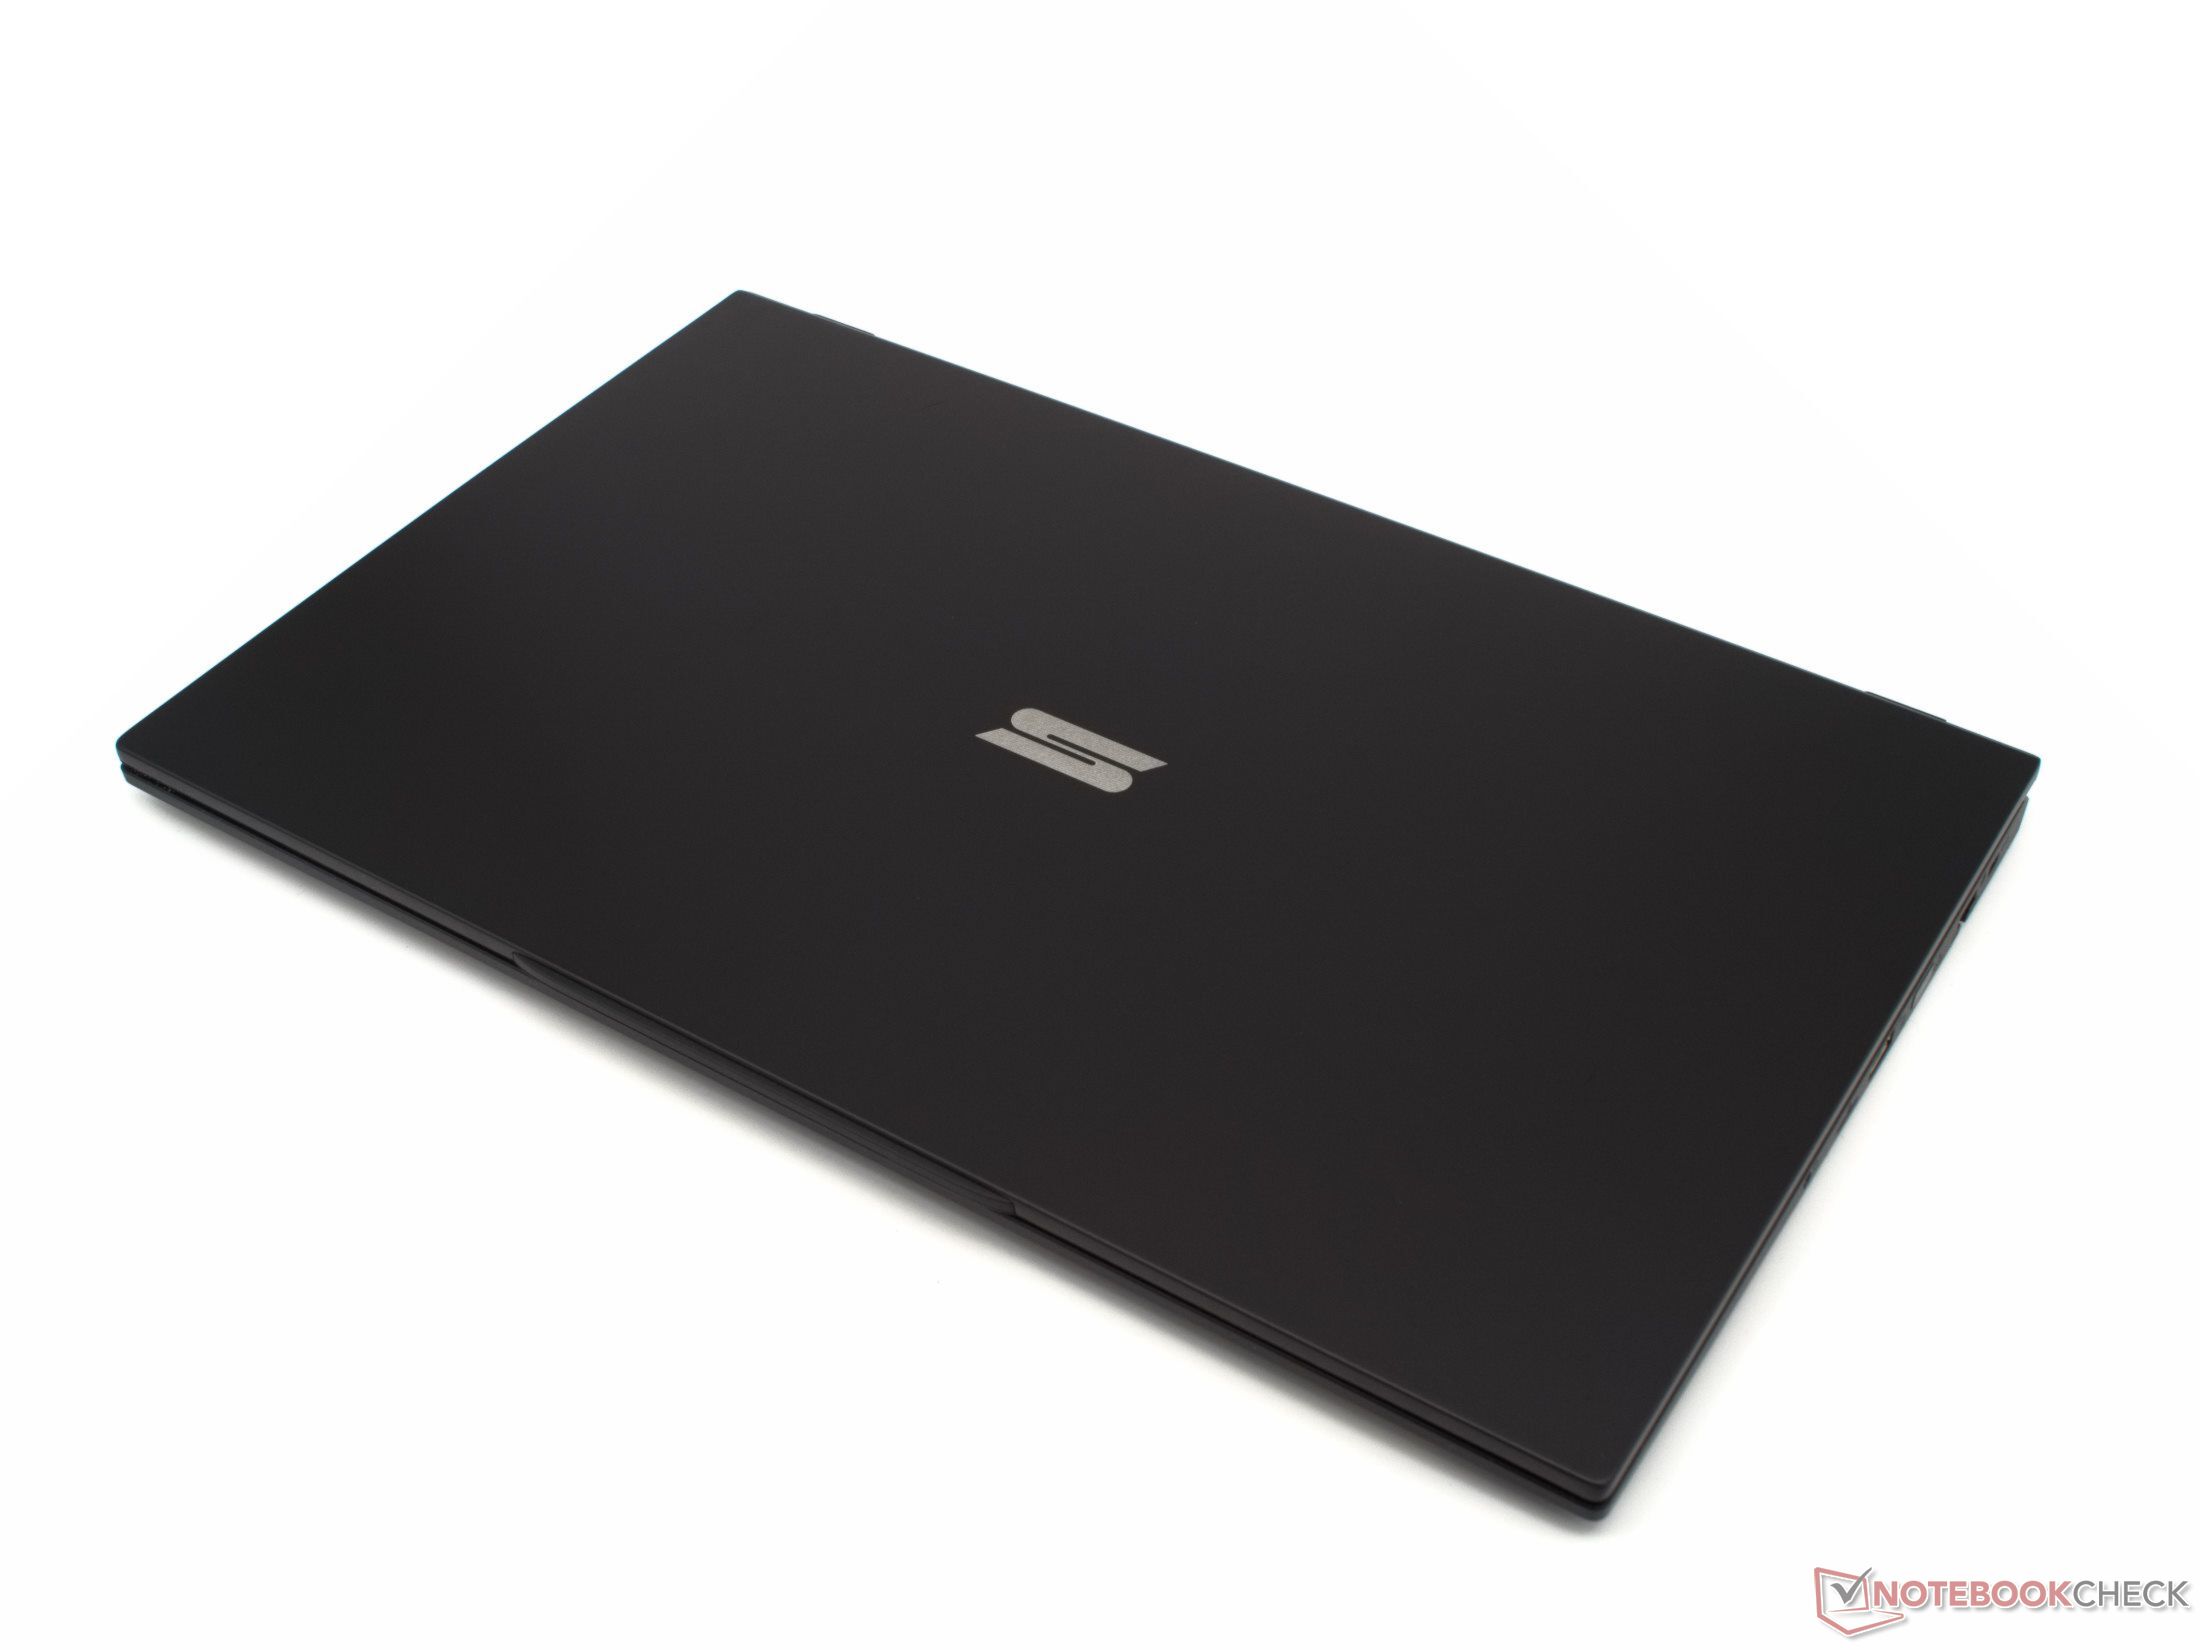
Com alumínio preto para a tampa da tela e a tampa inferior, assim como plástico preto para a parte superior da unidade base incluindo o teclado e o touchpad, a Obra 17 Schenker é visualmente bastante discreta. No entanto, uma olhada na tela revela a luneta extremamente estreita da tela. Tem apenas 6 mm de largura.
Além da aparência um pouco modesta, o laptop tem uma construção de alta qualidade, e é muito robusto em todas as áreas. Apesar de seu tamanho, a tela dificilmente pode ser torcida, e o mesmo é ainda mais verdadeiro para a unidade base.
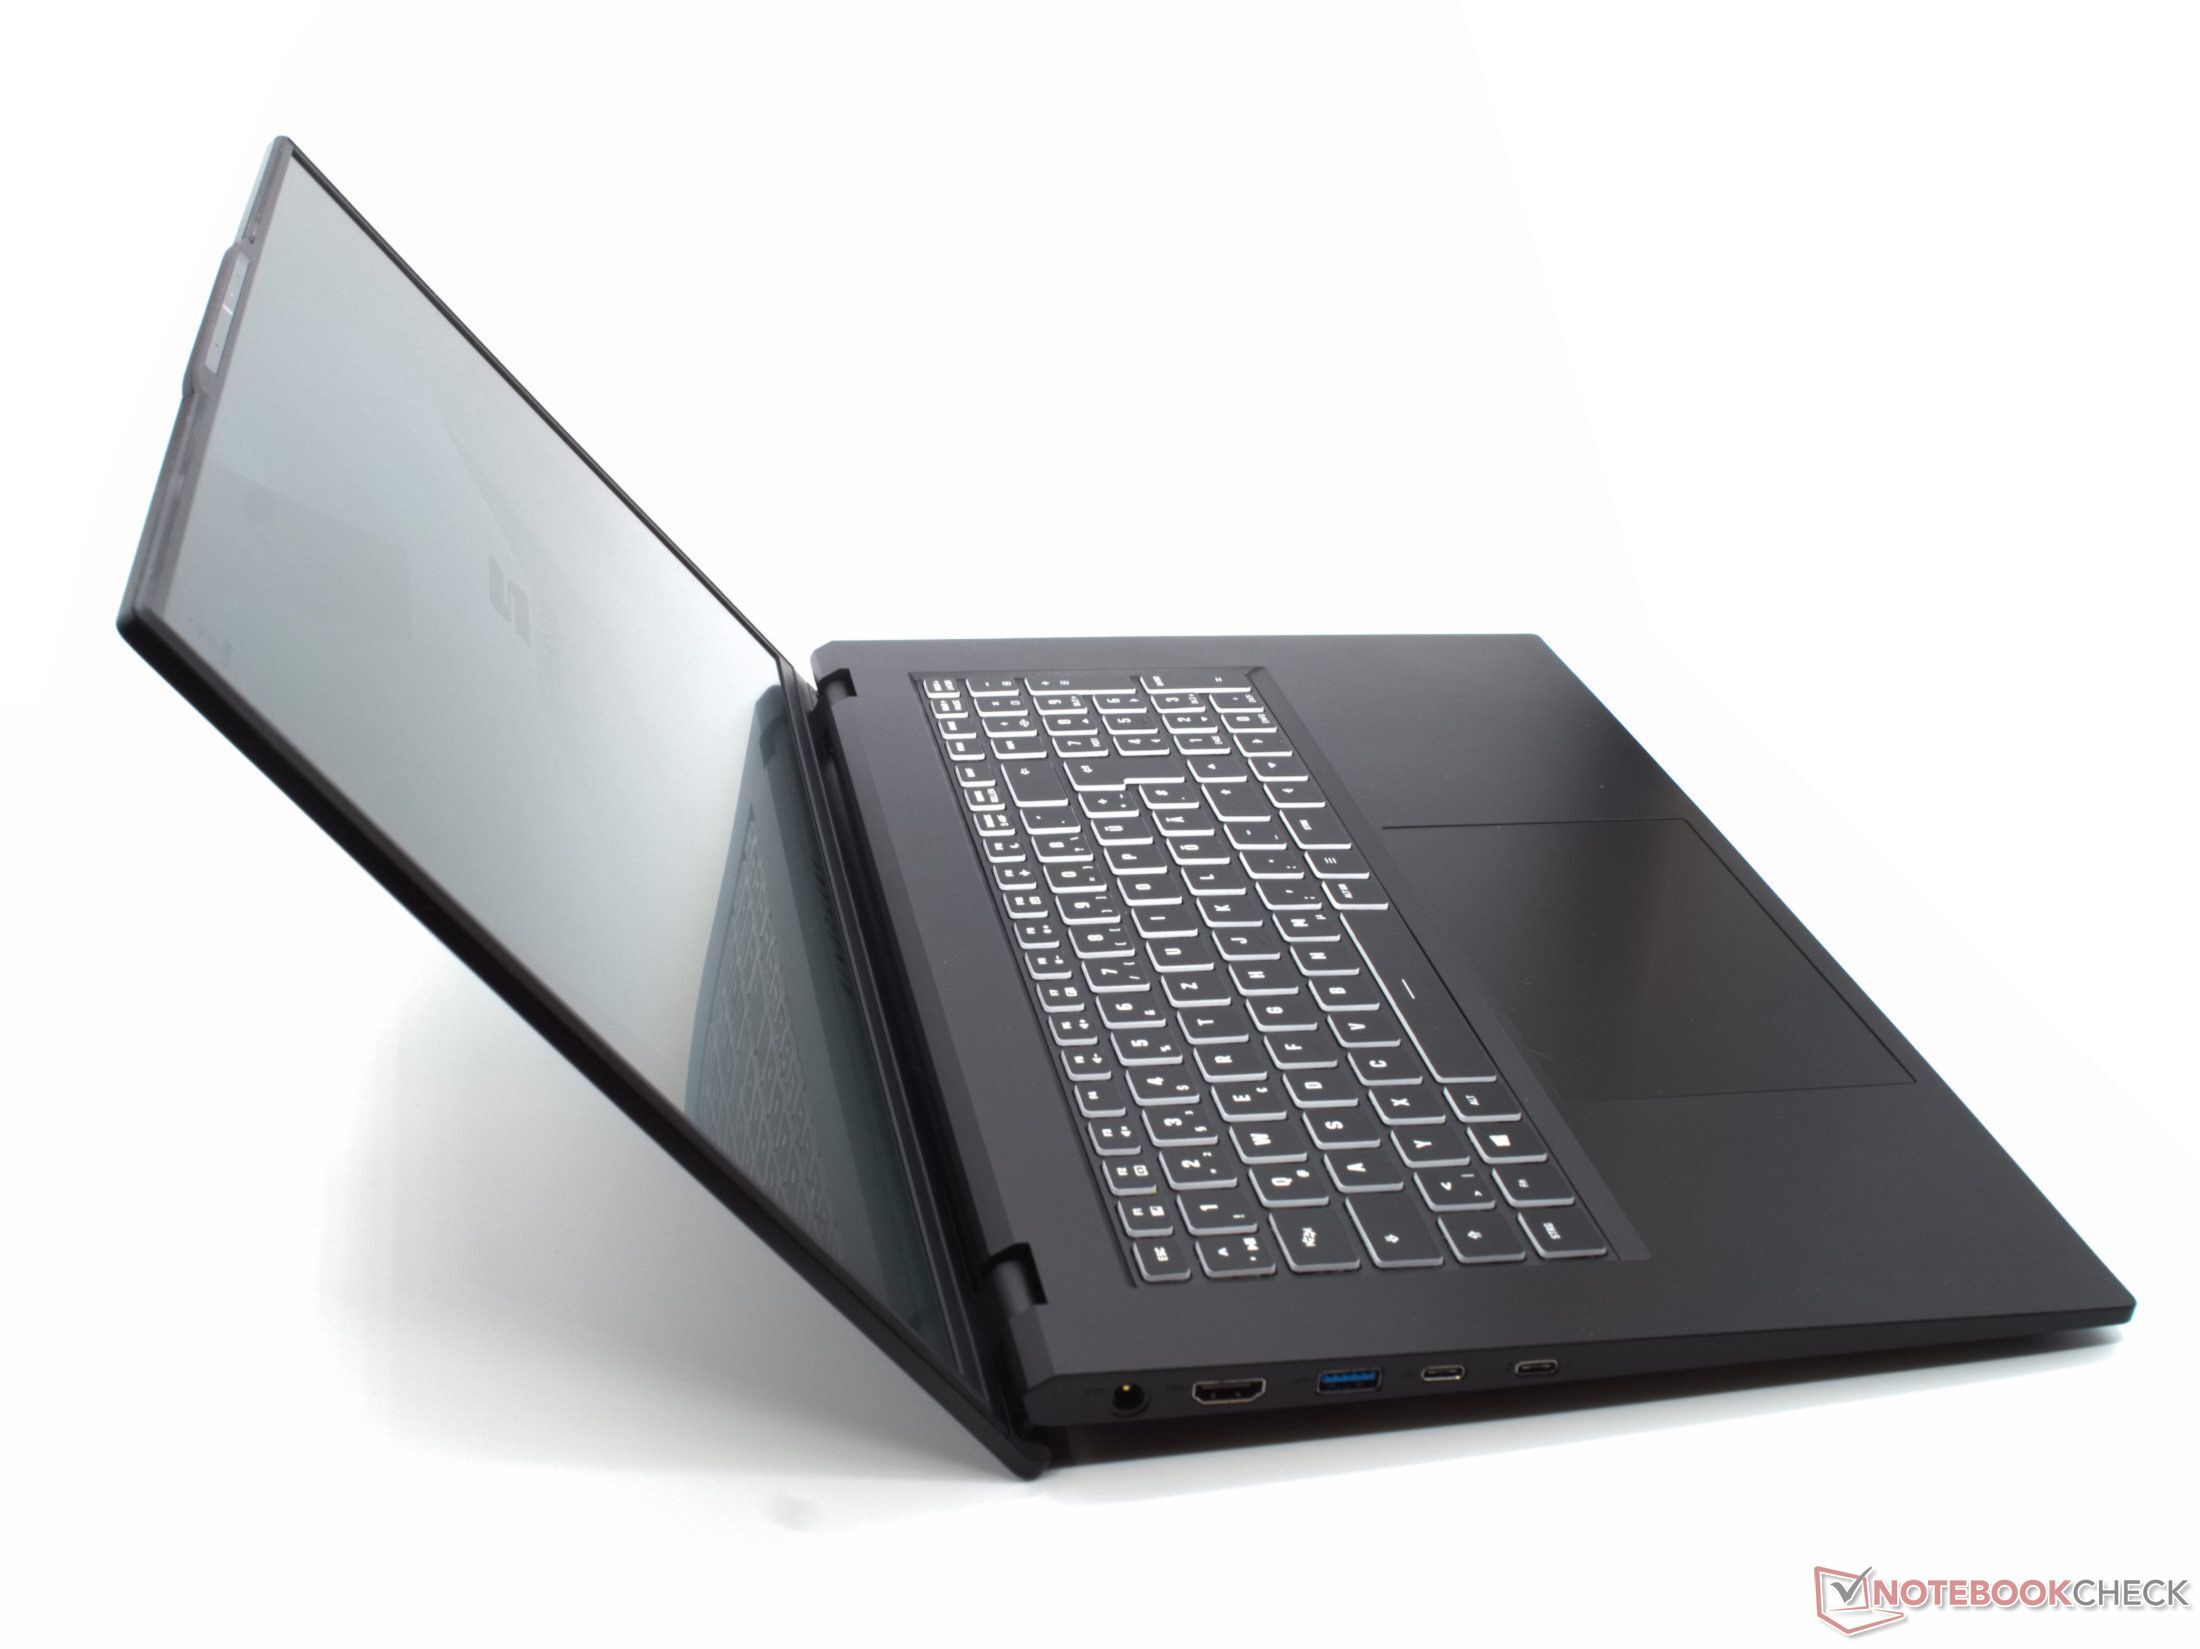
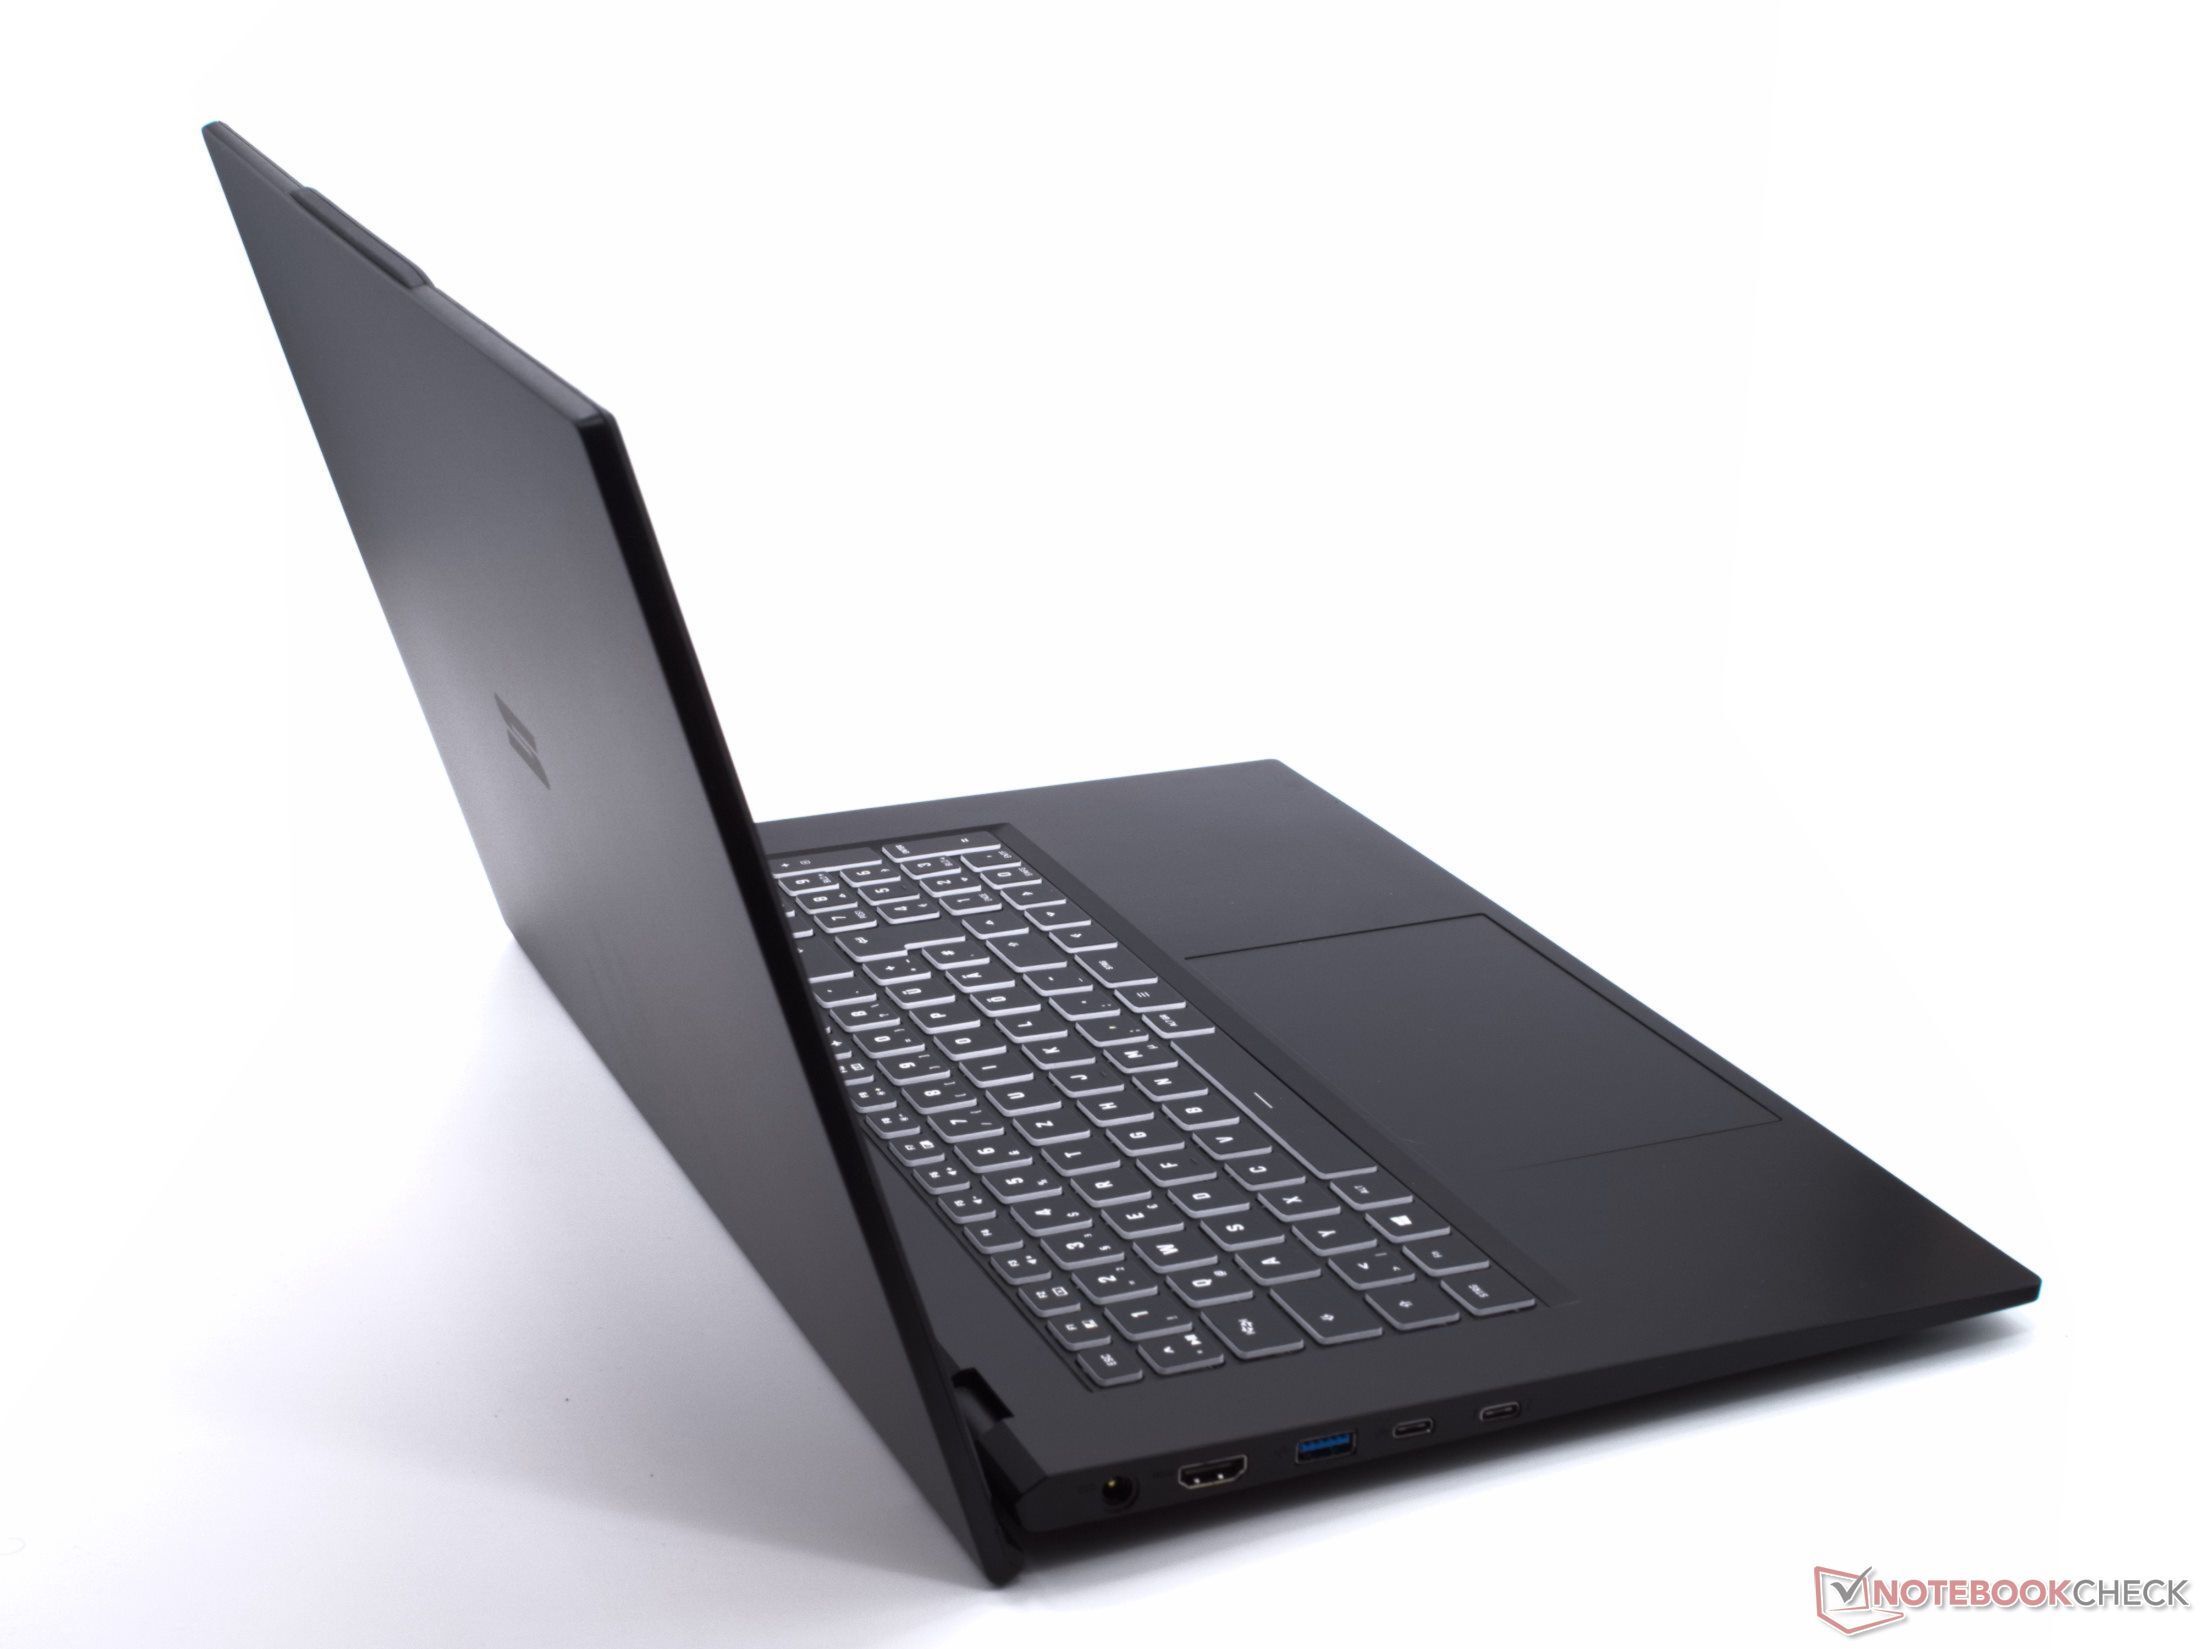

Graças ao Thunderbolt 4, HDMI, LAN e um leitor de cartões microSD, o Schenker Work 17 está quase completamente equipado em termos de conectividade. Tanto o Intel Wi-Fi AX 201 quanto o leitor de cartões microSD funcionam em alta velocidade aqui.
A webcam é da típica baixa qualidade encontrada nas webcams para laptops. Além do slot de bloqueio Kensington, os recursos de segurança do Intel Core i7-11370H também estão disponíveis.
| SD Card Reader | |
| average JPG Copy Test (av. of 3 runs) | |
| LG Gram 17Z90P-G.AA56G (Toshiba Exceria Pro M501 microSDXC 64GB) | |
| Schenker Work 15 Tiger Lake-H (Angelbird AV Pro V60) | |
| Schenker Work 17 Tiger Lake-H (Angelbird AV Pro V60) | |
| Média da turma Office (19.8 - 198.5, n=22, últimos 2 anos) | |
| Dell Inspiron 15 3505-PXHPW | |
| maximum AS SSD Seq Read Test (1GB) | |
| LG Gram 17Z90P-G.AA56G (Toshiba Exceria Pro M501 microSDXC 64GB) | |
| Média da turma Office (27.4 - 249, n=21, últimos 2 anos) | |
| Schenker Work 17 Tiger Lake-H (Angelbird AV Pro V60) | |
| Schenker Work 15 Tiger Lake-H (Angelbird AV Pro V60) | |
| Dell Inspiron 15 3505-PXHPW | |
| Networking | |
| iperf3 transmit AX12 | |
| Acer Aspire 5 A517-52G-79Z5 | |
| Schenker Work 17 Tiger Lake-H | |
| Schenker Work 15 Tiger Lake-H | |
| Média Intel Wi-Fi 6 AX201 (49.8 - 1775, n=324) | |
| LG Gram 17Z90P-G.AA56G | |
| Acer Aspire 3 A317-51G-72MD | |
| Dell Inspiron 15 3505-PXHPW | |
| iperf3 receive AX12 | |
| LG Gram 17Z90P-G.AA56G | |
| Schenker Work 17 Tiger Lake-H | |
| Média Intel Wi-Fi 6 AX201 (136 - 1743, n=324) | |
| Schenker Work 15 Tiger Lake-H | |
| Acer Aspire 5 A517-52G-79Z5 | |
| Dell Inspiron 15 3505-PXHPW | |
| Acer Aspire 3 A317-51G-72MD | |


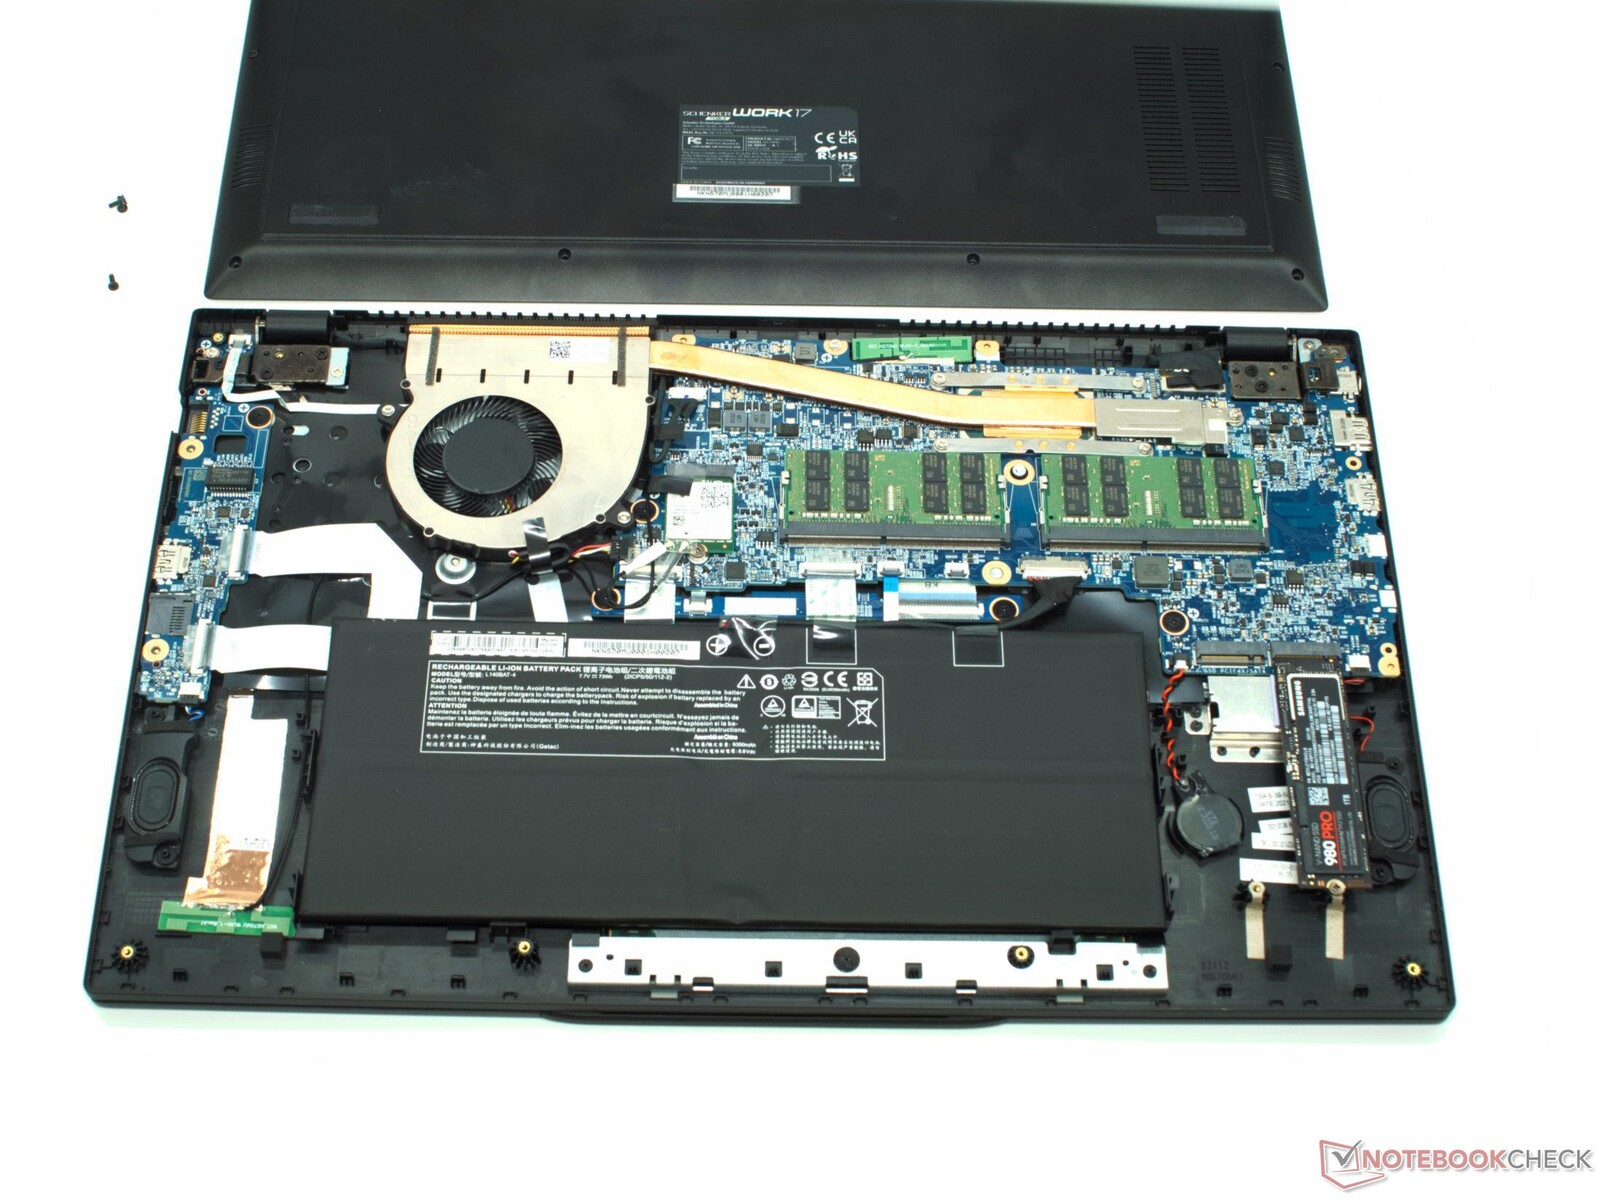
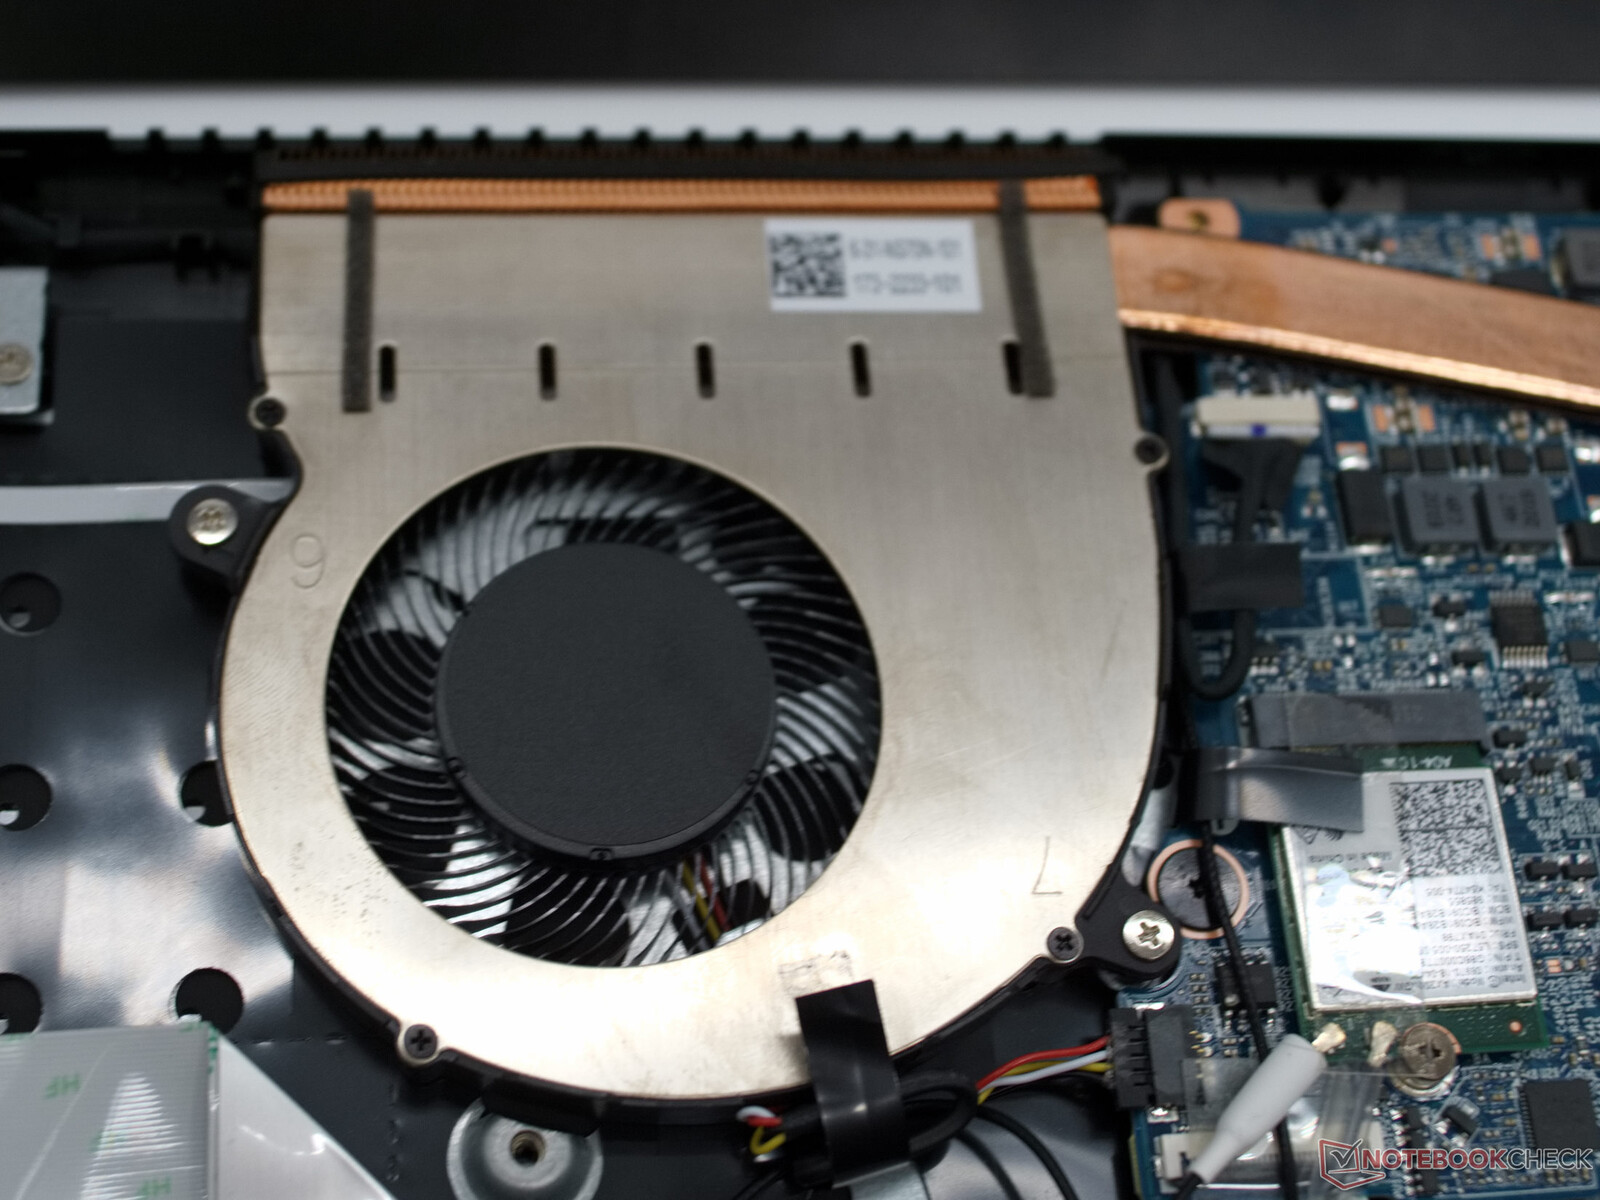
A tampa inferior pode ser facilmente levantada removendo os parafusos. Isto revela a RAM atualizável, um slot M.2 SSD livre, e um módulo WLAN substituível. Muitas coisas são modulares na Obra 17 da Schenker. Isto deve facilitar pequenos reparos e tarefas de manutenção
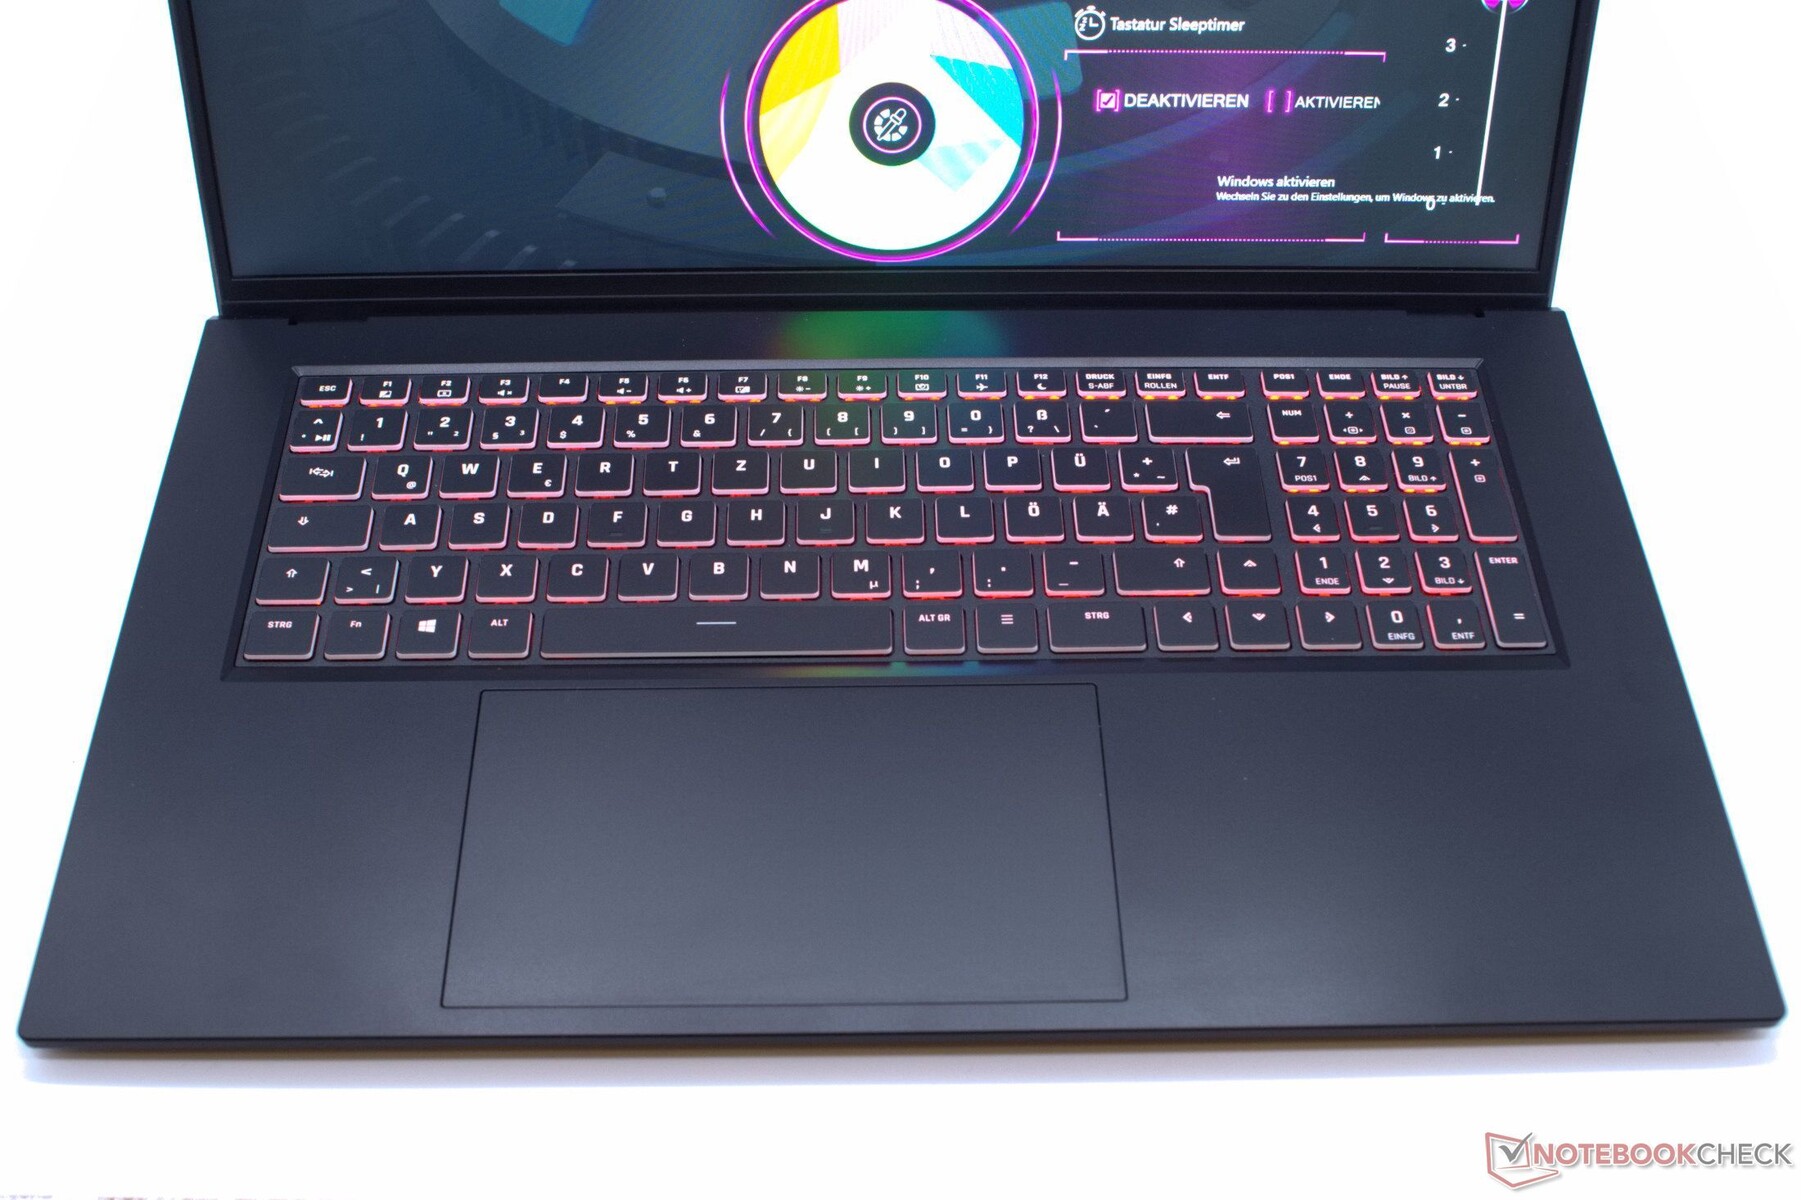
Dispositivos de entrada - O teclado RBG encontra o enorme ClickPad
O teclado da Schenker Work 17 fornece um forte feedback táctil. Além disso, o curso da chave de quase 2 mm garante que o teclado seja agradável. O touchpad é grande a 15 cm x 9 cm, e sua superfície é uniforme e lisa.
A iluminação RGB do teclado pode parecer um pouco incomum no início. Mas acontece que a seleção de cores permite um uso confortável e sem brilho que carece de luz azul, o que é especialmente útil à noite.
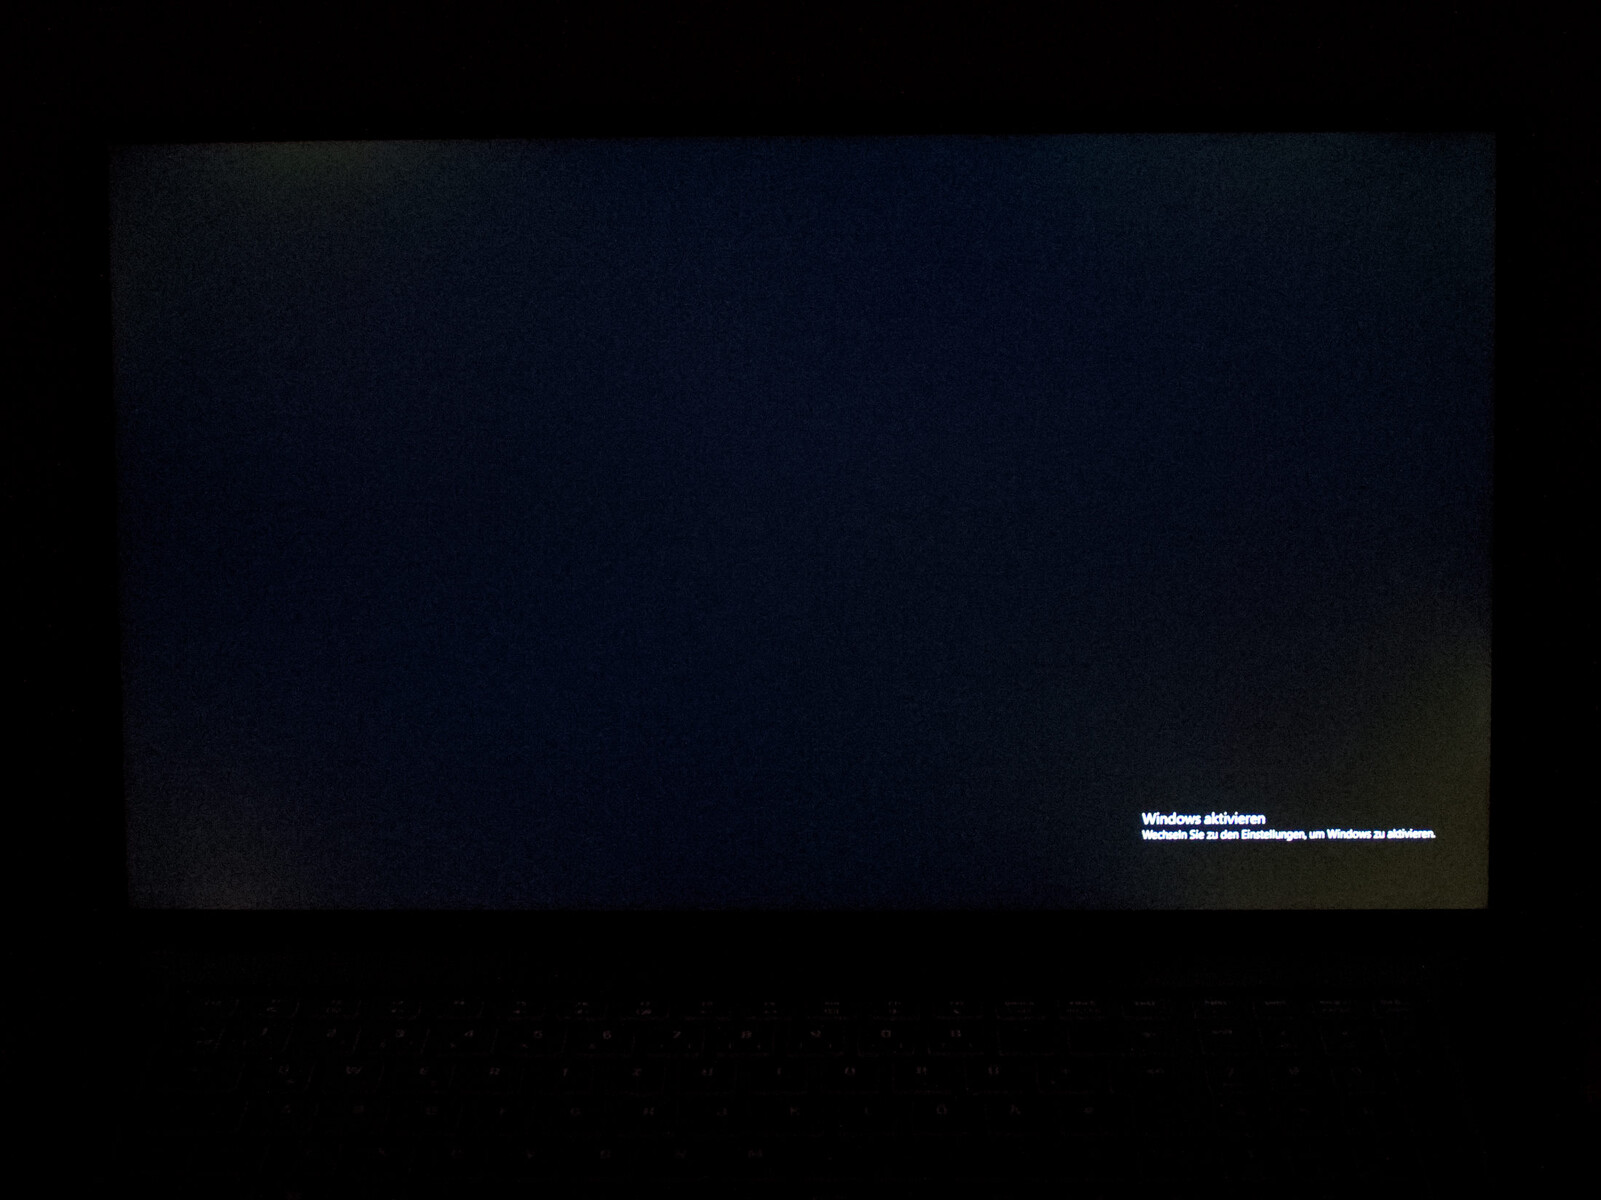
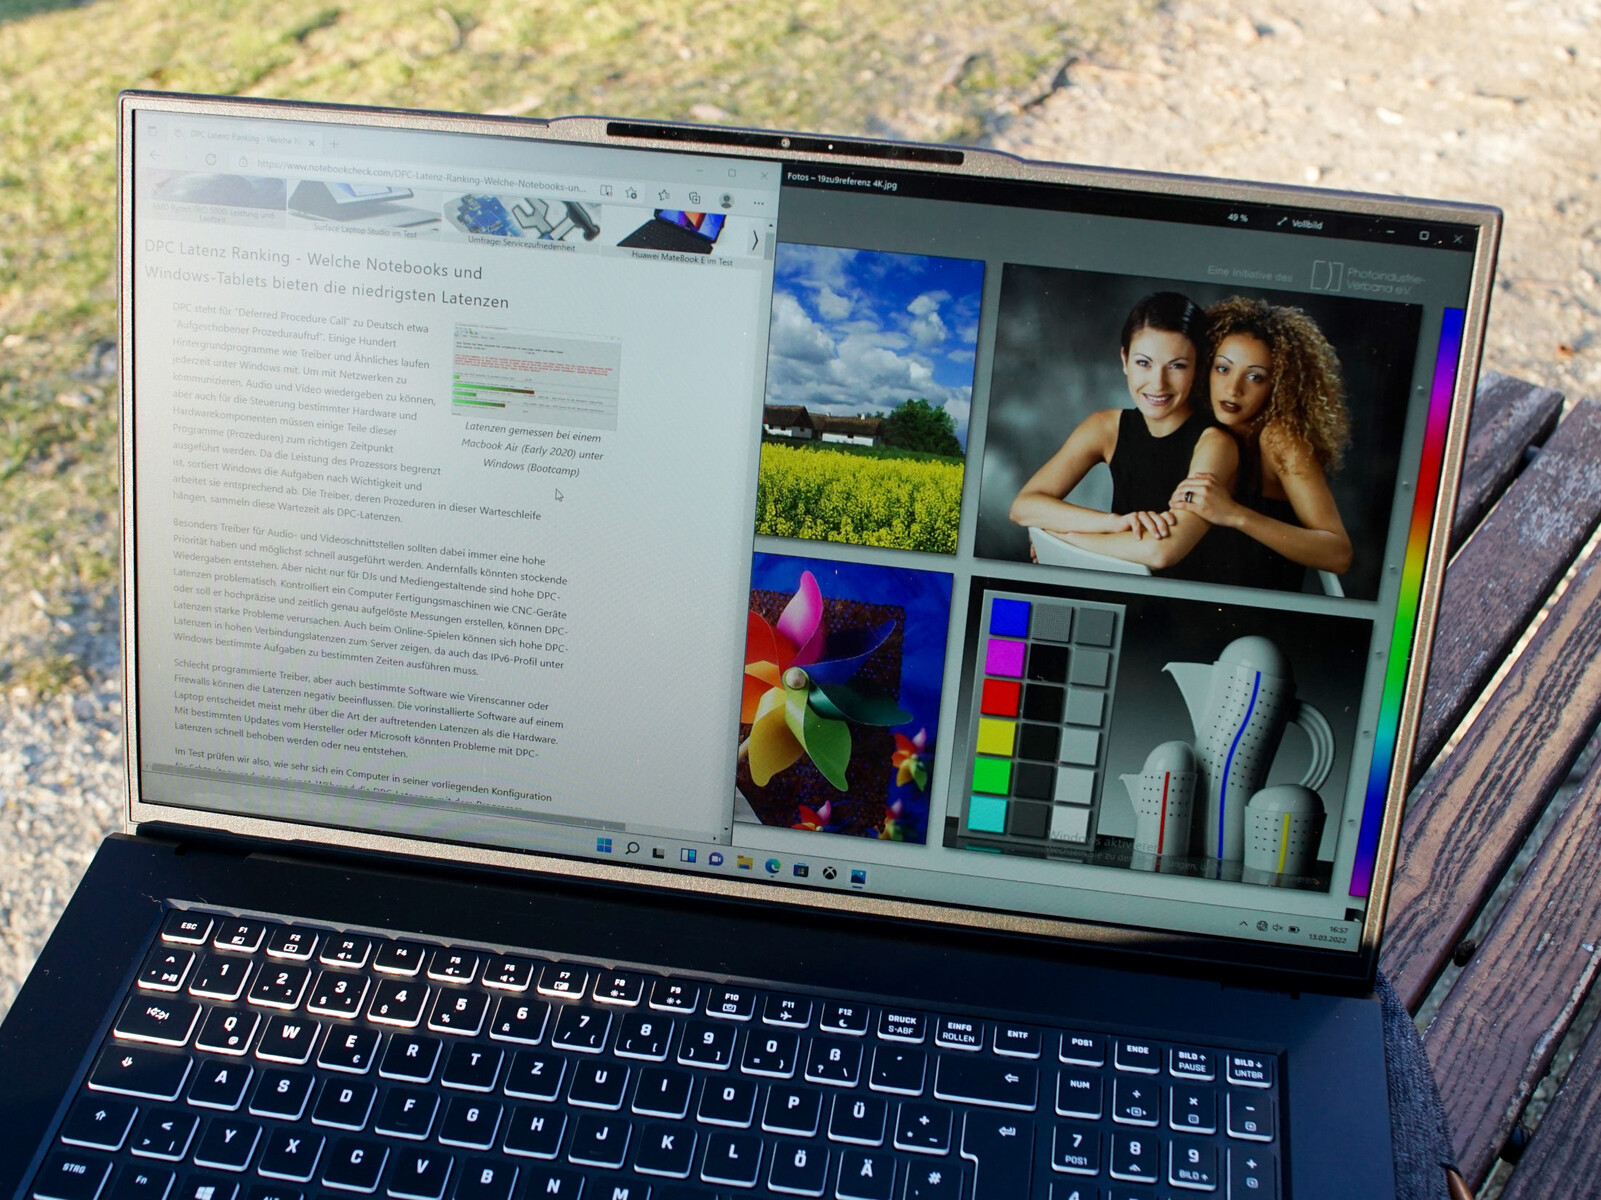
Display - Também corta uma bela figura ao ar livre
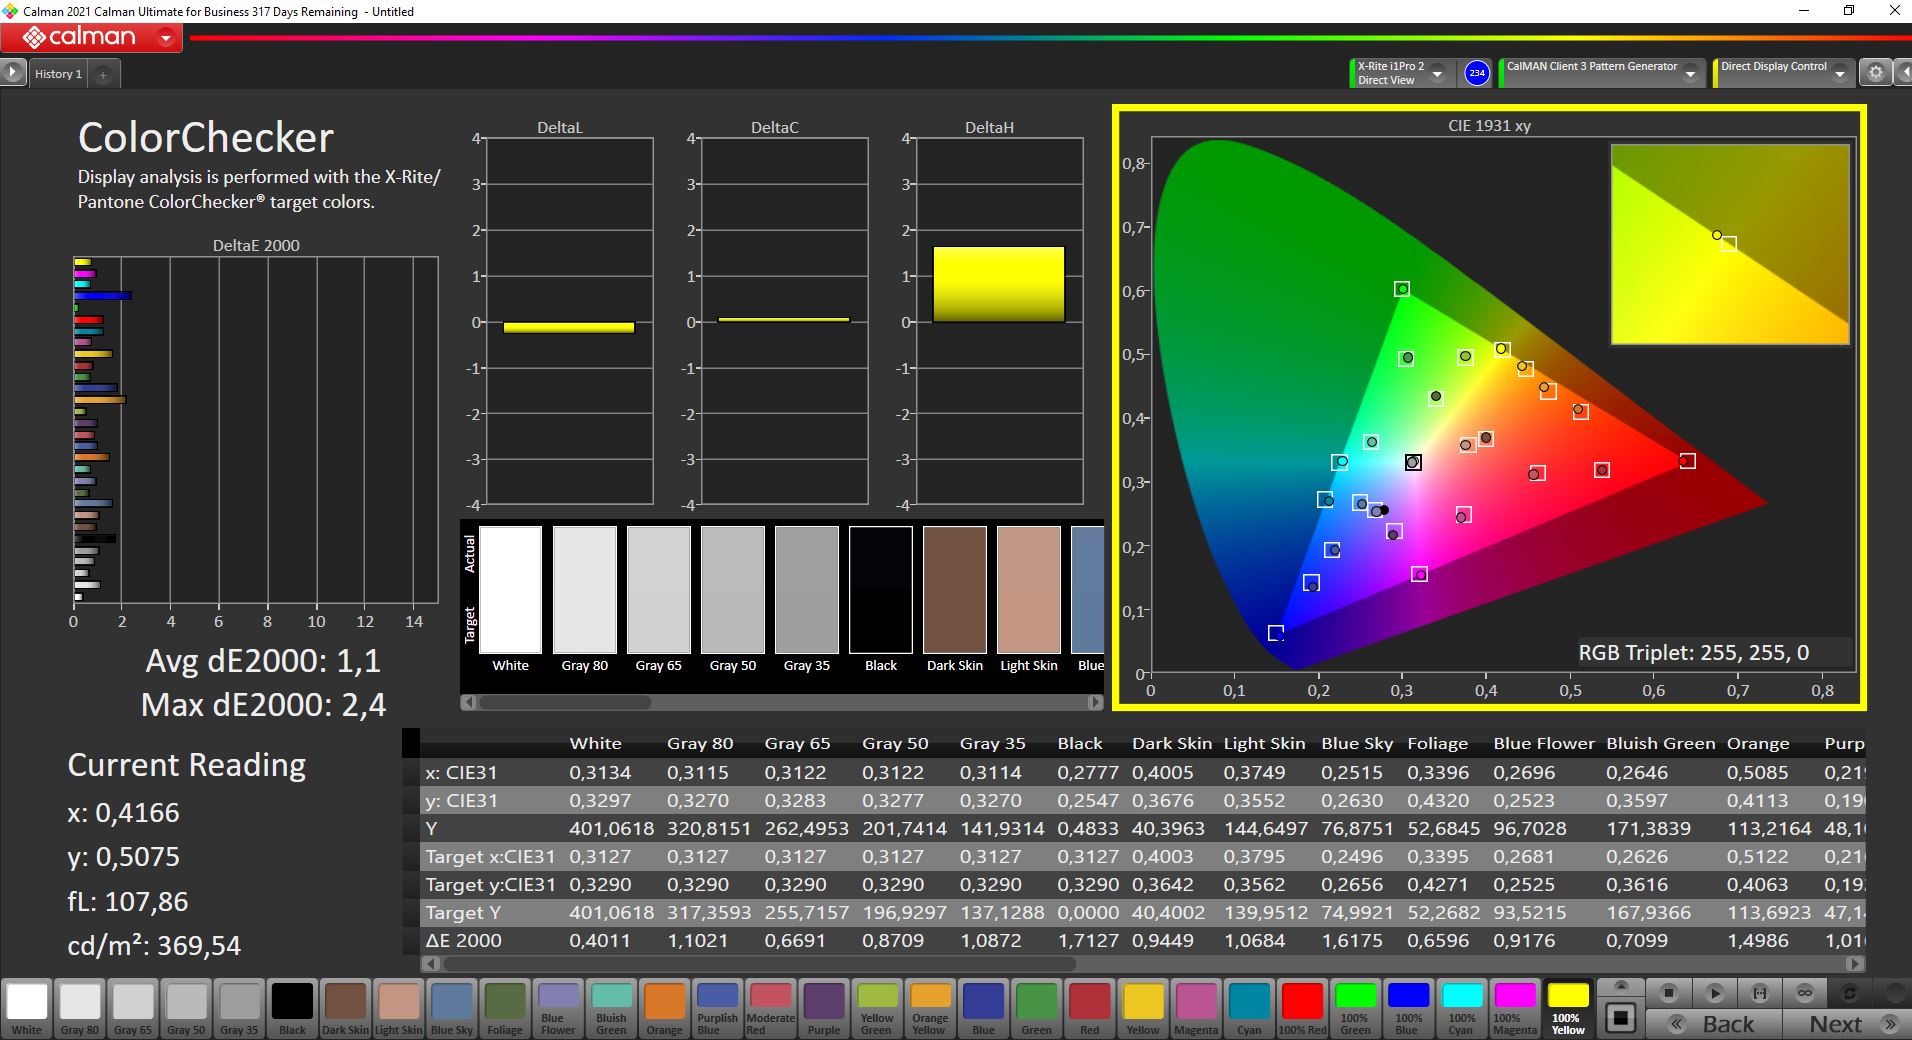
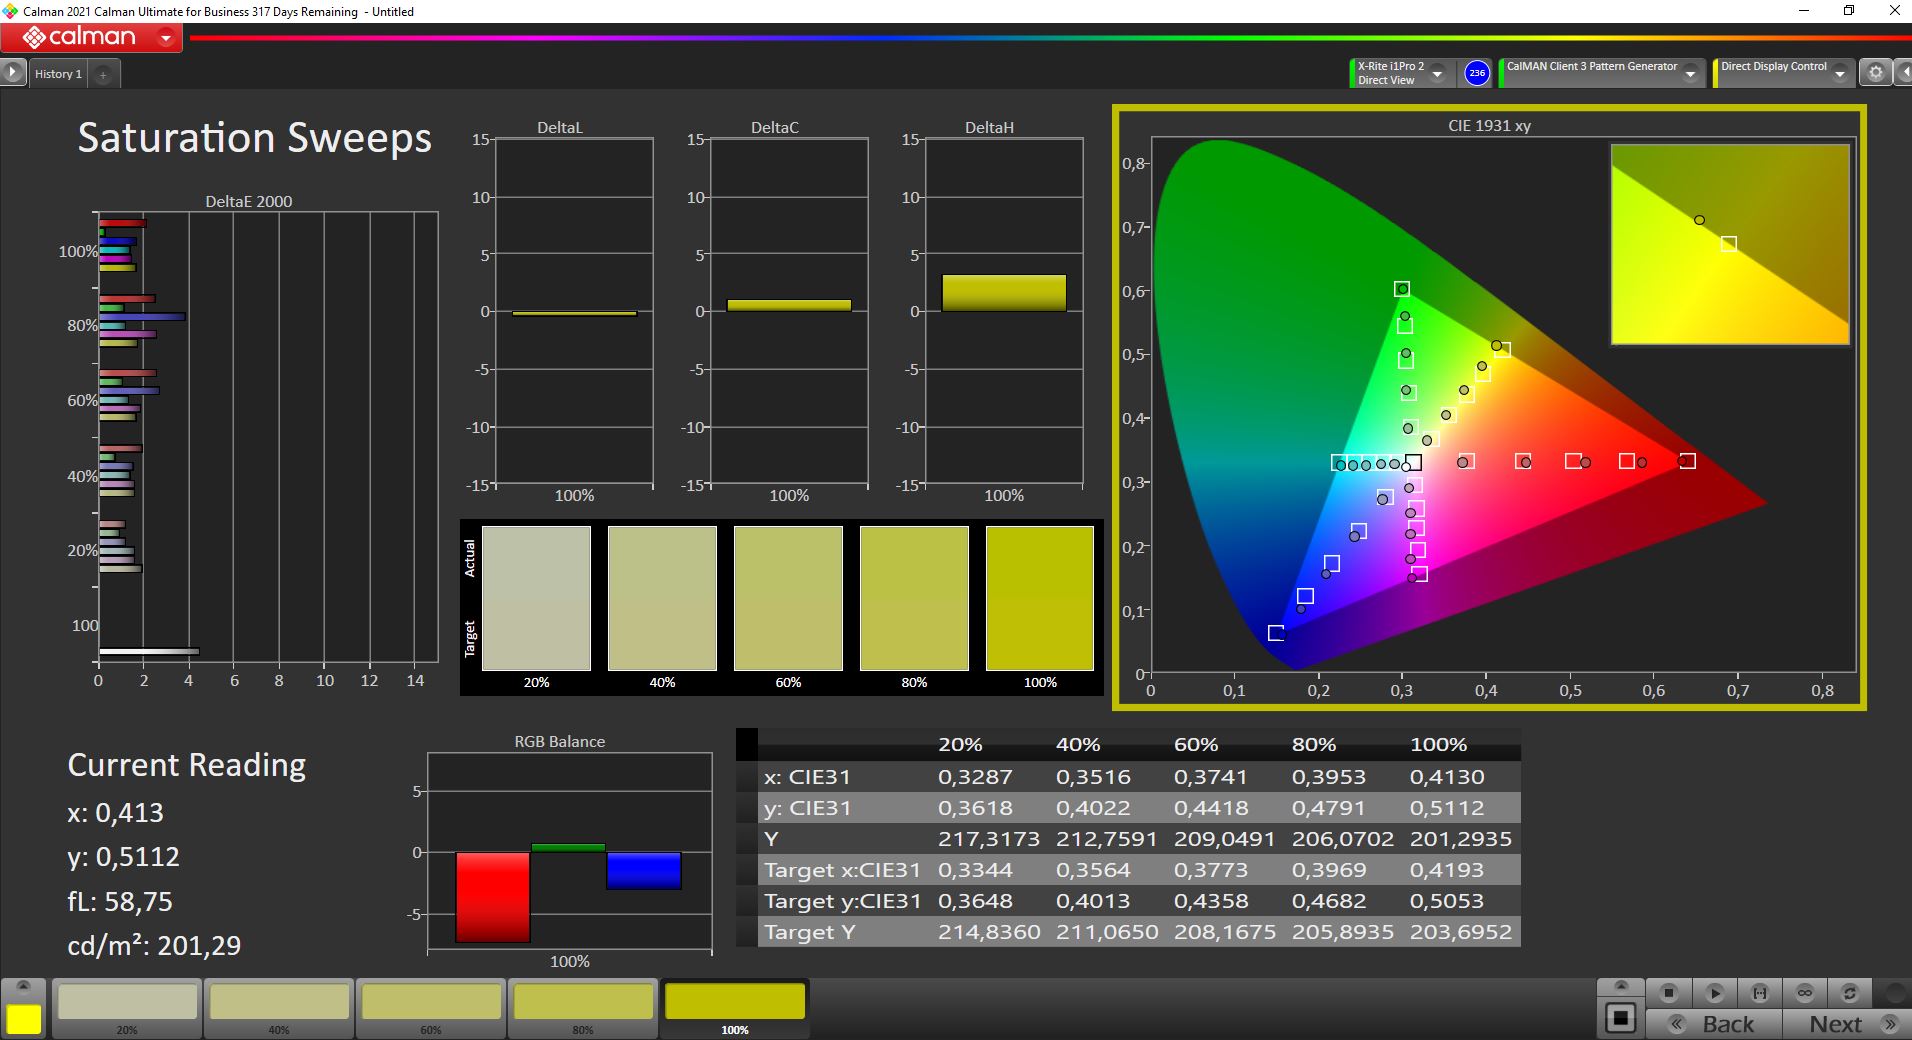
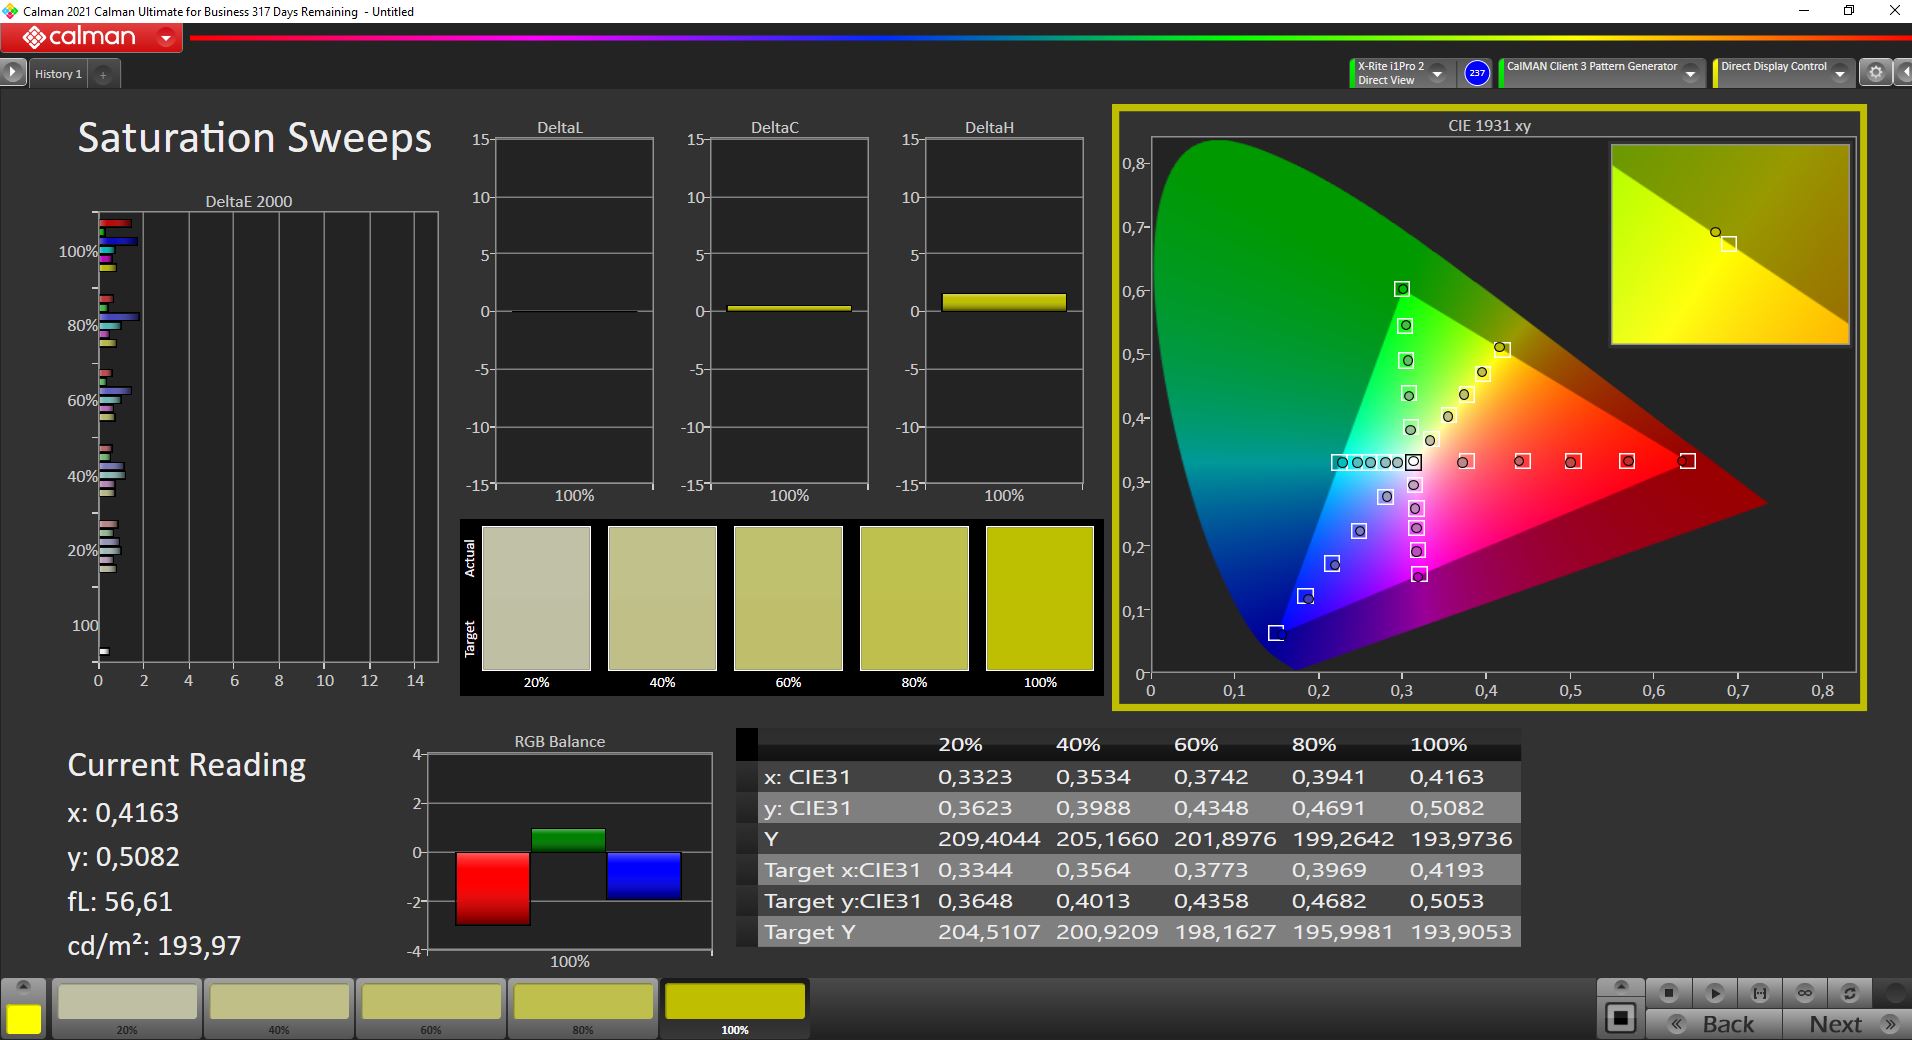
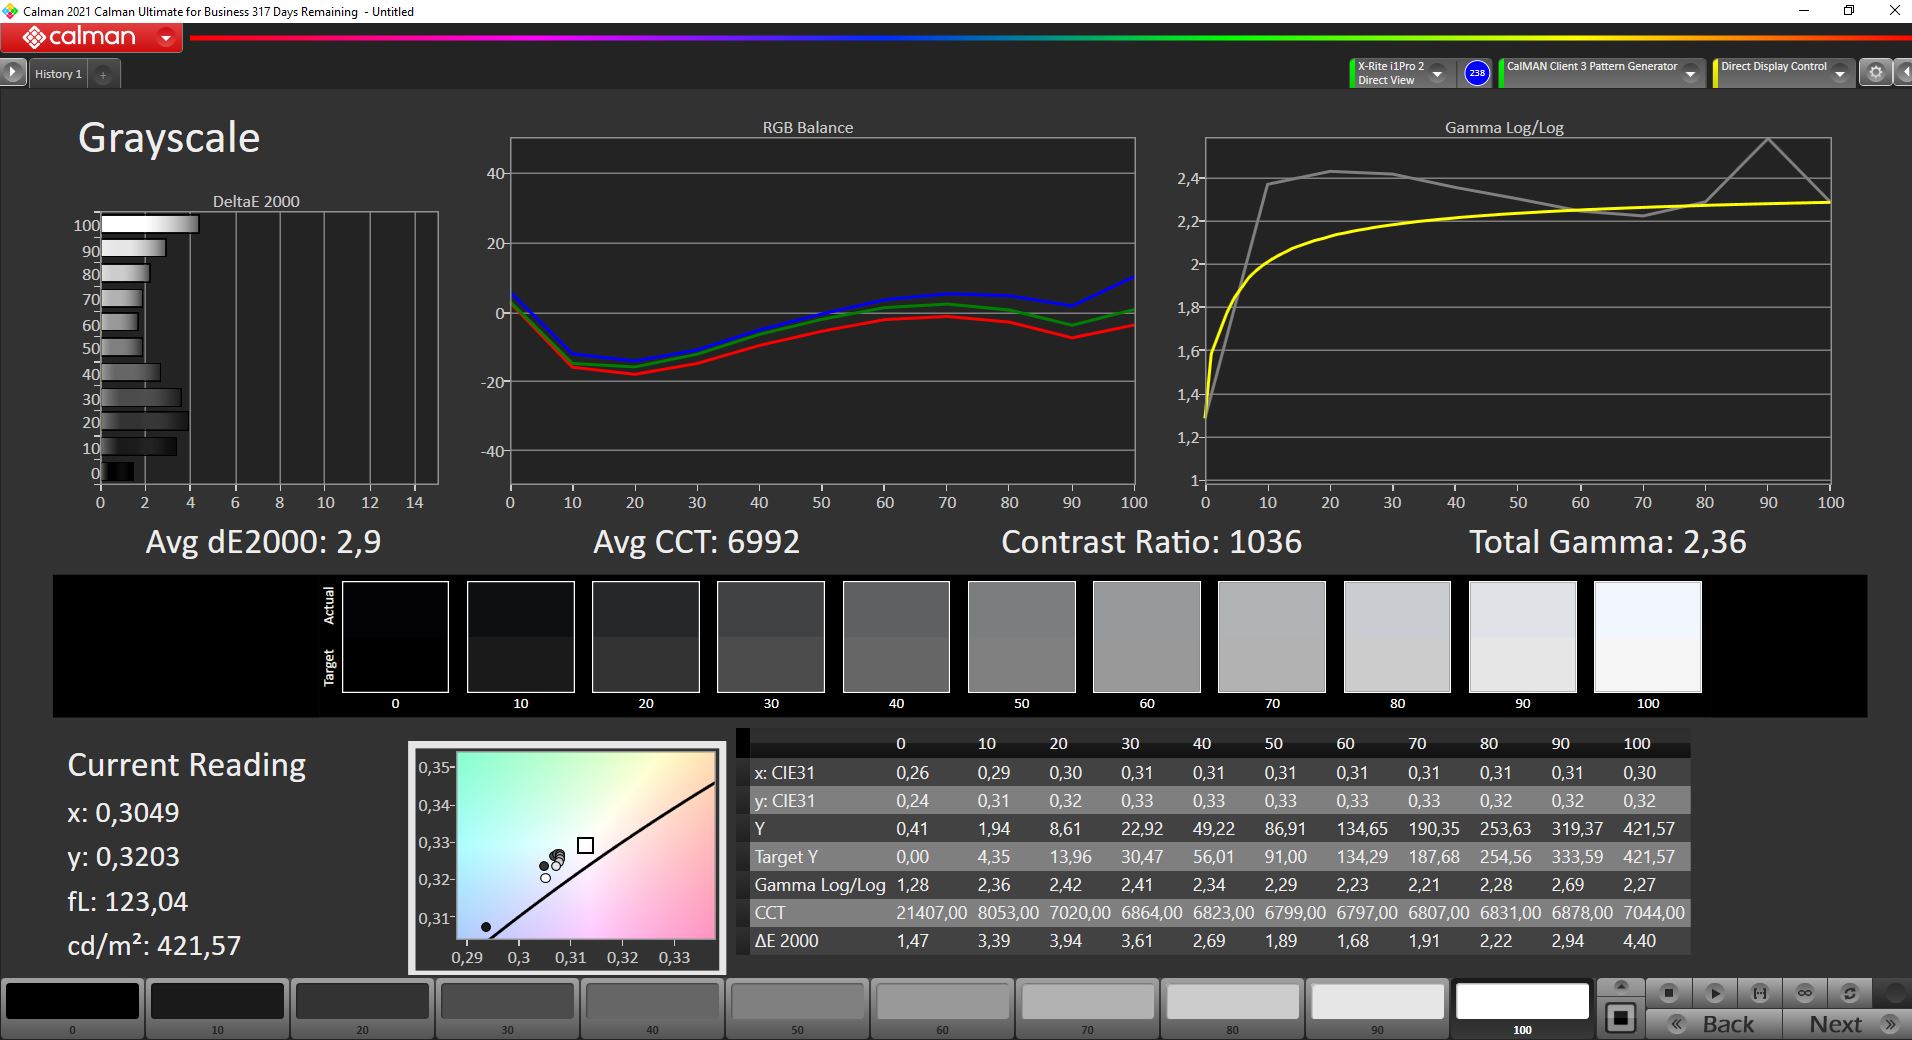
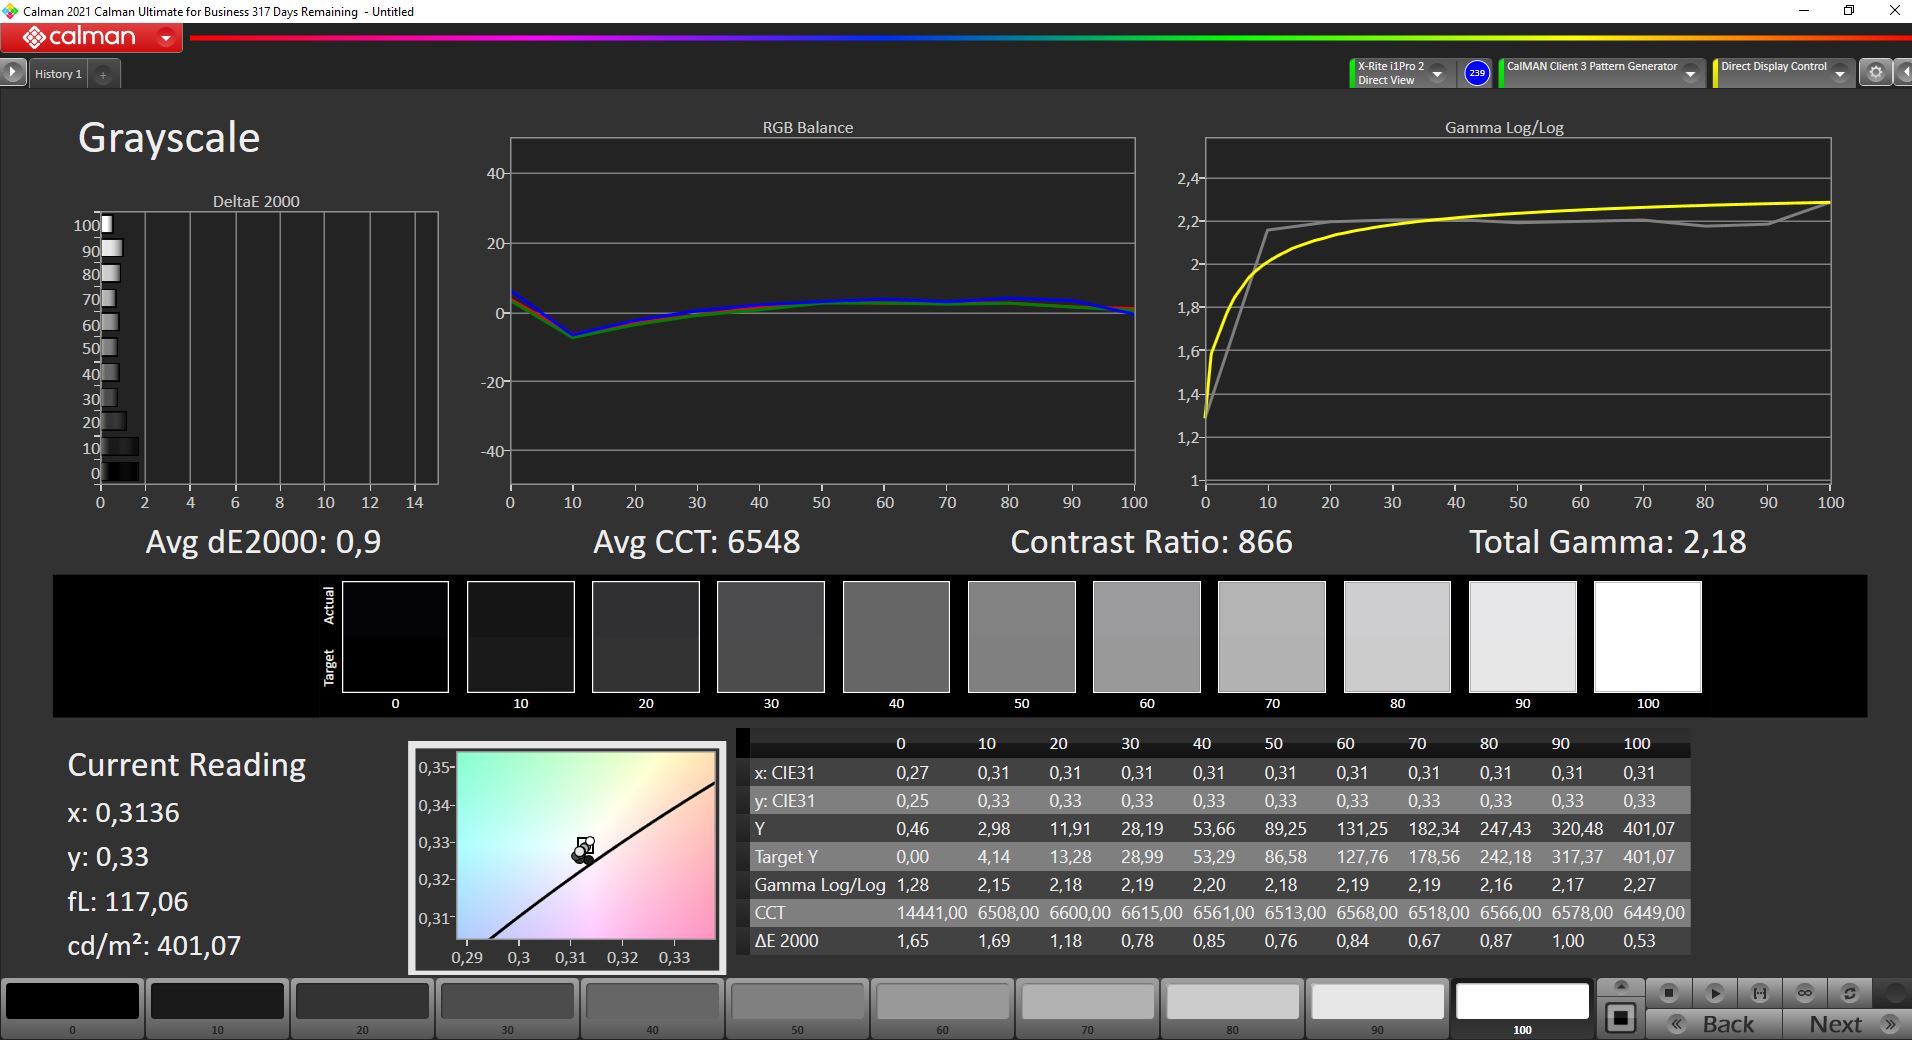
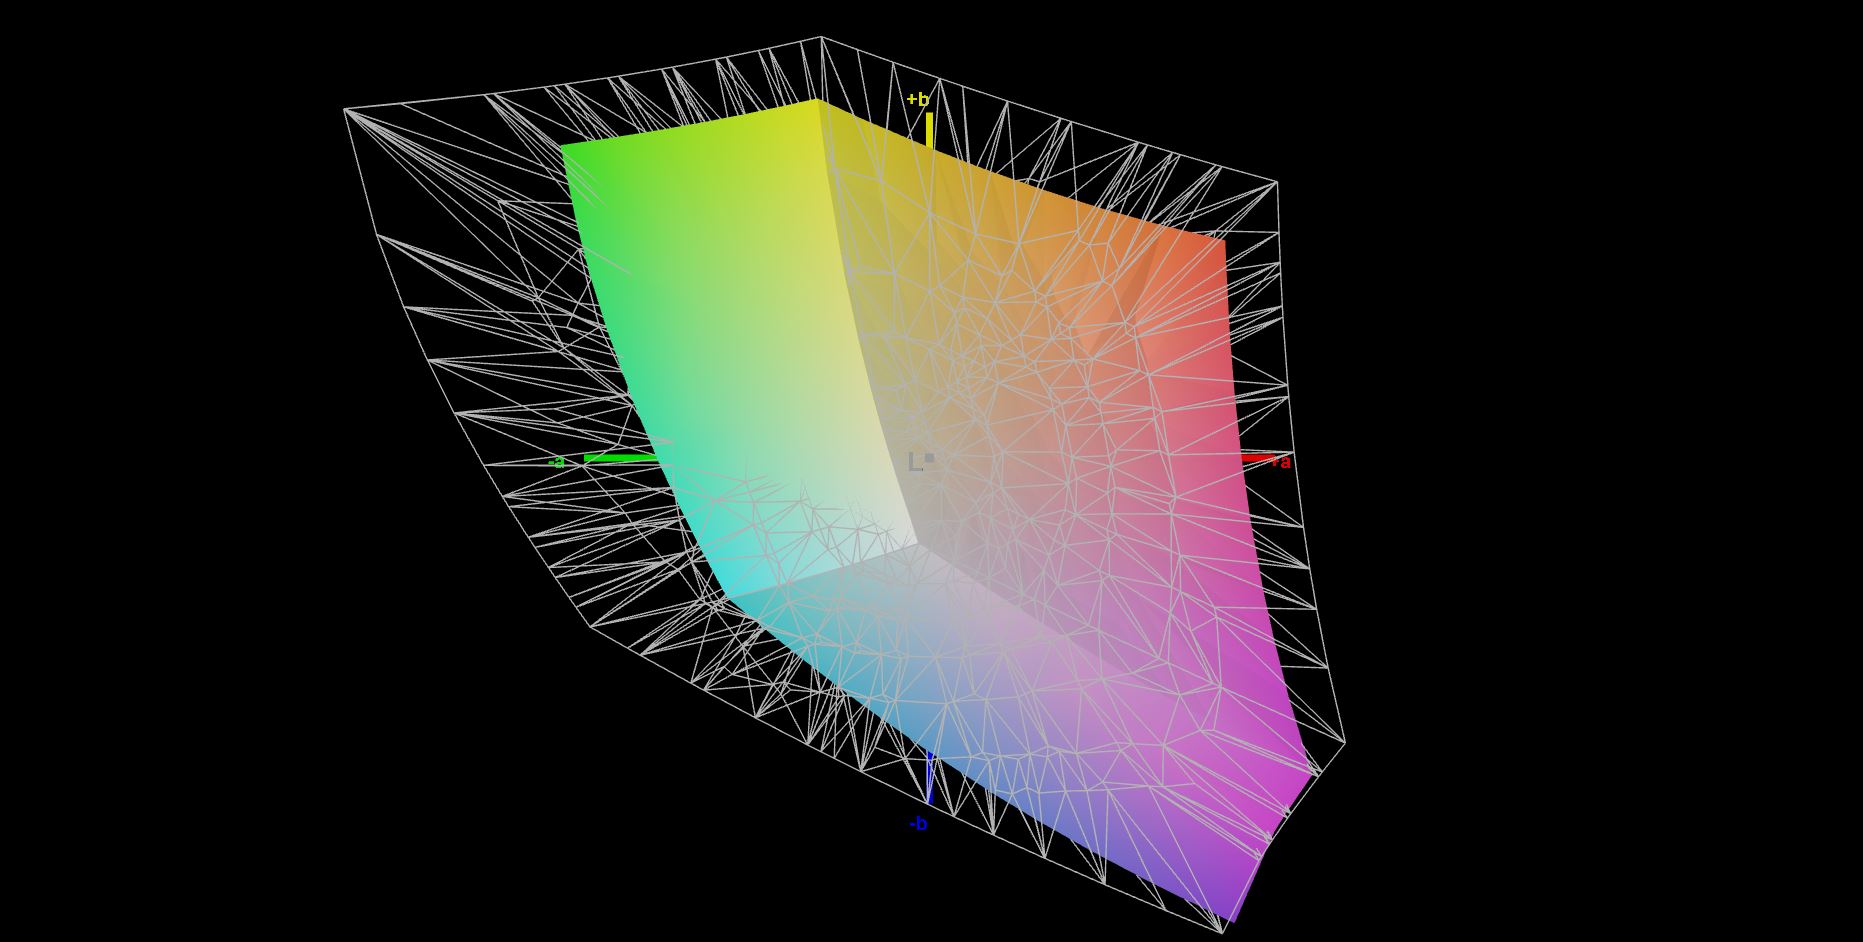
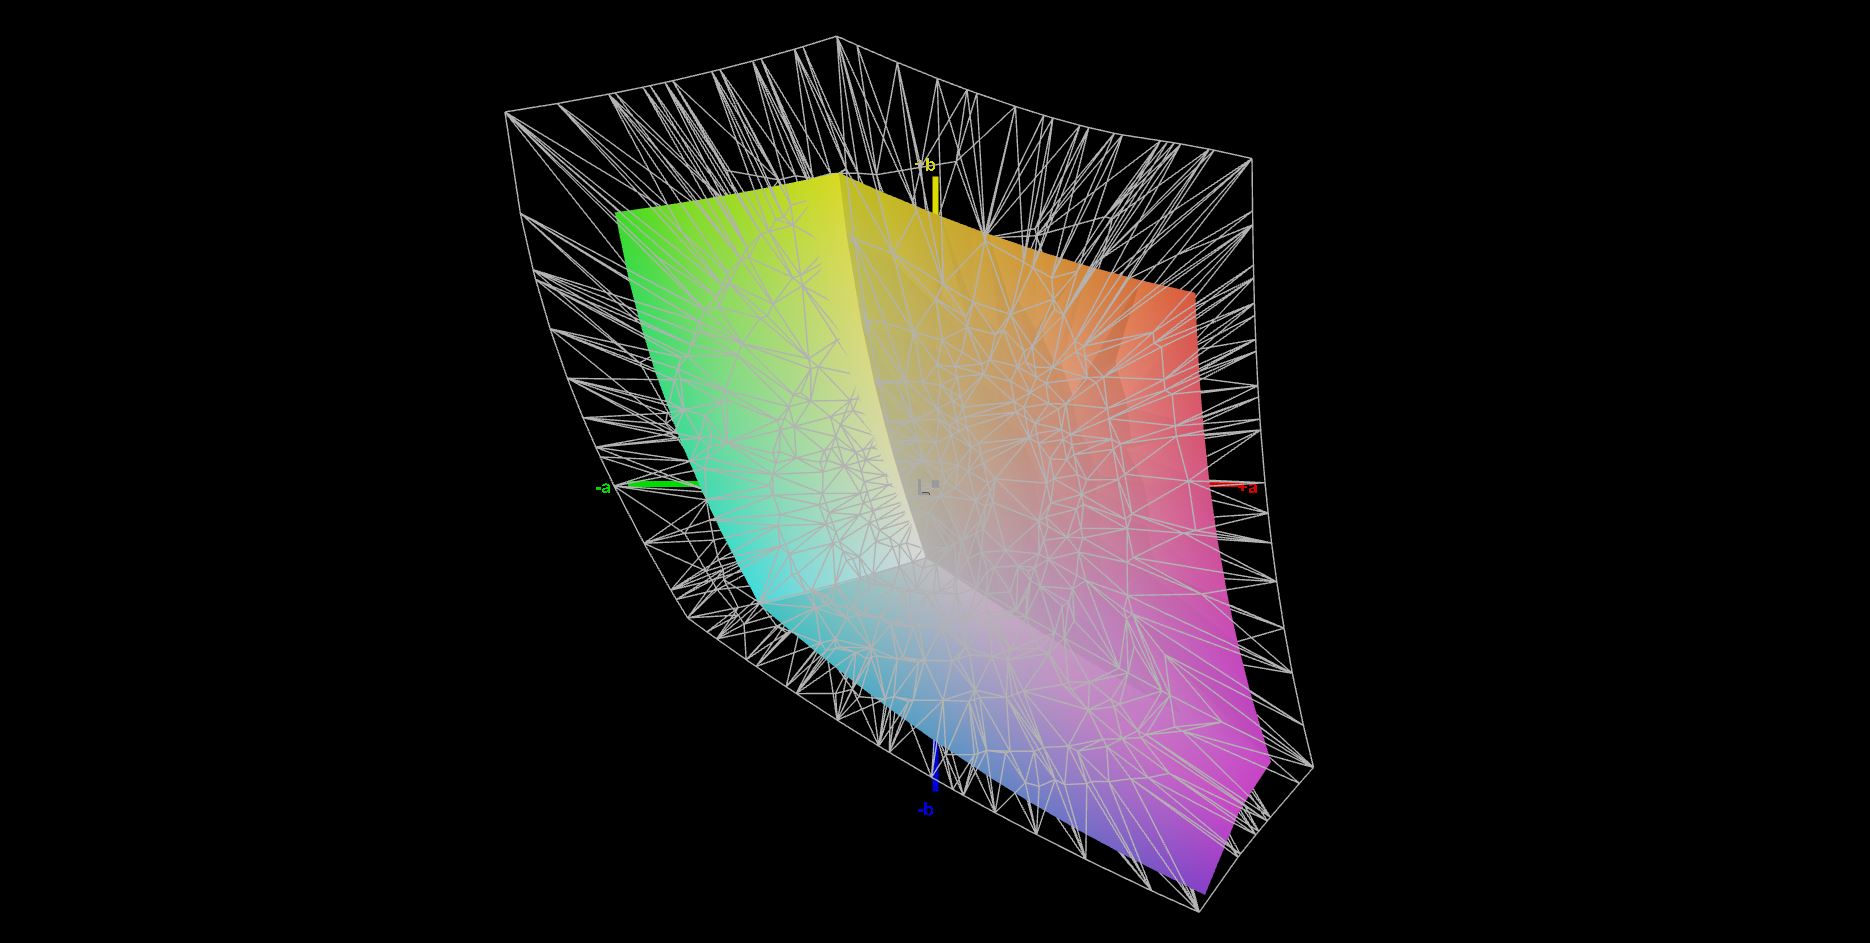
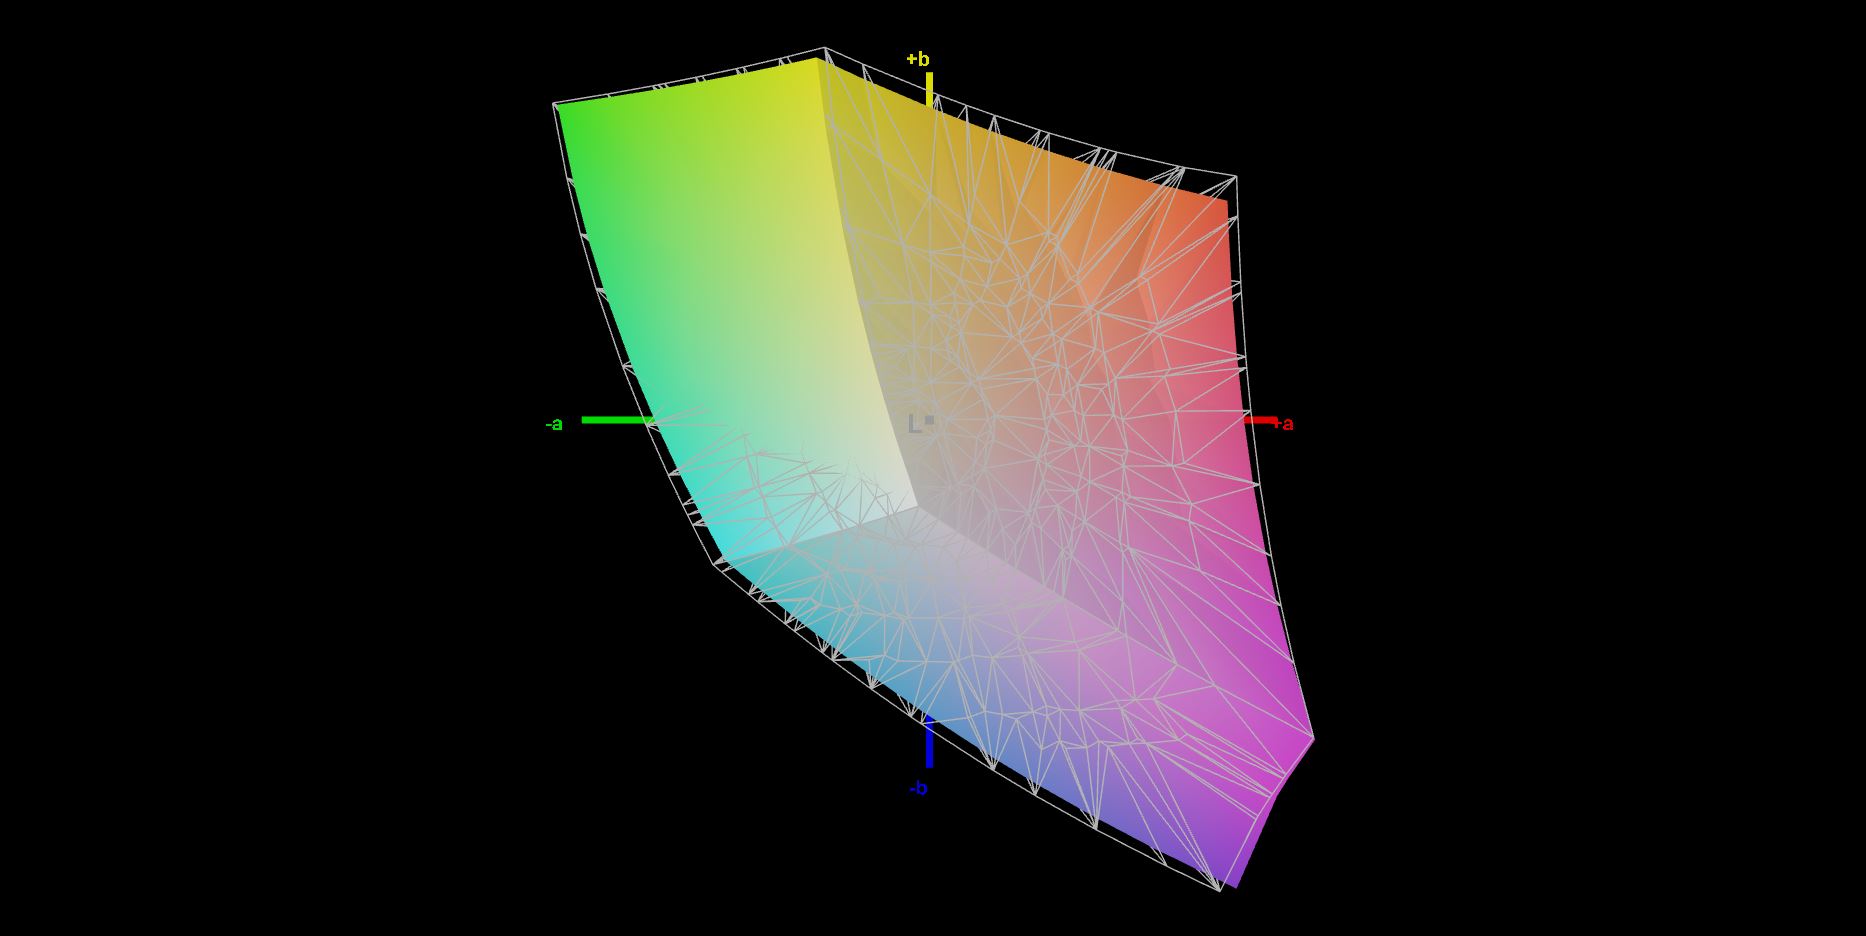
A brilhante tela IPS da Obra 17 da Schenker não é perfeita em termos de cobertura de cor-espaço e relação de contraste, mas é boa. Uma cobertura de espaço de cor de 93,9% RGB é mais do que suficiente para um laptop de escritório. O brilho da tela de 390,3 cd/m² em média também é bastante alto, o que permite uma boa legibilidade na maioria das vezes, apesar do fato de que a distribuição de brilho não está particularmente aqui. Às vezes, pontos brilhantes nos quatro cantos podem ser vistos a olho nu, apesar da boa relação de contraste de 1.029:1
| |||||||||||||||||||||||||
iluminação: 89 %
iluminação com acumulador: 421 cd/m²
Contraste: 1029:1 (Preto: 0.41 cd/m²)
ΔE ColorChecker Calman: 2.5 | ∀{0.5-29.43 Ø4.71}
calibrated: 1.1
ΔE Greyscale Calman: 2.9 | ∀{0.09-98 Ø4.96}
64.4% AdobeRGB 1998 (Argyll 3D)
93.9% sRGB (Argyll 3D)
62.6% Display P3 (Argyll 3D)
Gamma: 2.36
CCT: 6992 K
| Schenker Work 17 Tiger Lake-H LGD0621, IPS, 1920x1080, 17.3" | LG Gram 17Z90P-G.AA56G IPS, 2560x1600, 17" | Acer Aspire 5 A517-52G-79Z5 BOE084E, IPS, 1920x1080, 17.3" | Acer Aspire 3 A317-51G-72MD BOE CQ NV173FHM-N41, IPS, 1920x1080, 17.3" | Dell Inspiron 15 3505-PXHPW AU Optronics B156HAN, IPS, 1920x1080, 15.6" | Schenker Work 15 Tiger Lake-H BOE07D8, IPS, 1920x1080, 15.6" | |
|---|---|---|---|---|---|---|
| Display | 28% | -36% | -3% | -36% | -2% | |
| Display P3 Coverage (%) | 62.6 | 93 49% | 39.98 -36% | 63.4 1% | 40.3 -36% | 64.5 3% |
| sRGB Coverage (%) | 93.9 | 98.8 5% | 59.3 -37% | 86.9 -7% | 60.4 -36% | 86.2 -8% |
| AdobeRGB 1998 Coverage (%) | 64.4 | 83.9 30% | 41.3 -36% | 63.2 -2% | 41.7 -35% | 62.9 -2% |
| Response Times | 7% | 69% | 36% | 5% | -36% | |
| Response Time Grey 50% / Grey 80% * (ms) | 42.4 ? | 47 ? -11% | 14 ? 67% | 29 ? 32% | 36 ? 15% | 58.4 ? -38% |
| Response Time Black / White * (ms) | 26.4 ? | 20 ? 24% | 8 ? 70% | 16 ? 39% | 28 ? -6% | 35.2 ? -33% |
| PWM Frequency (Hz) | 2500 ? | |||||
| Screen | -14% | -21% | -28% | -54% | -49% | |
| Brightness middle (cd/m²) | 422 | 404 -4% | 321 -24% | 261 -38% | 235 -44% | 329 -22% |
| Brightness (cd/m²) | 390 | 323 -17% | 282 -28% | 258 -34% | 231 -41% | 316 -19% |
| Brightness Distribution (%) | 89 | 73 -18% | 81 -9% | 81 -9% | 84 -6% | 92 3% |
| Black Level * (cd/m²) | 0.41 | 0.425 -4% | 0.36 12% | 0.17 59% | 0.25 39% | 0.3 27% |
| Contrast (:1) | 1029 | 951 -8% | 892 -13% | 1535 49% | 940 -9% | 1097 7% |
| Colorchecker dE 2000 * | 2.5 | 3.46 -38% | 4.3 -72% | 4.25 -70% | 4.11 -64% | 5.4 -116% |
| Colorchecker dE 2000 max. * | 4.6 | 5.23 -14% | 7.1 -54% | 7.39 -61% | 6.72 -46% | 10.1 -120% |
| Colorchecker dE 2000 calibrated * | 1.1 | 2.1 -91% | 4.56 -315% | 2.5 -127% | ||
| Greyscale dE 2000 * | 2.9 | 3.12 -8% | 2.26 22% | 4.48 -54% | 2.79 4% | 5.1 -76% |
| Gamma | 2.36 93% | 2.46 89% | 2.36 93% | 2.5 88% | 2.53 87% | 2.1 105% |
| CCT | 6992 93% | 7114 91% | 6650 98% | 7264 89% | 6666 98% | 7609 85% |
| Color Space (Percent of AdobeRGB 1998) (%) | 38 | 56.8 | ||||
| Color Space (Percent of sRGB) (%) | 59 | 86.7 | ||||
| Média Total (Programa/Configurações) | 7% /
-1% | 4% /
-11% | 2% /
-13% | -28% /
-41% | -29% /
-37% |
* ... menor é melhor
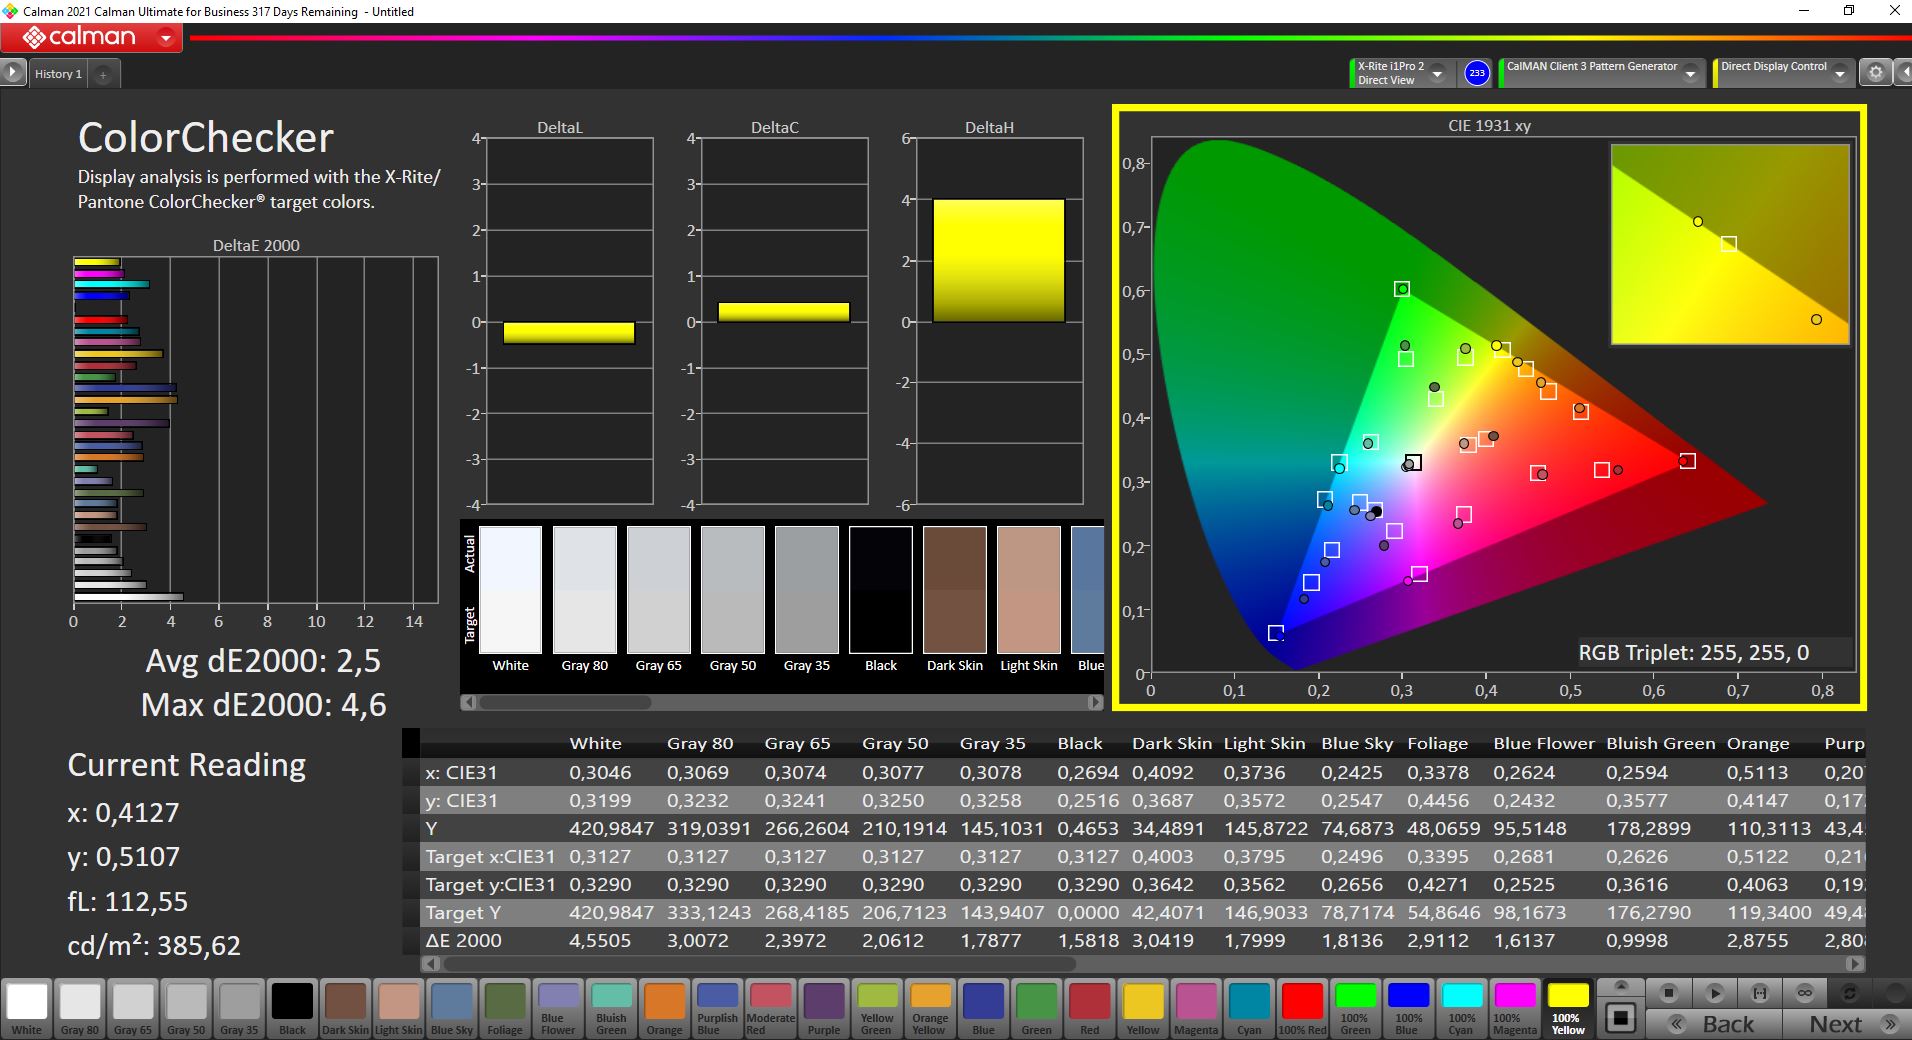
De acordo com o CalMan ColorChecker, o Schenker Work 17 vem com uma reprodução de cor relativamente precisa fora da caixa incluindo uma média baixa ΔΕ de apenas 2,5. Usando o perfil ICC que criamos (download na caixa de informações), tanto os desvios de cor absolutos como médios caem a um nível que é pouco perceptível. Não há aqui nenhum desvio de cor perceptível. Afinal, apenas pequenas mudanças nos valores das cores sólidas RGB são o que faz com que o espaço de cor sRGB não seja coberto a 100%
Exibir tempos de resposta
| ↔ Tempo de resposta preto para branco | ||
|---|---|---|
| 26.4 ms ... ascensão ↗ e queda ↘ combinadas | ↗ 10.8 ms ascensão | 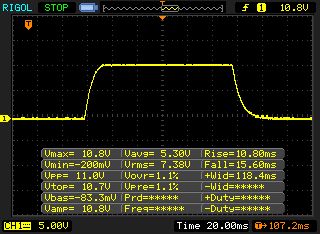 |
| ↘ 15.6 ms queda | ||
| A tela mostra taxas de resposta relativamente lentas em nossos testes e pode ser muito lenta para os jogadores. Em comparação, todos os dispositivos testados variam de 0.1 (mínimo) a 240 (máximo) ms. » 66 % de todos os dispositivos são melhores. Isso significa que o tempo de resposta medido é pior que a média de todos os dispositivos testados (19.8 ms). | ||
| ↔ Tempo de resposta 50% cinza a 80% cinza | ||
| 42.4 ms ... ascensão ↗ e queda ↘ combinadas | ↗ 22.8 ms ascensão | 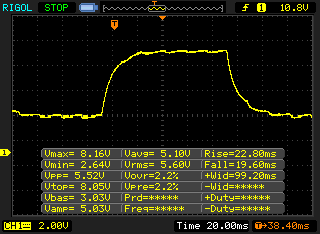 |
| ↘ 19.6 ms queda | ||
| A tela mostra taxas de resposta lentas em nossos testes e será insatisfatória para os jogadores. Em comparação, todos os dispositivos testados variam de 0.165 (mínimo) a 636 (máximo) ms. » 70 % de todos os dispositivos são melhores. Isso significa que o tempo de resposta medido é pior que a média de todos os dispositivos testados (30.9 ms). | ||
Cintilação da tela / PWM (modulação por largura de pulso)
| Tela tremeluzindo / PWM não detectado | 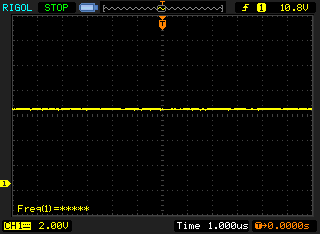 | ||
[pwm_comparison] Em comparação: 52 % de todos os dispositivos testados não usam PWM para escurecer a tela. Se PWM foi detectado, uma média de 7748 (mínimo: 5 - máximo: 343500) Hz foi medida. | |||
A tela mate revela outra força também no uso externo. Desde que o sol não seja diretamente refletido fora do painel, a tela brilhante pode sempre ser lida bem. Não há praticamente nenhuma diferença, exceto pelo brilho quando visto de todos os ângulos possíveis.

Desempenho - Hardware forte para trabalho de escritório
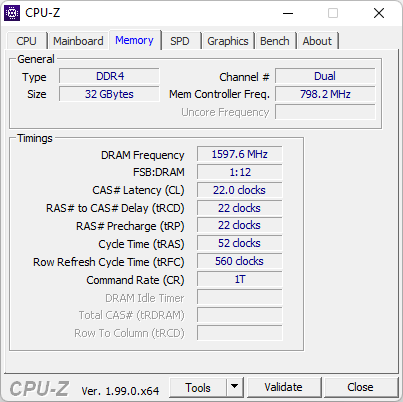
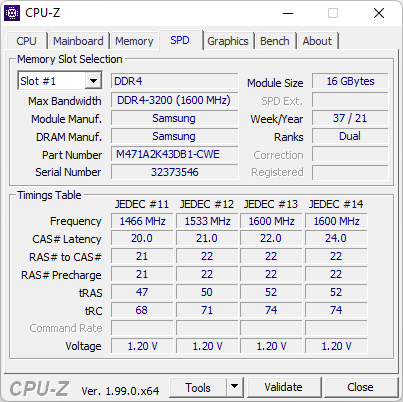
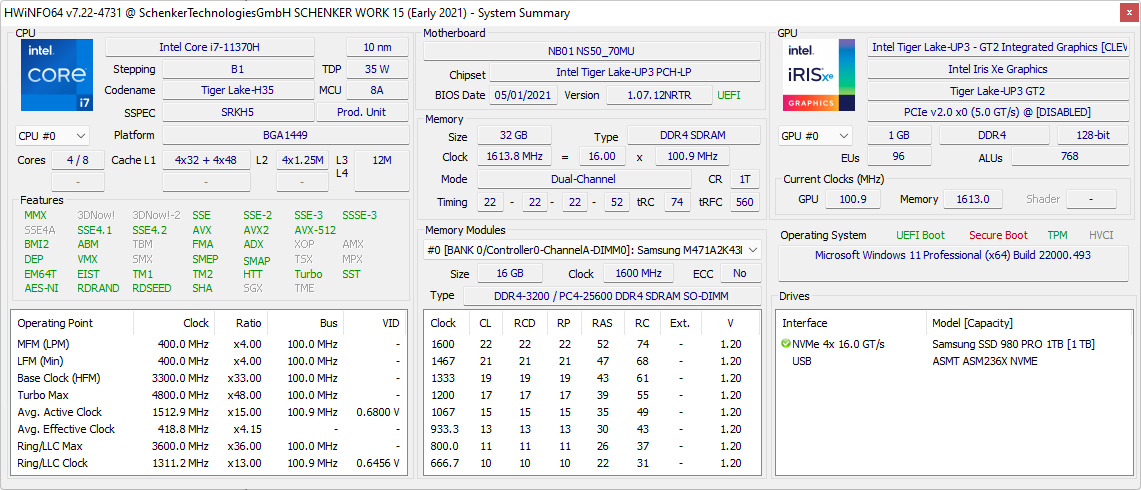
Com um Intel Core i7-11370H, 32 GB de RAM, e um rápido Samsung 980 Pro com 1 TB de armazenamento, nossa amostra de revisão quase representa a melhor configuração possível da Schenker. As várias outras configurações aqui permitem entre 8 e 64 GB de RAM e até 8 TB de armazenamento em disco rígido
Condições de teste
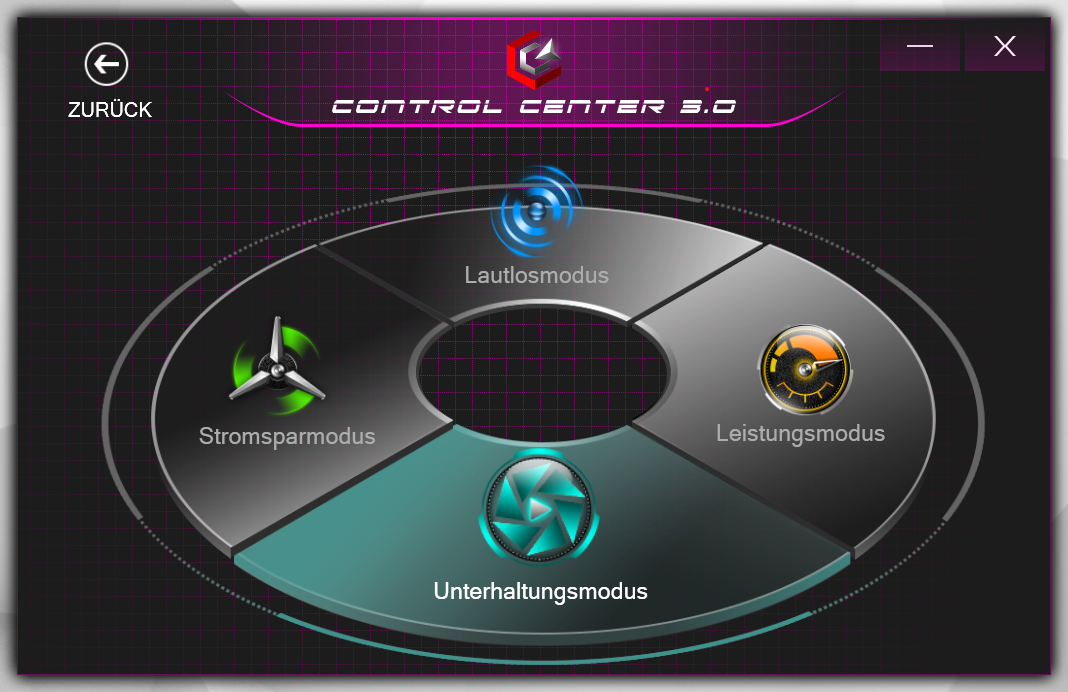
O Centro de Controle Schenker oferece muitas configurações para ajustar o desempenho. Os benchmarks foram executados no Modo Entretenimento, que oferece um bom equilíbrio entre o volume do ventilador, eficiência energética e desempenho. Como resultado, um PL2 de 42 watts e um PL1 de cerca de 22 watts estão disponíveis para o Intel Core i7. Dependendo da aplicação e do local, os valores do PL1 no Modo Entretenimento às vezes são ajustados significativamente para cima ou para baixo. No teste de estresse, foram observados até mesmo valores de apenas 16 watts.
No modo Performance, o PL1 é aumentado para até 35 watts, mas isso também aumenta drasticamente as temperaturas do núcleo. Na maioria dos benchmarks onde o processador não está sob carga prolongada, não há praticamente nenhuma diferença entre o Modo de Desempenho e o Modo de Entretenimento. O desempenho de Boost do processador é igualmente bom em ambos.
Já comparamos o Modo de Desempenho e o Modo de Entretenimento na revisão do Schenker Work 15. Uma vez que ambos os laptops não diferem um do outro em termos de hardware, os resultados devem ser bastante semelhantes aqui.
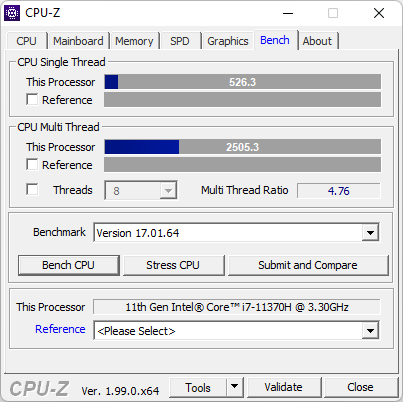
Processador
Com um alto desempenho de impulso e boa eficiência de temperatura, oIntel Core i7-11370H é particularmente adequado para laptops finos com altas exigências de desempenho com seus quatro núcleos. Dependendo do modo de desempenho, o processador às vezes exibe um desempenho de computação abaixo da média em testes mais longos, mas pode marcar pontos durante picos de carga curtos em particular e em operação com um único núcleo. No modo de desempenho, o PL1 está a uma constante de 35 watts, enquanto que no modo de entretenimento oscila entre 22 watts e 16 watts.
Na energia da bateria, o desempenho do processador é restrito em certa medida. Novamente, o controle de desempenho do laptop tem valores diferentes, dependendo do plano de economia de energia. No modo de desempenho, a análise do registro mostra que o PL1 é ajustado para 35 watts, enquanto o processador é fornecido apenas com 25 watts na realidade.
Cinebench R15 Multi endurance test
Cinebench R23: Multi Core | Single Core
Cinebench R20: CPU (Multi Core) | CPU (Single Core)
Cinebench R15: CPU Multi 64Bit | CPU Single 64Bit
Blender: v2.79 BMW27 CPU
7-Zip 18.03: 7z b 4 | 7z b 4 -mmt1
Geekbench 5.5: Multi-Core | Single-Core
HWBOT x265 Benchmark v2.2: 4k Preset
LibreOffice : 20 Documents To PDF
R Benchmark 2.5: Overall mean
| CPU Performance rating | |
| Média da turma Office | |
| Média Intel Core i7-11370H | |
| Acer Aspire 5 A517-52G-79Z5 | |
| Schenker Work 15 Tiger Lake-H | |
| Schenker Work 17 Tiger Lake-H | |
| LG Gram 17Z90P-G.AA56G | |
| Acer Aspire 3 A317-51G-72MD -2! | |
| Dell Inspiron 15 3505-PXHPW | |
| Cinebench R23 / Multi Core | |
| Média da turma Office (1673 - 22808, n=76, últimos 2 anos) | |
| Média Intel Core i7-11370H (3696 - 6646, n=12) | |
| Acer Aspire 5 A517-52G-79Z5 | |
| Schenker Work 15 Tiger Lake-H | |
| Schenker Work 17 Tiger Lake-H | |
| LG Gram 17Z90P-G.AA56G | |
| Dell Inspiron 15 3505-PXHPW | |
| Cinebench R23 / Single Core | |
| Média da turma Office (708 - 2130, n=76, últimos 2 anos) | |
| Acer Aspire 5 A517-52G-79Z5 | |
| Média Intel Core i7-11370H (1081 - 1556, n=11) | |
| Schenker Work 15 Tiger Lake-H | |
| LG Gram 17Z90P-G.AA56G | |
| Schenker Work 17 Tiger Lake-H | |
| Dell Inspiron 15 3505-PXHPW | |
| Cinebench R20 / CPU (Multi Core) | |
| Média da turma Office (648 - 8840, n=75, últimos 2 anos) | |
| Média Intel Core i7-11370H (1438 - 2578, n=11) | |
| Acer Aspire 5 A517-52G-79Z5 | |
| Schenker Work 15 Tiger Lake-H | |
| Schenker Work 17 Tiger Lake-H | |
| LG Gram 17Z90P-G.AA56G | |
| Acer Aspire 3 A317-51G-72MD | |
| Dell Inspiron 15 3505-PXHPW | |
| Cinebench R20 / CPU (Single Core) | |
| Média da turma Office (345 - 816, n=75, últimos 2 anos) | |
| Acer Aspire 5 A517-52G-79Z5 | |
| Média Intel Core i7-11370H (475 - 601, n=11) | |
| Schenker Work 15 Tiger Lake-H | |
| LG Gram 17Z90P-G.AA56G | |
| Schenker Work 17 Tiger Lake-H | |
| Acer Aspire 3 A317-51G-72MD | |
| Dell Inspiron 15 3505-PXHPW | |
| Cinebench R15 / CPU Multi 64Bit | |
| Média da turma Office (250 - 3380, n=77, últimos 2 anos) | |
| Média Intel Core i7-11370H (606 - 1086, n=17) | |
| Schenker Work 15 Tiger Lake-H | |
| Schenker Work 15 Tiger Lake-H | |
| Schenker Work 15 Tiger Lake-H | |
| Schenker Work 17 Tiger Lake-H | |
| Schenker Work 17 Tiger Lake-H | |
| Acer Aspire 5 A517-52G-79Z5 | |
| LG Gram 17Z90P-G.AA56G | |
| Dell Inspiron 15 3505-PXHPW | |
| Acer Aspire 3 A317-51G-72MD | |
| Cinebench R15 / CPU Single 64Bit | |
| Média da turma Office (99.5 - 316, n=77, últimos 2 anos) | |
| Acer Aspire 5 A517-52G-79Z5 | |
| Média Intel Core i7-11370H (162.9 - 233, n=15) | |
| Schenker Work 15 Tiger Lake-H | |
| Schenker Work 15 Tiger Lake-H | |
| Schenker Work 17 Tiger Lake-H | |
| Schenker Work 17 Tiger Lake-H | |
| LG Gram 17Z90P-G.AA56G | |
| Acer Aspire 3 A317-51G-72MD | |
| Dell Inspiron 15 3505-PXHPW | |
| Blender / v2.79 BMW27 CPU | |
| Dell Inspiron 15 3505-PXHPW | |
| Acer Aspire 3 A317-51G-72MD | |
| LG Gram 17Z90P-G.AA56G | |
| Schenker Work 17 Tiger Lake-H | |
| Schenker Work 15 Tiger Lake-H | |
| Acer Aspire 5 A517-52G-79Z5 | |
| Média Intel Core i7-11370H (432 - 762, n=11) | |
| Média da turma Office (158 - 1940, n=76, últimos 2 anos) | |
| 7-Zip 18.03 / 7z b 4 | |
| Média da turma Office (7098 - 76886, n=77, últimos 2 anos) | |
| Média Intel Core i7-11370H (18961 - 28520, n=11) | |
| Acer Aspire 5 A517-52G-79Z5 | |
| Schenker Work 15 Tiger Lake-H | |
| Schenker Work 17 Tiger Lake-H | |
| LG Gram 17Z90P-G.AA56G | |
| Acer Aspire 3 A317-51G-72MD | |
| Dell Inspiron 15 3505-PXHPW | |
| 7-Zip 18.03 / 7z b 4 -mmt1 | |
| Média da turma Office (3387 - 6469, n=77, últimos 2 anos) | |
| Acer Aspire 5 A517-52G-79Z5 | |
| Média Intel Core i7-11370H (5074 - 5550, n=11) | |
| Schenker Work 15 Tiger Lake-H | |
| Schenker Work 17 Tiger Lake-H | |
| Acer Aspire 3 A317-51G-72MD | |
| LG Gram 17Z90P-G.AA56G | |
| Dell Inspiron 15 3505-PXHPW | |
| Geekbench 5.5 / Multi-Core | |
| Média da turma Office (1483 - 16999, n=73, últimos 2 anos) | |
| Schenker Work 15 Tiger Lake-H | |
| Média Intel Core i7-11370H (3828 - 6115, n=10) | |
| Acer Aspire 5 A517-52G-79Z5 | |
| LG Gram 17Z90P-G.AA56G | |
| Schenker Work 17 Tiger Lake-H | |
| Acer Aspire 3 A317-51G-72MD | |
| Dell Inspiron 15 3505-PXHPW | |
| Geekbench 5.5 / Single-Core | |
| Média da turma Office (811 - 2175, n=73, últimos 2 anos) | |
| Acer Aspire 5 A517-52G-79Z5 | |
| Schenker Work 15 Tiger Lake-H | |
| Média Intel Core i7-11370H (1376 - 1607, n=10) | |
| Schenker Work 17 Tiger Lake-H | |
| LG Gram 17Z90P-G.AA56G | |
| Acer Aspire 3 A317-51G-72MD | |
| Dell Inspiron 15 3505-PXHPW | |
| HWBOT x265 Benchmark v2.2 / 4k Preset | |
| Média da turma Office (2.21 - 26, n=76, últimos 2 anos) | |
| Média Intel Core i7-11370H (4.98 - 8.82, n=11) | |
| Acer Aspire 5 A517-52G-79Z5 | |
| Schenker Work 15 Tiger Lake-H | |
| Schenker Work 17 Tiger Lake-H | |
| LG Gram 17Z90P-G.AA56G | |
| Acer Aspire 3 A317-51G-72MD | |
| Dell Inspiron 15 3505-PXHPW | |
| LibreOffice / 20 Documents To PDF | |
| Dell Inspiron 15 3505-PXHPW | |
| Acer Aspire 3 A317-51G-72MD | |
| Média da turma Office (39.9 - 102.3, n=76, últimos 2 anos) | |
| Acer Aspire 5 A517-52G-79Z5 | |
| LG Gram 17Z90P-G.AA56G | |
| Média Intel Core i7-11370H (23.6 - 56.5, n=11) | |
| Schenker Work 15 Tiger Lake-H | |
| Schenker Work 17 Tiger Lake-H | |
| R Benchmark 2.5 / Overall mean | |
| Dell Inspiron 15 3505-PXHPW | |
| LG Gram 17Z90P-G.AA56G | |
| Acer Aspire 3 A317-51G-72MD | |
| Schenker Work 17 Tiger Lake-H | |
| Schenker Work 15 Tiger Lake-H | |
| Acer Aspire 5 A517-52G-79Z5 | |
| Média Intel Core i7-11370H (0.544 - 0.596, n=11) | |
| Média da turma Office (0.393 - 0.888, n=76, últimos 2 anos) | |
* ... menor é melhor
AIDA64: FP32 Ray-Trace | FPU Julia | CPU SHA3 | CPU Queen | FPU SinJulia | FPU Mandel | CPU AES | CPU ZLib | FP64 Ray-Trace | CPU PhotoWorxx
| Performance rating | |
| Média da turma Office | |
| Schenker Work 15 Tiger Lake-H | |
| Média Intel Core i7-11370H | |
| Schenker Work 17 Tiger Lake-H | |
| LG Gram 17Z90P-G.AA56G | |
| Acer Aspire 3 A317-51G-72MD | |
| Dell Inspiron 15 3505-PXHPW | |
| AIDA64 / FP32 Ray-Trace | |
| Média da turma Office (2083 - 31245, n=83, últimos 2 anos) | |
| Média Intel Core i7-11370H (5204 - 8413, n=10) | |
| Schenker Work 15 Tiger Lake-H | |
| LG Gram 17Z90P-G.AA56G | |
| Schenker Work 17 Tiger Lake-H | |
| Acer Aspire 3 A317-51G-72MD | |
| Dell Inspiron 15 3505-PXHPW | |
| AIDA64 / FPU Julia | |
| Média da turma Office (8191 - 125394, n=83, últimos 2 anos) | |
| Média Intel Core i7-11370H (23958 - 34020, n=10) | |
| Schenker Work 15 Tiger Lake-H | |
| Schenker Work 17 Tiger Lake-H | |
| LG Gram 17Z90P-G.AA56G | |
| Acer Aspire 3 A317-51G-72MD | |
| Dell Inspiron 15 3505-PXHPW | |
| AIDA64 / CPU SHA3 | |
| Média da turma Office (433 - 5755, n=83, últimos 2 anos) | |
| Média Intel Core i7-11370H (1656 - 2297, n=10) | |
| Schenker Work 15 Tiger Lake-H | |
| Schenker Work 17 Tiger Lake-H | |
| LG Gram 17Z90P-G.AA56G | |
| Acer Aspire 3 A317-51G-72MD | |
| Dell Inspiron 15 3505-PXHPW | |
| AIDA64 / CPU Queen | |
| Média da turma Office (22784 - 115197, n=67, últimos 2 anos) | |
| Schenker Work 15 Tiger Lake-H | |
| Média Intel Core i7-11370H (42086 - 52930, n=10) | |
| Acer Aspire 3 A317-51G-72MD | |
| Schenker Work 17 Tiger Lake-H | |
| LG Gram 17Z90P-G.AA56G | |
| Dell Inspiron 15 3505-PXHPW | |
| AIDA64 / FPU SinJulia | |
| Média da turma Office (1378 - 18321, n=83, últimos 2 anos) | |
| Schenker Work 15 Tiger Lake-H | |
| Dell Inspiron 15 3505-PXHPW | |
| Média Intel Core i7-11370H (3755 - 5027, n=10) | |
| Schenker Work 17 Tiger Lake-H | |
| LG Gram 17Z90P-G.AA56G | |
| Acer Aspire 3 A317-51G-72MD | |
| AIDA64 / FPU Mandel | |
| Média da turma Office (4601 - 66922, n=83, últimos 2 anos) | |
| Média Intel Core i7-11370H (14433 - 20417, n=10) | |
| Schenker Work 15 Tiger Lake-H | |
| Schenker Work 17 Tiger Lake-H | |
| LG Gram 17Z90P-G.AA56G | |
| Acer Aspire 3 A317-51G-72MD | |
| Dell Inspiron 15 3505-PXHPW | |
| AIDA64 / CPU AES | |
| Schenker Work 15 Tiger Lake-H | |
| Média Intel Core i7-11370H (44267 - 76866, n=10) | |
| Schenker Work 17 Tiger Lake-H | |
| LG Gram 17Z90P-G.AA56G | |
| Média da turma Office (4854 - 155900, n=83, últimos 2 anos) | |
| Dell Inspiron 15 3505-PXHPW | |
| Acer Aspire 3 A317-51G-72MD | |
| AIDA64 / CPU ZLib | |
| Média da turma Office (114.6 - 1366, n=83, últimos 2 anos) | |
| Schenker Work 15 Tiger Lake-H | |
| Média Intel Core i7-11370H (289 - 422, n=10) | |
| Dell Inspiron 15 3505-PXHPW | |
| Schenker Work 17 Tiger Lake-H | |
| LG Gram 17Z90P-G.AA56G | |
| Acer Aspire 3 A317-51G-72MD | |
| AIDA64 / FP64 Ray-Trace | |
| Média da turma Office (1109 - 17834, n=83, últimos 2 anos) | |
| Média Intel Core i7-11370H (2756 - 4551, n=10) | |
| Schenker Work 15 Tiger Lake-H | |
| Schenker Work 17 Tiger Lake-H | |
| LG Gram 17Z90P-G.AA56G | |
| Acer Aspire 3 A317-51G-72MD | |
| Dell Inspiron 15 3505-PXHPW | |
| AIDA64 / CPU PhotoWorxx | |
| LG Gram 17Z90P-G.AA56G | |
| Média da turma Office (11090 - 65229, n=83, últimos 2 anos) | |
| Schenker Work 17 Tiger Lake-H | |
| Schenker Work 15 Tiger Lake-H | |
| Média Intel Core i7-11370H (15892 - 40069, n=10) | |
| Acer Aspire 3 A317-51G-72MD | |
| Dell Inspiron 15 3505-PXHPW | |
Desempenho do sistema
Graças ao alto desempenho Boost, RAM ampla e rápida, assim como o rápido SSD da Samsung, o desempenho do sistema Schenker Work 17 está em um nível muito alto. Isto é confirmado pelos resultados acima da média PCMark10 para um laptop de escritório. Além disso, nenhum ponto de crítica pode ser encontrado no uso diário aqui. Entretanto, a Schenker Work 17 está atrasada em relação àSchenker Work 15 em quase todas as referências, apesar de ter o mesmo hardware.
CrossMark: Overall | Productivity | Creativity | Responsiveness
| PCMark 10 / Score | |
| Média da turma Office (2601 - 9298, n=68, últimos 2 anos) | |
| Schenker Work 15 Tiger Lake-H | |
| Média Intel Core i7-11370H, Intel Iris Xe Graphics G7 96EUs (5199 - 5459, n=6) | |
| Schenker Work 17 Tiger Lake-H | |
| Acer Aspire 5 A517-52G-79Z5 | |
| LG Gram 17Z90P-G.AA56G | |
| Acer Aspire 3 A317-51G-72MD | |
| Dell Inspiron 15 3505-PXHPW | |
| PCMark 10 / Essentials | |
| Schenker Work 17 Tiger Lake-H | |
| Schenker Work 15 Tiger Lake-H | |
| Média Intel Core i7-11370H, Intel Iris Xe Graphics G7 96EUs (9996 - 10650, n=6) | |
| Média da turma Office (3245 - 11594, n=68, últimos 2 anos) | |
| LG Gram 17Z90P-G.AA56G | |
| Acer Aspire 5 A517-52G-79Z5 | |
| Acer Aspire 3 A317-51G-72MD | |
| Dell Inspiron 15 3505-PXHPW | |
| PCMark 10 / Productivity | |
| Média da turma Office (5336 - 17243, n=68, últimos 2 anos) | |
| Acer Aspire 5 A517-52G-79Z5 | |
| Acer Aspire 3 A317-51G-72MD | |
| Média Intel Core i7-11370H, Intel Iris Xe Graphics G7 96EUs (6911 - 7388, n=6) | |
| Schenker Work 15 Tiger Lake-H | |
| Schenker Work 17 Tiger Lake-H | |
| LG Gram 17Z90P-G.AA56G | |
| Dell Inspiron 15 3505-PXHPW | |
| PCMark 10 / Digital Content Creation | |
| Média da turma Office (2049 - 13541, n=68, últimos 2 anos) | |
| Schenker Work 15 Tiger Lake-H | |
| Média Intel Core i7-11370H, Intel Iris Xe Graphics G7 96EUs (5483 - 5838, n=6) | |
| Schenker Work 17 Tiger Lake-H | |
| Acer Aspire 5 A517-52G-79Z5 | |
| LG Gram 17Z90P-G.AA56G | |
| Acer Aspire 3 A317-51G-72MD | |
| Dell Inspiron 15 3505-PXHPW | |
| CrossMark / Overall | |
| Média da turma Office (381 - 2010, n=75, últimos 2 anos) | |
| Média Intel Core i7-11370H, Intel Iris Xe Graphics G7 96EUs (n=1) | |
| Dell Inspiron 15 3505-PXHPW | |
| CrossMark / Productivity | |
| Média da turma Office (464 - 1880, n=75, últimos 2 anos) | |
| Média Intel Core i7-11370H, Intel Iris Xe Graphics G7 96EUs (n=1) | |
| Dell Inspiron 15 3505-PXHPW | |
| CrossMark / Creativity | |
| Média da turma Office (319 - 2361, n=75, últimos 2 anos) | |
| Média Intel Core i7-11370H, Intel Iris Xe Graphics G7 96EUs (n=1) | |
| Dell Inspiron 15 3505-PXHPW | |
| CrossMark / Responsiveness | |
| Média da turma Office (360 - 1820, n=75, últimos 2 anos) | |
| Média Intel Core i7-11370H, Intel Iris Xe Graphics G7 96EUs (n=1) | |
| Dell Inspiron 15 3505-PXHPW | |
| PCMark 10 Score | 5317 pontos | |
Ajuda | ||
| AIDA64 / Memory Copy | |
| Média da turma Office (20075 - 110930, n=80, últimos 2 anos) | |
| LG Gram 17Z90P-G.AA56G | |
| Schenker Work 15 Tiger Lake-H | |
| Schenker Work 17 Tiger Lake-H | |
| Média Intel Core i7-11370H (32035 - 64524, n=10) | |
| Acer Aspire 3 A317-51G-72MD | |
| Dell Inspiron 15 3505-PXHPW | |
| AIDA64 / Memory Read | |
| Média da turma Office (10084 - 128030, n=81, últimos 2 anos) | |
| LG Gram 17Z90P-G.AA56G | |
| Schenker Work 17 Tiger Lake-H | |
| Schenker Work 15 Tiger Lake-H | |
| Média Intel Core i7-11370H (37216 - 62417, n=10) | |
| Acer Aspire 3 A317-51G-72MD | |
| Dell Inspiron 15 3505-PXHPW | |
| AIDA64 / Memory Write | |
| Média da turma Office (20073 - 119858, n=81, últimos 2 anos) | |
| LG Gram 17Z90P-G.AA56G | |
| Média Intel Core i7-11370H (36920 - 65610, n=10) | |
| Schenker Work 17 Tiger Lake-H | |
| Schenker Work 15 Tiger Lake-H | |
| Acer Aspire 3 A317-51G-72MD | |
| Dell Inspiron 15 3505-PXHPW | |
| AIDA64 / Memory Latency | |
| Média da turma Office (7.6 - 162.9, n=76, últimos 2 anos) | |
| Dell Inspiron 15 3505-PXHPW | |
| Schenker Work 17 Tiger Lake-H | |
| Média Intel Core i7-11370H (73.4 - 103, n=10) | |
| LG Gram 17Z90P-G.AA56G | |
| Schenker Work 15 Tiger Lake-H | |
| Acer Aspire 3 A317-51G-72MD | |
* ... menor é melhor
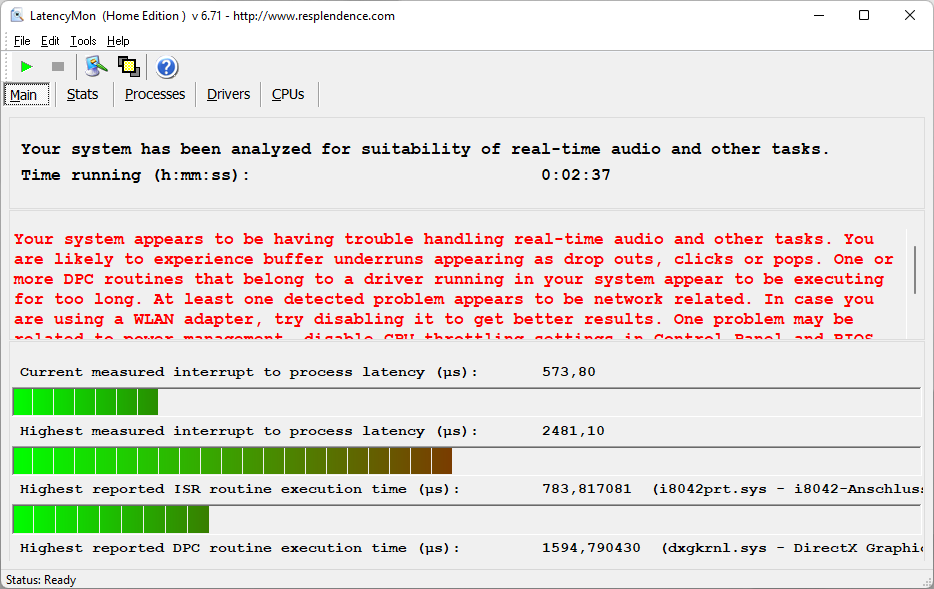
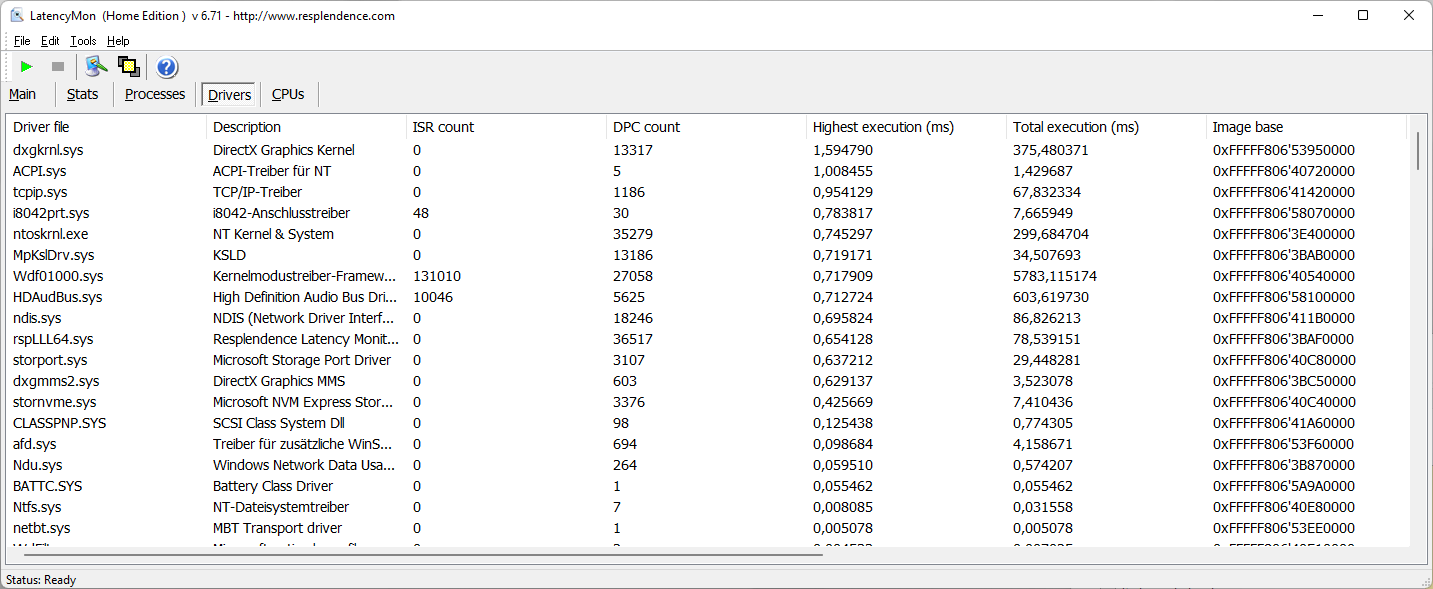
Latências DPC
Com latências DPC de até 2,48 ms, o laptop de escritório não é adequado para aplicações em tempo real, mas as atualizações do driver poderiam remediar isso rapidamente. Entretanto, a Schenker Work 17 gerencia o vídeo de teste 4K YouTube sem deixar cair quadros
| DPC Latencies / LatencyMon - interrupt to process latency (max), Web, Youtube, Prime95 | |
| Schenker Work 17 Tiger Lake-H | |
| Dell Inspiron 15 3505-PXHPW | |
| Acer Aspire 5 A517-52G-79Z5 | |
| Acer Aspire 3 A317-51G-72MD | |
| Schenker Work 15 Tiger Lake-H | |
| LG Gram 17Z90P-G.AA56G | |
* ... menor é melhor
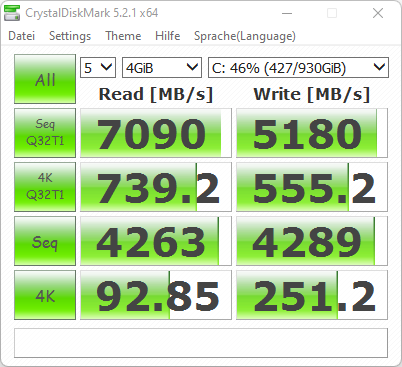
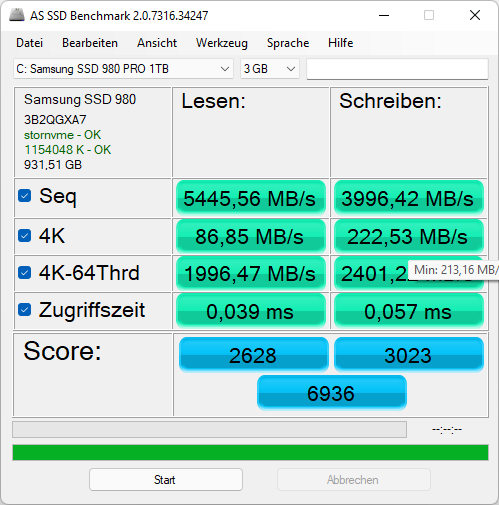
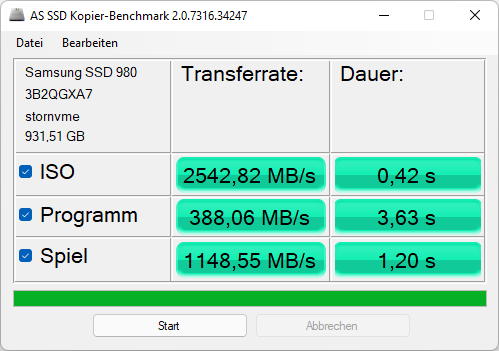
Armazenamento
De acordo com nosso Artigo de Benchmarks HDD/SDDo Samsung Pro 980 com 1 TB de armazenamento é uma das unidades de estado sólido mais rápidas. O NVMe SSD também funciona em sua alta velocidade esperada no Schenker Work 17.

| Drive Performance rating - Percent | |
| Média Samsung SSD 980 Pro 1TB MZ-V8P1T0BW | |
| Schenker Work 15 Tiger Lake-H | |
| Schenker Work 17 Tiger Lake-H | |
| Média da turma Office | |
| LG Gram 17Z90P-G.AA56G | |
| Acer Aspire 5 A517-52G-79Z5 | |
| Acer Aspire 3 A317-51G-72MD -1! | |
| Dell Inspiron 15 3505-PXHPW | |
* ... menor é melhor
Continuous load read: DiskSpd Read Loop, Queue Depth 8
Placa gráfica
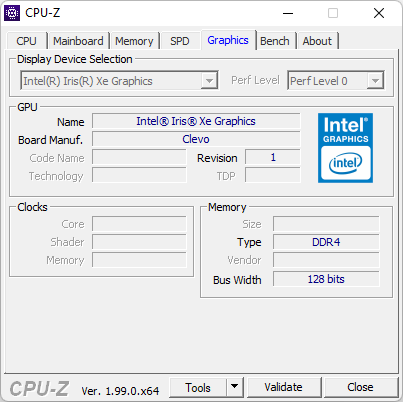
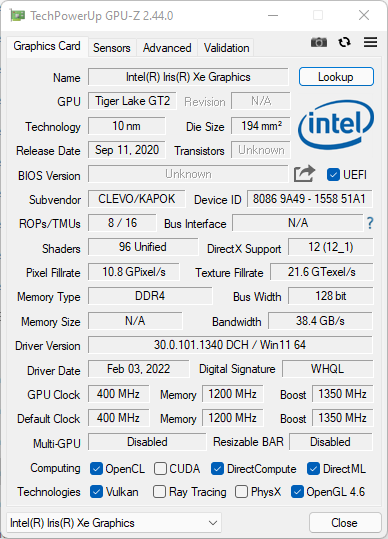
OIntel Xe Graphics G7 com 96 UE integrada ao Intel Core i7 não é uma placa gráfica para jogadores, mas ainda pode trazer muitos jogos suavemente para a tela, desde que você mantenha as configurações de qualidade baixas. Os benchmarks com o 3DMark também mostram um resultado satisfatório aqui
Principalmente porque o iGPU tem muita memória à sua disposição, ele é capaz de mostrar do que é realmente capaz. Entretanto, os usuários que querem melhorar o desempenho gráfico do laptop também podem usar uma placa gráfica externa através do Thunderbolt 4.
| 3DMark Performance rating - Percent | |
| Média da turma Office | |
| Schenker Work 17 Tiger Lake-H -1! | |
| Schenker Work 15 Tiger Lake-H -2! | |
| Média Intel Iris Xe Graphics G7 96EUs | |
| Acer Aspire 5 A517-52G-79Z5 -1! | |
| LG Gram 17Z90P-G.AA56G -2! | |
| Acer Aspire 3 A317-51G-72MD | |
| Dell Inspiron 15 3505-PXHPW | |
| 3DMark 11 - 1280x720 Performance GPU | |
| Média da turma Office (2551 - 18313, n=72, últimos 2 anos) | |
| Schenker Work 17 Tiger Lake-H | |
| Média Intel Iris Xe Graphics G7 96EUs (2867 - 7676, n=209) | |
| Acer Aspire 5 A517-52G-79Z5 | |
| LG Gram 17Z90P-G.AA56G | |
| Acer Aspire 3 A317-51G-72MD | |
| Dell Inspiron 15 3505-PXHPW | |
| 3DMark | |
| 1280x720 Cloud Gate Standard Graphics | |
| Média da turma Office (11640 - 118515, n=38, últimos 2 anos) | |
| Média Intel Iris Xe Graphics G7 96EUs (13162 - 39880, n=187) | |
| Acer Aspire 5 A517-52G-79Z5 | |
| Acer Aspire 3 A317-51G-72MD | |
| Dell Inspiron 15 3505-PXHPW | |
| 1920x1080 Fire Strike Graphics | |
| Média da turma Office (736 - 21871, n=75, últimos 2 anos) | |
| Schenker Work 17 Tiger Lake-H | |
| Schenker Work 15 Tiger Lake-H | |
| Média Intel Iris Xe Graphics G7 96EUs (2286 - 6624, n=222) | |
| Acer Aspire 5 A517-52G-79Z5 | |
| Acer Aspire 3 A317-51G-72MD | |
| Dell Inspiron 15 3505-PXHPW | |
| 2560x1440 Time Spy Graphics | |
| Média da turma Office (493 - 6679, n=70, últimos 2 anos) | |
| Schenker Work 15 Tiger Lake-H | |
| Média Intel Iris Xe Graphics G7 96EUs (707 - 1890, n=218) | |
| Schenker Work 17 Tiger Lake-H | |
| LG Gram 17Z90P-G.AA56G | |
| Acer Aspire 3 A317-51G-72MD | |
| Dell Inspiron 15 3505-PXHPW | |
| 3DMark 11 Performance | 7137 pontos | |
| 3DMark Fire Strike Score | 4666 pontos | |
| 3DMark Time Spy Score | 1596 pontos | |
Ajuda | ||
| The Witcher 3 | |
| 1920x1080 Ultra Graphics & Postprocessing (HBAO+) | |
| Média da turma Office (14.8 - 28.1, n=3, últimos 2 anos) | |
| Acer Aspire 5 A517-52G-79Z5 | |
| Média Intel Iris Xe Graphics G7 96EUs (8.79 - 20.1, n=181) | |
| Schenker Work 17 Tiger Lake-H | |
| Schenker Work 15 Tiger Lake-H | |
| Acer Aspire 3 A317-51G-72MD | |
| LG Gram 17Z90P-G.AA56G | |
| Dell Inspiron 15 3505-PXHPW | |
| 1366x768 Medium Graphics & Postprocessing | |
| Schenker Work 17 Tiger Lake-H | |
| Média da turma Office (44.7 - 90.4, n=3, últimos 2 anos) | |
| Schenker Work 15 Tiger Lake-H | |
| Média Intel Iris Xe Graphics G7 96EUs (21.4 - 77.8, n=185) | |
| Acer Aspire 5 A517-52G-79Z5 | |
| Acer Aspire 3 A317-51G-72MD | |
| LG Gram 17Z90P-G.AA56G | |
| Dell Inspiron 15 3505-PXHPW | |
| F1 2021 | |
| 1920x1080 High Preset AA:T AF:16x | |
| Schenker Work 17 Tiger Lake-H | |
| Schenker Work 15 Tiger Lake-H | |
| Média Intel Iris Xe Graphics G7 96EUs (24 - 50.8, n=45) | |
| Dell Inspiron 15 3505-PXHPW | |
| 1920x1080 Medium Preset AA:T AF:16x | |
| Schenker Work 17 Tiger Lake-H | |
| Schenker Work 15 Tiger Lake-H | |
| Média Intel Iris Xe Graphics G7 96EUs (29.4 - 64.9, n=45) | |
| Dell Inspiron 15 3505-PXHPW | |
The Witcher 3 FPS diagram
| baixo | média | alto | ultra | |
|---|---|---|---|---|
| GTA V (2015) | 97.8 | 82.5 | 25.2 | 9.72 |
| The Witcher 3 (2015) | 90.3 | 74.1 | 24 | 13 |
| Dota 2 Reborn (2015) | 114 | 101 | 64 | 55.4 |
| Final Fantasy XV Benchmark (2018) | 40.7 | 20.1 | 14.5 | |
| X-Plane 11.11 (2018) | 29.6 | 35 | 32.2 | |
| Strange Brigade (2018) | 88.4 | 37.7 | 30.4 | 24.8 |
| F1 2021 (2021) | 101 | 48.9 | 38.8 | 27.2 |
Emissões e energia - O Centro de Controle permite o ajuste do ruído
Emissões sonoras
Mesmo no Modo Entretenimento, a Obra 17 Schenker é relativamente silenciosa, em torno de 44 dB(A) sob carga total. Usando os modos de desempenho correspondentes, você também pode fazer o laptop funcionar completamente silencioso. Mesmo quando os ventiladores estão funcionando em velocidade máxima, suas características de ruído são muito aceitáveis, já que não há freqüências desagradavelmente altas a serem notadas
Barulho
| Ocioso |
| 24.6 / 24.6 / 27.7 dB |
| Carga |
| 43.6 / 43.6 dB |
 | ||
30 dB silencioso 40 dB(A) audível 50 dB(A) ruidosamente alto |
||
min: | ||
| Schenker Work 17 Tiger Lake-H Iris Xe G7 96EUs, i7-11370H, Samsung SSD 980 Pro 1TB MZ-V8P1T0BW | LG Gram 17Z90P-G.AA56G Iris Xe G7 80EUs, i5-1135G7, Samsung SSD PM981a MZVLB512HBJQ | Acer Aspire 5 A517-52G-79Z5 GeForce MX350, i7-1165G7, WDC PC SN530 SDBPNPZ-1T00 | Acer Aspire 3 A317-51G-72MD GeForce MX250, i7-10510U, Intel SSD 660p 1TB SSDPEKNW010T8 | Dell Inspiron 15 3505-PXHPW Vega 8, R5 3450U, KDI OM3PDP3-AD NVMe KDI 256GB | Schenker Work 15 Tiger Lake-H Iris Xe G7 96EUs, i7-11370H, Samsung SSD 980 Pro 1TB MZ-V8P1T0BW | |
|---|---|---|---|---|---|---|
| Noise | 11% | -1% | -1% | 8% | 1% | |
| desligado / ambiente * (dB) | 24.6 | 25 -2% | 24.9 -1% | 26.7 -9% | 25 -2% | 24.4 1% |
| Idle Minimum * (dB) | 24.6 | 25 -2% | 24.9 -1% | 26.9 -9% | 25 -2% | 24.4 1% |
| Idle Average * (dB) | 24.6 | 25 -2% | 24.9 -1% | 26.9 -9% | 25 -2% | 24.4 1% |
| Idle Maximum * (dB) | 27.7 | 26 6% | 27 3% | 26.9 3% | 25 10% | 26.7 4% |
| Load Average * (dB) | 43.6 | 27.7 36% | 44.1 -1% | 40.9 6% | 33.6 23% | 43.8 -0% |
| Witcher 3 ultra * (dB) | 43.6 | 40.1 8% | 43.8 -0% | |||
| Load Maximum * (dB) | 43.6 | 30.5 30% | 44.8 -3% | 43.7 -0% | 34.5 21% | 44.8 -3% |
* ... menor é melhor
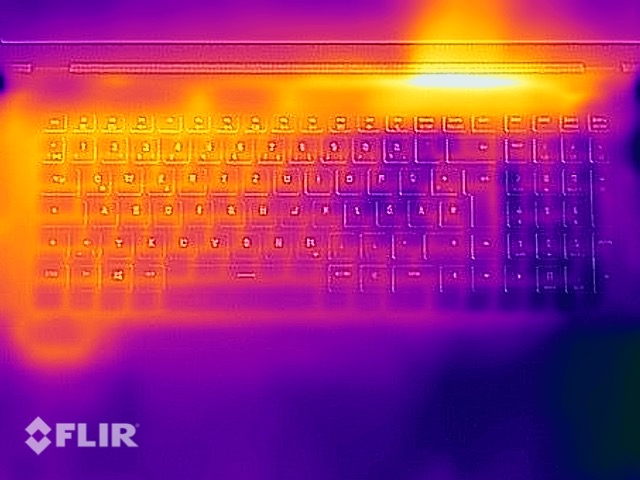
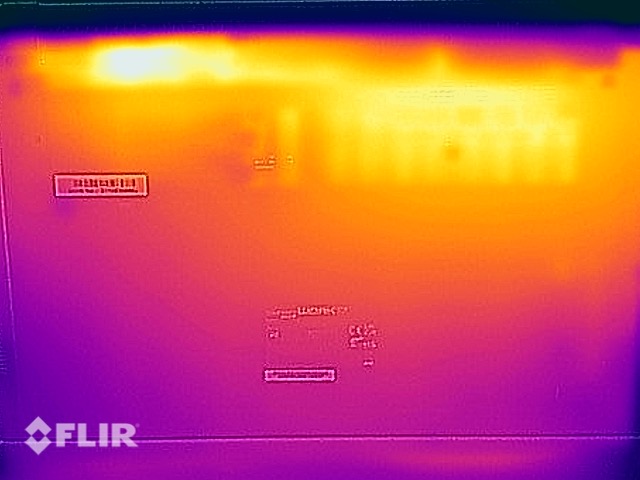
Temperatura
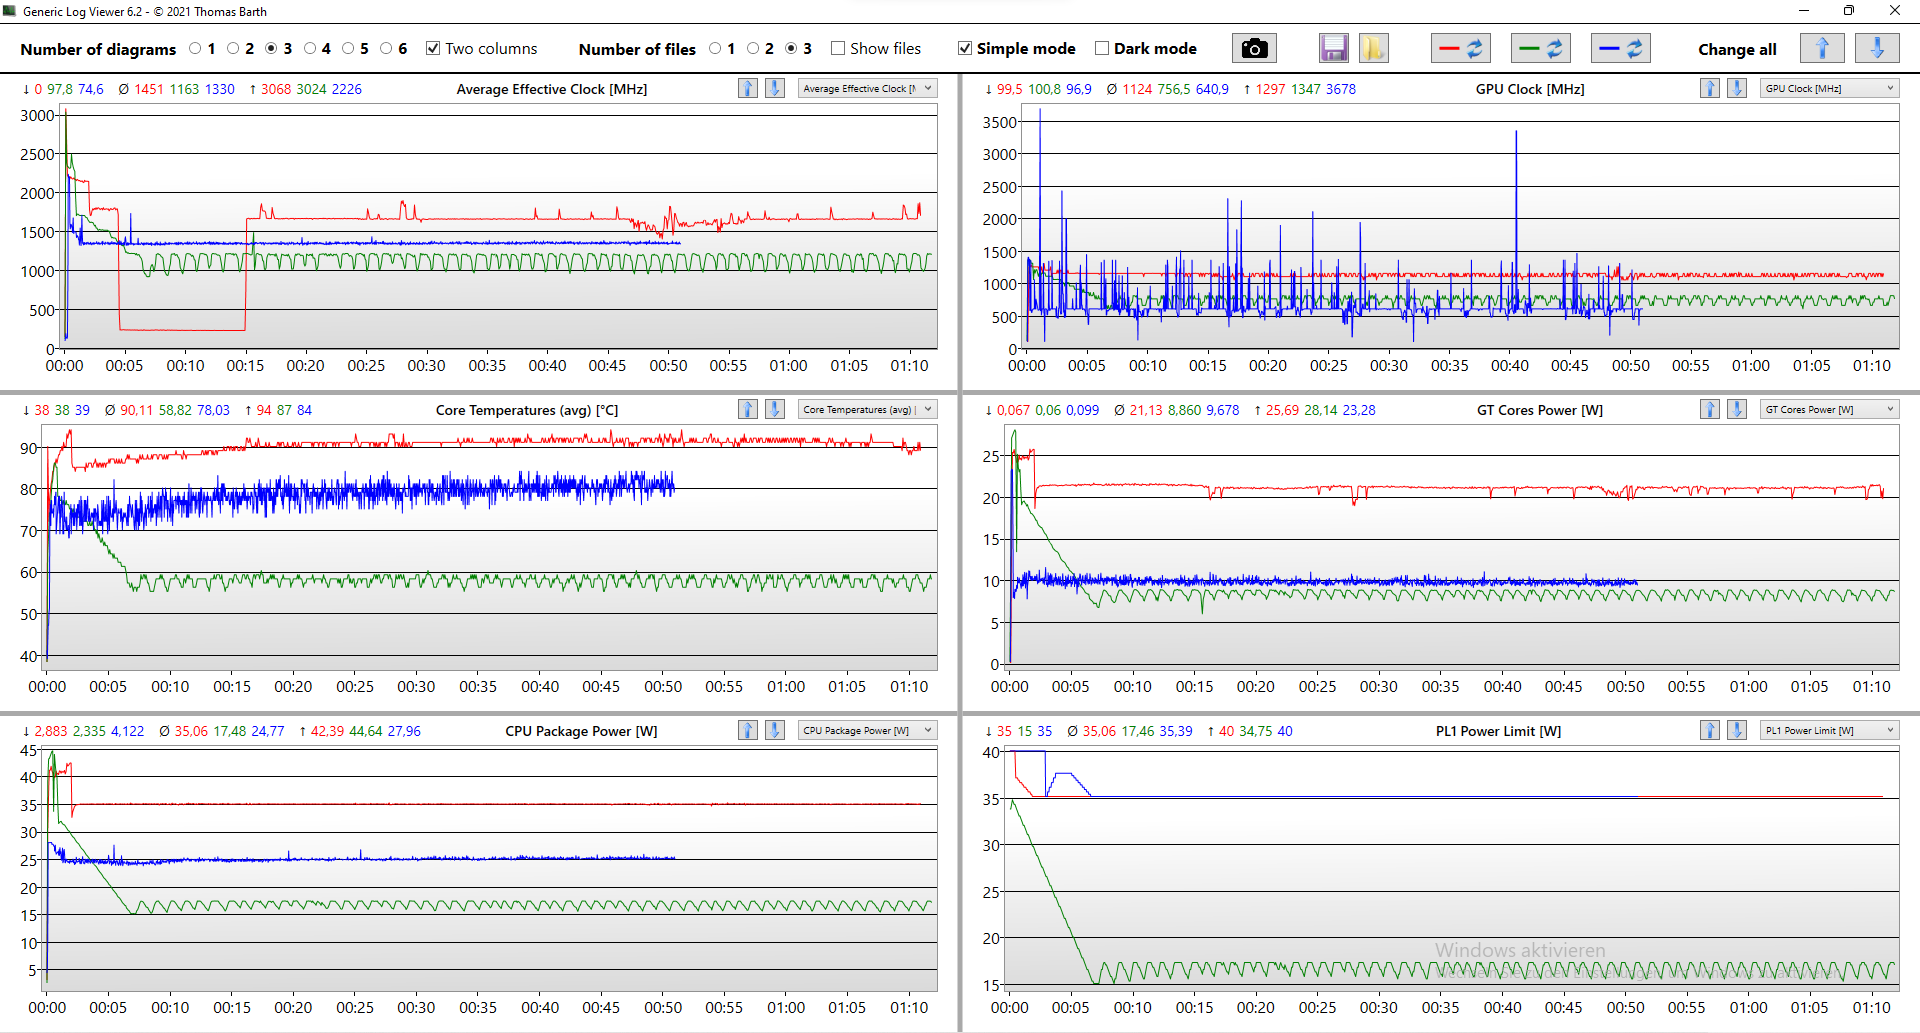
O Schenker Work 17 não fica particularmente quente na parte superior, incluindo as áreas de teclado e ClickPad. O calor residual do hardware de computação é mais perceptível nas aberturas de ventilação na parte inferior e ao redor do processador. Entretanto, o laptop de escritório é capaz de gerenciar facilmente o teste de estresse, sem grandes quedas de desempenho a relatar
(+) A temperatura máxima no lado superior é 36.5 °C / 98 F, em comparação com a média de 34.3 °C / 94 F , variando de 21.2 a 62.5 °C para a classe Office.
(±) A parte inferior aquece até um máximo de 43.1 °C / 110 F, em comparação com a média de 36.8 °C / 98 F
(+) Em uso inativo, a temperatura média para o lado superior é 23.6 °C / 74 F, em comparação com a média do dispositivo de 29.5 °C / ### class_avg_f### F.
(+) Jogando The Witcher 3, a temperatura média para o lado superior é 31.2 °C / 88 F, em comparação com a média do dispositivo de 29.5 °C / ## #class_avg_f### F.
(+) Os apoios para as mãos e o touchpad são mais frios que a temperatura da pele, com um máximo de 27.4 °C / 81.3 F e, portanto, são frios ao toque.
(±) A temperatura média da área do apoio para as mãos de dispositivos semelhantes foi 27.6 °C / 81.7 F (+0.2 °C / 0.4 F).
| Schenker Work 17 Tiger Lake-H Intel Core i7-11370H, Intel Iris Xe Graphics G7 96EUs | LG Gram 17Z90P-G.AA56G Intel Core i5-1135G7, Intel Iris Xe Graphics G7 80EUs | Acer Aspire 5 A517-52G-79Z5 Intel Core i7-1165G7, NVIDIA GeForce MX350 | Acer Aspire 3 A317-51G-72MD Intel Core i7-10510U, NVIDIA GeForce MX250 | Dell Inspiron 15 3505-PXHPW AMD Ryzen 5 3450U, AMD Radeon RX Vega 8 (Ryzen 2000/3000) | Schenker Work 15 Tiger Lake-H Intel Core i7-11370H, Intel Iris Xe Graphics G7 96EUs | |
|---|---|---|---|---|---|---|
| Heat | -7% | 2% | -14% | -26% | -2% | |
| Maximum Upper Side * (°C) | 36.5 | 43.6 -19% | 35 4% | 44.2 -21% | 40.4 -11% | 39.1 -7% |
| Maximum Bottom * (°C) | 43.1 | 41.4 4% | 40 7% | 53 -23% | 41.1 5% | 43.4 -1% |
| Idle Upper Side * (°C) | 24.4 | 26.4 -8% | 25.6 -5% | 26.4 -8% | 34.6 -42% | 24.3 -0% |
| Idle Bottom * (°C) | 25.6 | 27 -5% | 25.3 1% | 26.9 -5% | 40 -56% | 25.1 2% |
* ... menor é melhor
Oradores
Os alto-falantes da Schenker Work 17 são adequados para uso em escritório, mas não para muito mais. Eles oferecem qualidade sonora suficiente para videochamadas, enquanto claramente carecem de faixa dinâmica para música e filmes. A reprodução é fraca tanto para os tons altos como para os baixos
Schenker Work 17 Tiger Lake-H análise de áudio
(±) | o volume do alto-falante é médio, mas bom (###valor### dB)
Graves 100 - 315Hz
(-) | quase nenhum baixo - em média 26.6% menor que a mediana
(±) | a linearidade dos graves é média (7% delta para a frequência anterior)
Médios 400 - 2.000 Hz
(±) | médios mais altos - em média 8.2% maior que a mediana
(±) | a linearidade dos médios é média (14.3% delta para frequência anterior)
Altos 2 - 16 kHz
(+) | agudos equilibrados - apenas 4% longe da mediana
(+) | os máximos são lineares (5.6% delta da frequência anterior)
Geral 100 - 16.000 Hz
(±) | a linearidade do som geral é média (27.6% diferença em relação à mediana)
Comparado com a mesma classe
» 86% de todos os dispositivos testados nesta classe foram melhores, 4% semelhantes, 10% piores
» O melhor teve um delta de 7%, a média foi 21%, o pior foi 53%
Comparado com todos os dispositivos testados
» 84% de todos os dispositivos testados foram melhores, 3% semelhantes, 13% piores
» O melhor teve um delta de 4%, a média foi 23%, o pior foi 134%
LG Gram 17Z90P-G.AA56G análise de áudio
(±) | o volume do alto-falante é médio, mas bom (###valor### dB)
Graves 100 - 315Hz
(-) | quase nenhum baixo - em média 18.7% menor que a mediana
(±) | a linearidade dos graves é média (13.1% delta para a frequência anterior)
Médios 400 - 2.000 Hz
(+) | médios equilibrados - apenas 2.3% longe da mediana
(+) | médios são lineares (4.6% delta para frequência anterior)
Altos 2 - 16 kHz
(+) | agudos equilibrados - apenas 2.8% longe da mediana
(+) | os máximos são lineares (4.5% delta da frequência anterior)
Geral 100 - 16.000 Hz
(+) | o som geral é linear (13.5% diferença em relação à mediana)
Comparado com a mesma classe
» 8% de todos os dispositivos testados nesta classe foram melhores, 4% semelhantes, 88% piores
» O melhor teve um delta de 7%, a média foi 21%, o pior foi 53%
Comparado com todos os dispositivos testados
» 14% de todos os dispositivos testados foram melhores, 4% semelhantes, 82% piores
» O melhor teve um delta de 4%, a média foi 23%, o pior foi 134%
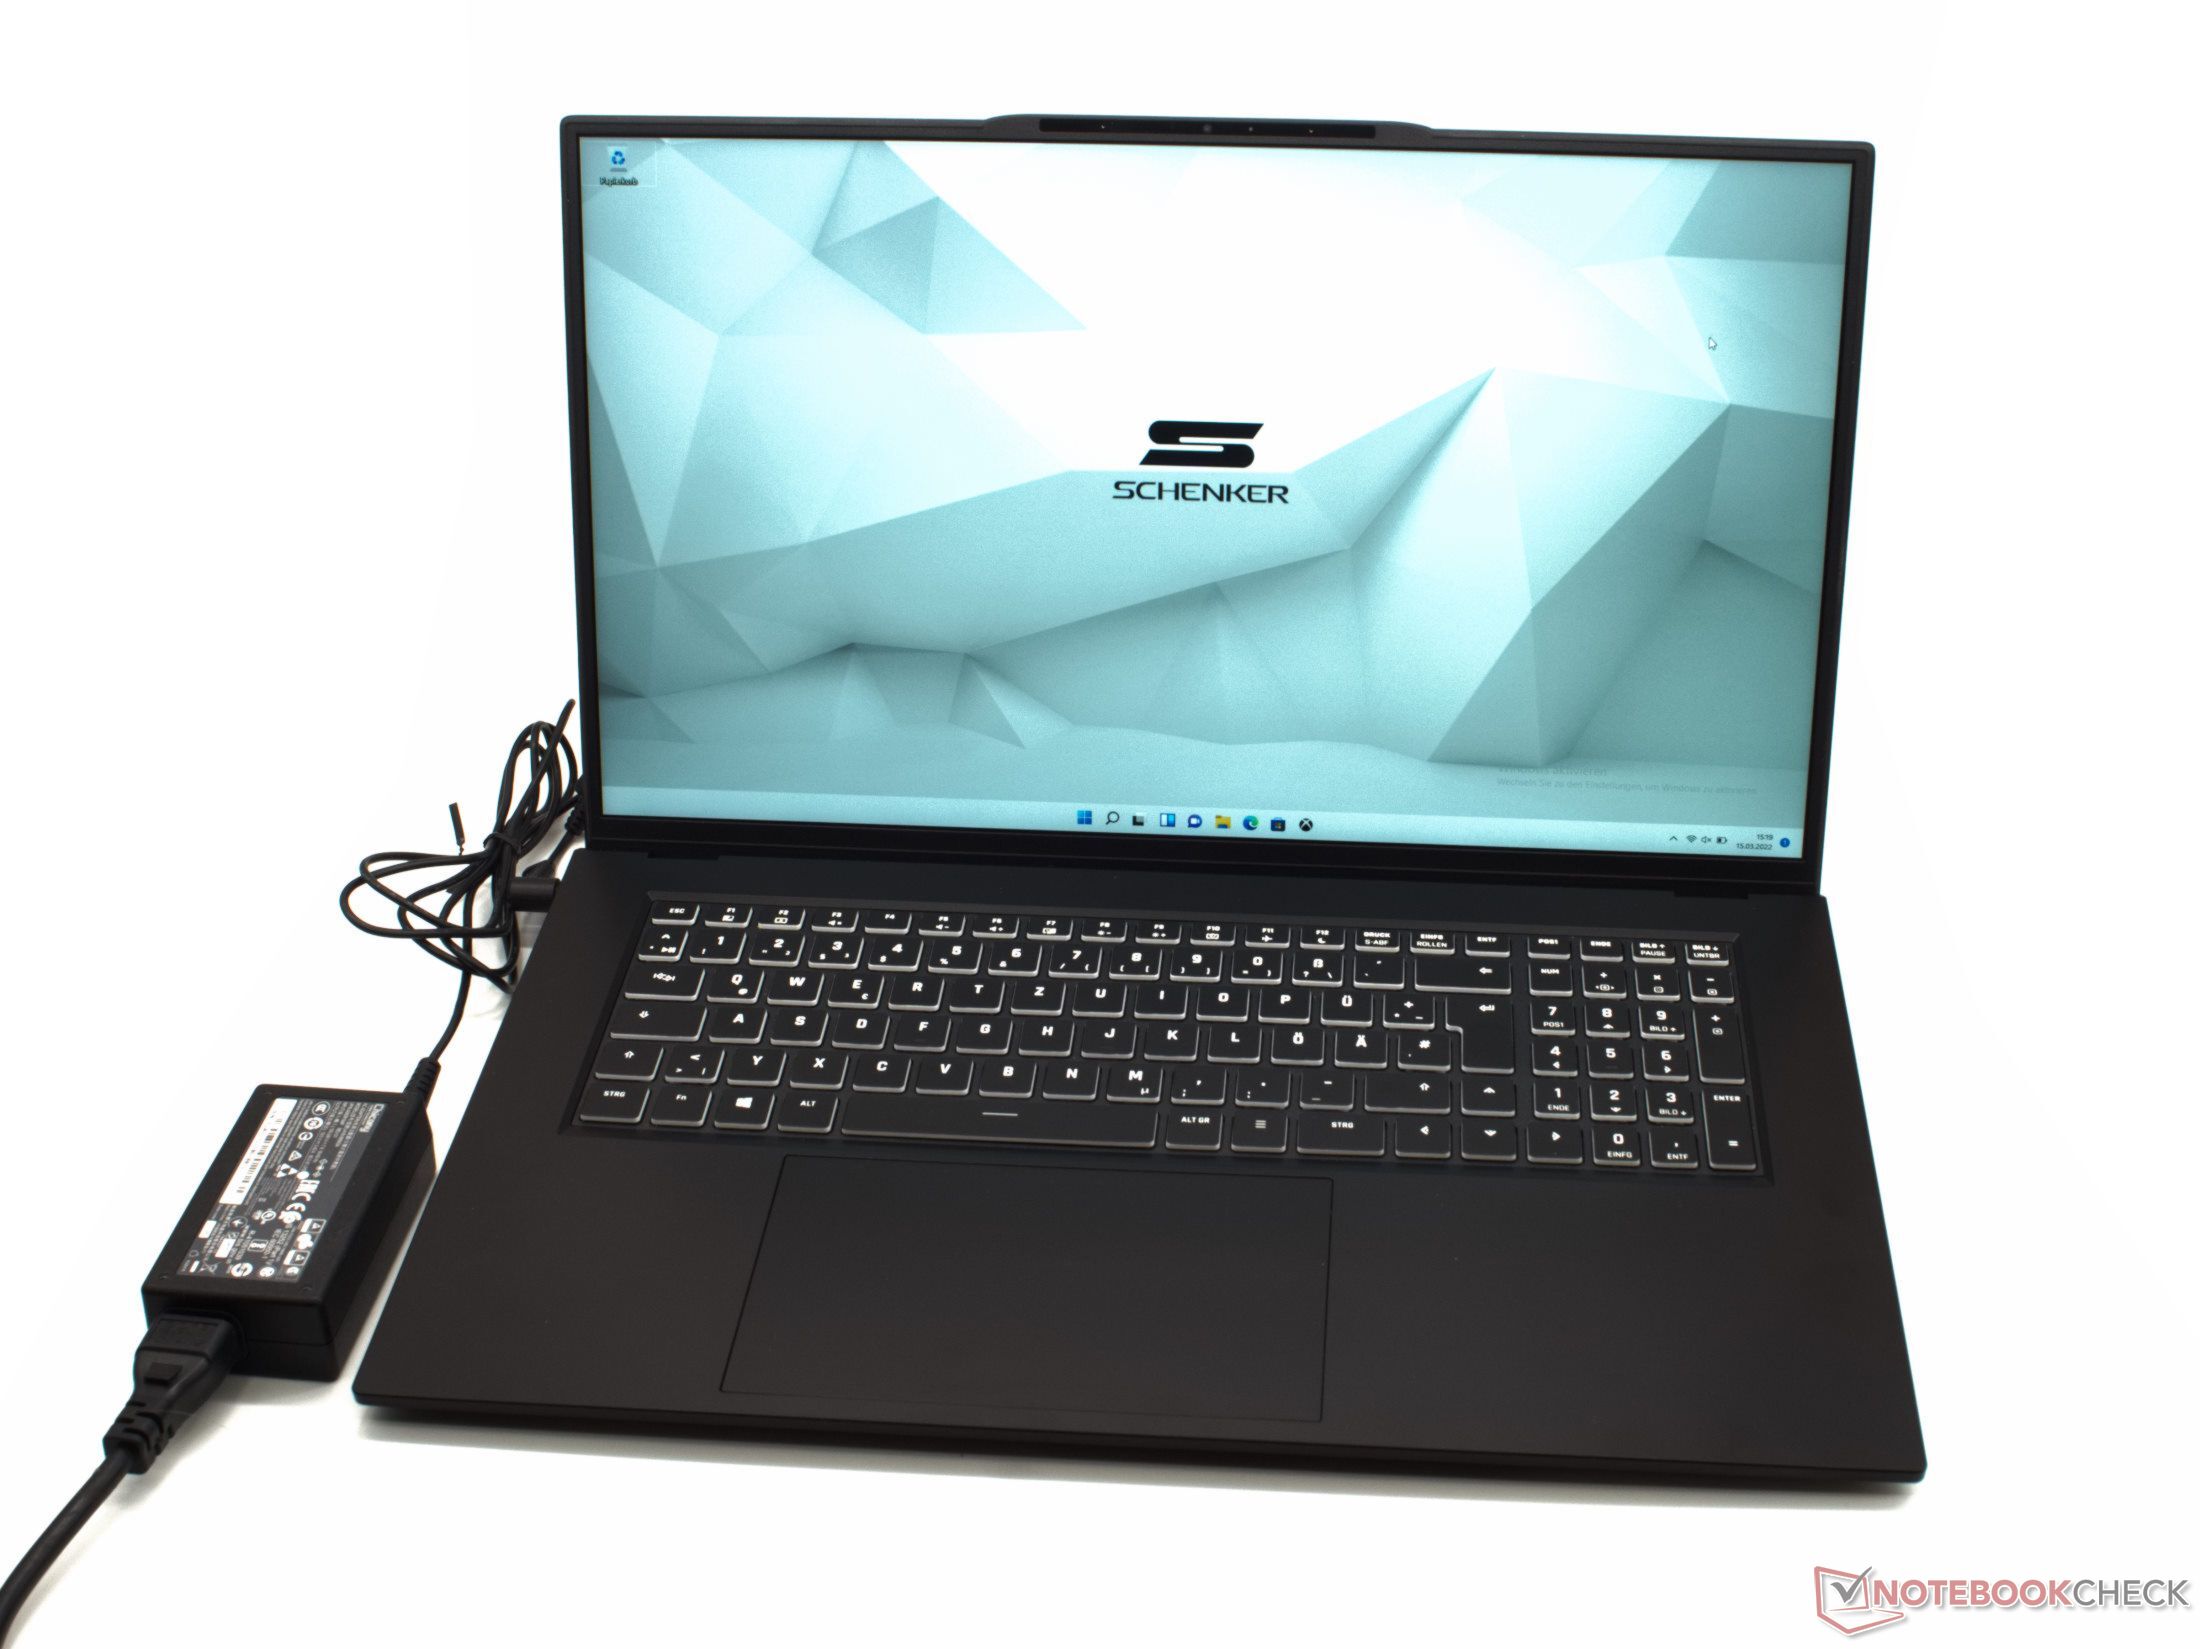
Consumo de energia
No uso ocioso, a Schenker Work 17 requer apenas uma pequena quantidade de energia de apenas 9 watts, apesar da grande tela. Uma necessidade de energia de 71,5 watts pode ser medida por um curto período. Se você ignorar a eficiência da fonte de alimentação, o consumo de energia do laptop está brevemente acima das especificações do adaptador incluído. Entretanto, como o consumo cai rapidamente no decorrer do teste de estresse, o adaptador de energia ainda é considerado como tendo capacidade suficiente
| desligado | |
| Ocioso | |
| Carga |
|
Key:
min: | |
Energy consumption during The Witcher 3 / stress test
Energy consumption with an external monitor
Duração da bateria
A duração da bateria do laptop de escritório é geralmente boa, com pouco menos de 10 horas em nosso teste Wi-Fi a 150 cd/m². A bateria de 73 Wh ainda dura cerca de 7 horas em pleno brilho no teste Wi-Fi.
Na bateria, notamos que o laptop se desliga após cerca de uma hora no modo Performance sob carga máxima. Uma análise dos arquivos de registro revelou que isto se deve a um desligamento de proteção causado por temperaturas excessivas. Após o contato com Schenker, uma nova versão da BIOS está sendo criada atualmente, o que reduzirá a temperatura alvo no Modo de Desempenho dos atuais 98 °C (~208 °F) para 95 °C (~203 °F). Isto deve colocar o problema no passado. O problema não existe no Modo de Entretenimento, e o tempo de execução no teste de estresse é um pouco mais de 2 horas.
Atualização 17.04..: Schenker nos forneceu a nova versão da BIOS 1.07.15 RTR2, e repetimos o teste. Como foi dito anteriormente, a temperatura máxima da CPU no modo Performance é agora mais baixa, e o teste corre sem problemas durante todo o tempo de execução. Neste caso, o tempo de execução registrado é de cerca de 1:30 horas. Portanto, recomendamos a todos os usuários que atualizem de acordo.
| Schenker Work 17 Tiger Lake-H i7-11370H, Iris Xe G7 96EUs, 73 Wh | LG Gram 17Z90P-G.AA56G i5-1135G7, Iris Xe G7 80EUs, 80 Wh | Acer Aspire 5 A517-52G-79Z5 i7-1165G7, GeForce MX350, 50.2 Wh | Acer Aspire 3 A317-51G-72MD i7-10510U, GeForce MX250, 36.7 Wh | Dell Inspiron 15 3505-PXHPW R5 3450U, Vega 8, 42 Wh | Schenker Work 15 Tiger Lake-H i7-11370H, Iris Xe G7 96EUs, 73 Wh | Média da turma Office | |
|---|---|---|---|---|---|---|---|
| Duração da bateria | 31% | -22% | -47% | -55% | 3% | 4% | |
| Reader / Idle (h) | 22.3 | 33.6 51% | 13.8 -38% | 24.5 10% | 22.2 ? 0% | ||
| WiFi v1.3 (h) | 9.9 | 12.7 28% | 7.4 -25% | 5.2 -47% | 4.5 -55% | 10.2 3% | 13.2 ? 33% |
| Load (h) | 2.3 | 2.6 13% | 2.2 -4% | 2.2 -4% | 1.808 ? -21% | ||
| H.264 (h) | 4.9 | 9.6 | 15.4 ? | ||||
| Witcher 3 ultra (h) | 1.3 |
Pro
Contra
Veredicto - Ampla escolha para desempenho personalizado
O Schenker Work 17 é principalmente um dispositivo robusto, e sua fabricação é de alta qualidade. Ele pode geralmente proporcionar um desempenho computacional atraente, mesmo que fique atrás do Schenker Work 15's taxas às vezes. Este fato não pode ser explicado, no entanto, já que o hardware de ambas as unidades de revisão deve ser quase idêntico. Isto é provavelmente o resultado de fatores que estão dentro das tolerâncias de fabricação da eletrônica moderna
No entanto, a maioria das aplicações não representam um grande desafio para a APU Intel. Escritório, programas de edição de imagem, simulações MATLAB e aplicações de Internet são facilmente manipulados pelo laptop. Mesmo aplicações e jogos em 3D funcionam sem problemas se você fizer algumas restrições em termos de configurações de qualidade
As muitas opções de configuração, um teclado RGB, e por último, mas não menos importante, o formato de 17 polegadas fazem do Schenker Work 17 um exemplo exótico entre os laptops de escritório. O laptop consegue impressionar com seu acabamento e desempenho.
Embora o alto preço de compra não pareça uma barganha, justifica-se porque a mão-de-obra, bem como o poder de processamento, são muito bons. Além disso, as opções de configuração que a Schenker oferece ainda permitem economizar algum dinheiro.
Preço e disponibilidade
A Schenker Work 17 está disponível em várias configurações a partir de 1.179 Euros (~$1.272) na loja online do fabricante
Schenker Work 17 Tiger Lake-H
- 04/02/2022 v7 (old)
Marc Herter
Price comparison

