 Deutsch
 English
 Español
 Français
 Italiano
 Nederlands
 Polski
 Português
 Русский
 Türkçe
 Svenska
 Chinese
 Magyar
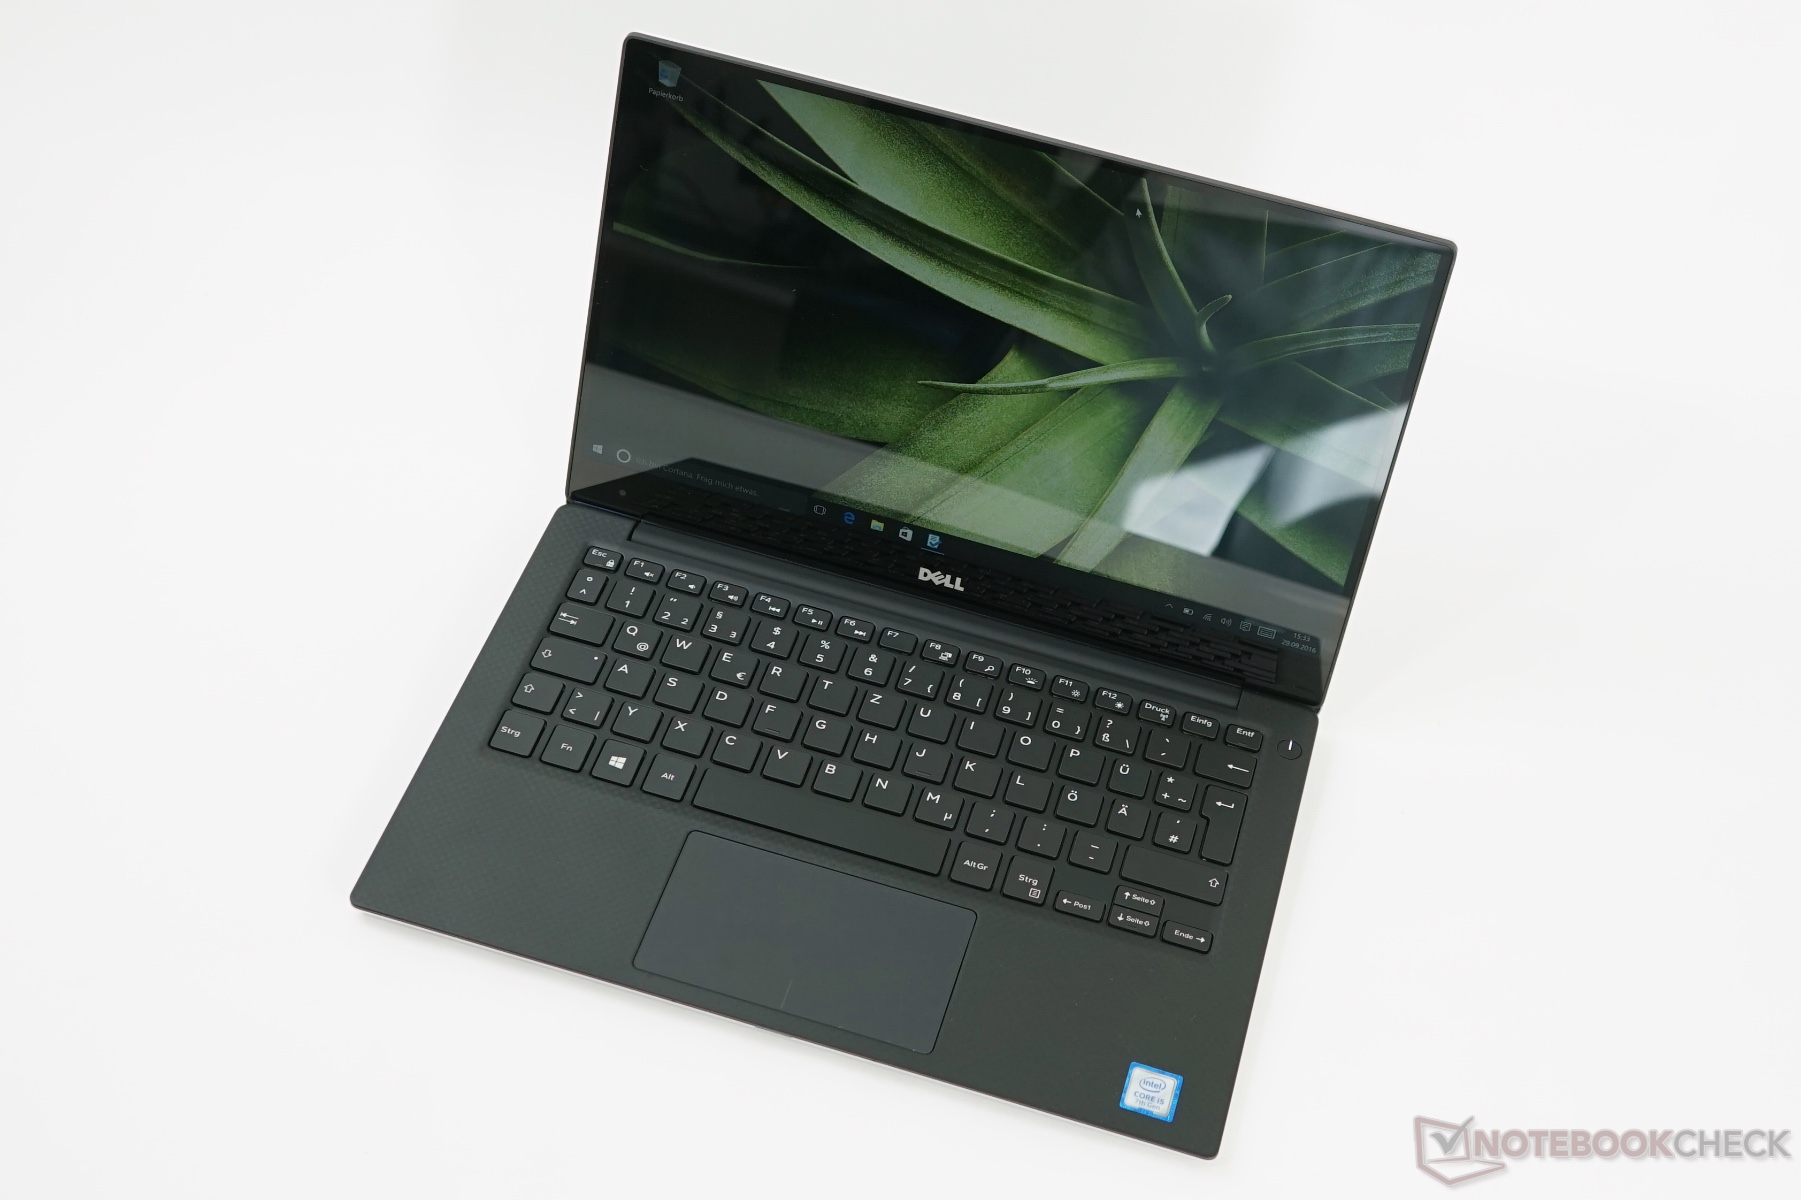
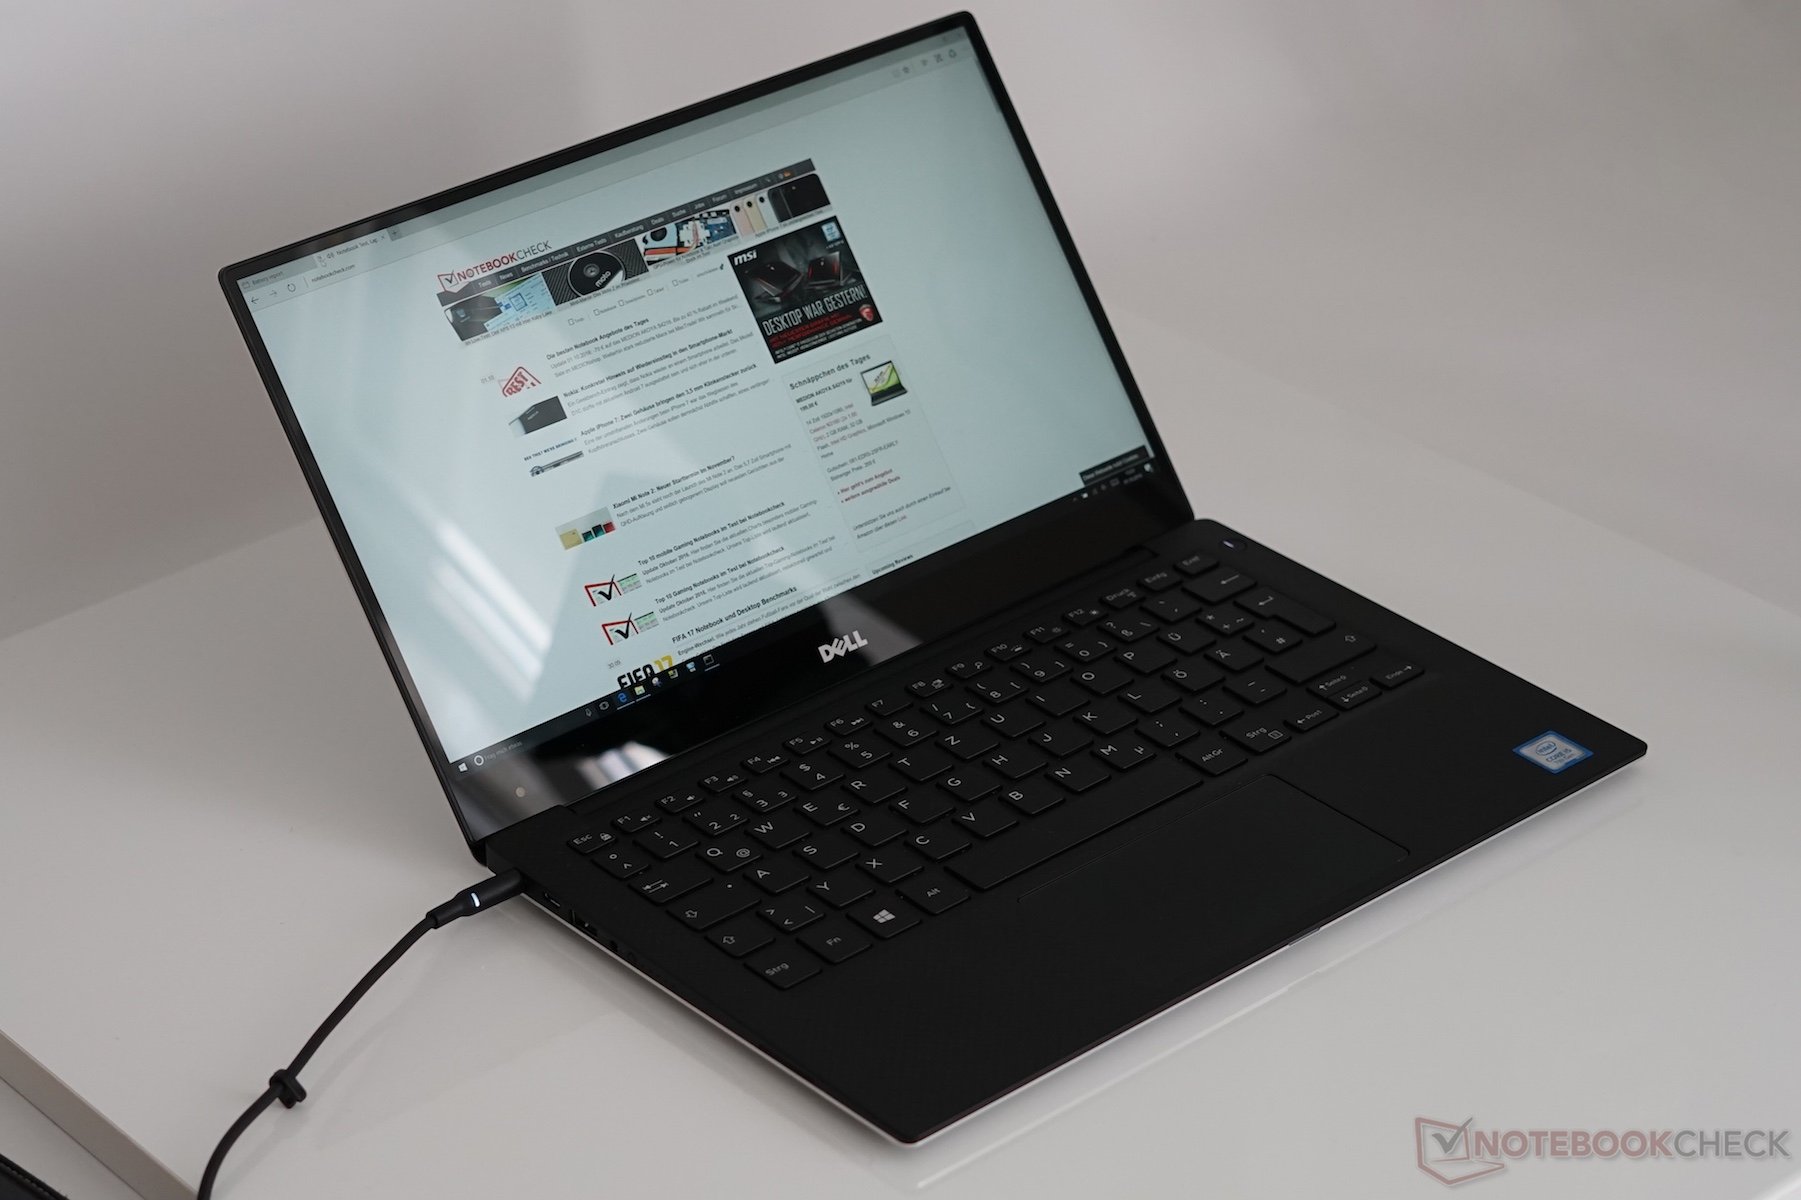
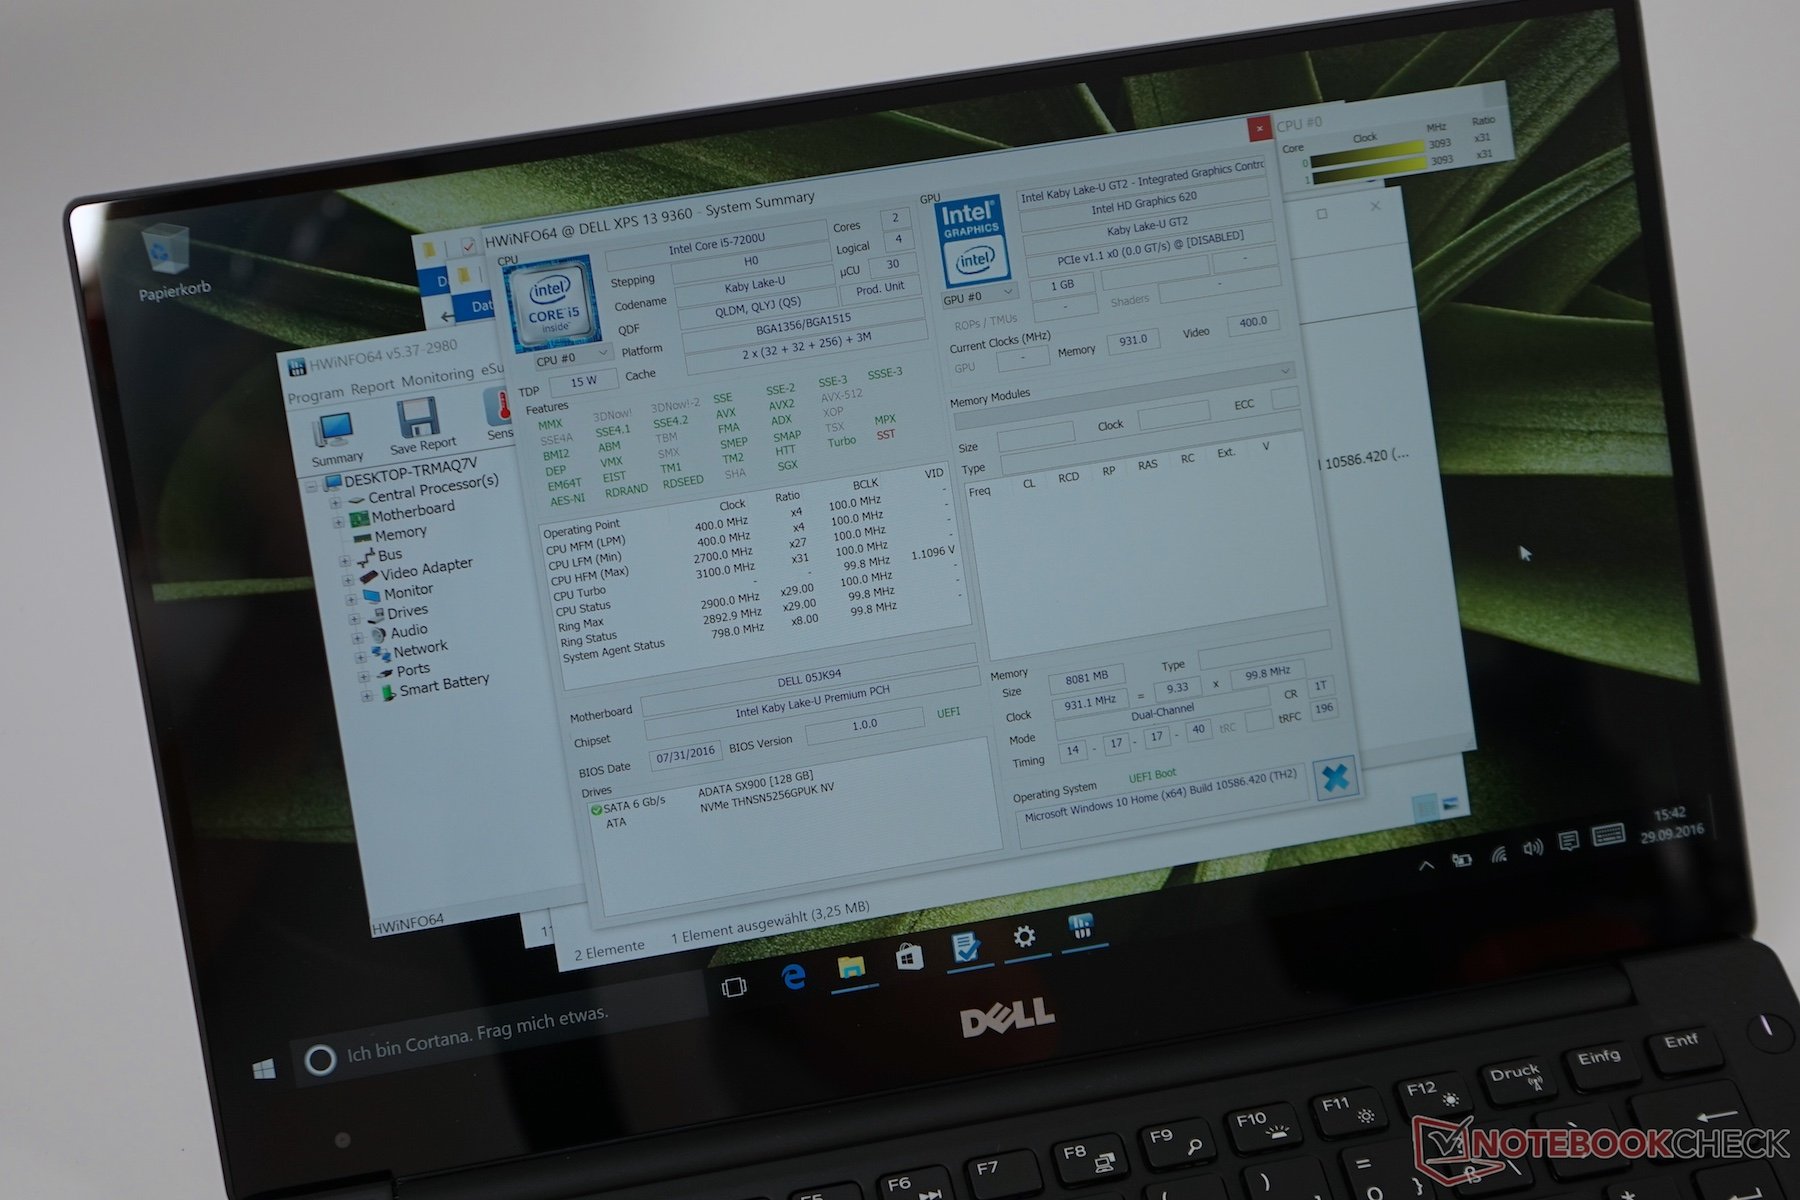
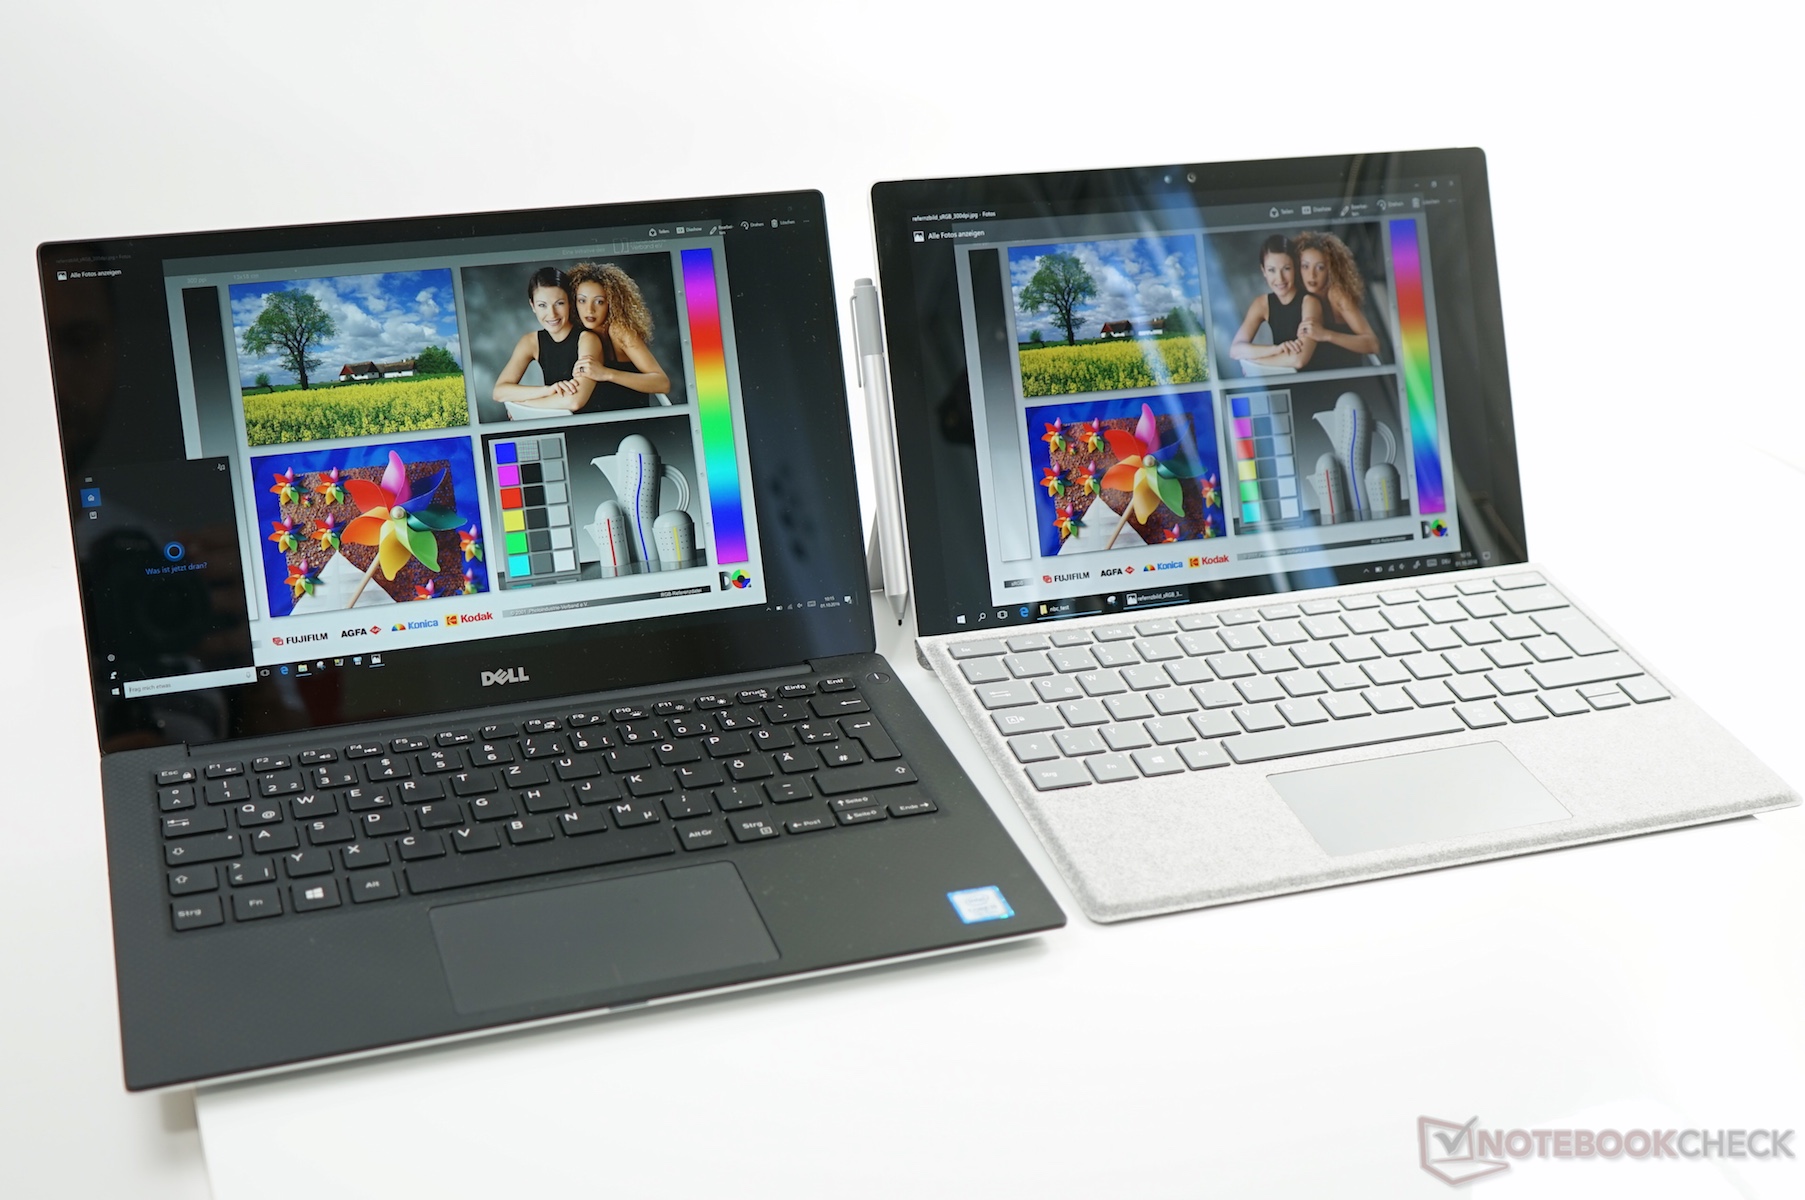
Breve Análise do Portátil Dell XPS 13 9360 QHD+ i5-7200U


| Networking | |
| iperf3 receive AX12 | |
| Apple MacBook Pro Retina 13 inch 2013-10 (Klaus I211) | |
| Dell XPS 13 9360 QHD+ i5 | |
| MSI GT72S-6QEG16SR421BW (Klaus I211) | |
| Lenovo ThinkPad T460s-20FA003GGE | |
| Microsoft Surface Pro 4, Core i5, 128GB (Klaus I211) | |
| Intel NUC5i5RYH (Klaus I211) | |
| MSI PE60 2QD | |
| iperf3 transmit AX12 | |
| Apple MacBook Pro Retina 13 inch 2013-10 (Klaus I211) | |
| Dell XPS 13 9360 QHD+ i5 | |
| MSI GT72S-6QEG16SR421BW (Klaus I211) | |
| Microsoft Surface Pro 4, Core i5, 128GB (Klaus I211) | |
| Intel NUC5i5RYH (Klaus I211) | |
| Lenovo ThinkPad T460s-20FA003GGE | |
| MSI PE60 2QD | |


| |||||||||||||||||||||||||
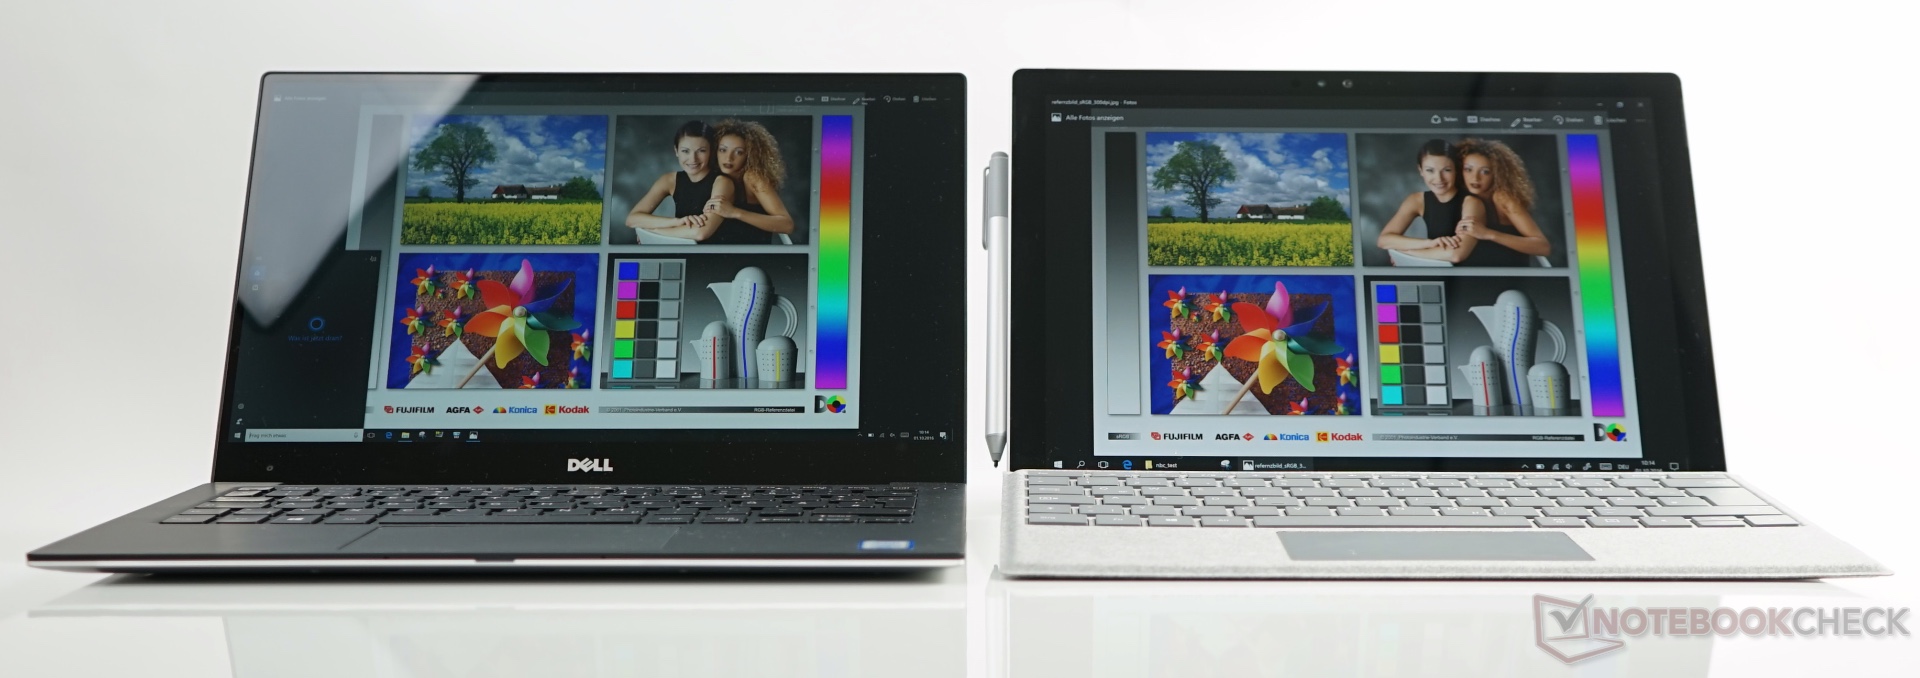
iluminação: 82 %
iluminação com acumulador: 444 cd/m²
Contraste: 1345:1 (Preto: 0.33 cd/m²)
ΔE Color 4 | 0.5-29.43 Ø5
ΔE Greyscale 2.83 | 0.57-98 Ø5.3
91.4% sRGB (Argyll 1.6.3 3D)
59.3% AdobeRGB 1998 (Argyll 1.6.3 3D)
66.5% AdobeRGB 1998 (Argyll 2.2.0 3D)
91.6% sRGB (Argyll 2.2.0 3D)
64.6% Display P3 (Argyll 2.2.0 3D)
Gamma: 2.05
Display Response Times
| ↔ Response Time Black to White | ||
|---|---|---|
| 31.2 ms ... rise ↗ and fall ↘ combined | ↗ 10.8 ms rise | 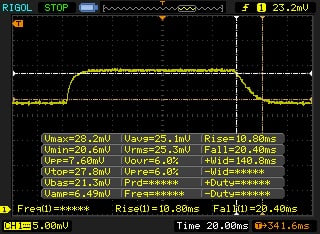 |
| ↘ 20.4 ms fall | ||
| The screen shows slow response rates in our tests and will be unsatisfactory for gamers. In comparison, all tested devices range from 0.1 (minimum) to 240 (maximum) ms. » 82 % of all devices are better. This means that the measured response time is worse than the average of all tested devices (21.5 ms). | ||
| ↔ Response Time 50% Grey to 80% Grey | ||
| 31 ms ... rise ↗ and fall ↘ combined | ↗ 13 ms rise |  |
| ↘ 18 ms fall | ||
| The screen shows slow response rates in our tests and will be unsatisfactory for gamers. In comparison, all tested devices range from 0.2 (minimum) to 636 (maximum) ms. » 35 % of all devices are better. This means that the measured response time is similar to the average of all tested devices (33.7 ms). | ||
Screen Flickering / PWM (Pulse-Width Modulation)
| Screen flickering / PWM not detected | 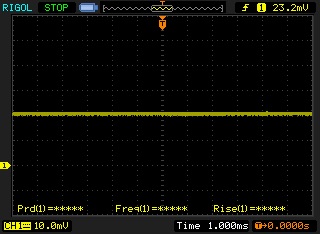 | ||
In comparison: 53 % of all tested devices do not use PWM to dim the display. If PWM was detected, an average of 17900 (minimum: 5 - maximum: 3846000) Hz was measured. | |||
| Cinebench R15 | |
| CPU Single 64Bit | |
| MSI CX72-7QL | |
| Dell XPS 13 2016 9350 (FHD, i7-6560U) | |
| Acer Aspire E5-575G-549D | |
| Dell XPS 13 9360 QHD+ i5 | |
| Dell XPS 13-9350 | |
| CPU Multi 64Bit | |
| MSI CX72-7QL | |
| Acer Aspire E5-575G-549D | |
| Dell XPS 13 2016 9350 (FHD, i7-6560U) | |
| Dell XPS 13 9360 QHD+ i5 | |
| Dell XPS 13-9350 | |
| PCMark 8 Home Score Accelerated v2 | 2761 pontos | |
Ajuda | ||

| 3DMark 11 - 1280x720 Performance GPU | |
| Dell XPS 13 2016 9350 (FHD, i7-6560U) | |
| MSI CX72-7QL | |
| Dell XPS 13 9360 QHD+ i5 | |
| HP Spectre 13 | |
| Acer Aspire S 13 S5-371-71QZ | |
| Dell XPS 13-9350 | |
| 3DMark 2001SE Standard | 67477 pontos | |
| 3DMark 11 Performance | 1683 pontos | |
| 3DMark Cloud Gate Standard Score | 5778 pontos | |
| 3DMark Fire Strike Score | 848 pontos | |
Ajuda | ||
| baixo | média | alto | ultra | |
| World of Warcraft (2005) | 48 | 10.1 | ||
| Diablo III (2012) | 30 | 28.6 | ||
| BioShock Infinite (2013) | 50.5 | 30.3 | 25.5 | 8.2 |
| The Witcher 3 (2015) | 12.7 | |||
| World of Warships (2015) | 58 | 39.7 | 20.5 | |
| Rainbow Six Siege (2015) | 35.6 | 22.4 | 12.1 | |
| Rise of the Tomb Raider (2016) | 17.4 | |||
| Far Cry Primal (2016) | 16 | 8 | ||
| Overwatch (2016) | 40.1 | 30 | 13.9 |
Barulho
| Ocioso |
| 30.6 / 30.6 / 32.2 dB |
| Carga |
| 32.2 / 38.5 dB |
 | ||
30 dB silencioso 40 dB(A) audível 50 dB(A) ruidosamente alto |
||
min: | ||
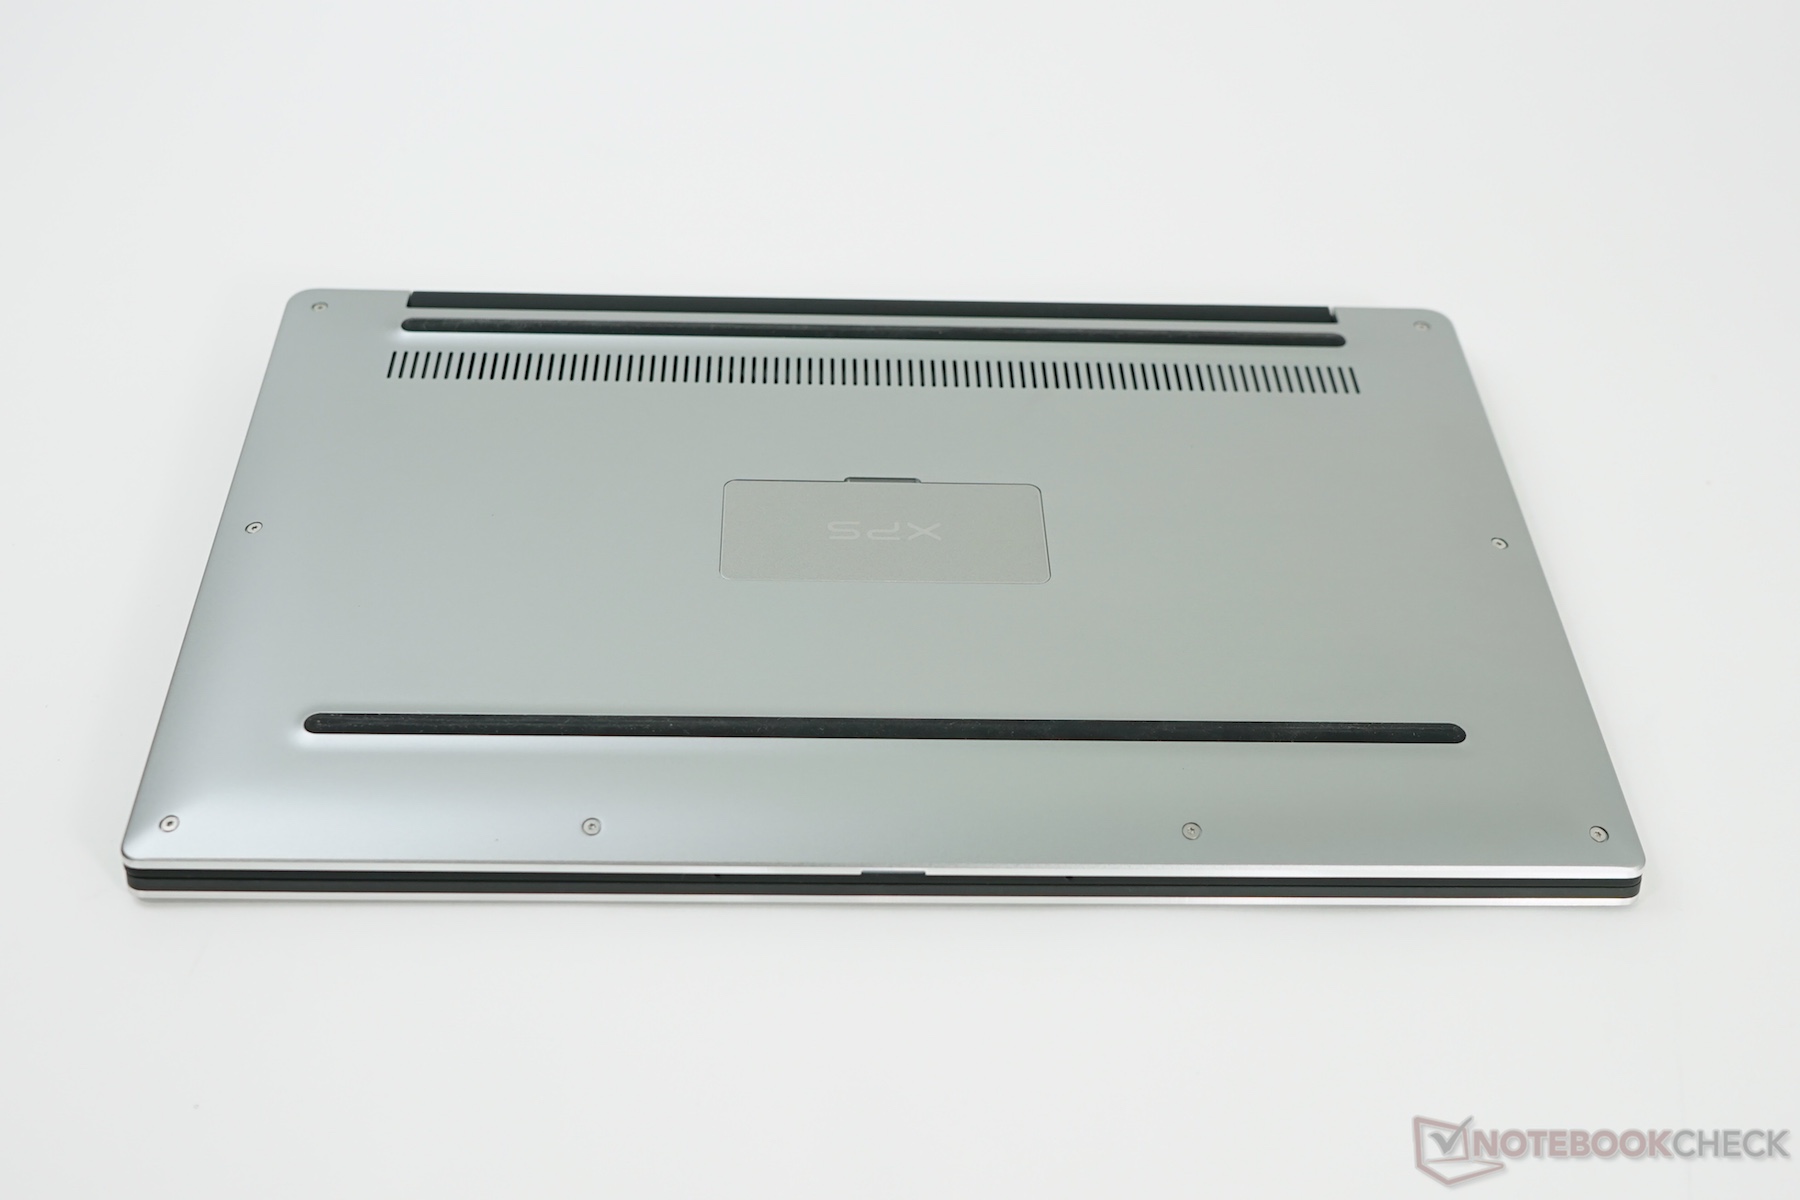
(±) The maximum temperature on the upper side is 40 °C / 104 F, compared to the average of 35.9 °C / 97 F, ranging from 21.4 to 59 °C for the class Subnotebook.
(±) The bottom heats up to a maximum of 42 °C / 108 F, compared to the average of 39.4 °C / 103 F
(+) In idle usage, the average temperature for the upper side is 26.2 °C / 79 F, compared to the device average of 30.7 °C / 87 F.
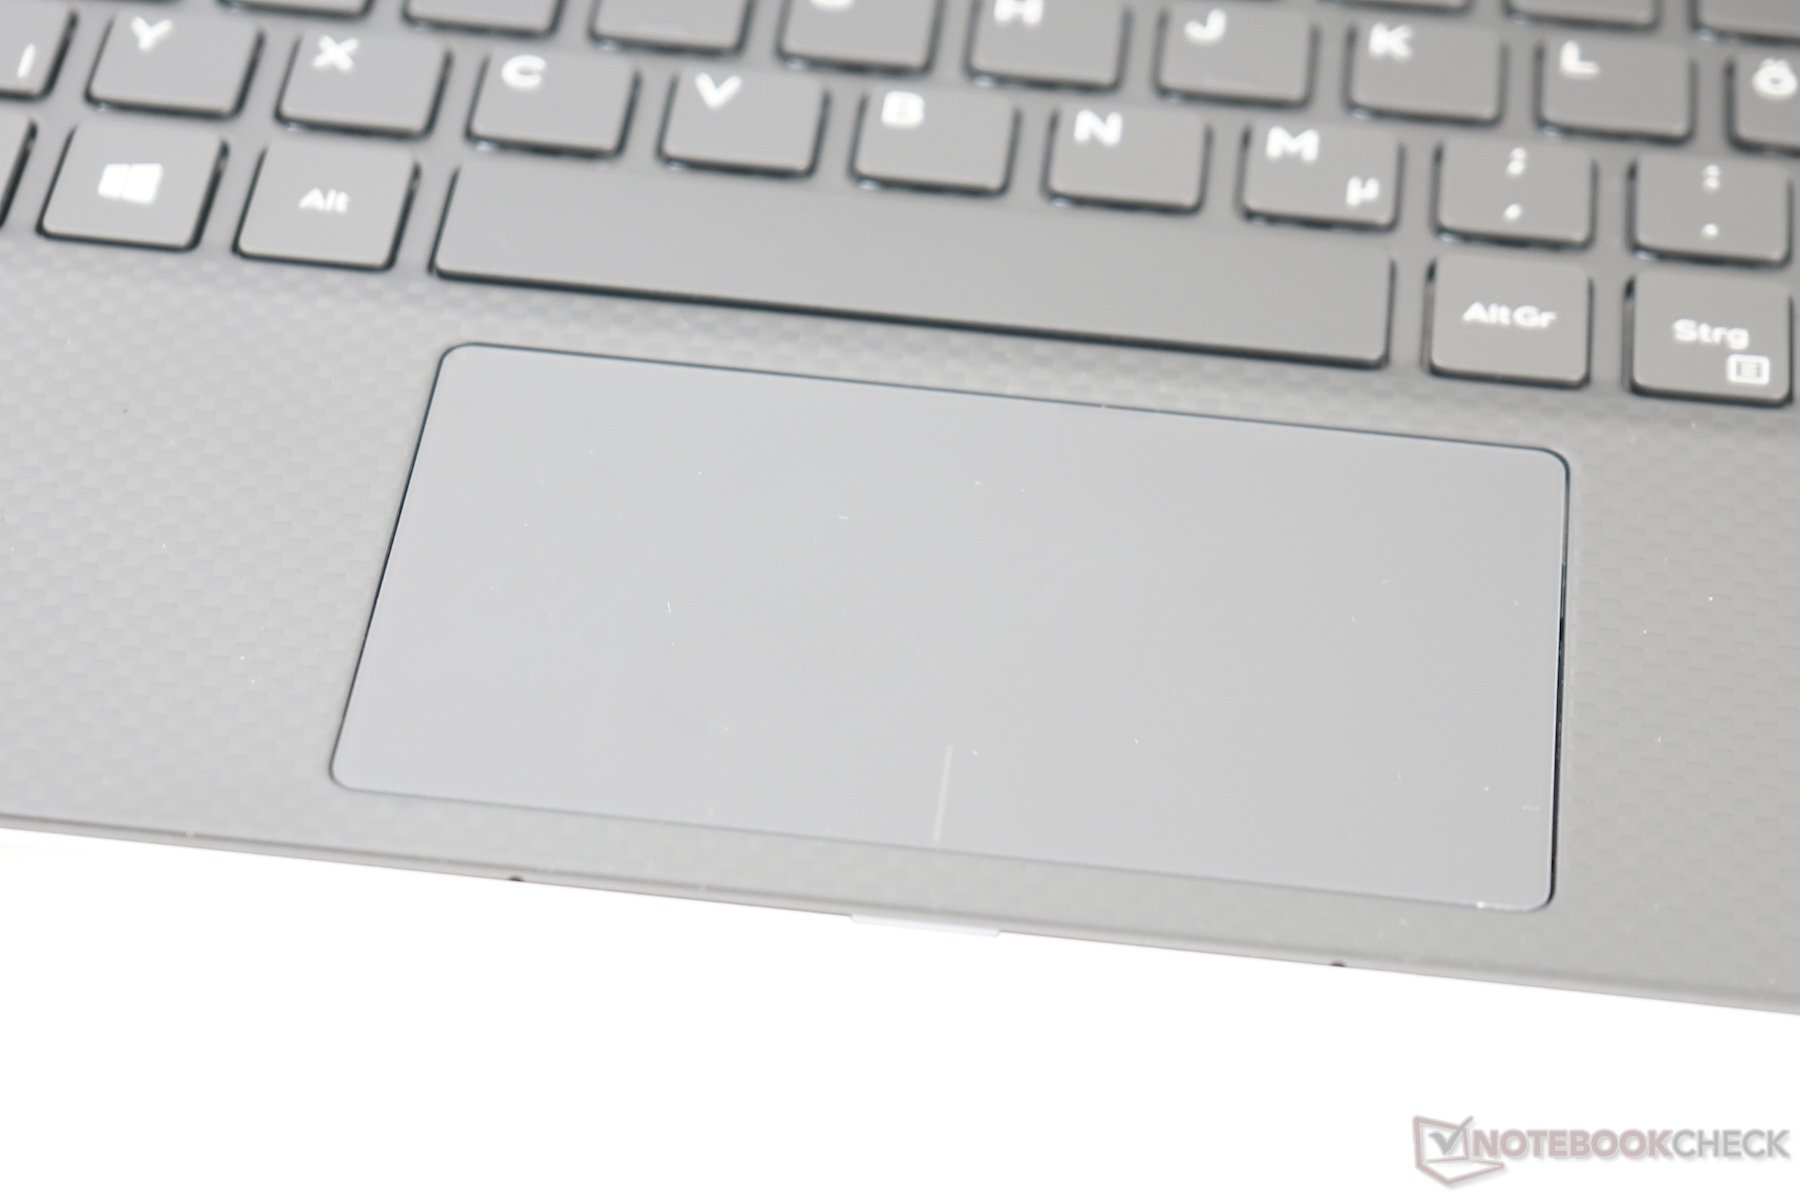
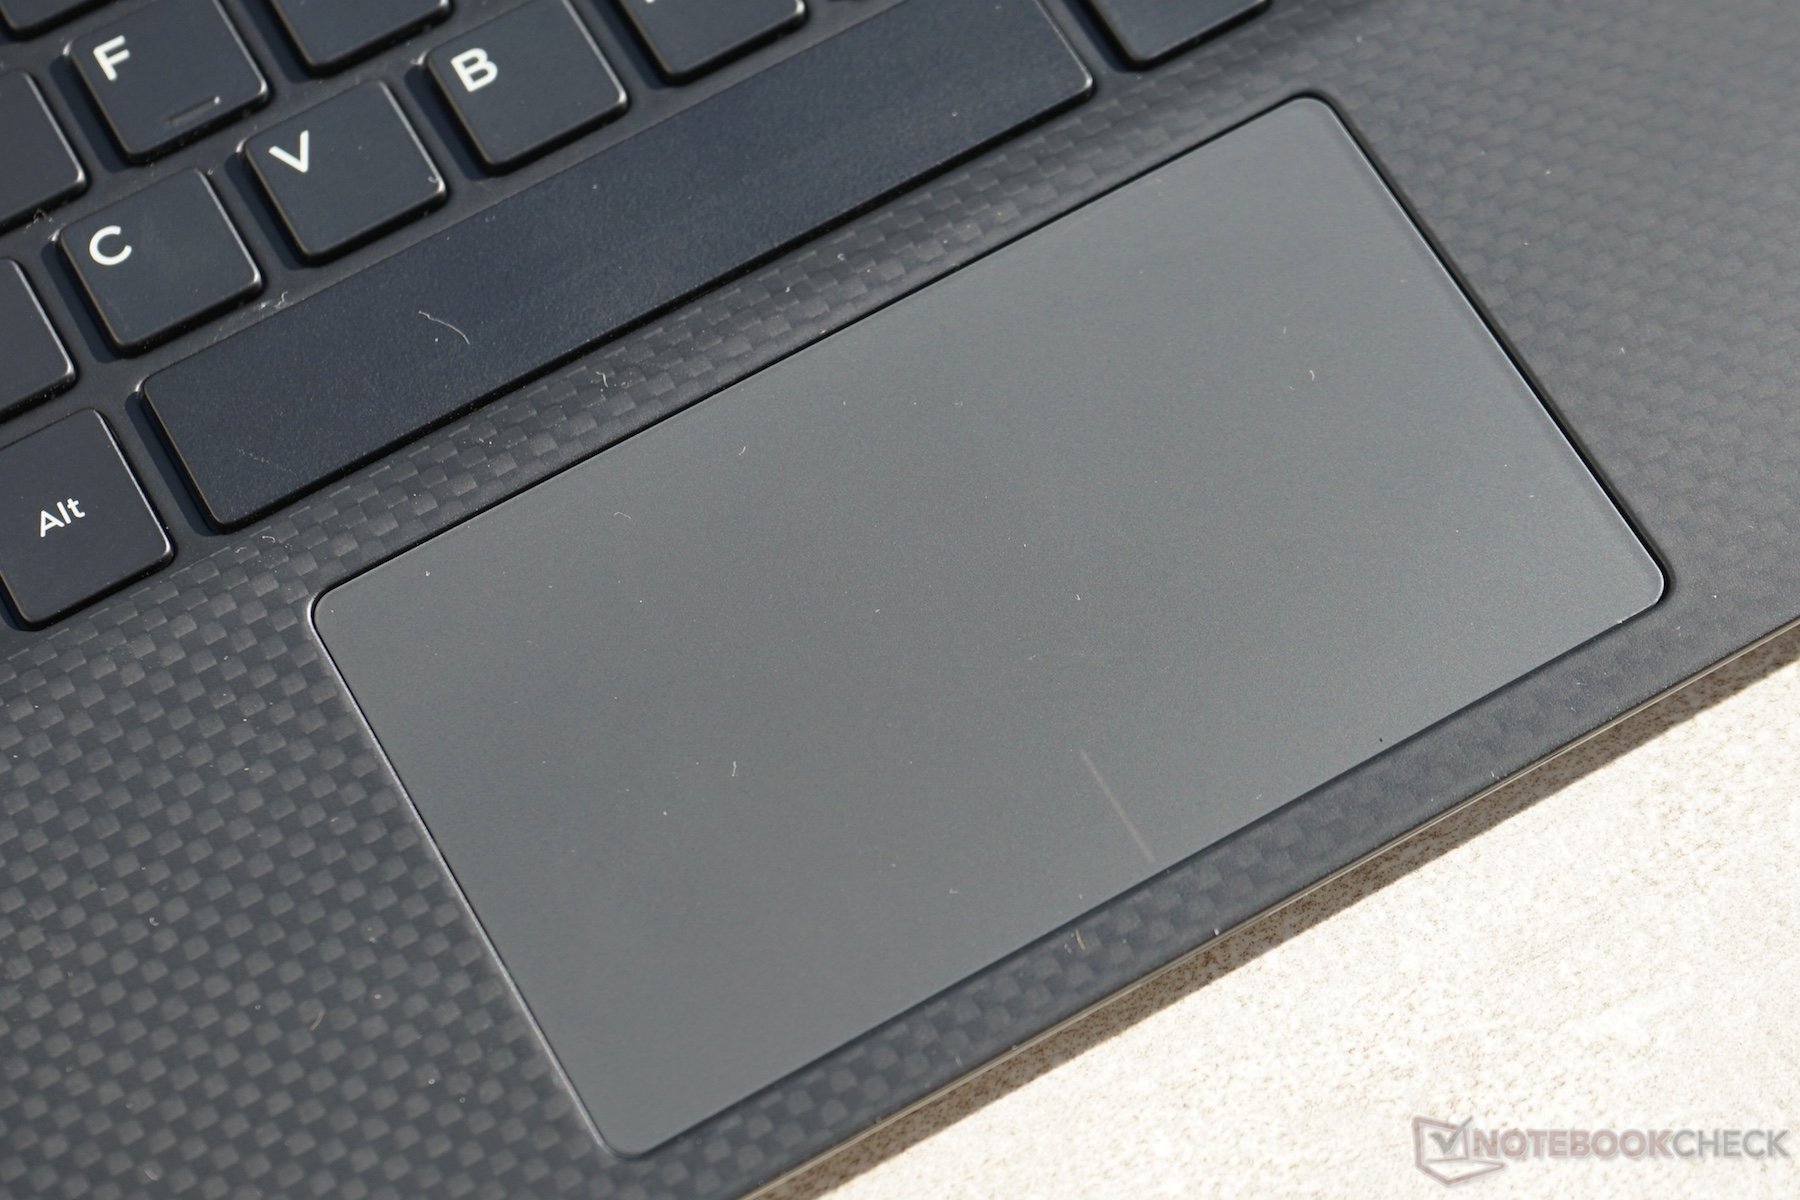
(+) The palmrests and touchpad are cooler than skin temperature with a maximum of 30 °C / 86 F and are therefore cool to the touch.
(±) The average temperature of the palmrest area of similar devices was 28.3 °C / 82.9 F (-1.7 °C / -3.1 F).
| Dell XPS 13 9360 (7200U) | Dell XPS 13 9350 (6200U) | Dell XPS 13 9350 (6560U) | Acer Aspire S 13 S5-371-71QZ | Lenovo IdeaPad 710S-13ISK | |
|---|---|---|---|---|---|
| Heat | -8% | -16% | 1% | -7% | |
| Maximum Upper Side * | 40 | 45.2 -13% | 45 -13% | 38.5 4% | 42 -5% |
| Maximum Bottom * | 42 | 45.2 -8% | 50 -19% | 47.7 -14% | 37.5 11% |
| Idle Upper Side * | 28 | 30.4 -9% | 27.2 3% | 34.8 -24% | |
| Idle Bottom * | 31 | 31.2 -1% | 27.4 12% | 33.4 -8% |
* ... smaller is better
Dell XPS 13 9360 QHD+ i5 audio analysis
(±) | speaker loudness is average but good (79.4 dB)
Bass 100 - 315 Hz
(±) | reduced bass - on average 9.5% lower than median
(±) | linearity of bass is average (14% delta to prev. frequency)
Mids 400 - 2000 Hz
(+) | balanced mids - only 4.5% away from median
(+) | mids are linear (5% delta to prev. frequency)
Highs 2 - 16 kHz
(+) | balanced highs - only 2.9% away from median
(±) | linearity of highs is average (11% delta to prev. frequency)
Overall 100 - 16.000 Hz
(±) | linearity of overall sound is average (15.1% difference to median)
Compared to same class
» 27% of all tested devices in this class were better, 5% similar, 68% worse
» The best had a delta of 5%, average was 19%, worst was 53%
Compared to all devices tested
» 17% of all tested devices were better, 4% similar, 79% worse
» The best had a delta of 4%, average was 25%, worst was 134%
Apple MacBook 12 (Early 2016) 1.1 GHz audio analysis
(+) | speakers can play relatively loud (83.6 dB)
Bass 100 - 315 Hz
(±) | reduced bass - on average 11.3% lower than median
(±) | linearity of bass is average (14.2% delta to prev. frequency)
Mids 400 - 2000 Hz
(+) | balanced mids - only 2.4% away from median
(+) | mids are linear (5.5% delta to prev. frequency)
Highs 2 - 16 kHz
(+) | balanced highs - only 2% away from median
(+) | highs are linear (4.5% delta to prev. frequency)
Overall 100 - 16.000 Hz
(+) | overall sound is linear (10.2% difference to median)
Compared to same class
» 5% of all tested devices in this class were better, 2% similar, 93% worse
» The best had a delta of 5%, average was 19%, worst was 53%
Compared to all devices tested
» 3% of all tested devices were better, 1% similar, 96% worse
» The best had a delta of 4%, average was 25%, worst was 134%
Dell XPS 13 2016 9350 (FHD, i7-6560U) audio analysis
(+) | speakers can play relatively loud (83.8 dB)
Bass 100 - 315 Hz
(-) | nearly no bass - on average 19.4% lower than median
(-) | bass is not linear (15.4% delta to prev. frequency)
Mids 400 - 2000 Hz
(+) | balanced mids - only 4.7% away from median
(±) | linearity of mids is average (9.1% delta to prev. frequency)
Highs 2 - 16 kHz
(+) | balanced highs - only 3.5% away from median
(±) | linearity of highs is average (7.6% delta to prev. frequency)
Overall 100 - 16.000 Hz
(±) | linearity of overall sound is average (18.8% difference to median)
Compared to same class
» 51% of all tested devices in this class were better, 7% similar, 42% worse
» The best had a delta of 5%, average was 19%, worst was 53%
Compared to all devices tested
» 38% of all tested devices were better, 8% similar, 54% worse
» The best had a delta of 4%, average was 25%, worst was 134%
| desligado | |
| Ocioso | |
| Carga |
|
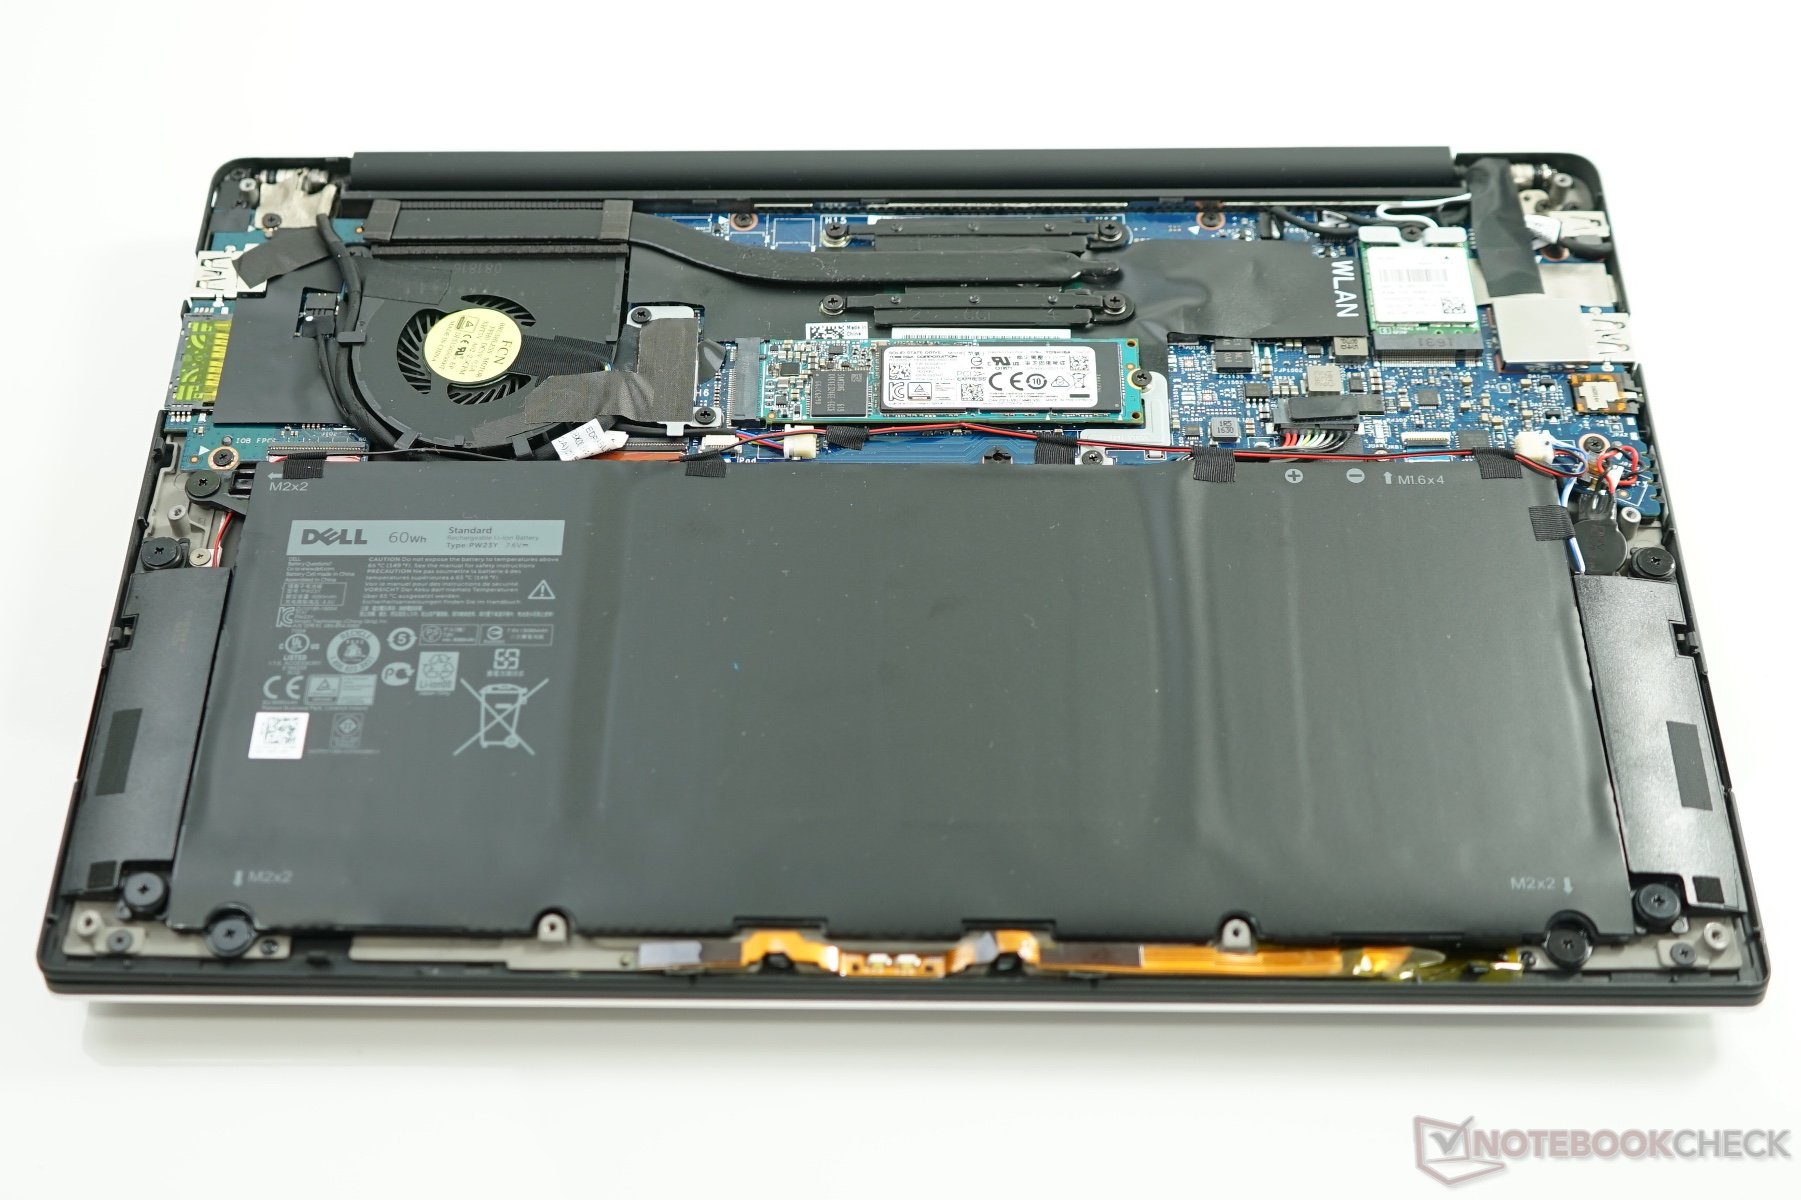
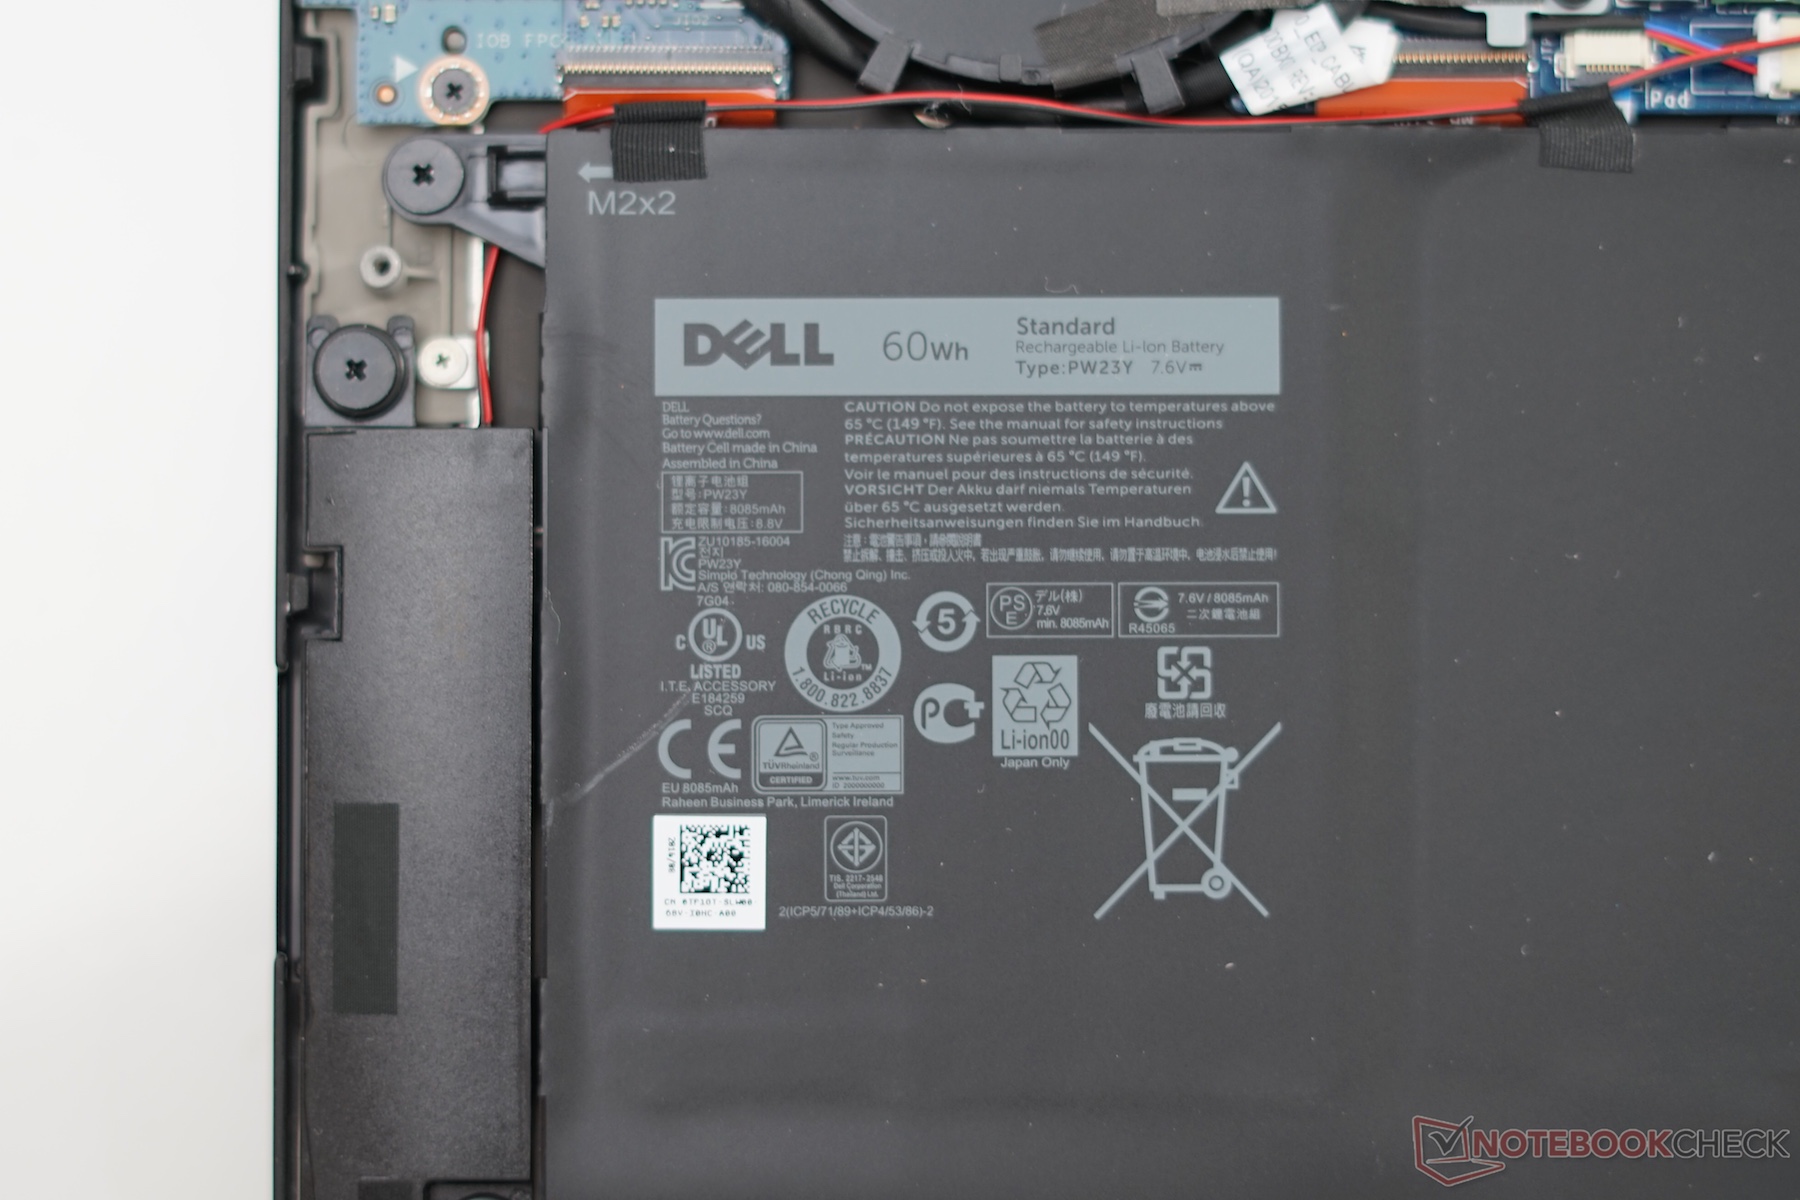
| Dell XPS 13 9360 QHD+ i5 i5-7200U, 3200x1800, 60 Wh | Dell XPS 13 2016 9350 (FHD, i7-6560U) 6560U, 1920x1080, 56 Wh | Asus Zenbook UX302LA-C4003H 4200U, 1920x1080, 50 Wh | Acer Aspire S 13 S5-371-71QZ 6500U, 1920x1080, 45 Wh | HP Spectre 13 6500U, 1920x1080, 38 Wh | Microsoft Surface Pro 4, Core i5, 128GB 6300U, 2736x1824, 38 Wh | Apple MacBook Pro Retina 13 inch 2015-03 5257U, 2560x1600, 75 Wh | |
|---|---|---|---|---|---|---|---|
| Battery Runtime | -7% | -24% | -19% | -40% | -19% | -8% | |
| H.264 | 547 | 581 6% | |||||
| WiFi v1.3 | 526 | 436 -17% | 472 -10% | 338 -36% | 427 -19% | 539 2% | |
| Load | 137 | 141 3% | 104 -24% | 99 -28% | 78 -43% | 111 -19% | 94 -31% |
| Reader / Idle | 944 | 709 | 1028 | 715 | 899 | 1690 | |
| WiFi | 336 |
Pricecompare
