Análise do laptop MSI Prestige 13 AI Evo - Core Ultra 7 e OLED pesando menos de 1 kg
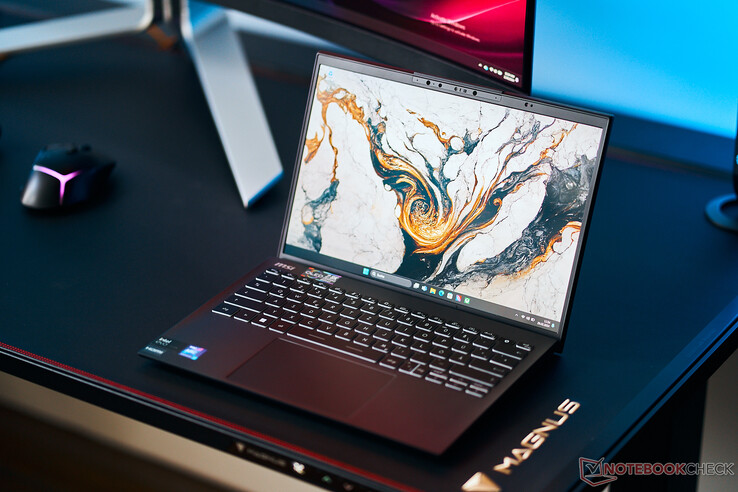
O MSI Prestige 13 AI Evo é um subnotebook compacto que pesa menos de 1 quilo. O novo modelo 2024 recebeu um processador Meteor Lake da Intel, bem como um módulo Wi-Fi 7. Nosso dispositivo de teste é a variante com o Core Ultra 7 155H, Intel Arc Graphics, 32 GB de RAM, um SSD de 1 TB e uma tela OLED de 2,8K por cerca de US$ 1.300.
Possíveis concorrentes em comparação
Avaliação | Data | Modelo | Peso | Altura | Size | Resolução | Preço |
|---|---|---|---|---|---|---|---|
| 86.6 % v7 (old) | 03/2024 | MSI Prestige 13 AI Evo Ultra 7 155H, Arc 8-Core | 967 g | 16.9 mm | 13.30" | 2880x1800 | |
| 89.5 % v7 (old) | 08/2023 | Lenovo ThinkPad X1 Nano Gen 3 i7-1360P, Iris Xe G7 96EUs | 989 g | 14.8 mm | 13.00" | 2160x1350 | |
| 90.2 % v7 (old) | 10/2023 | Dell Latitude 13 7340 i5-1345U i5-1345U, Iris Xe G7 80EUs | 1.1 kg | 18.2 mm | 13.30" | 1920x1200 | |
| 91.9 % v7 (old) | 07/2023 | HP Dragonfly G4 i7-1365U, Iris Xe G7 96EUs | 1.1 kg | 16.3 mm | 13.50" | 1920x1280 | |
| 85.4 % v7 (old) | 05/2023 | Asus ZenBook S13 OLED UX5304 i7-1355U, Iris Xe G7 96EUs | 1 kg | 11.8 mm | 13.30" | 2880x1800 |
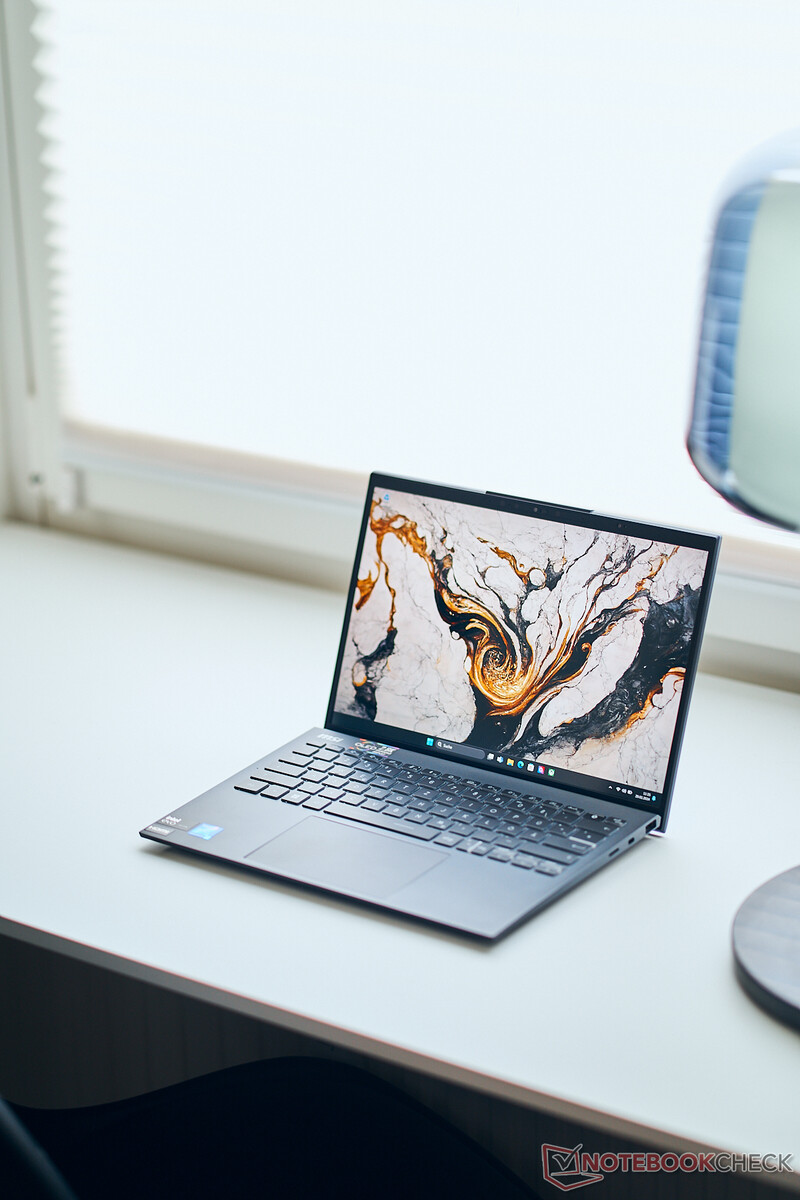
Estojo - O Prestige 13 com um estojo de liga de magnésio
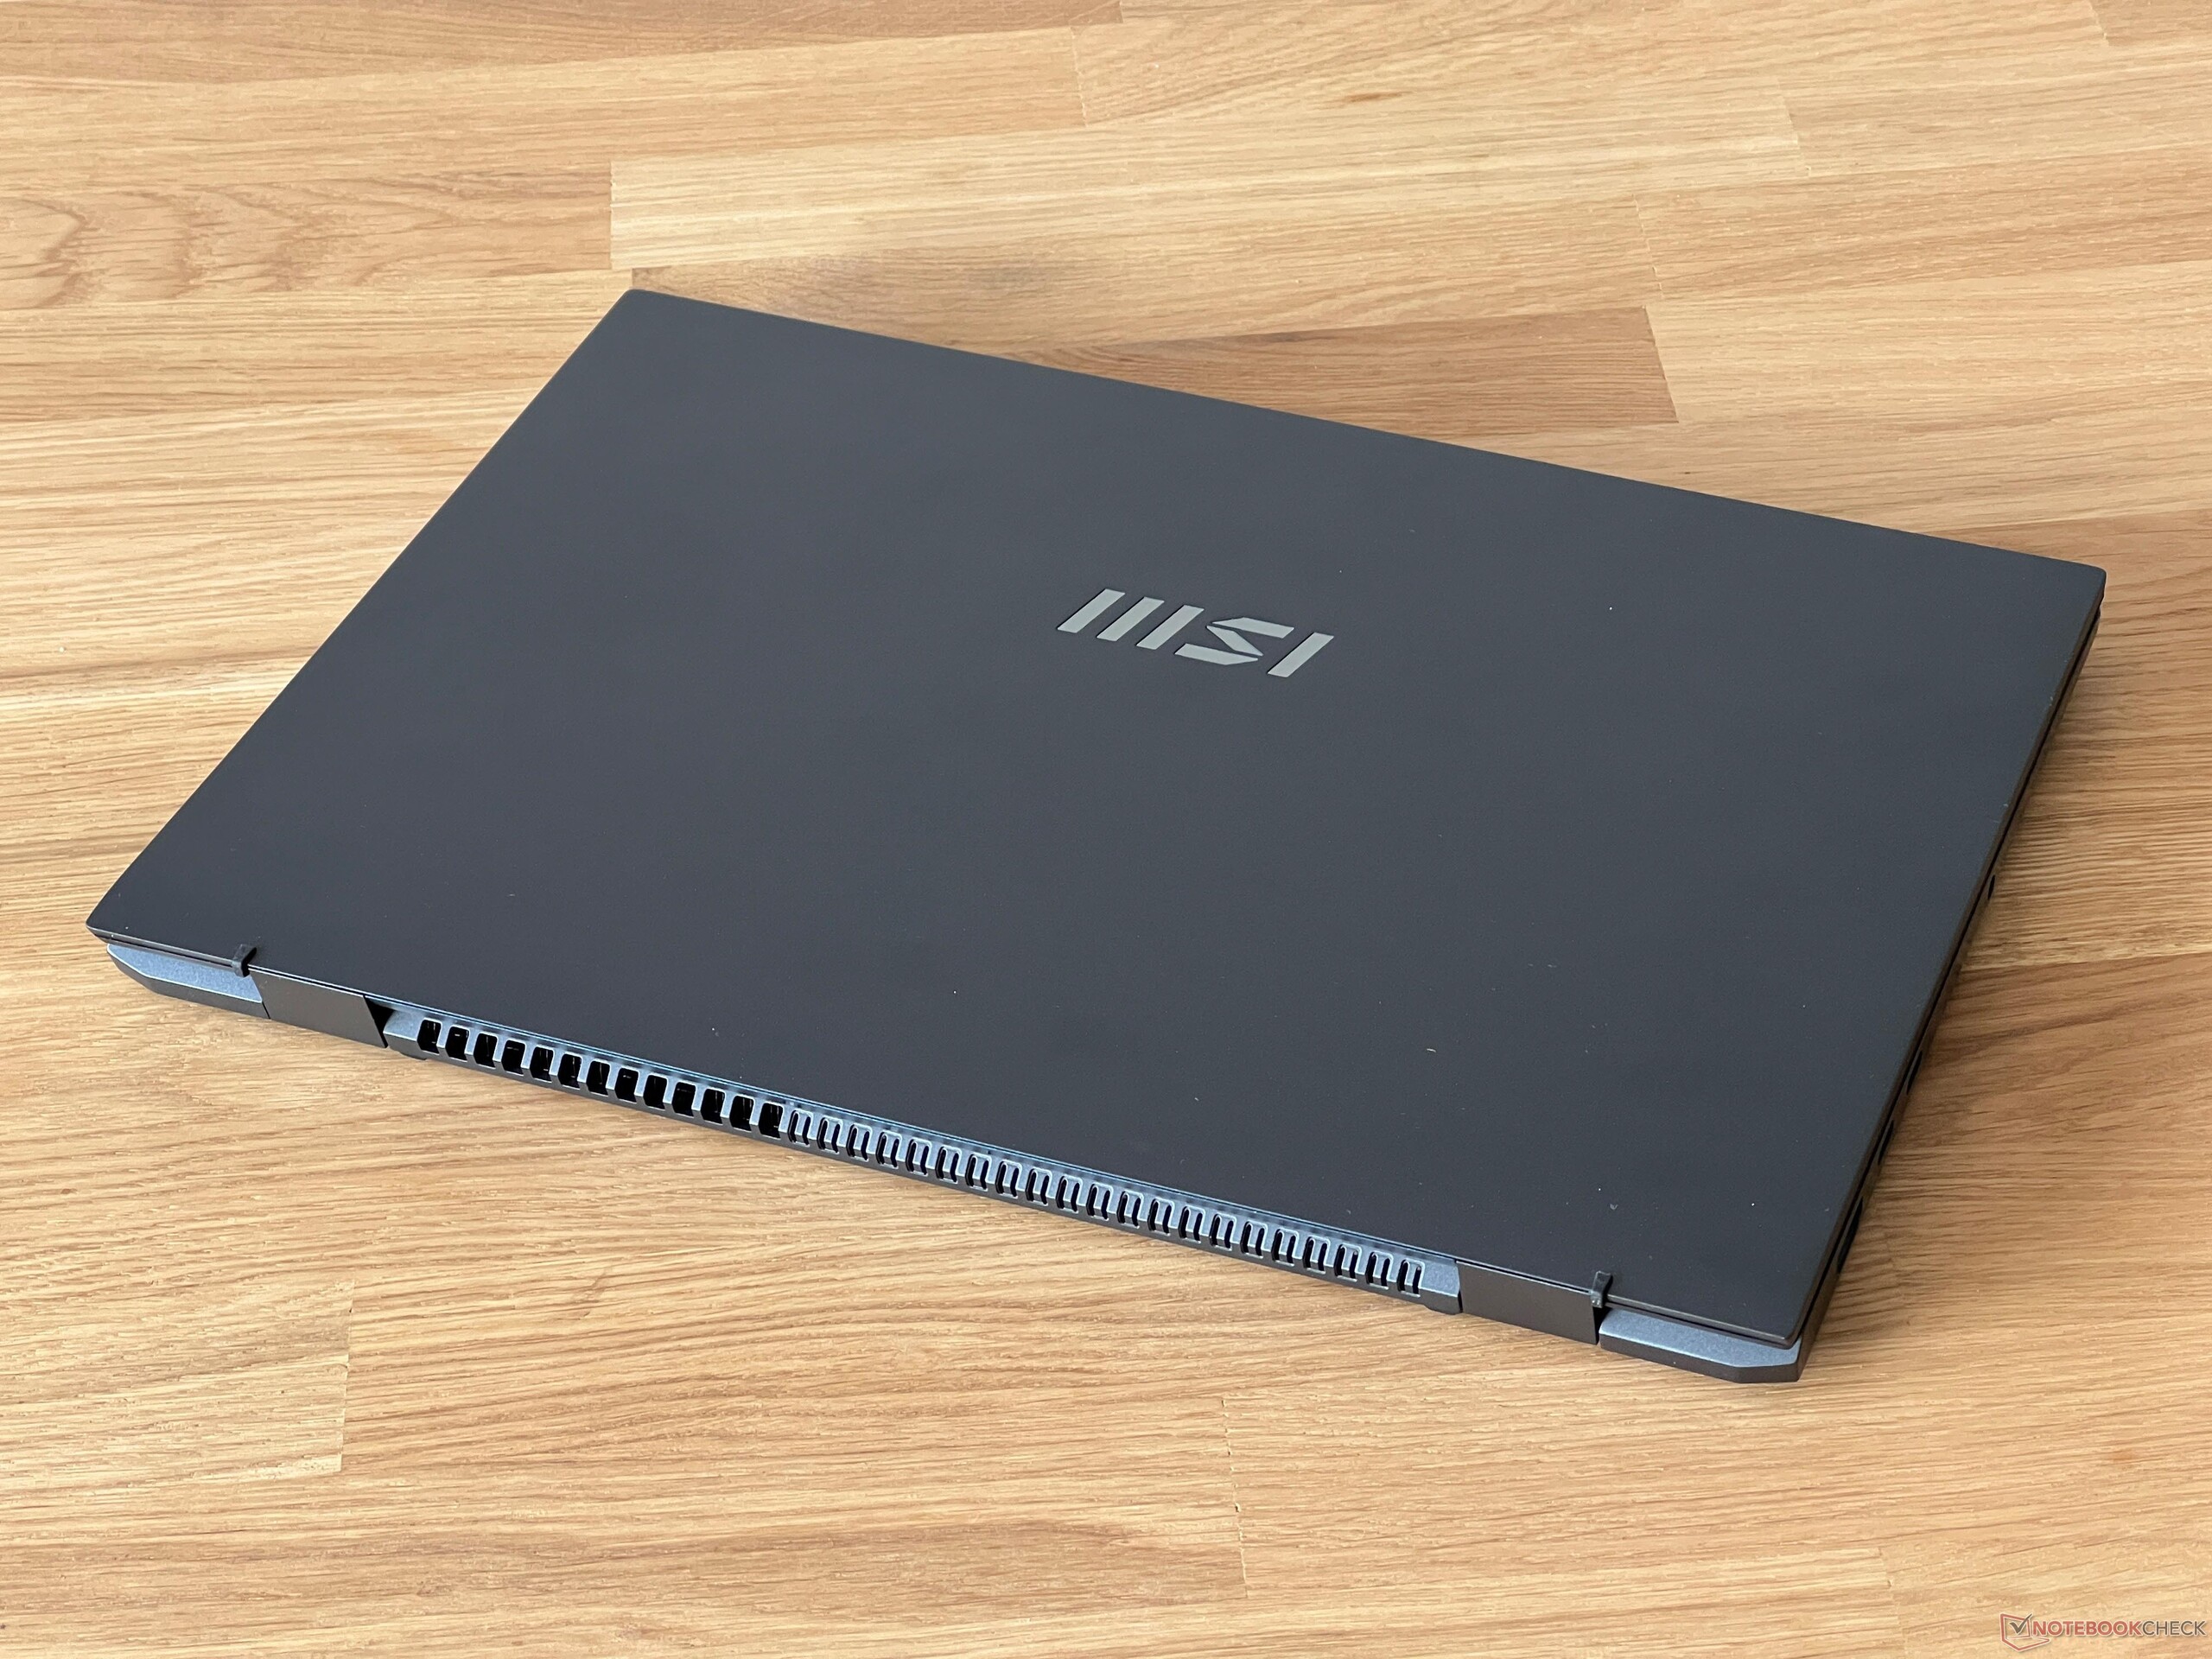
A MSI oferece o Prestige 13 na cor cinza escuro (Stellar Gray) - a mesma do nosso dispositivo de teste - ou, alternativamente, na cor branca (Pure White). Ambas as versões utilizam uma liga de magnésio-alumínio, o que, presumivelmente, também contribui para o baixo peso do dispositivo de 976 gramas. Quando o senhor entra em contato com o laptop pela primeira vez, fica imediatamente surpreso com a leveza dele. Suas superfícies parecem de alta qualidade e, mesmo no modelo escuro, as marcas de impressões digitais não parecem ser um grande problema. Além do logotipo da MSI, o Prestige 13 não apresenta nenhum elemento de design adicional. As bordas são bem finas em ambos os lados, mas a moldura ao longo da borda superior é bem larga devido à webcam instalada.
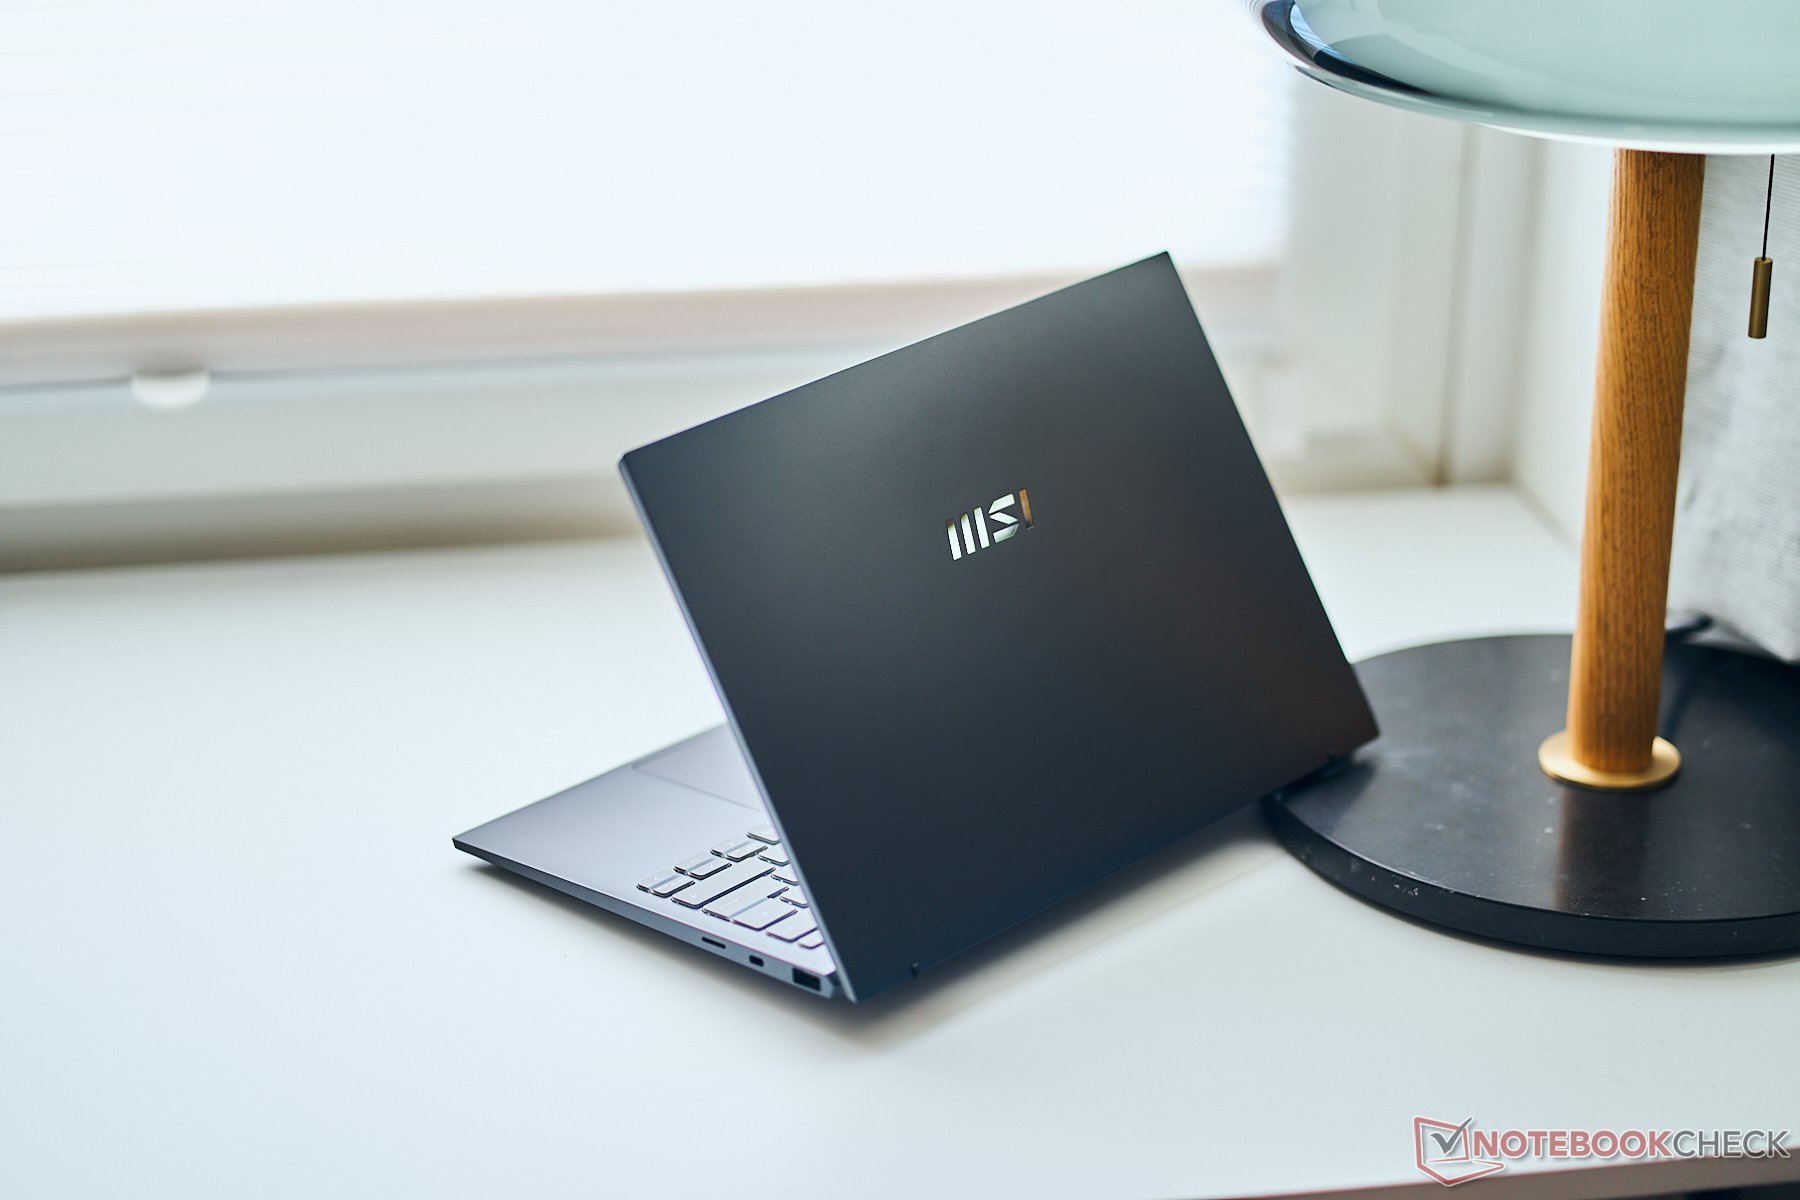
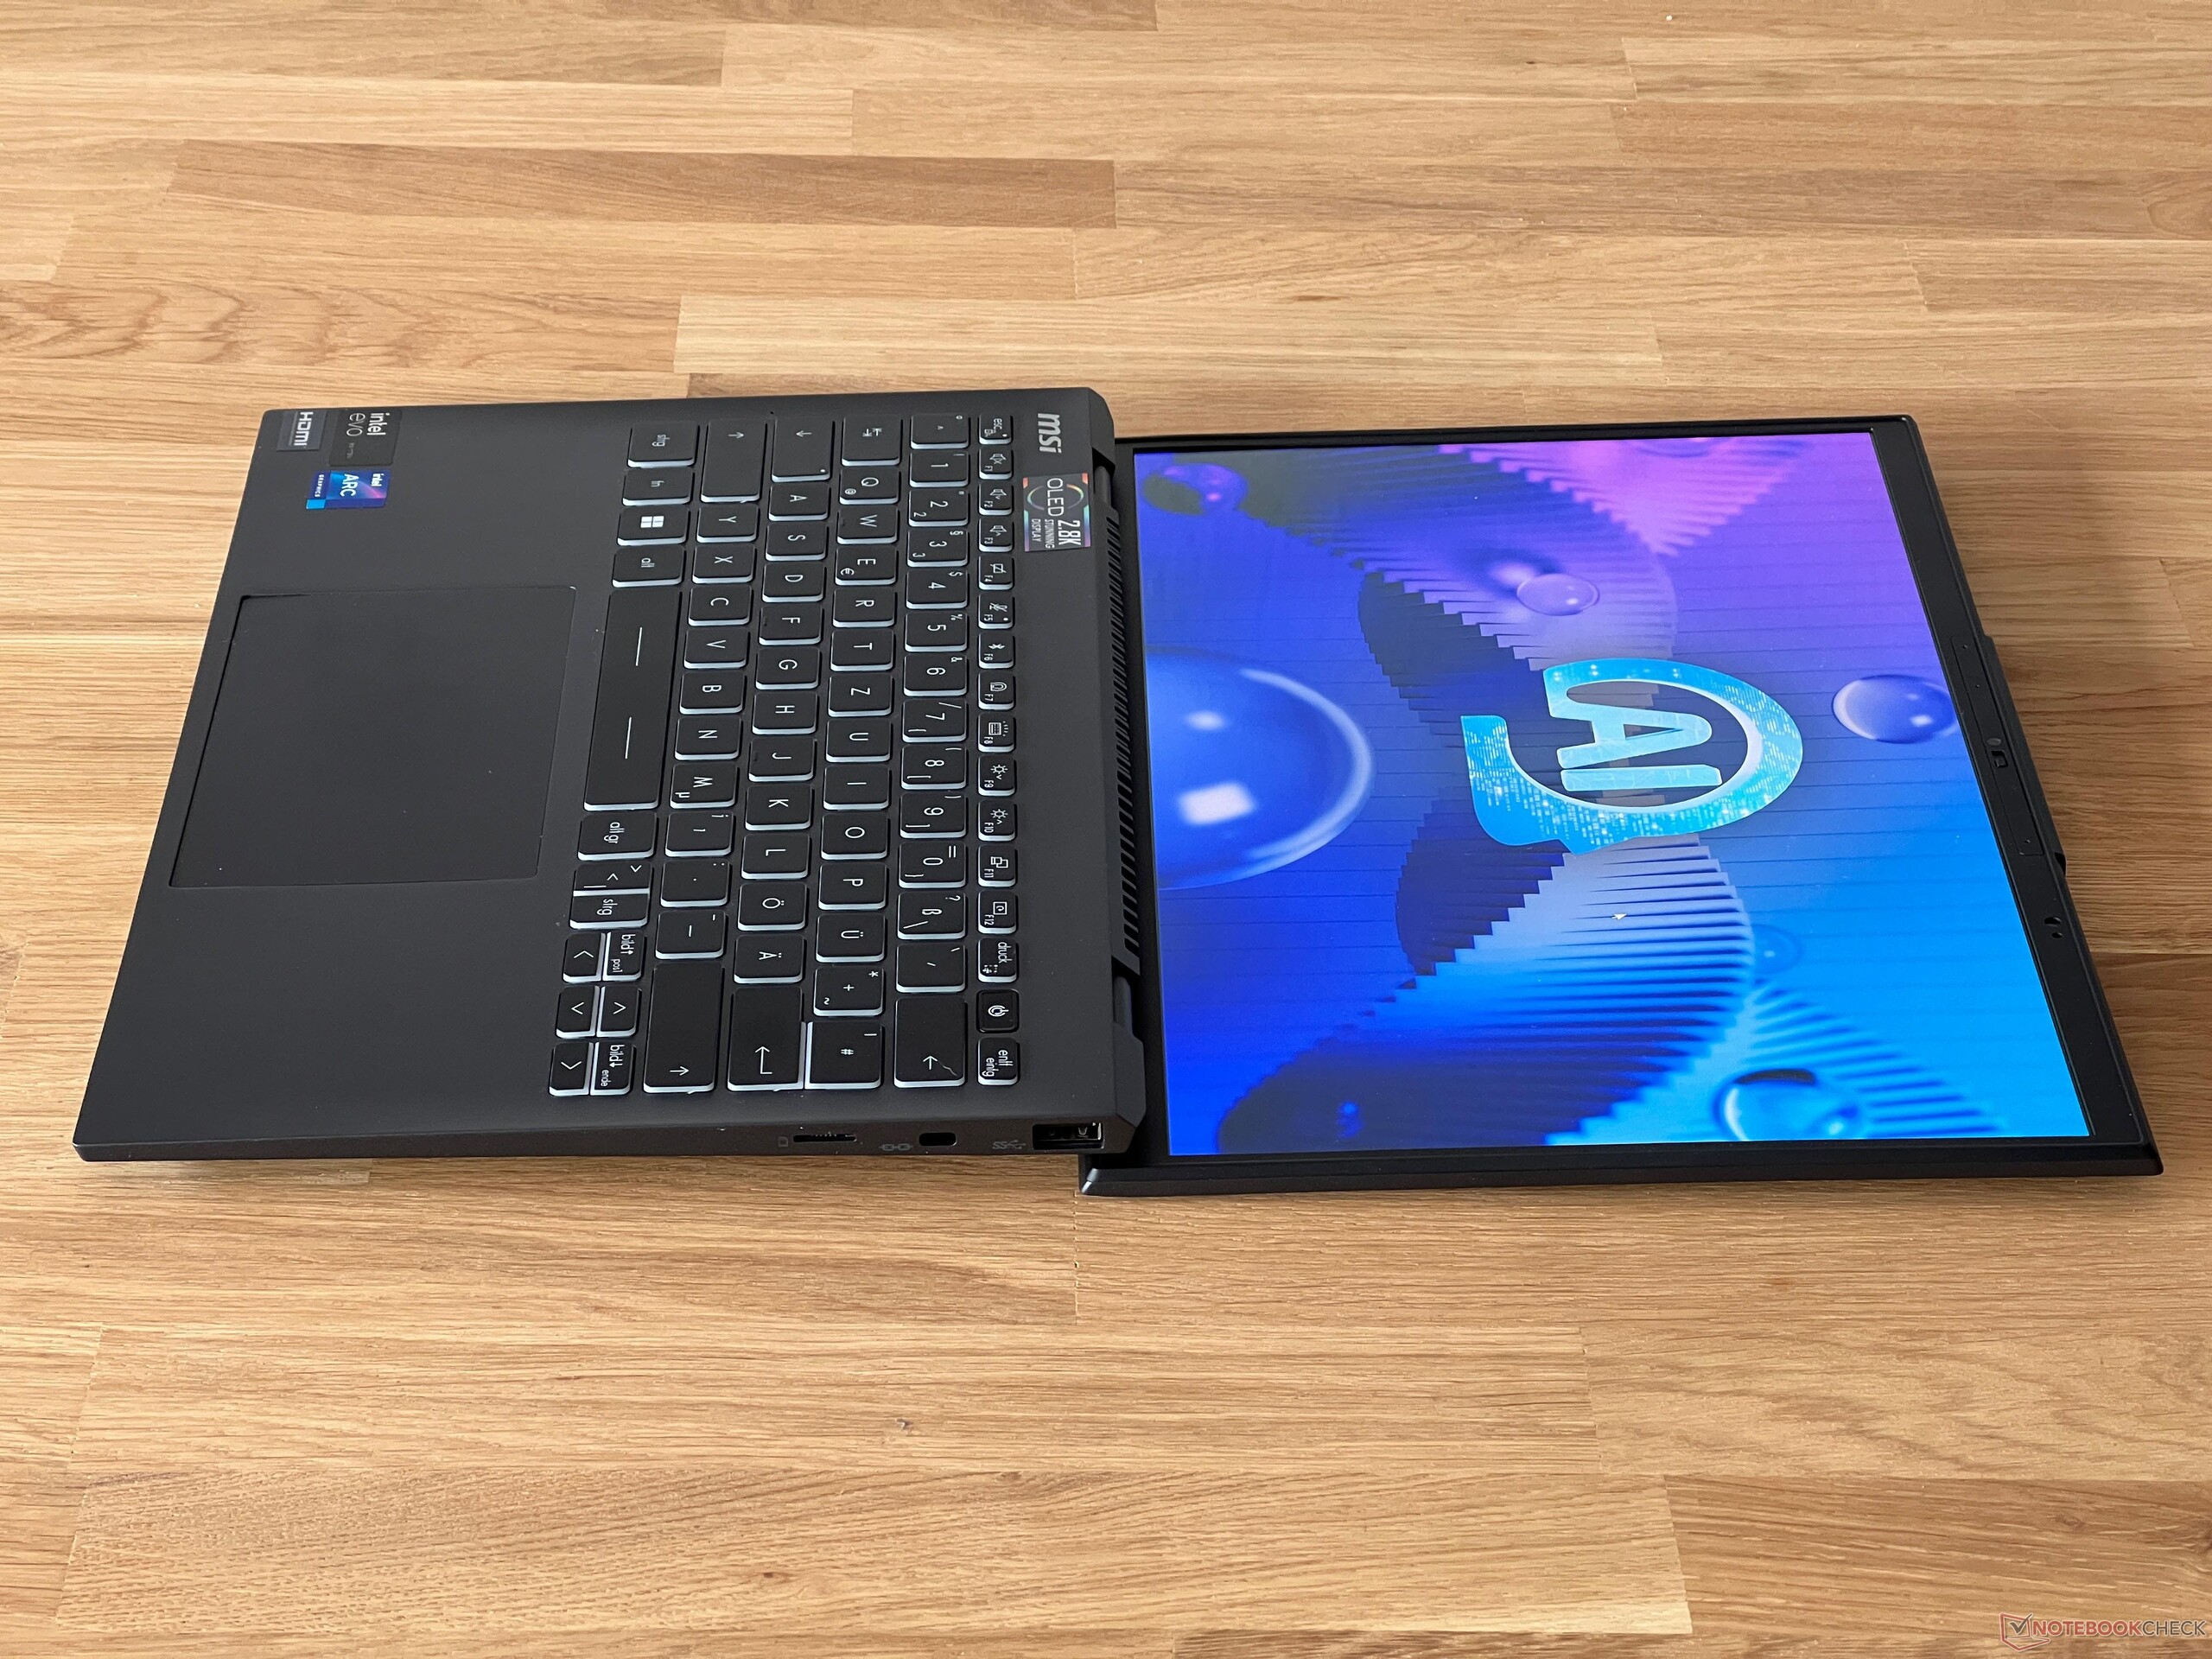
Ele é bem construído, mas tem alguns problemas de estabilidade. A área traseira da unidade básica é levemente levantada quando o usuário abre a tampa e a parte central do teclado pode ser deformada para dentro com um pouco de pressão. Ainda assim, ao digitar normalmente, isso não deve ser um grande problema. Se o senhor girar levemente a unidade de base, o laptop emitirá ruídos de rangidos perceptíveis. As dobradiças da tela são ajustadas com muita firmeza e evitam que a tampa balance, o que dificulta um pouco a abertura com uma mão. Seu ângulo máximo de abertura é de 180 graus e a própria tampa é muito estável.
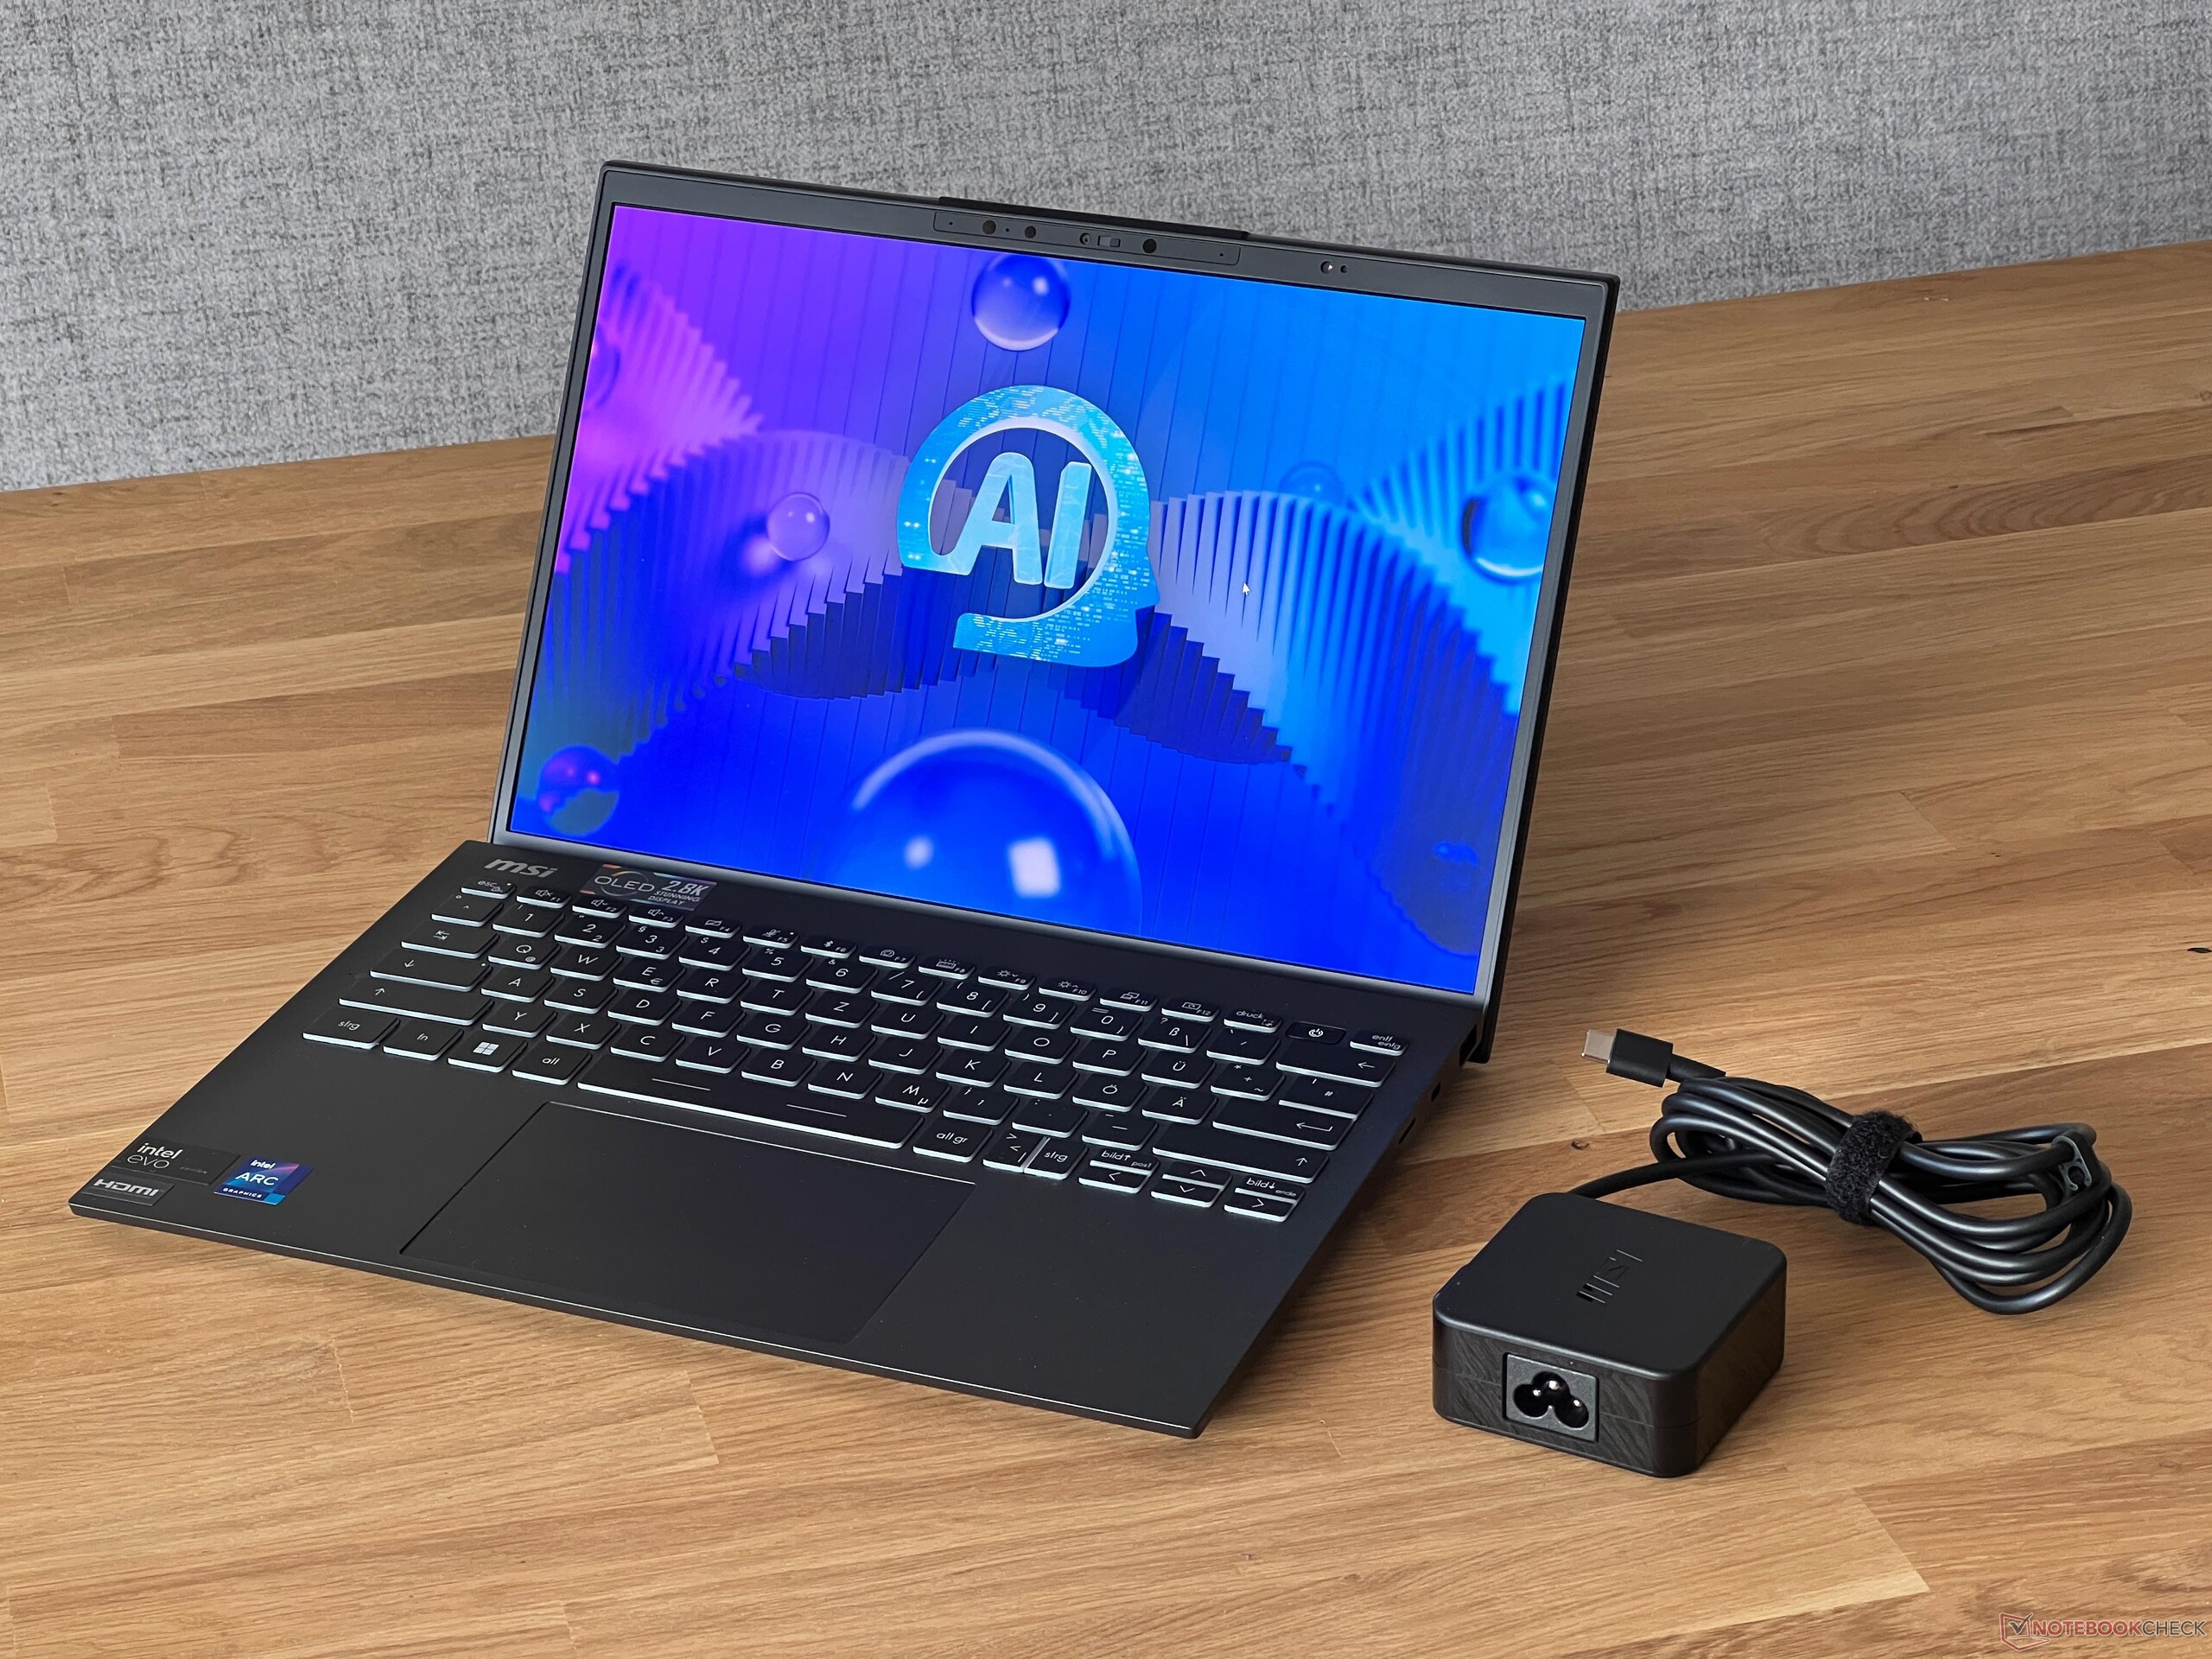
Com menos de 1 kg, o Prestige 13 é extremamente leve, mas o mesmo pode ser dito sobre os outros dispositivos de comparação. No que diz respeito à pegada, os concorrentes também não ocupam muito espaço. O Prestige pode ser facilmente guardado em qualquer bolsa. A MSI utiliza uma fonte de alimentação compacta de 65 watts, mas não é uma fonte de alimentação plug-in, por isso é bastante pesada, com 341 gramas.
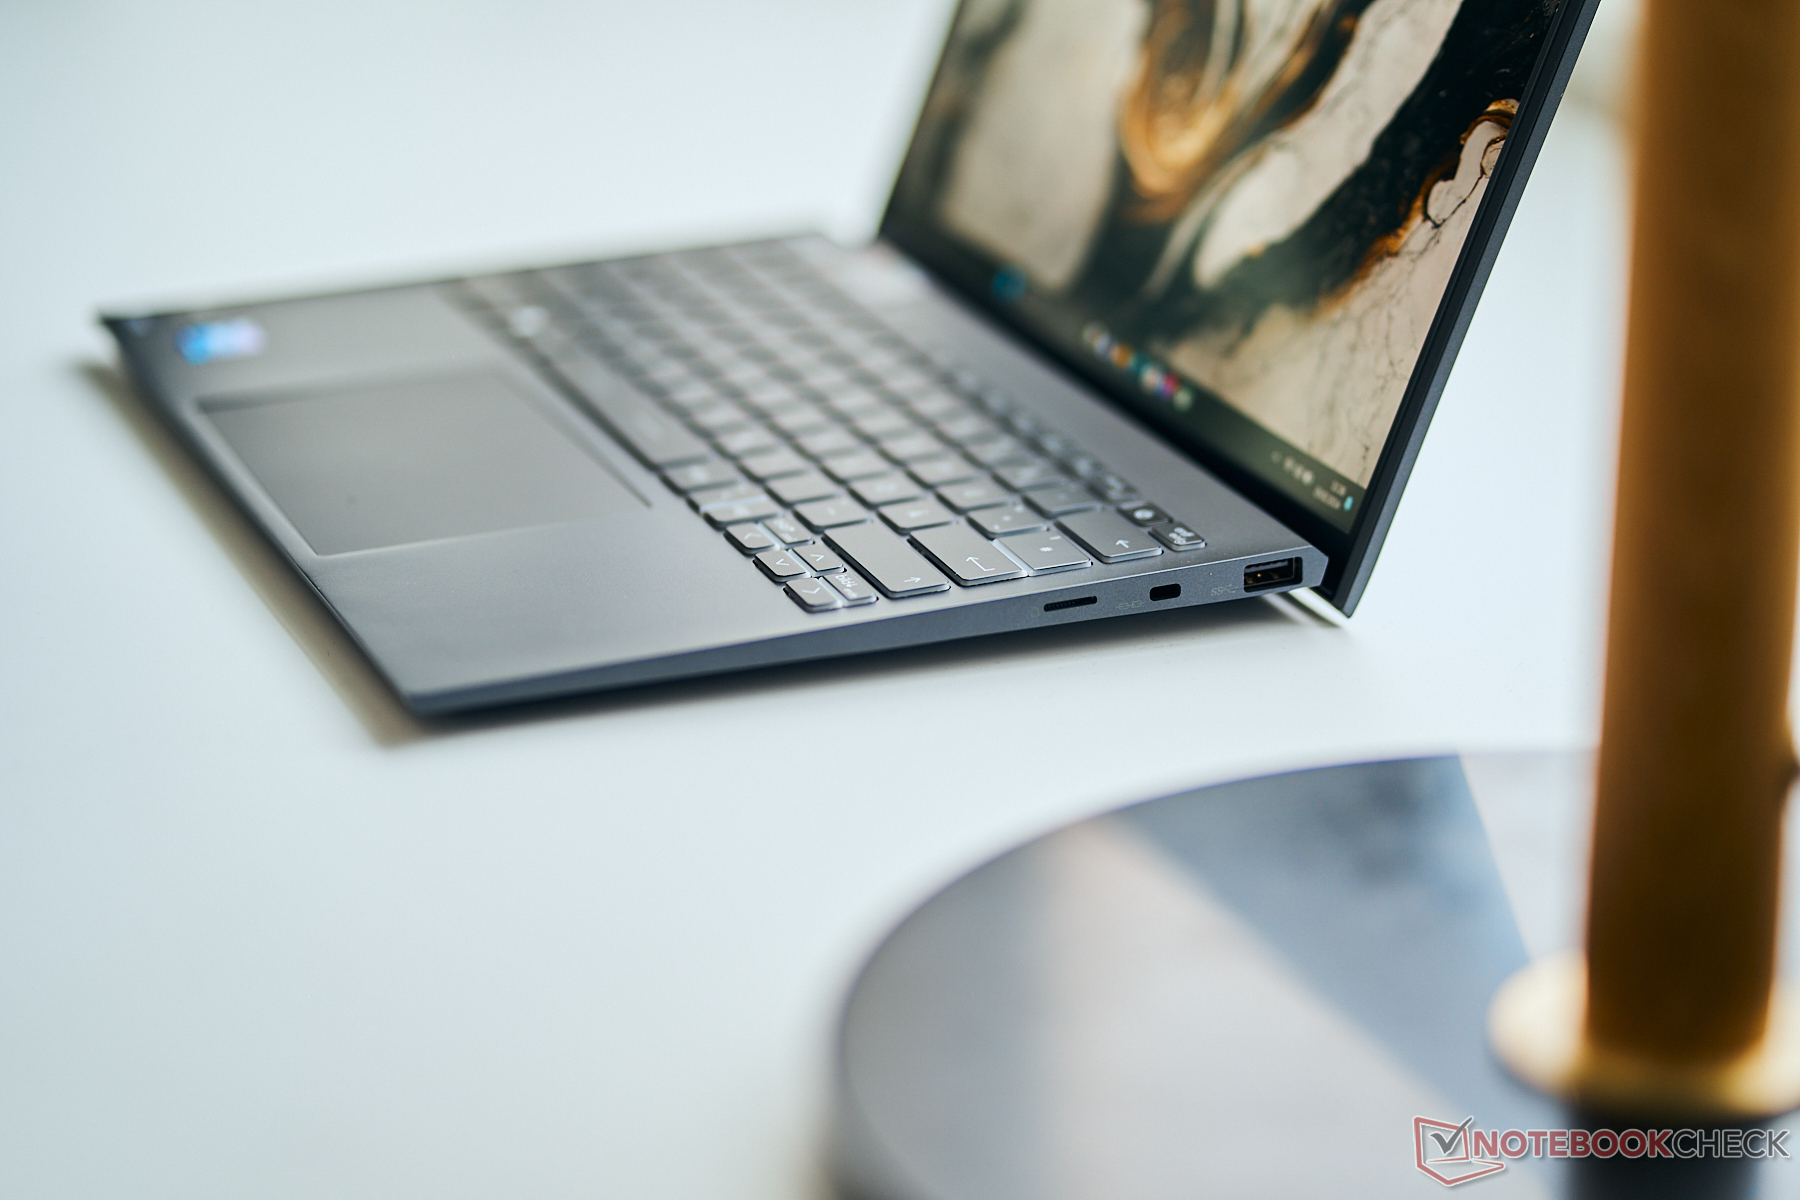
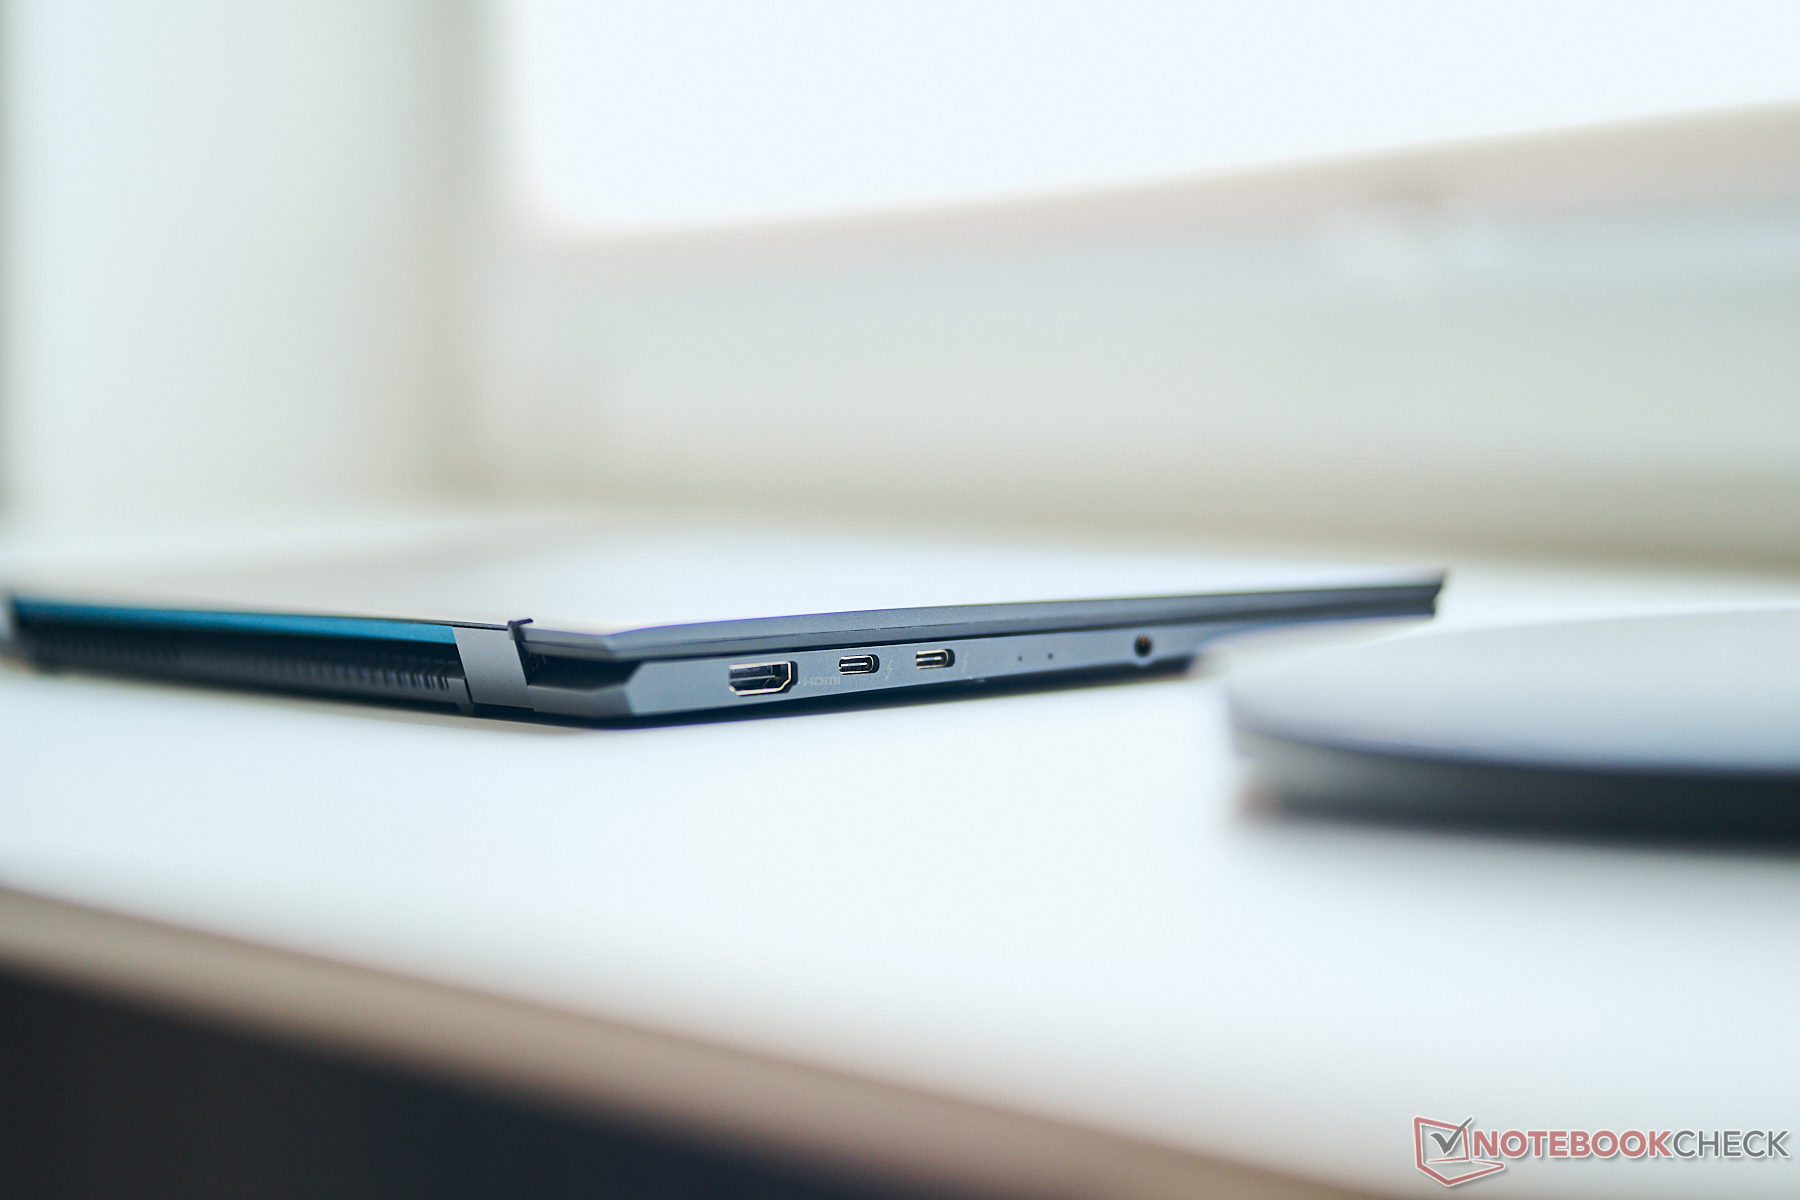
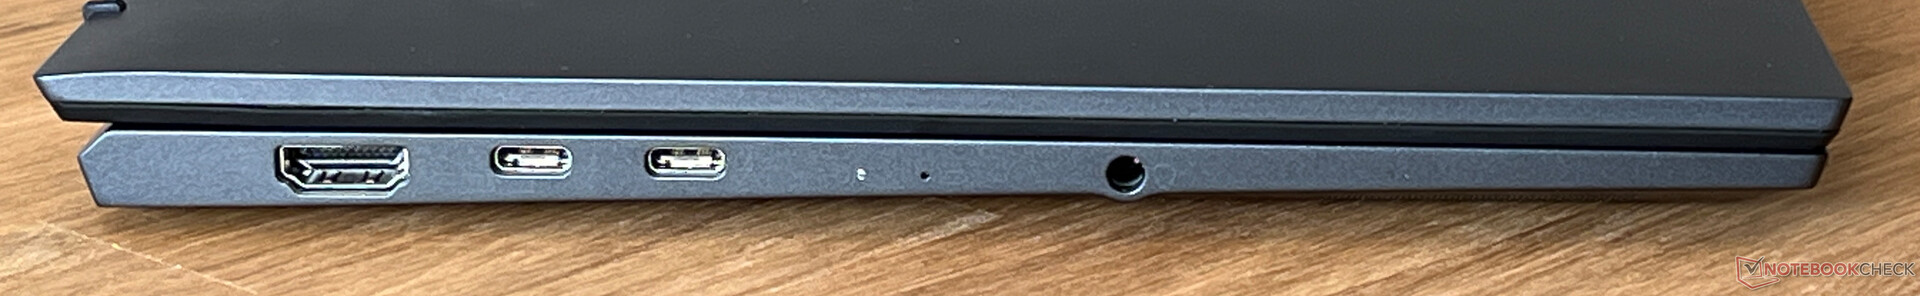
Conectividade - A MSI com Thunderbolt 4 e HDMI 2.1
O Prestige 13 pode ser compacto, mas ainda assim apresenta todas as conexões importantes, incluindo USB-C, USB-A e uma saída HDMI completa. Também gostamos da forma como as portas estão espalhadas pelo laptop e não temos muito a criticar.
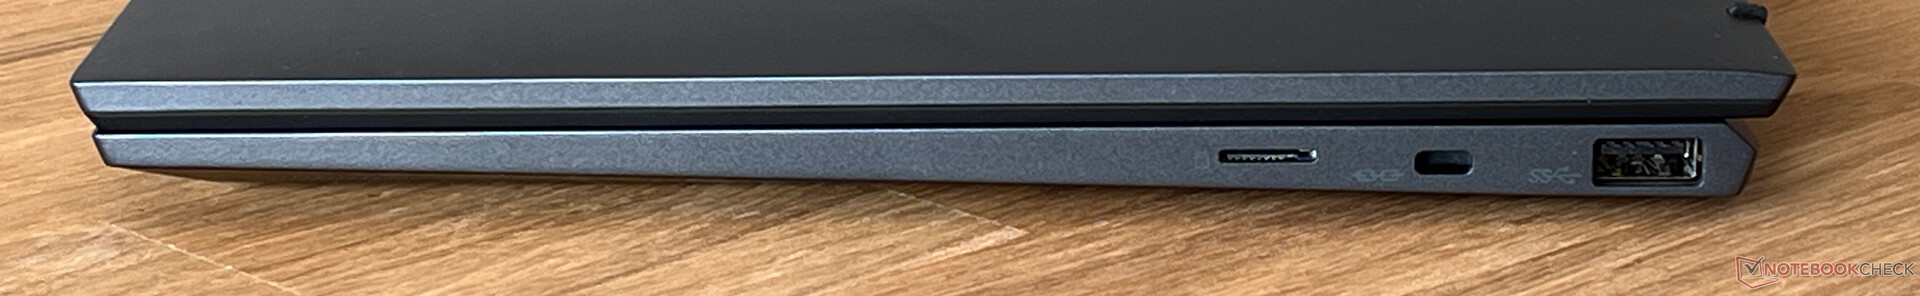
Leitor de cartão SD
O lado direito do dispositivo abriga um leitor de cartão microSD (mecanismo de mola) que, em combinação com nosso cartão de referência (Angelbird AV Pro V60), alcançou taxas de transferência muito boas. Ao copiar imagens, observamos uma média de mais de 140 MB/s e um máximo de mais de 200 MB/s. Nenhum dos outros dispositivos de comparação possui um leitor de cartão.
| SD Card Reader | |
| average JPG Copy Test (av. of 3 runs) | |
| MSI Prestige 13 AI Evo (Angelbird AV Pro V60) | |
| Média da turma Subnotebook (23.7 - 188, n=9, últimos 2 anos) | |
| maximum AS SSD Seq Read Test (1GB) | |
| MSI Prestige 13 AI Evo (Angelbird AV Pro V60) | |
| Média da turma Subnotebook (24.9 - 195, n=8, últimos 2 anos) | |
Comunicação
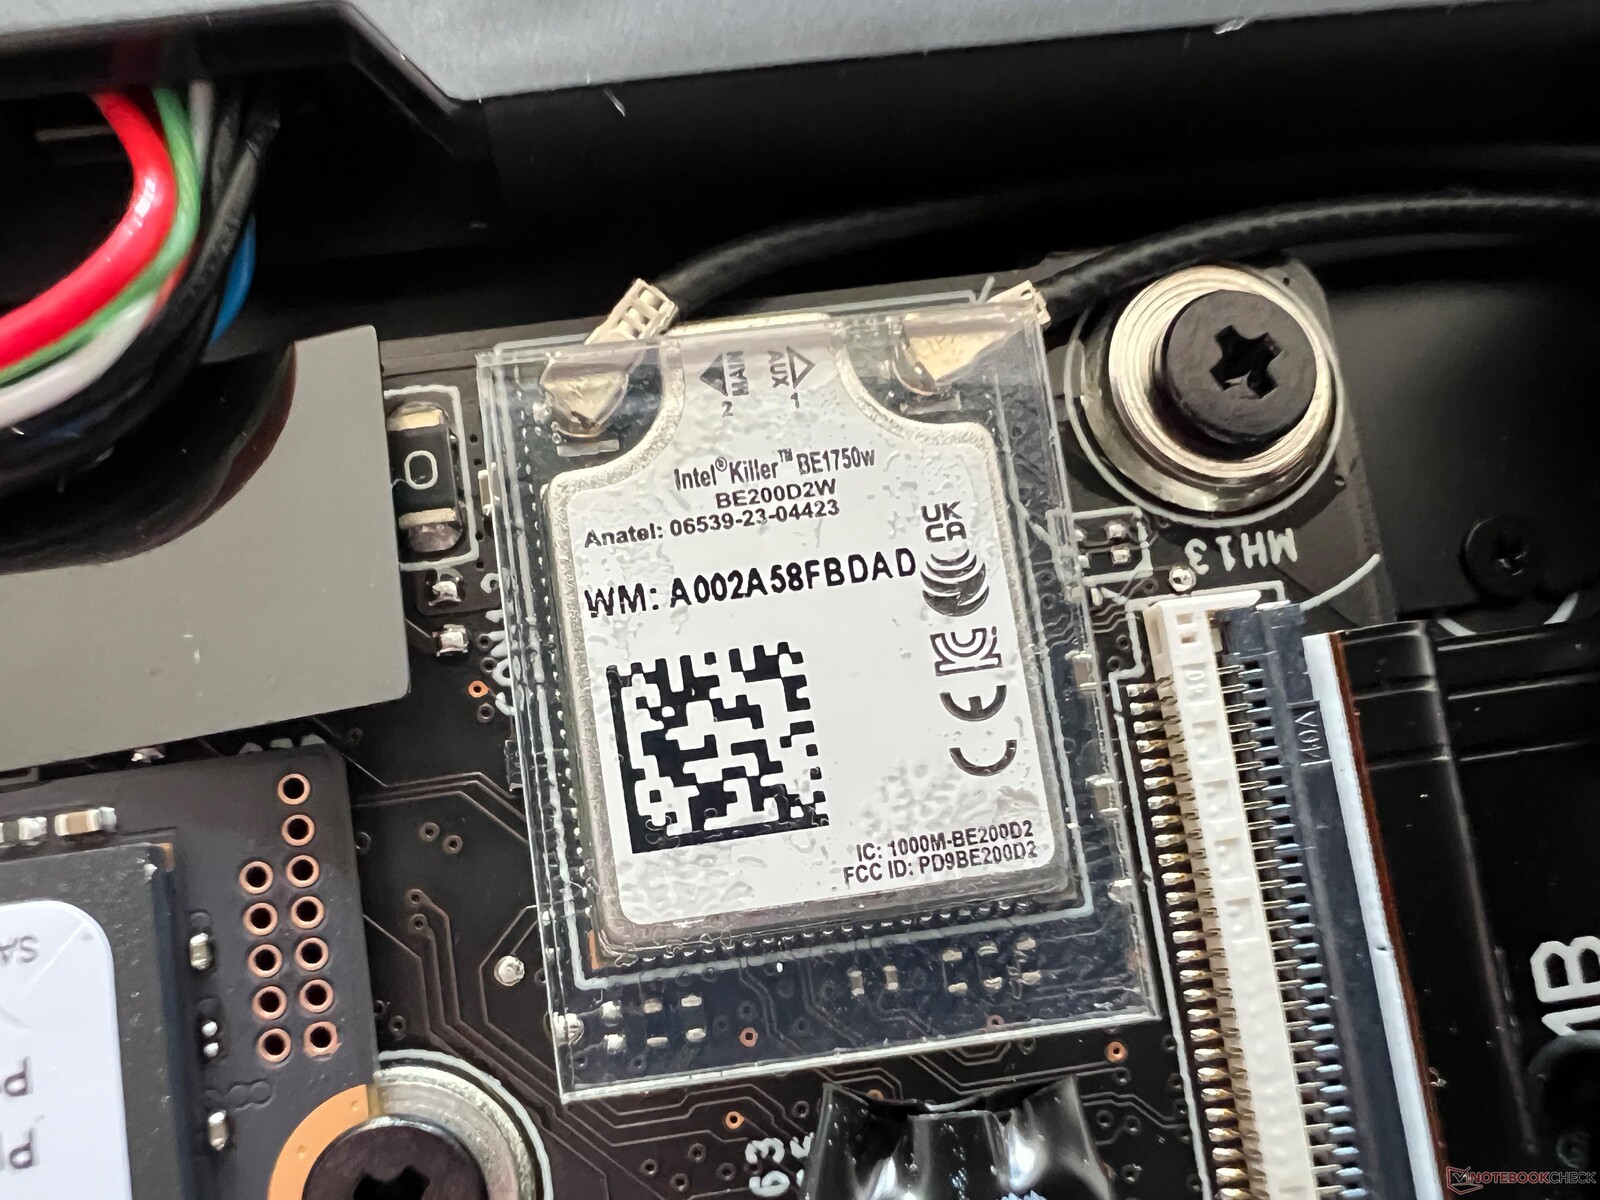
A MSI instalou o novo módulo BE1750W (320 MHz) Wi-Fi 7 da Intel no laptop. Infelizmente, ainda não podemos fazer uso do novo padrão usando nosso roteador de referência atual. No entanto, suas taxas de transferência via Wi-Fi 6 foram muito estáveis e altas.
| Networking | |
| MSI Prestige 13 AI Evo | |
| iperf3 transmit AXE11000 | |
| iperf3 receive AXE11000 | |
| Lenovo ThinkPad X1 Nano Gen 3 | |
| iperf3 transmit AXE11000 | |
| iperf3 receive AXE11000 | |
| iperf3 transmit AXE11000 6GHz | |
| iperf3 receive AXE11000 6GHz | |
| Dell Latitude 13 7340 i5-1345U | |
| iperf3 transmit AXE11000 | |
| iperf3 receive AXE11000 | |
| iperf3 transmit AXE11000 6GHz | |
| iperf3 receive AXE11000 6GHz | |
| HP Dragonfly G4 | |
| iperf3 transmit AXE11000 | |
| iperf3 receive AXE11000 | |
| iperf3 transmit AXE11000 6GHz | |
| iperf3 receive AXE11000 6GHz | |
| Asus ZenBook S13 OLED UX5304 | |
| iperf3 transmit AXE11000 | |
| iperf3 receive AXE11000 | |
Webcam
A webcam de 1080p oferece uma qualidade de imagem decente em boas condições de iluminação e não possui uma tampa mecânica. Ela também suporta efeitos de estúdio do Windows (fundo com foco suave, contato visual, rastreamento). Além disso, ela tem uma câmera IR instalada para reconhecimento facial via Windows Hello.


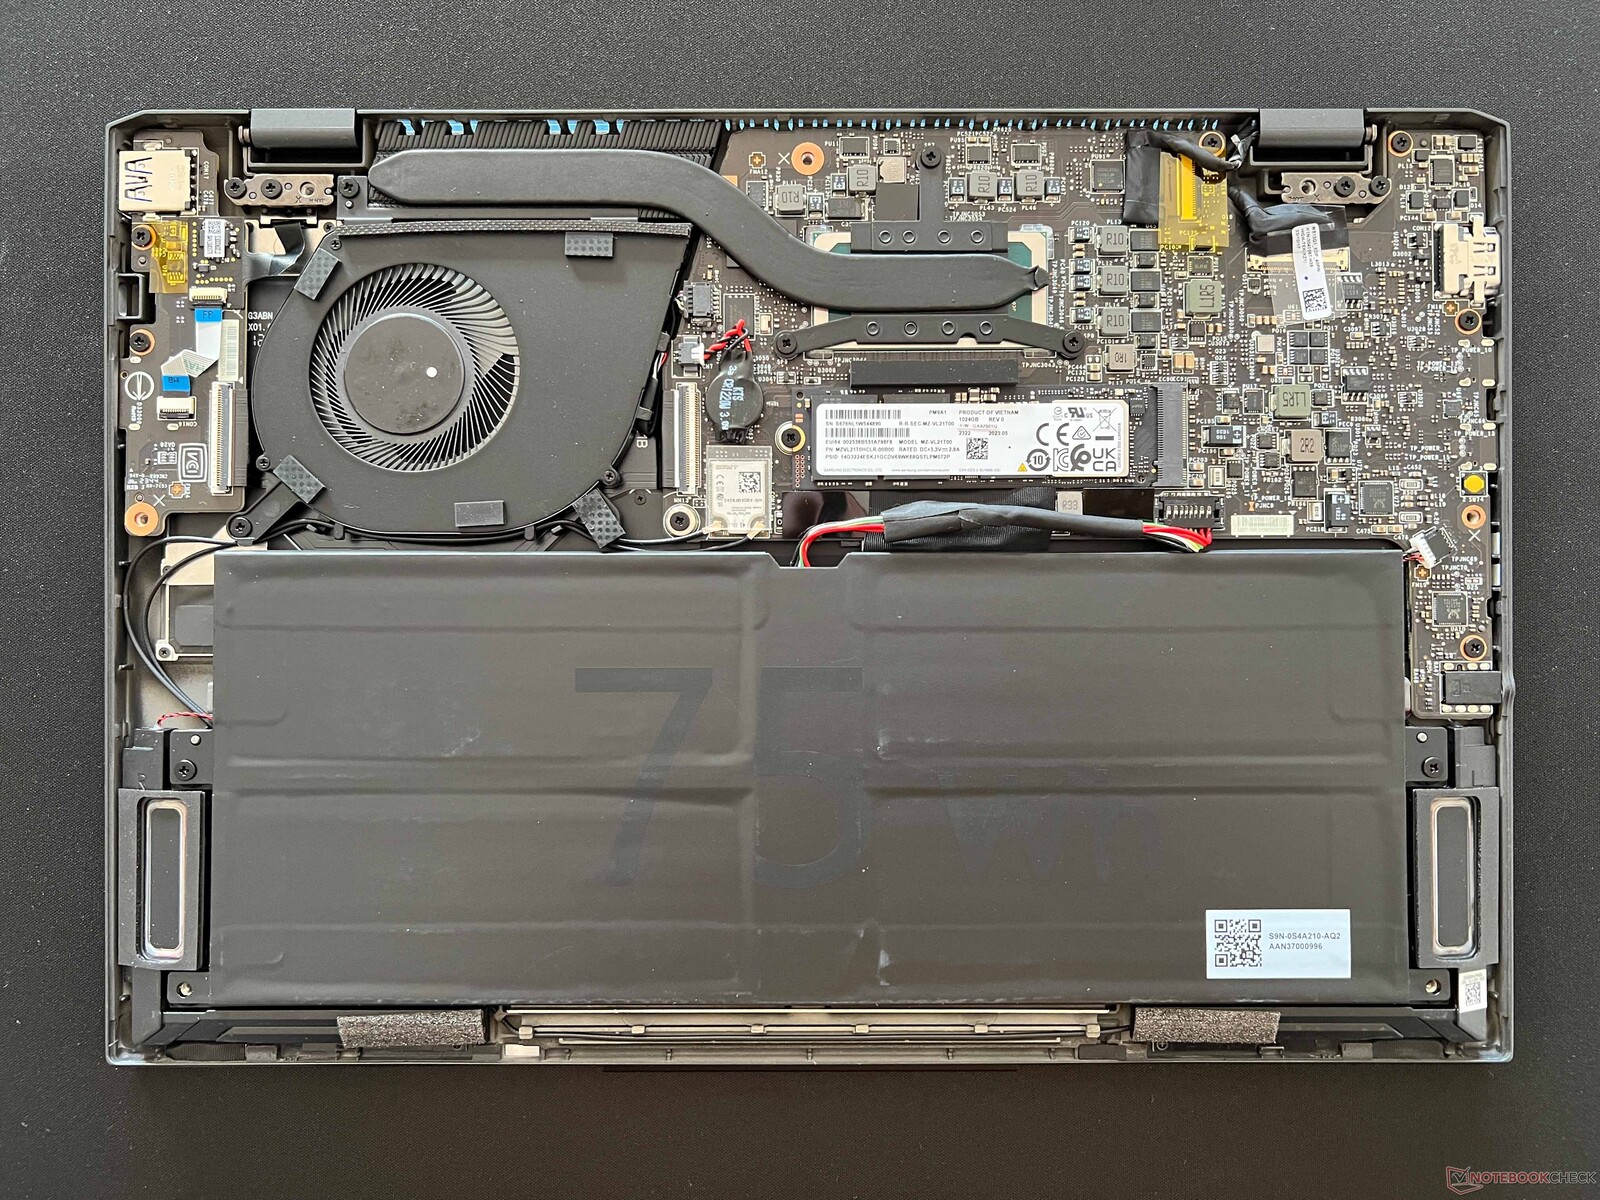
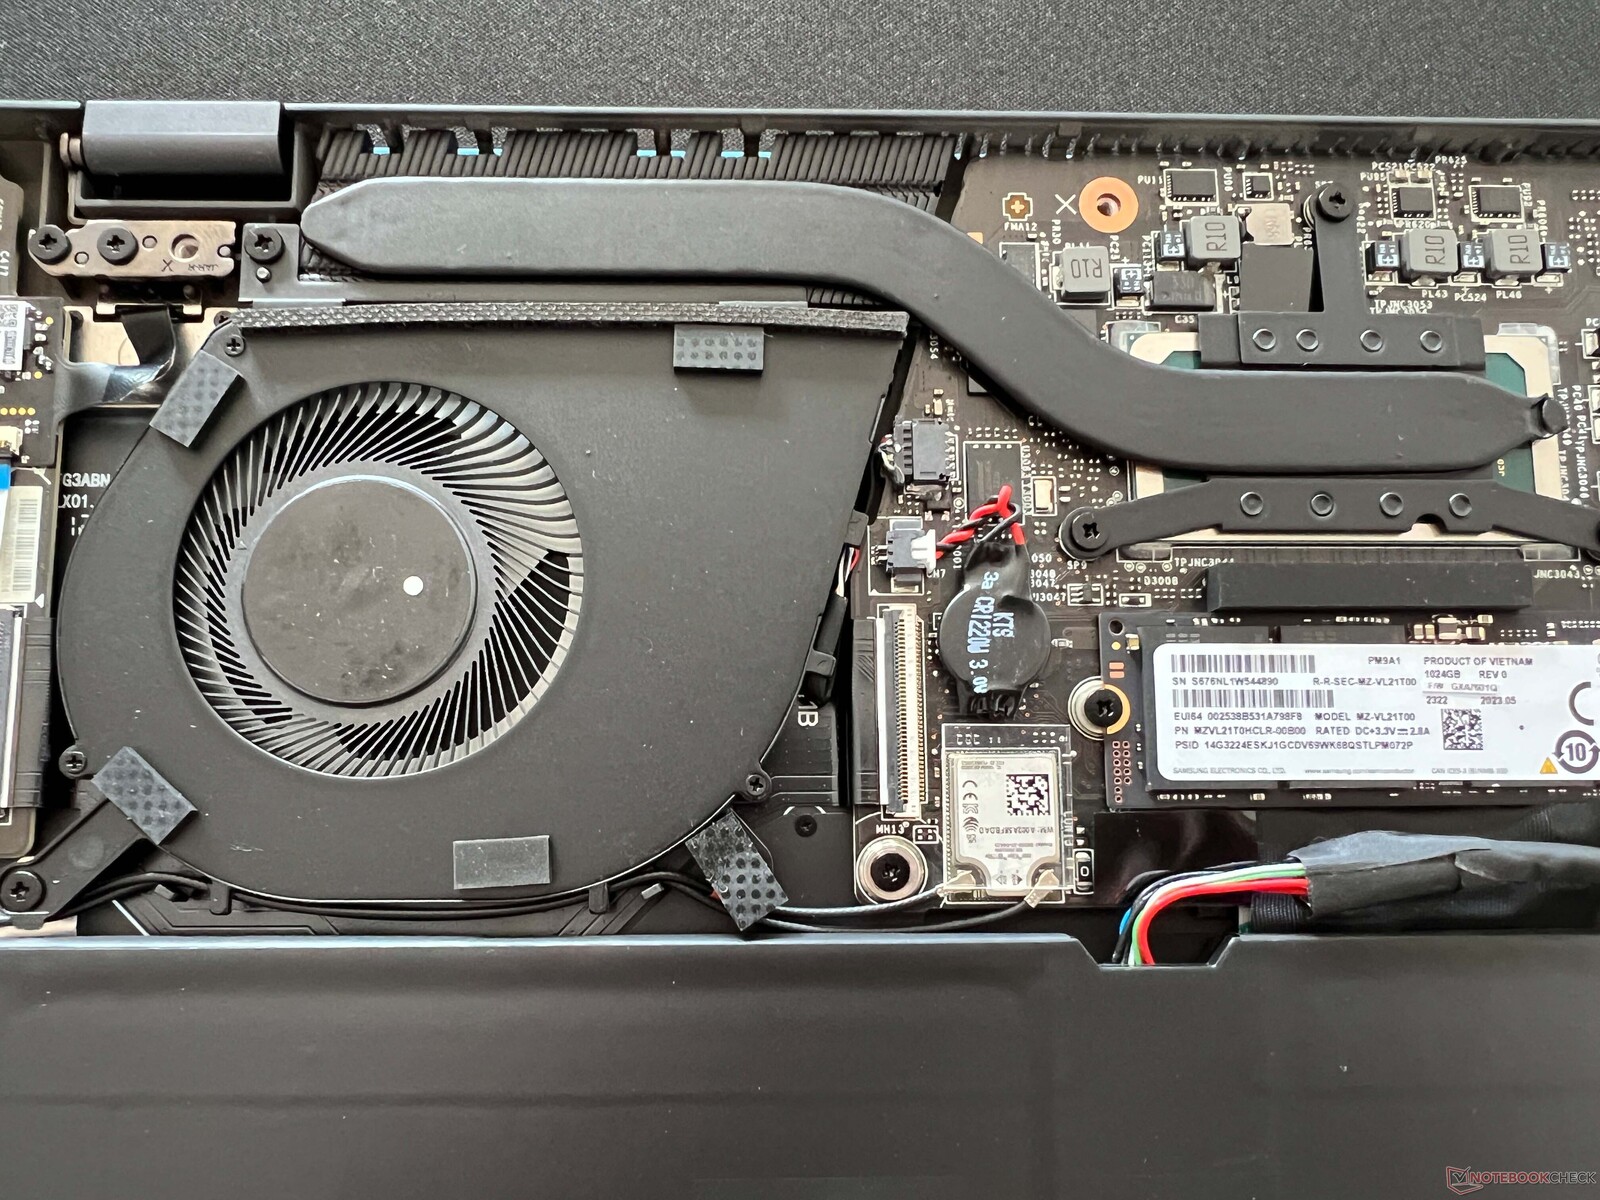
Manutenção
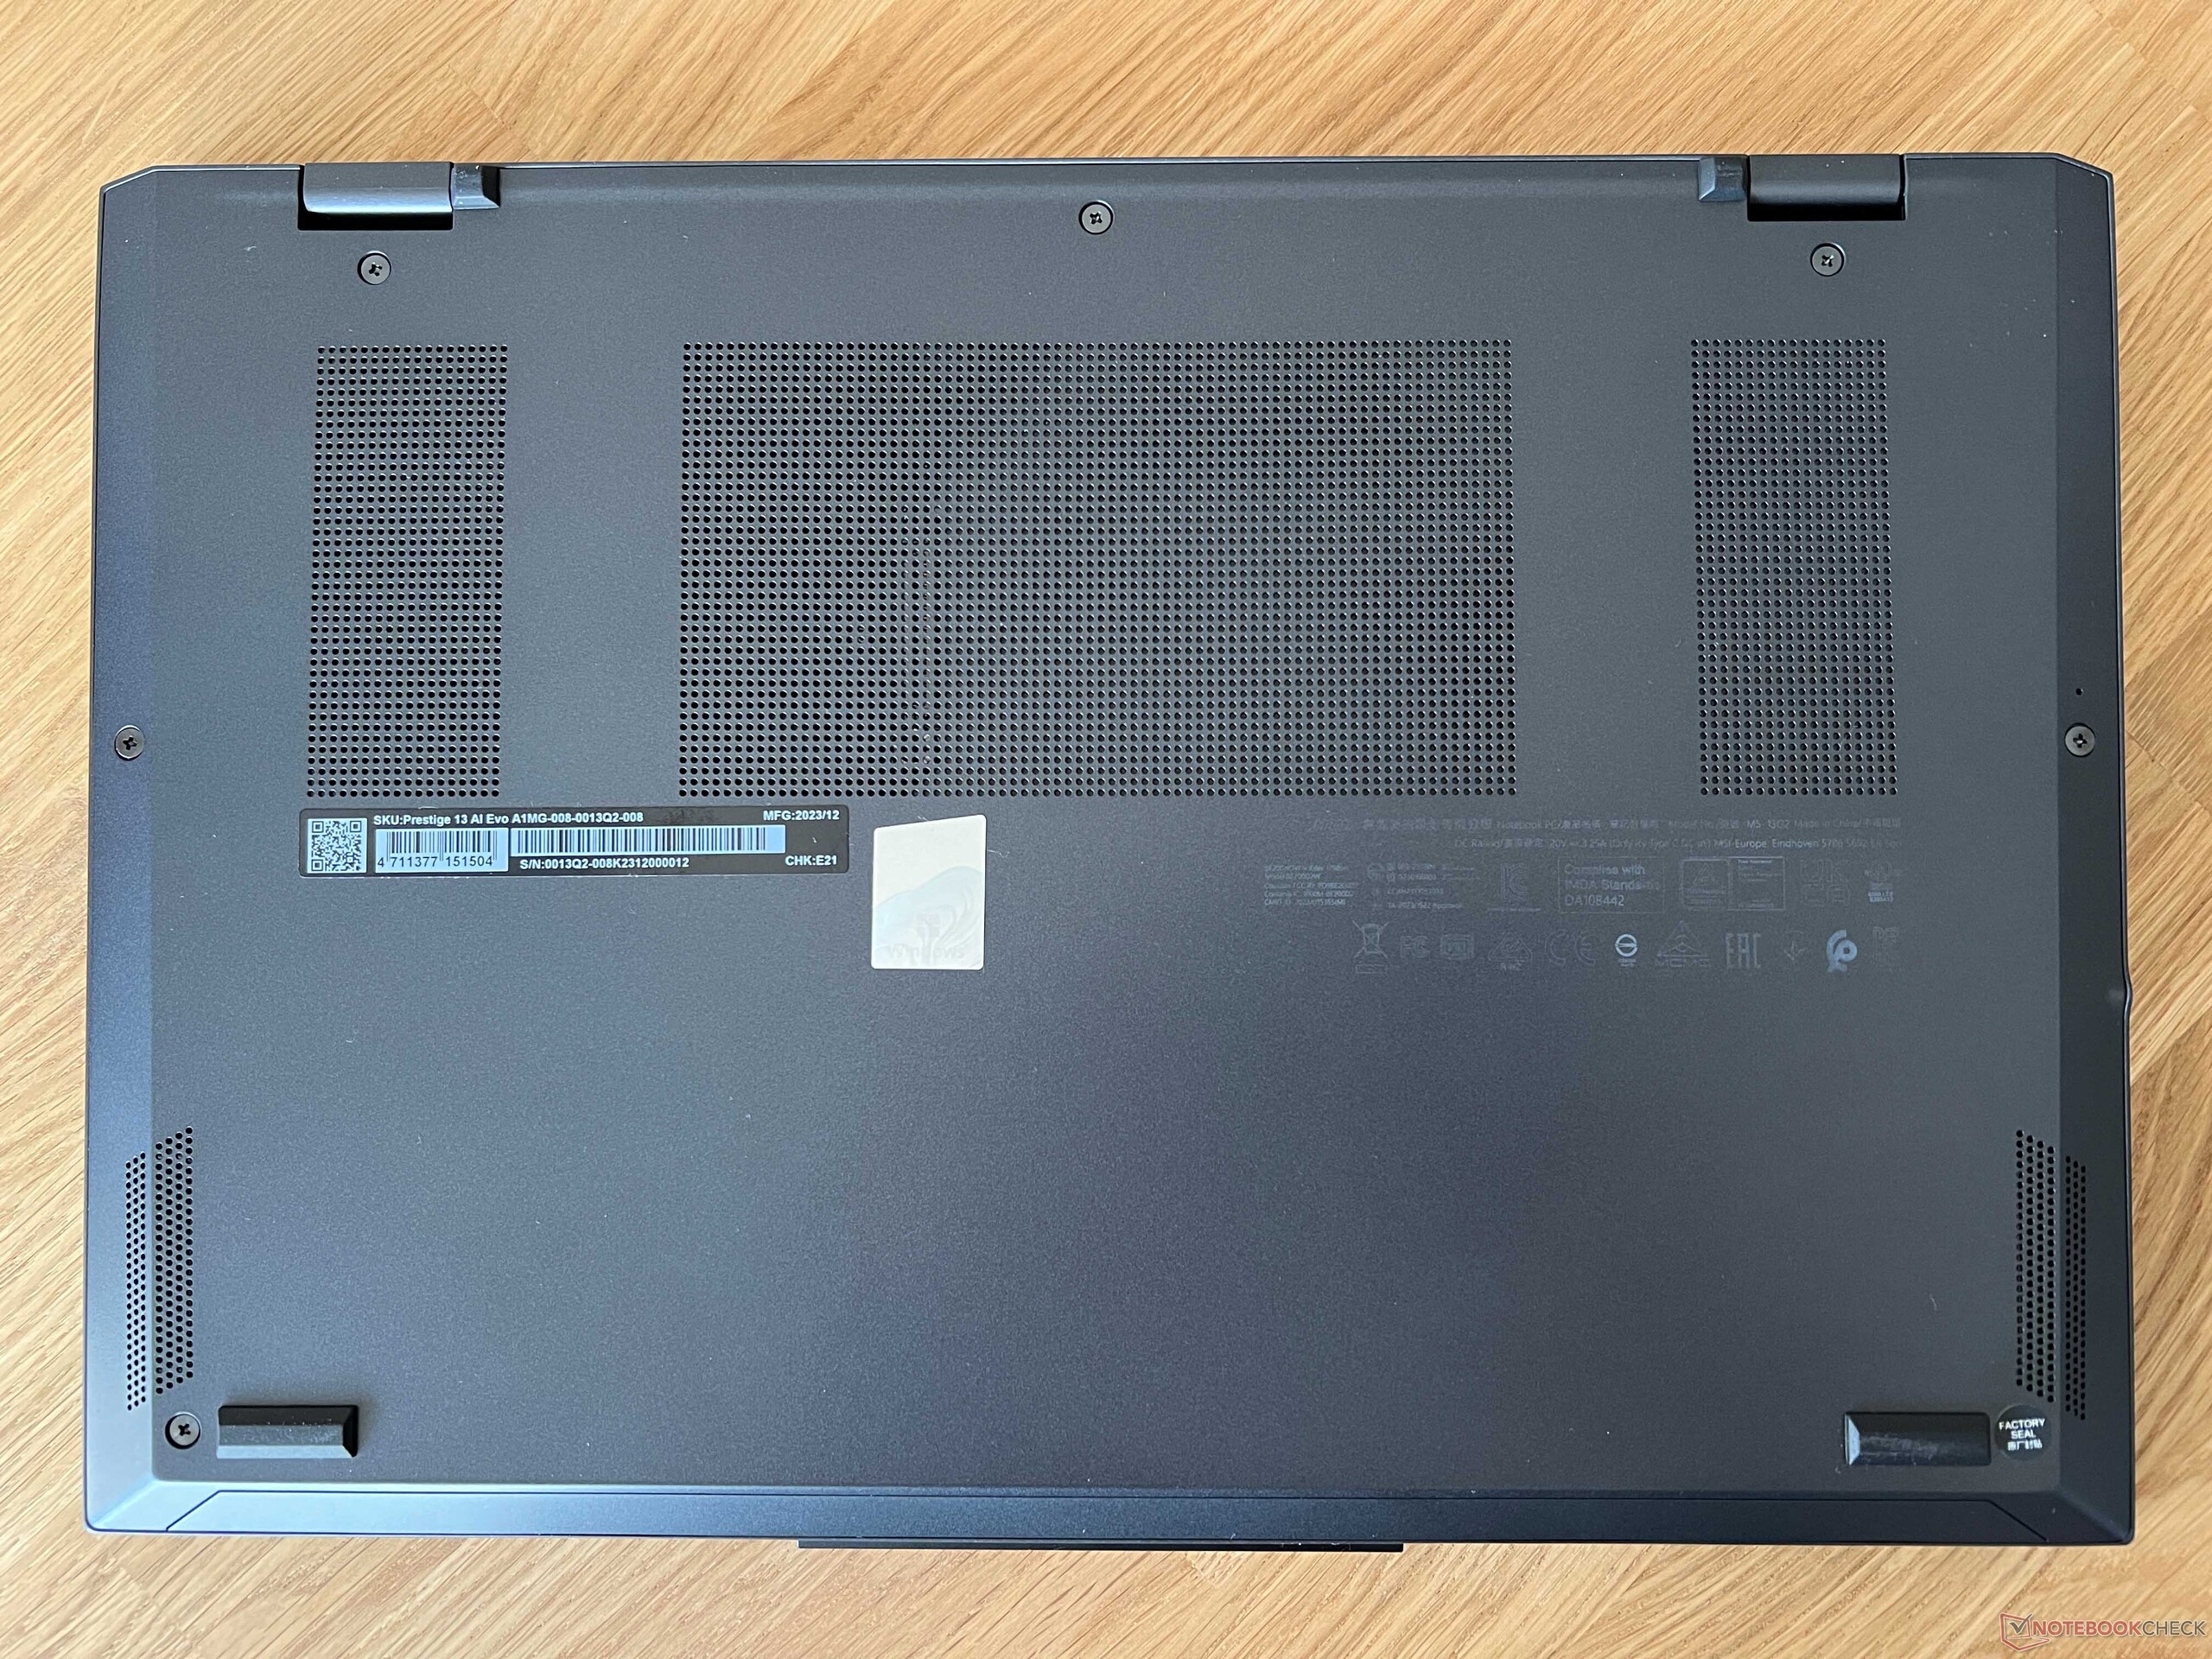
A parte inferior do gabinete é fixada por meio de parafusos de cabeça cruzada comuns e pode ser facilmente removida. A ventoinha pode então ser limpa e o SSD e a bateria podem ser trocados. Todos os outros componentes, por outro lado, são soldados. Isso inclui os módulos de RAM e WLAN.
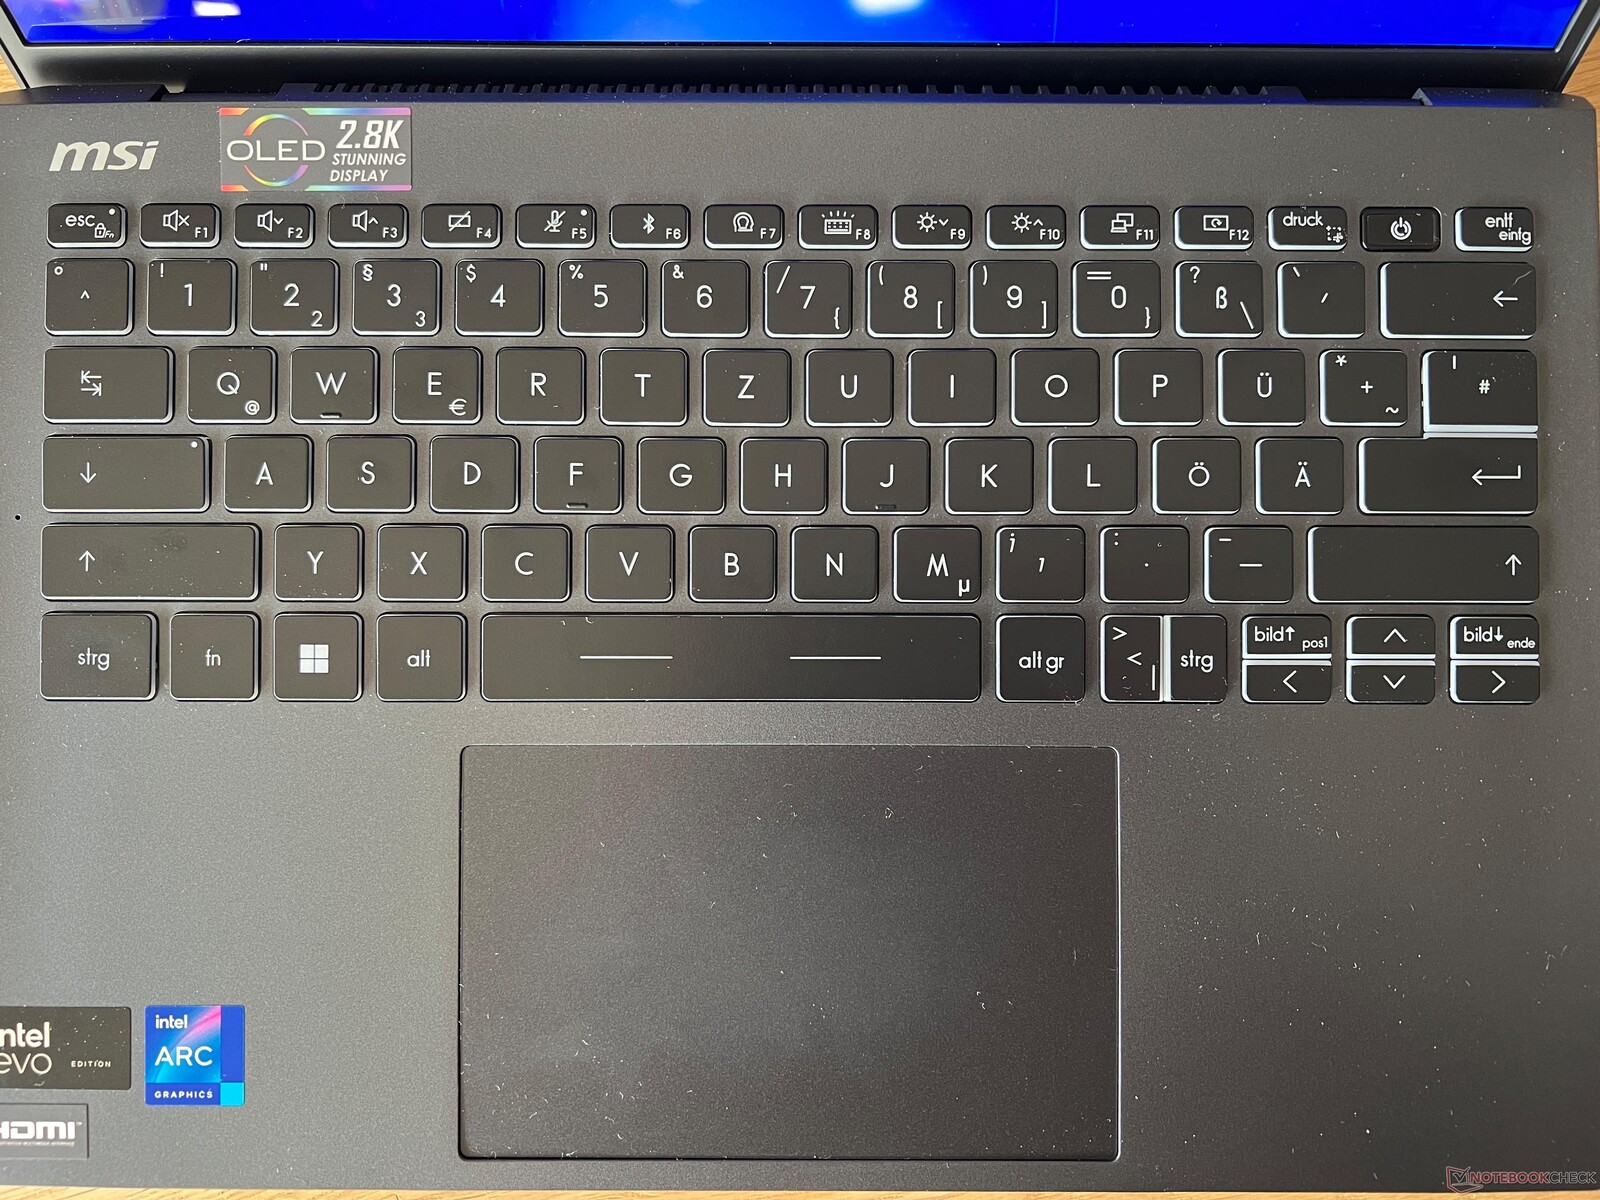
Dispositivos de entrada - Teclado reduzido
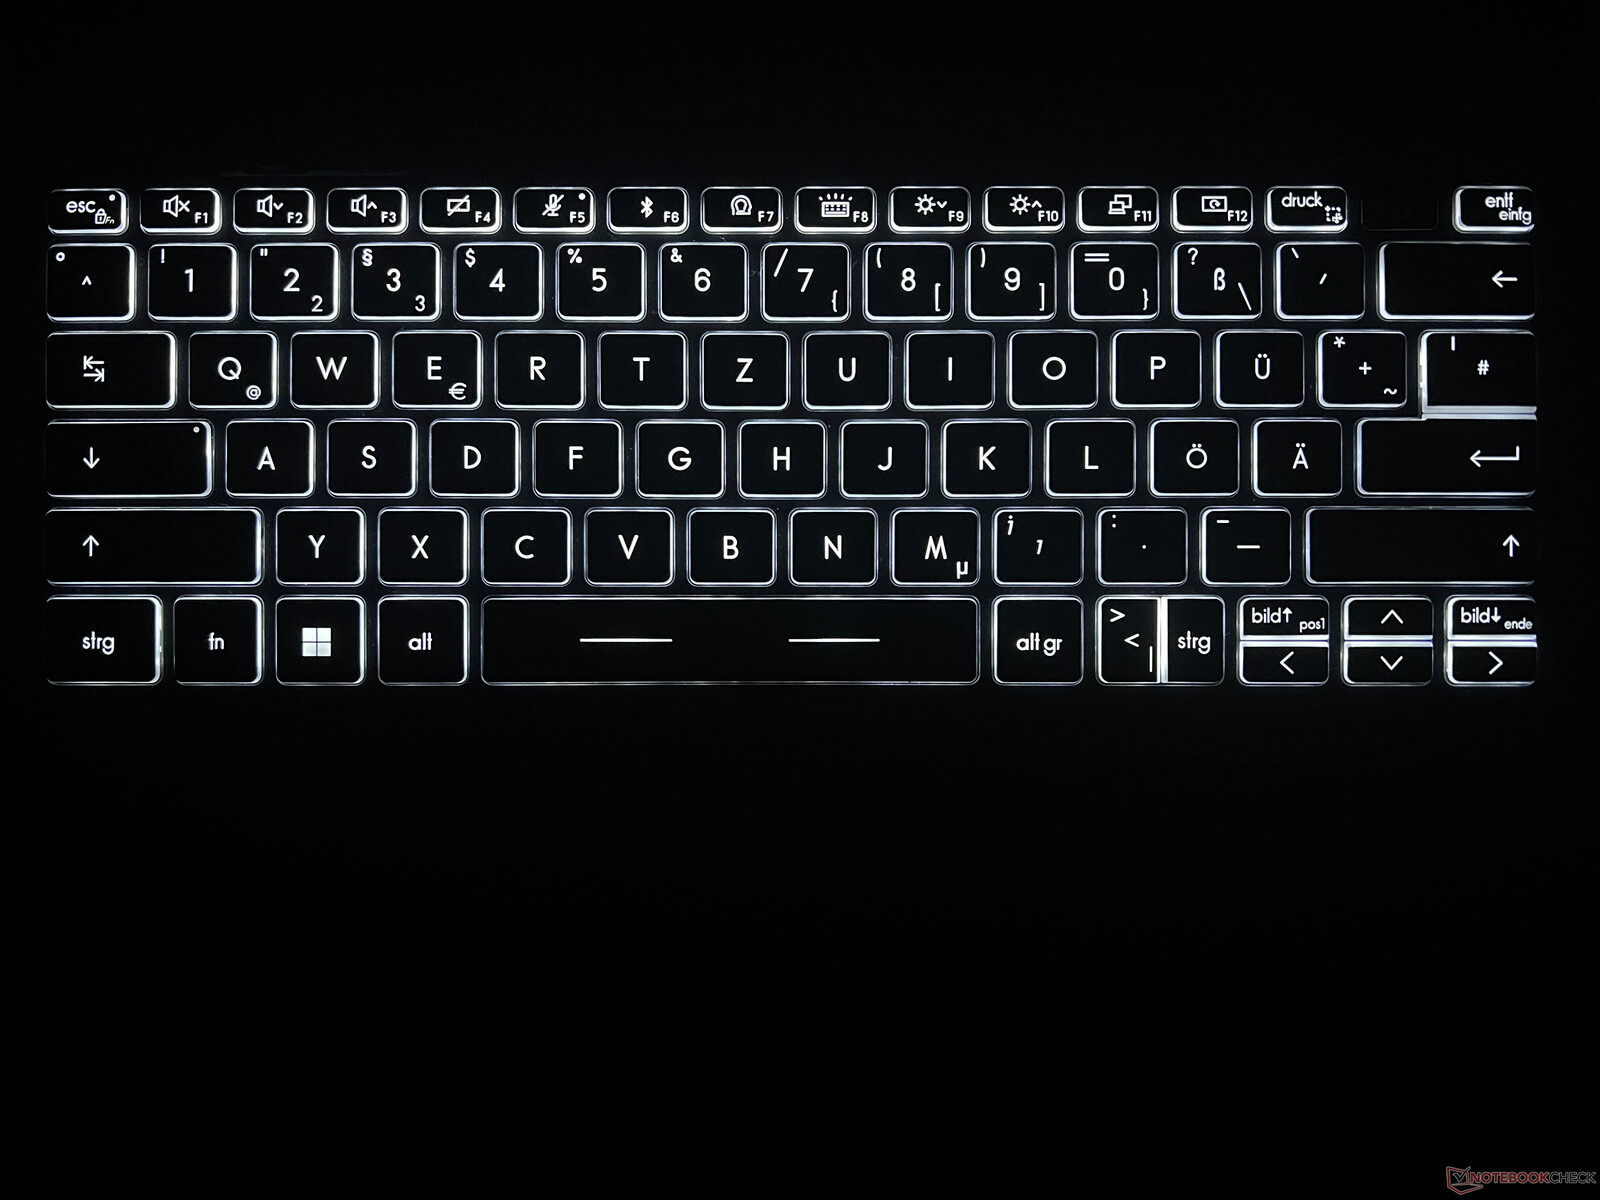
O teclado preto é mediano para digitar. A mecânica em si é precisa, mas as teclas não são muito altas (17 mm de largura, 1,4 mm de altura), o que talvez o senhor tenha que se acostumar no início. Seu layout em geral parece bastante apertado, mas pelo menos a MSI instalou teclas dedicadas de picture-up/picture-down. O botão liga/desliga (que inclui um scanner de impressão digital) está localizado no canto superior direito e fica mais profundo dentro do gabinete, o que significa que o usuário pode senti-lo facilmente. A tecla delete fica na extrema direita. A luz de fundo branca do teclado apresenta três níveis de intensidade.
O clickpad (12 x 7,5 cm) é agradável e suave e não tivemos problemas durante o uso. A metade inferior do teclado pode ser pressionada para baixo e o ruído do clique é muito uniforme. Ele poderia ser um pouco mais silencioso, mas de forma alguma parece barato.
Tela - 2.8K OLED sem toque
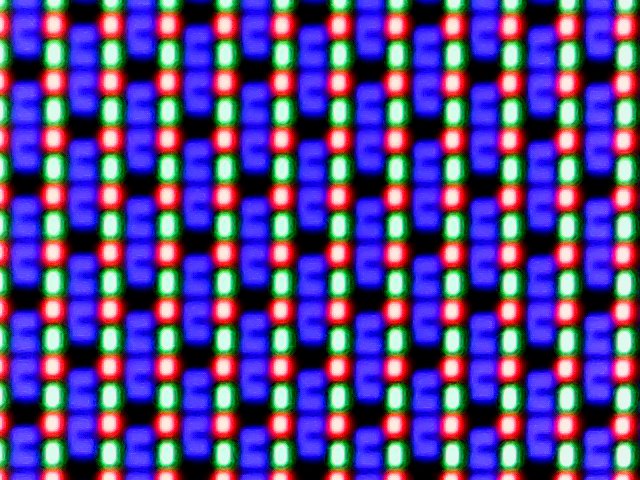
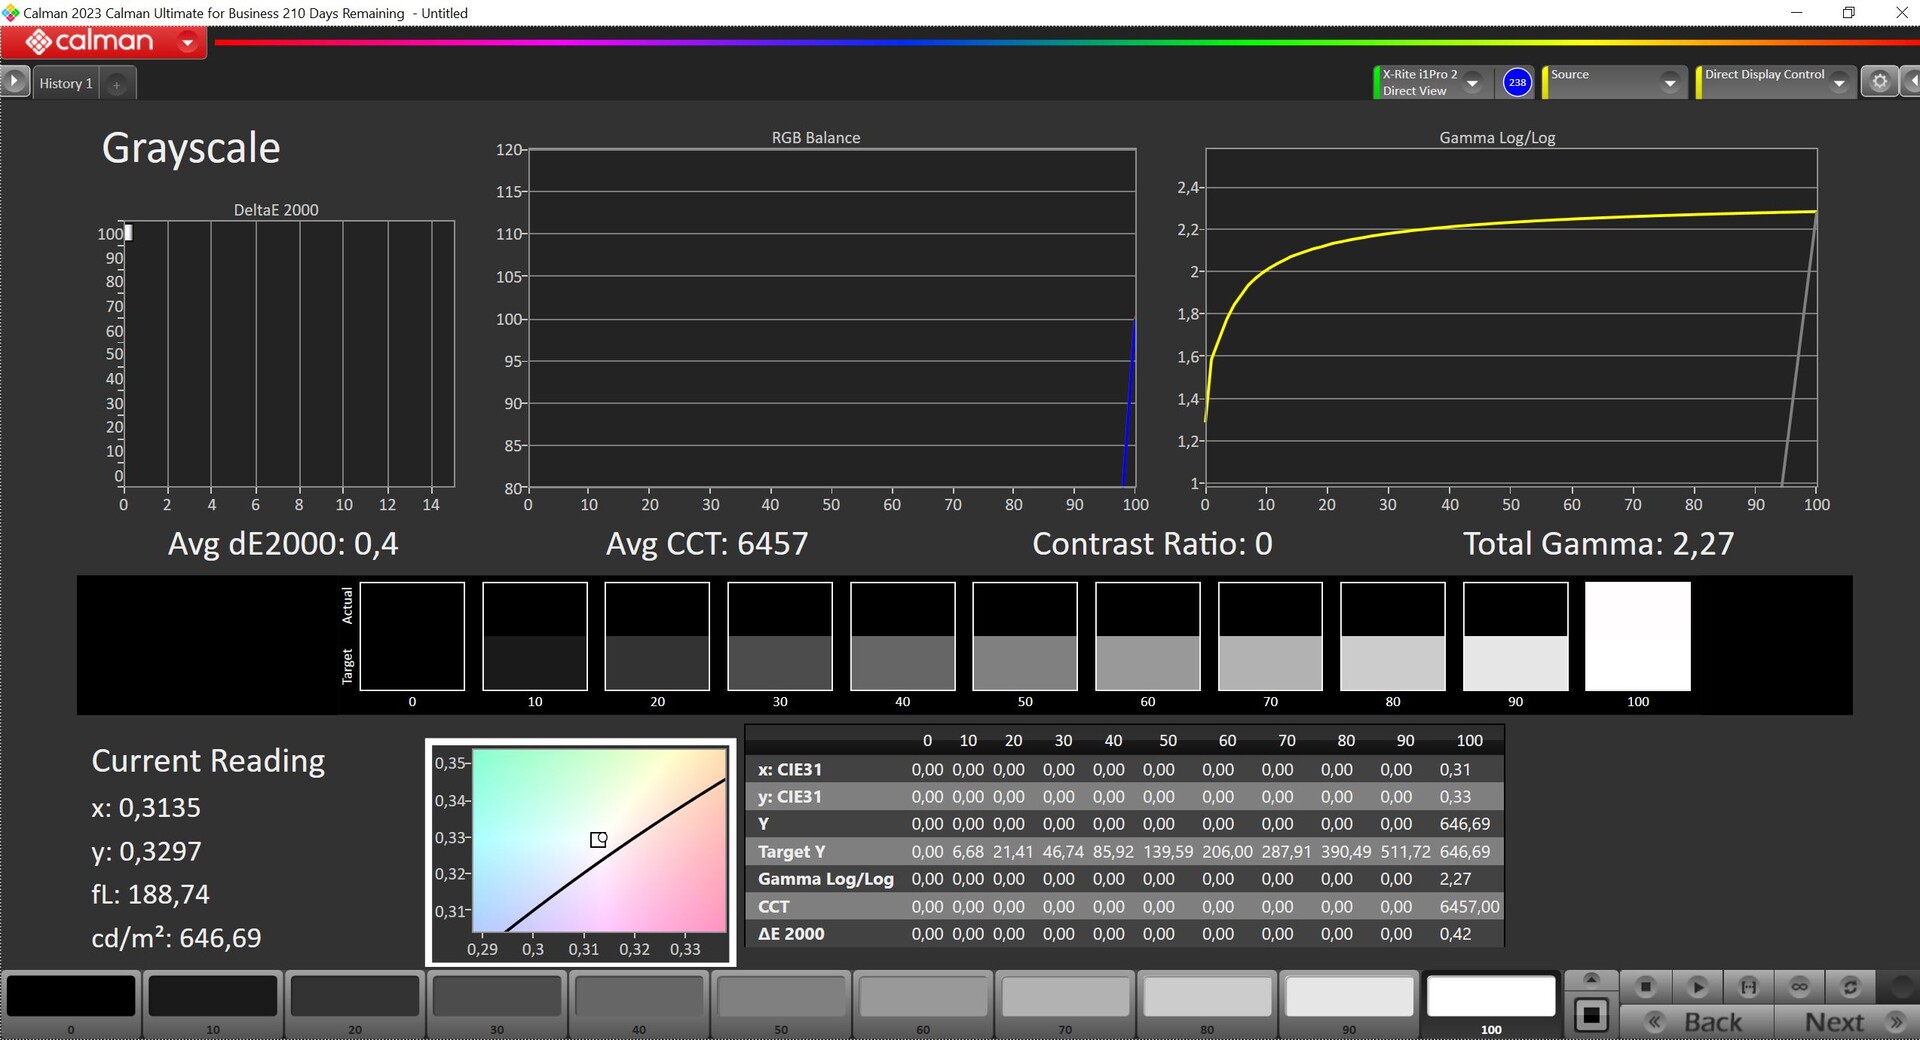
A MSI instalou um painel OLED reflexivo 16:10 de 13,3 polegadas com uma resolução de 2.880 x 1.800 pixels no dispositivo. Subjetivamente, a qualidade da imagem é impressionante e as cores são muito vivas. Além disso, seus tempos de resposta são muito baixos. Seu brilho SDR máximo é de pouco mais de 400 cd/m² e, graças ao seu baixo valor de preto, ele apresenta uma alta taxa de contraste. Isso também contribui para a qualidade de imagem vívida. Não há suporte para entradas de toque, mas o brilho pode ser ajustado automaticamente de acordo com as condições de iluminação do ambiente.
Em uso HDR, seu brilho HDR máximo aumenta para até 647 cd/m² ao representar pequenos trechos de imagem e um pouco mais de 500 cd/m² ao representar quase todo o branco. Como também acontece em todos os outros notebooks com Windows, o senhor precisa primeiro ativar o modo HDR manualmente para impedir que o gerenciamento de cores não funcione corretamente.
| |||||||||||||||||||||||||
iluminação: 98 %
iluminação com acumulador: 405 cd/m²
Contraste: ∞:1 (Preto: 0 cd/m²)
ΔE ColorChecker Calman: 2.1 | ∀{0.5-29.43 Ø4.72}
ΔE Greyscale Calman: 1.2 | ∀{0.09-98 Ø4.97}
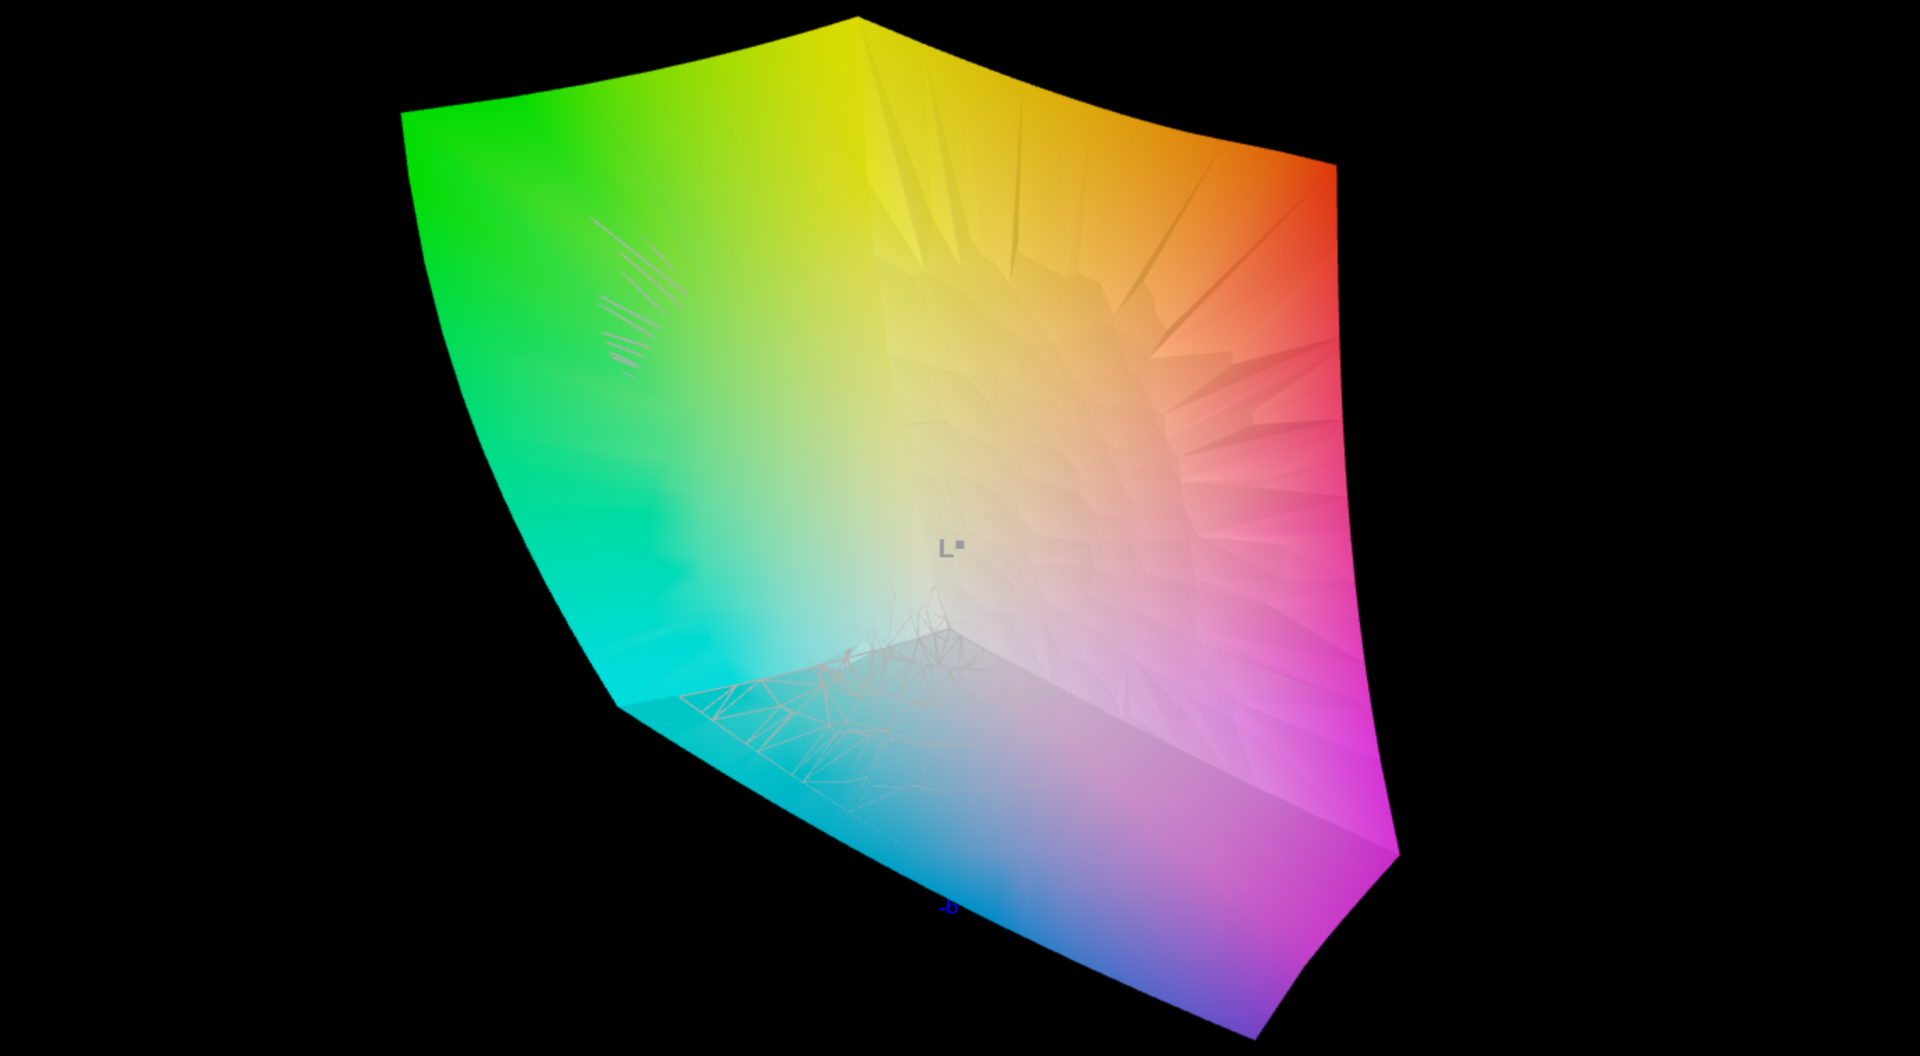
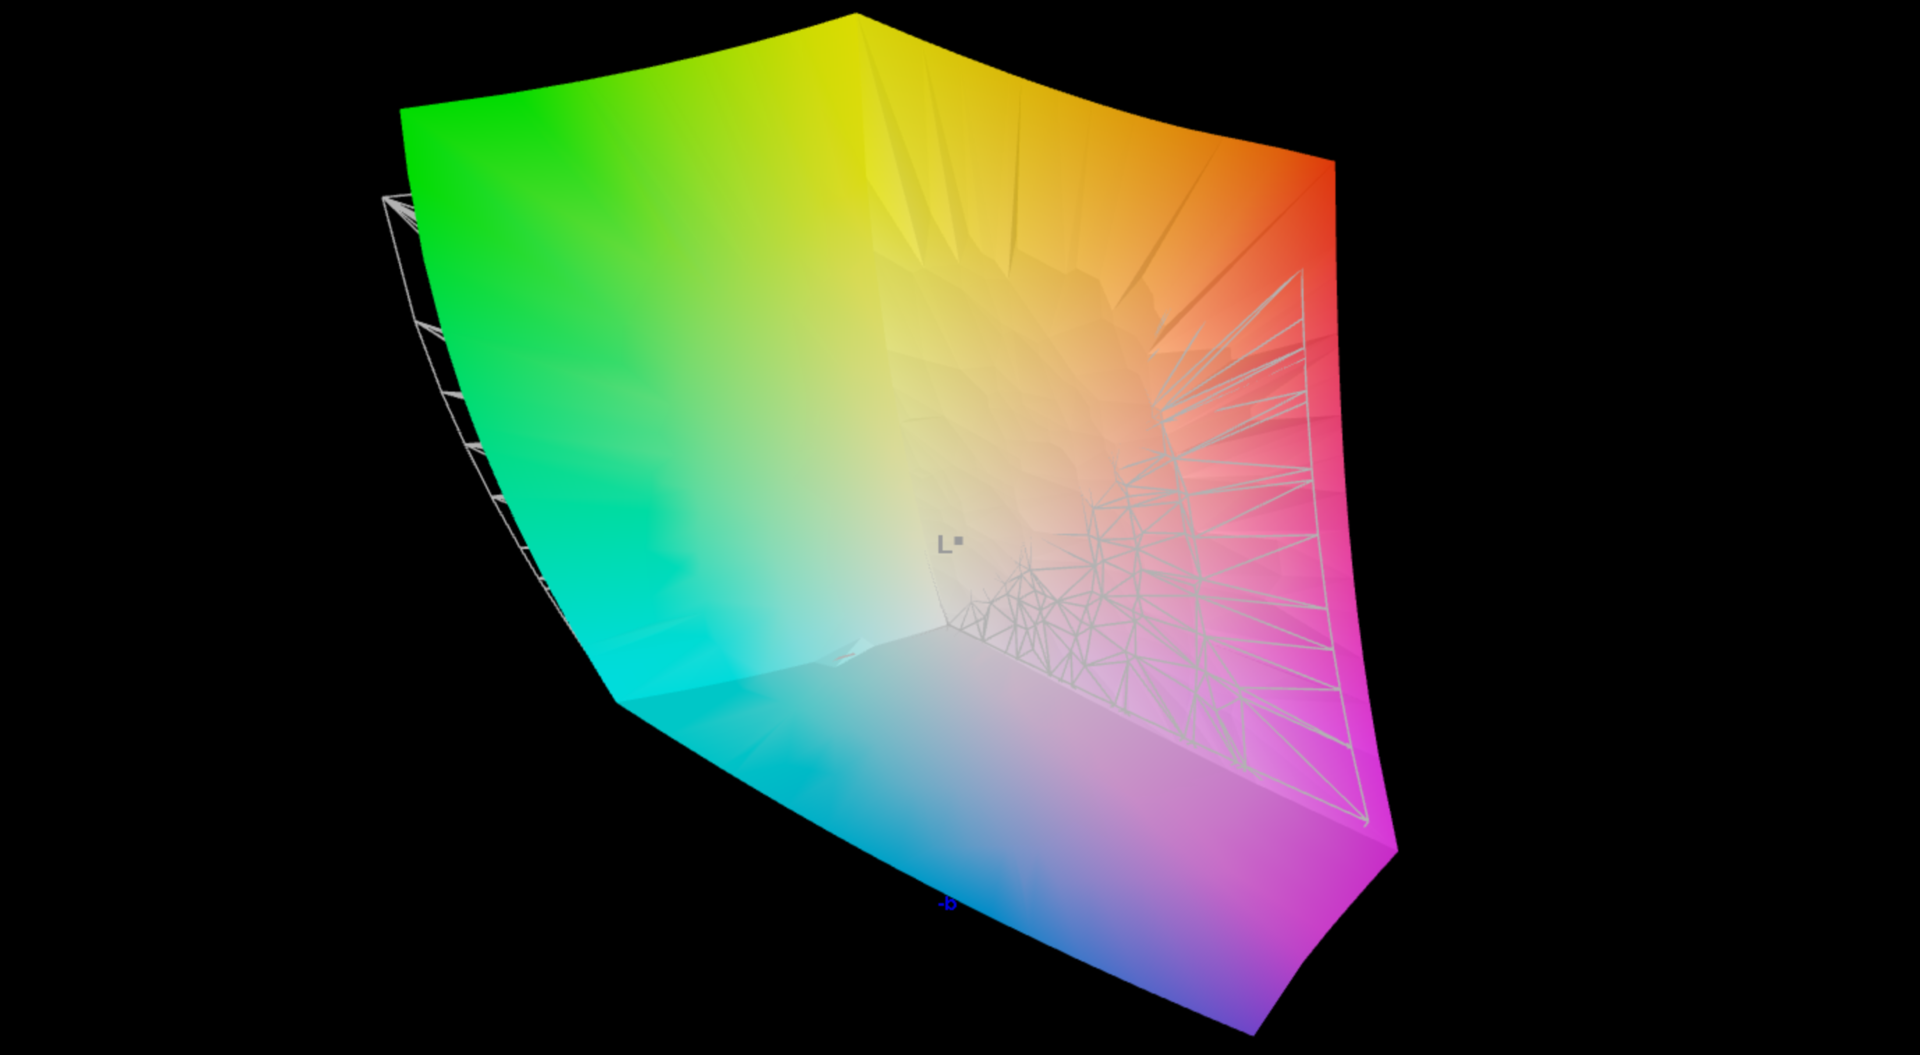
97.8% AdobeRGB 1998 (Argyll 3D)
100% sRGB (Argyll 3D)
99.9% Display P3 (Argyll 3D)
Gamma: 2.16
CCT: 6465 K
| MSI Prestige 13 AI Evo ATNA33AA07-0, OLED, 2880x1800, 13.3" | Lenovo ThinkPad X1 Nano Gen 3 MND007ZA1-3, IPS, 2160x1350, 13" | Dell Latitude 13 7340 i5-1345U Chi Mei 133JCG, IPS, 1920x1200, 13.3" | HP Dragonfly G4 Chi Mei CMN13C0, IPS, 1920x1280, 13.5" | Asus ZenBook S13 OLED UX5304 SDC417B, OLED, 2880x1800, 13.3" | |
|---|---|---|---|---|---|
| Display | -20% | -23% | -21% | -0% | |
| Display P3 Coverage (%) | 99.9 | 68.5 -31% | 65.9 -34% | 68.4 -32% | 99.7 0% |
| sRGB Coverage (%) | 100 | 99.5 0% | 96.8 -3% | 98.3 -2% | 100 0% |
| AdobeRGB 1998 Coverage (%) | 97.8 | 69.7 -29% | 67.8 -31% | 70.4 -28% | 96.9 -1% |
| Response Times | -2092% | -2565% | -2572% | -21% | |
| Response Time Grey 50% / Grey 80% * (ms) | 1.54 ? | 39.9 ? -2491% | 51 ? -3212% | 48.8 ? -3069% | 2 ? -30% |
| Response Time Black / White * (ms) | 1.44 ? | 25.8 ? -1692% | 29.04 ? -1917% | 31.3 ? -2074% | 1.6 ? -11% |
| PWM Frequency (Hz) | 240 ? | 240 ? | |||
| Screen | -1% | -65% | -14% | 13% | |
| Brightness middle (cd/m²) | 404 | 461.2 14% | 471 17% | 408.8 1% | 361 -11% |
| Brightness (cd/m²) | 407 | 428 5% | 437 7% | 399 -2% | 365 -10% |
| Brightness Distribution (%) | 98 | 86 -12% | 87 -11% | 90 -8% | 98 0% |
| Black Level * (cd/m²) | 0.29 | 0.2033 | 0.32 | ||
| Colorchecker dE 2000 * | 2.1 | 1.79 15% | 3.24 -54% | 2.02 4% | 1.2 43% |
| Colorchecker dE 2000 max. * | 4.3 | 3.3 23% | 7.19 -67% | 3.84 11% | 1.9 56% |
| Greyscale dE 2000 * | 1.2 | 1.8 -50% | 4.6 -283% | 2.3 -92% | 1.2 -0% |
| Gamma | 2.16 102% | 2.24 98% | 2.2 100% | 2.27 97% | |
| CCT | 6465 101% | 6588 99% | 6520 100% | 6203 105% | 6486 100% |
| Contrast (:1) | 1590 | 2317 | 1278 | ||
| Colorchecker dE 2000 calibrated * | 0.47 | 1.08 | 0.61 | ||
| Média Total (Programa/Configurações) | -704% /
-386% | -884% /
-508% | -869% /
-481% | -3% /
3% |
* ... menor é melhor
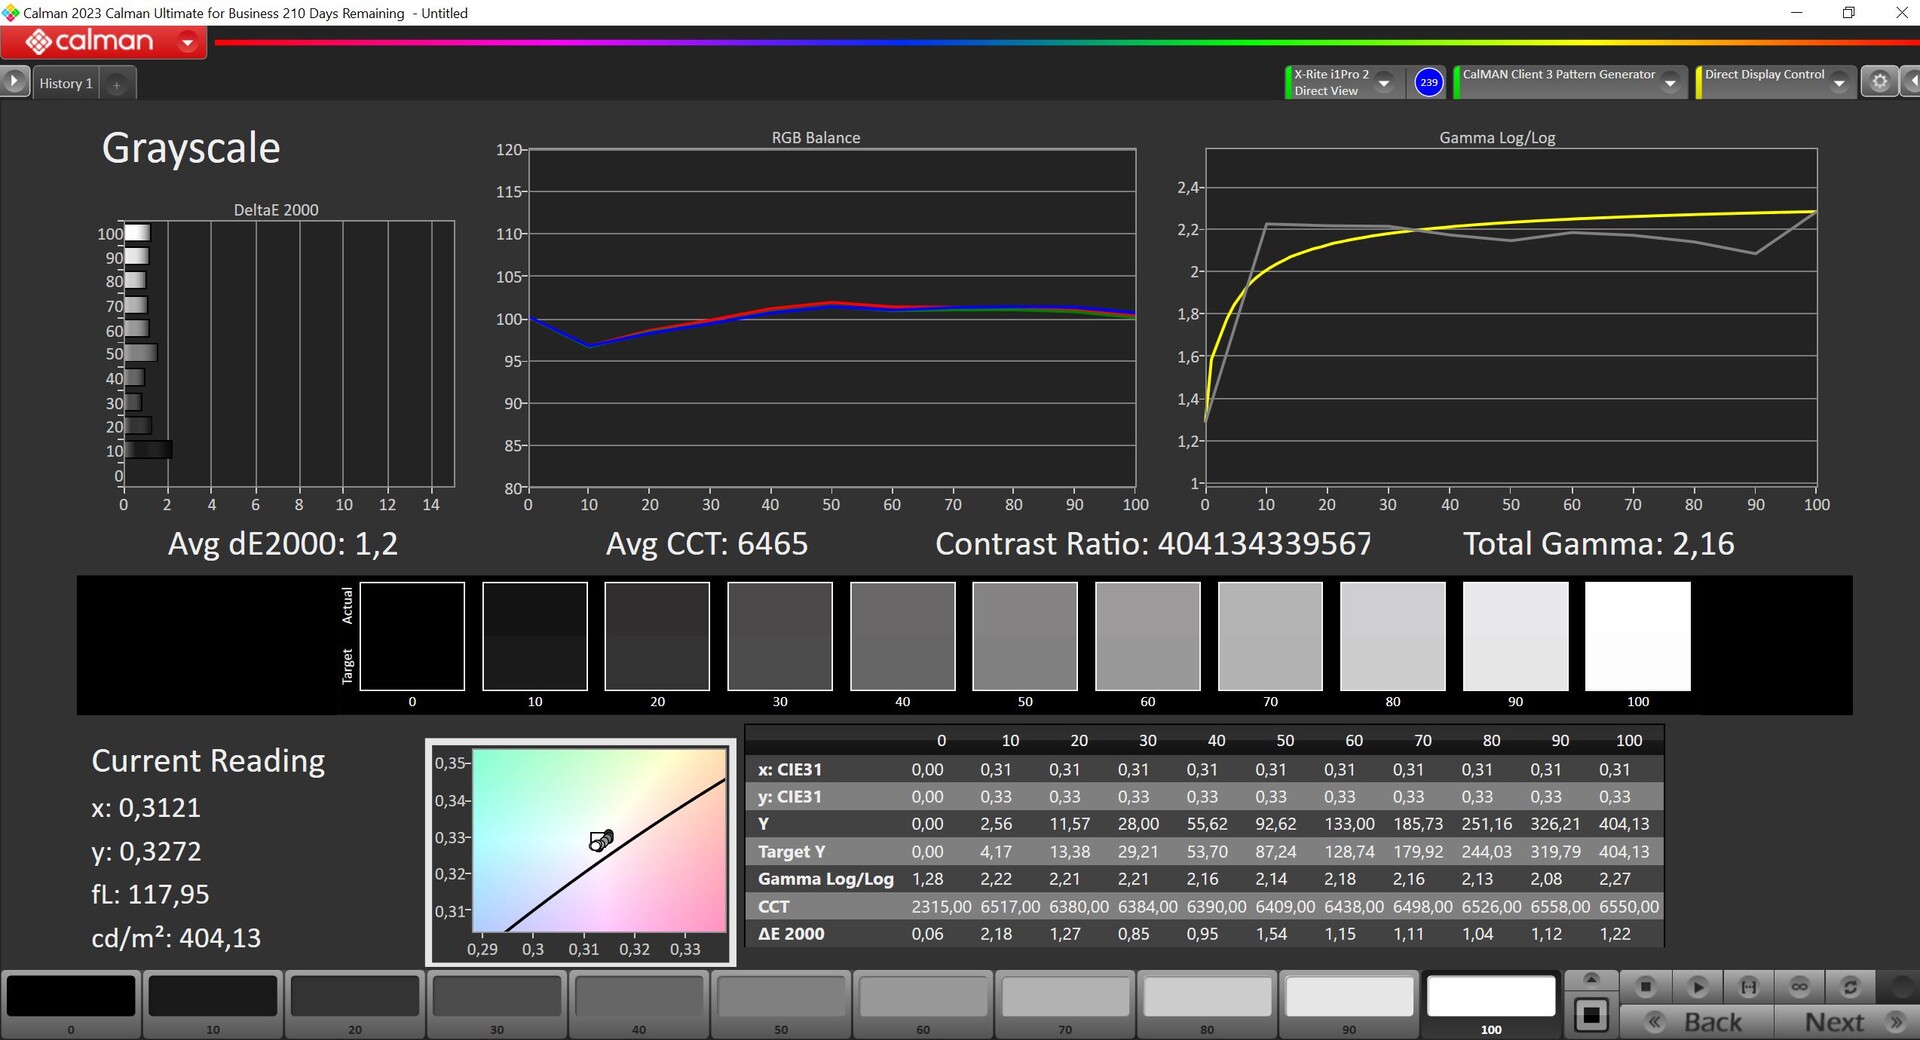
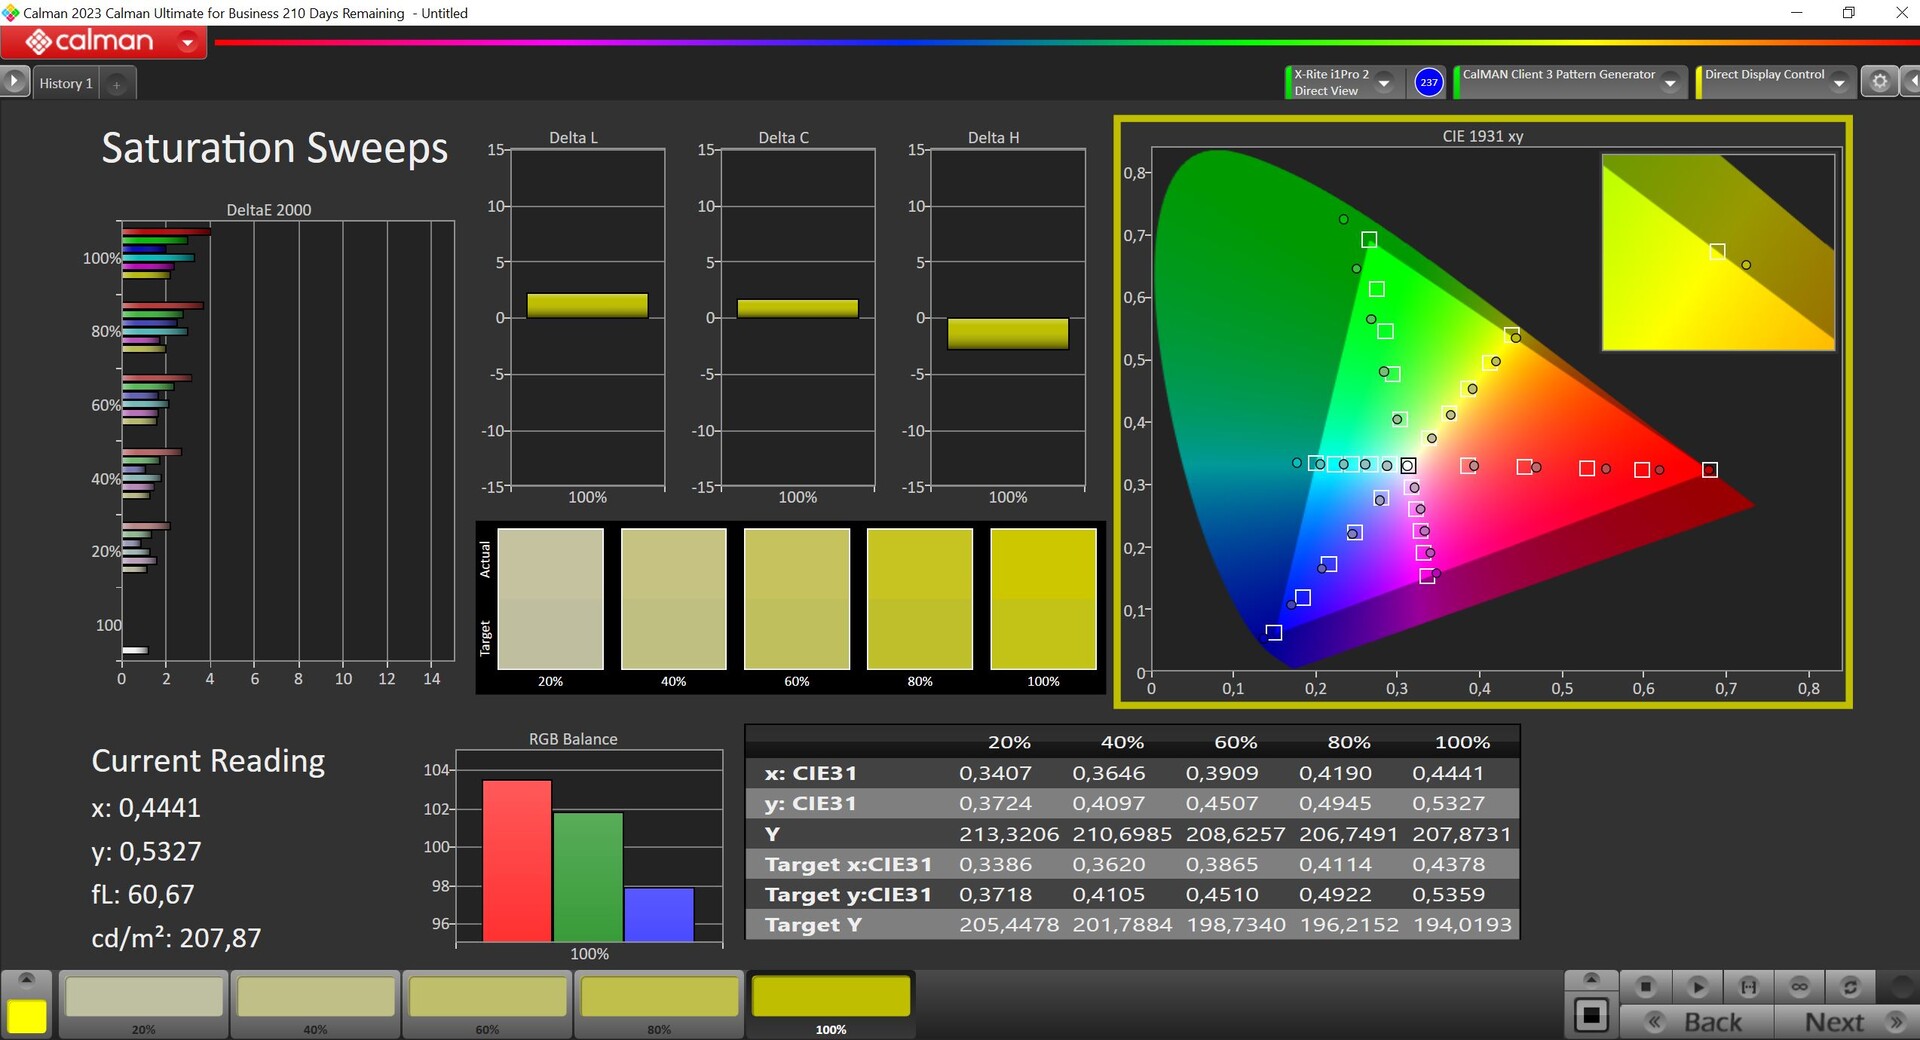
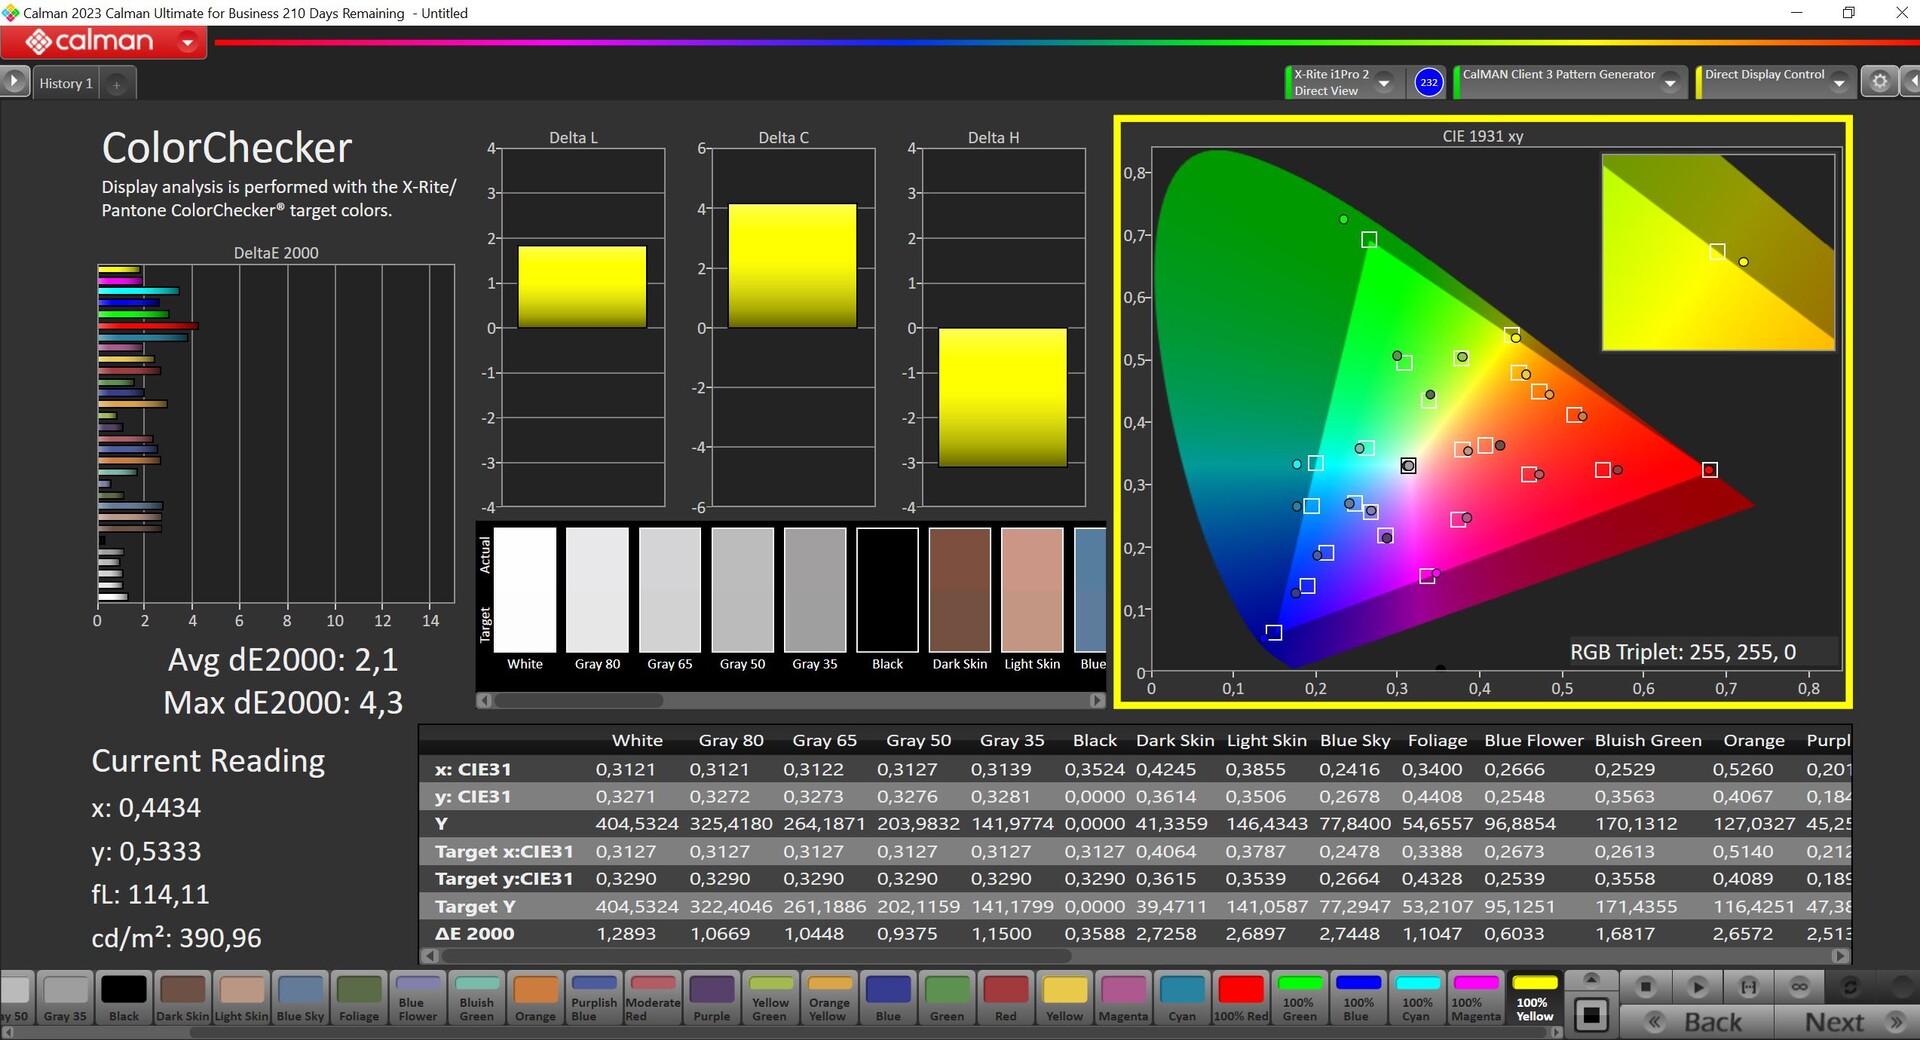
Analisamos o painel usando o software profissional CalMAN (X-Rite i1 Pro2) e, logo de cara, ele apresentou uma boa representação. Não notamos nenhuma tonalidade de cor e sua temperatura de cor também era precisa - apenas algumas cores (100%) estavam acima do importante desvio DeltaE-2000 de 3 (em comparação com a referência P3). Não foi possível corrigir isso por meio da calibração, além disso, a MSI não oferece um perfil sRGB. Como resultado, o Prestige 13 não é o mais adequado para edição de imagens.

Exibir tempos de resposta
| ↔ Tempo de resposta preto para branco | ||
|---|---|---|
| 1.44 ms ... ascensão ↗ e queda ↘ combinadas | ↗ 0.73 ms ascensão | 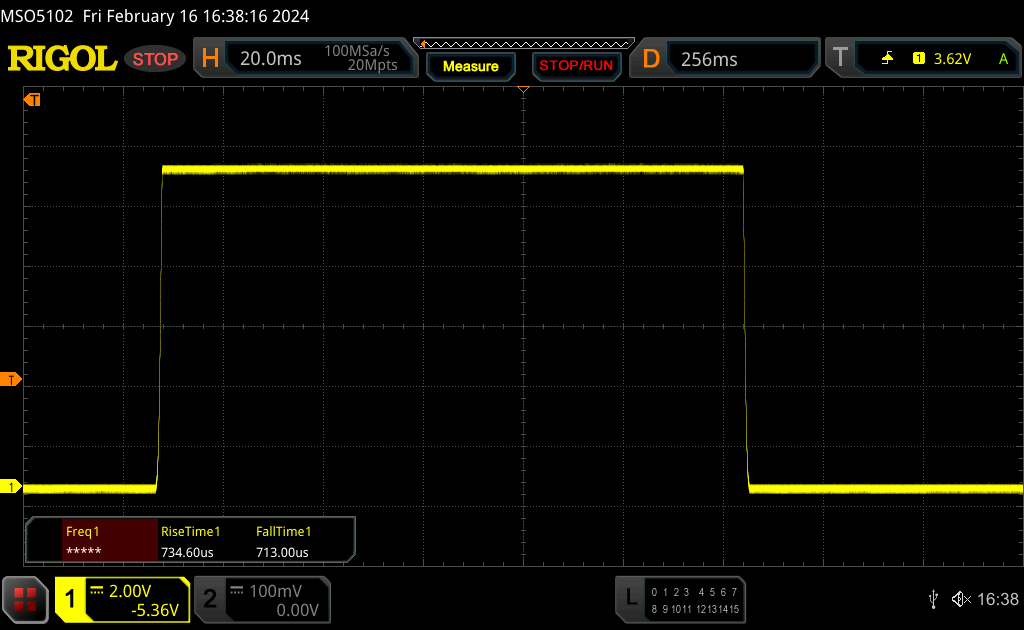 |
| ↘ 0.71 ms queda | ||
| A tela mostra taxas de resposta muito rápidas em nossos testes e deve ser muito adequada para jogos em ritmo acelerado. Em comparação, todos os dispositivos testados variam de 0.1 (mínimo) a 240 (máximo) ms. » 9 % de todos os dispositivos são melhores. Isso significa que o tempo de resposta medido é melhor que a média de todos os dispositivos testados (19.8 ms). | ||
| ↔ Tempo de resposta 50% cinza a 80% cinza | ||
| 1.54 ms ... ascensão ↗ e queda ↘ combinadas | ↗ 0.79 ms ascensão | 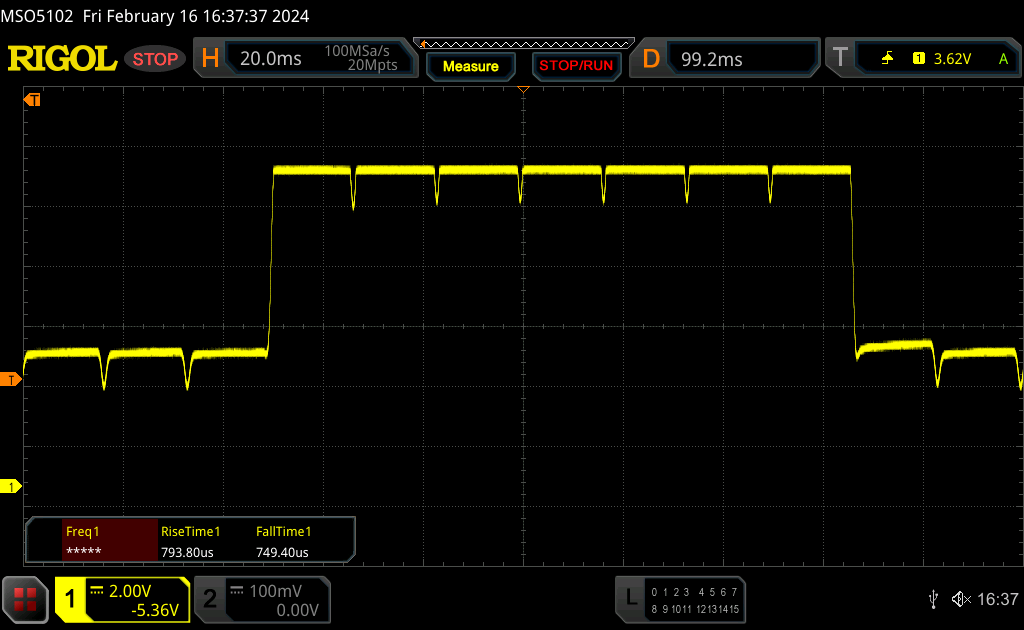 |
| ↘ 0.75 ms queda | ||
| A tela mostra taxas de resposta muito rápidas em nossos testes e deve ser muito adequada para jogos em ritmo acelerado. Em comparação, todos os dispositivos testados variam de 0.165 (mínimo) a 636 (máximo) ms. » 8 % de todos os dispositivos são melhores. Isso significa que o tempo de resposta medido é melhor que a média de todos os dispositivos testados (31 ms). | ||
Cintilação da tela / PWM (modulação por largura de pulso)
| Tela tremeluzindo/PWM detectado | 240 Hz | ≤ 42 % configuração de brilho | 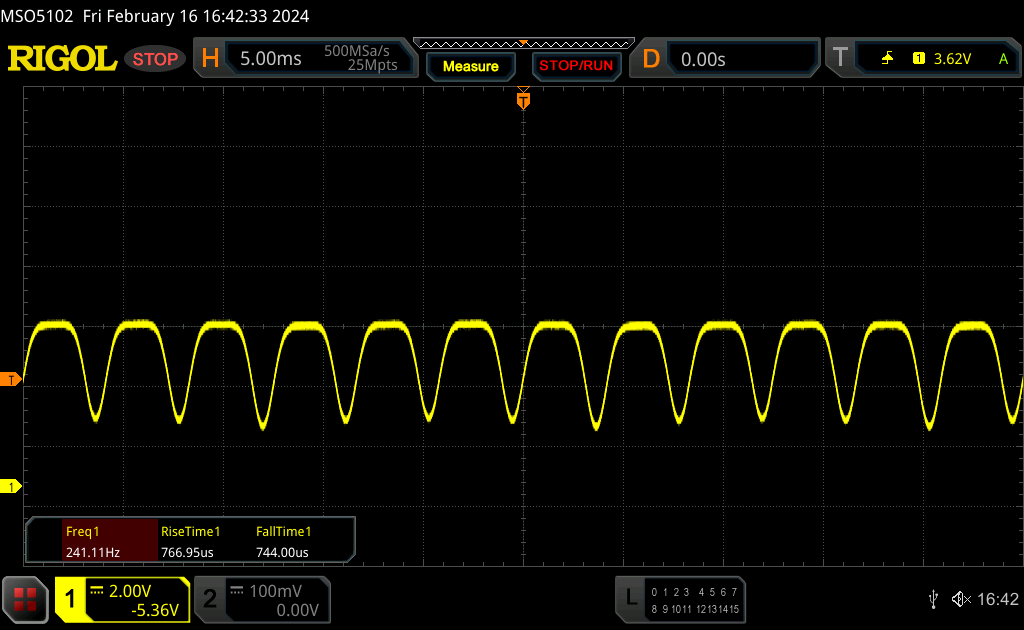 |
A luz de fundo da tela pisca em 240 Hz (pior caso, por exemplo, utilizando PWM) Cintilação detectada em uma configuração de brilho de 42 % e abaixo. Não deve haver cintilação ou PWM acima desta configuração de brilho. A frequência de 240 Hz é relativamente baixa, portanto, usuários sensíveis provavelmente notarão cintilação e sentirão fadiga ocular na configuração de brilho indicada e abaixo. [pwm_comparison] Em comparação: 52 % de todos os dispositivos testados não usam PWM para escurecer a tela. Se PWM foi detectado, uma média de 7747 (mínimo: 5 - máximo: 343500) Hz foi medida. | |||
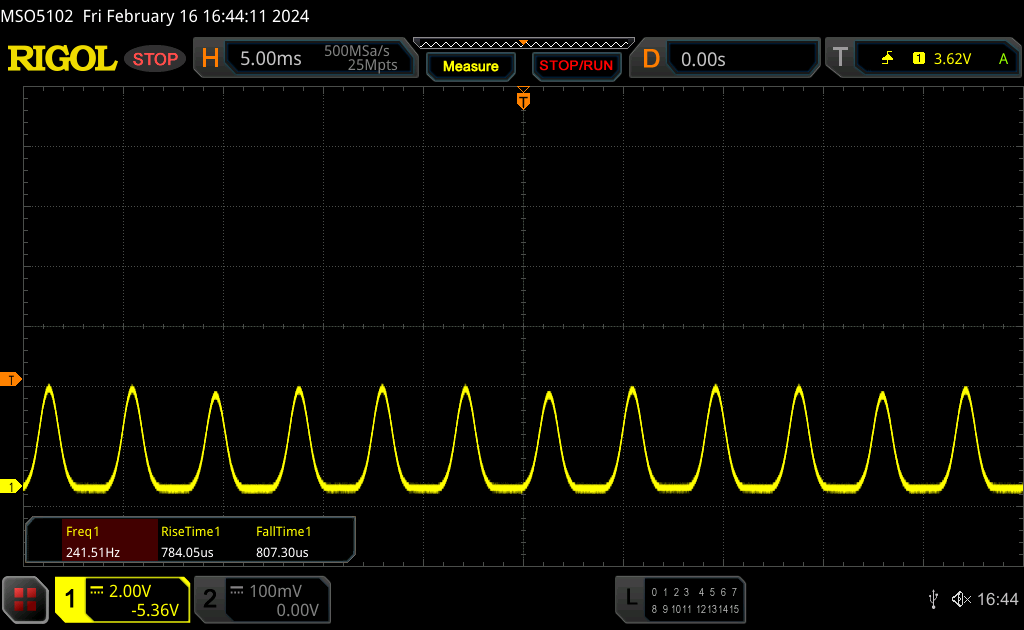
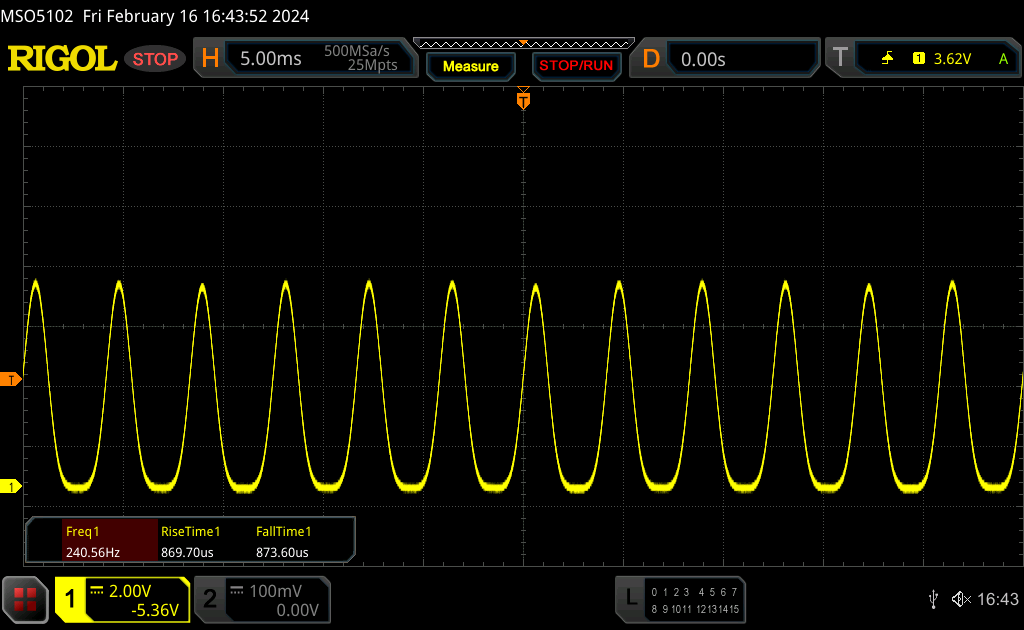
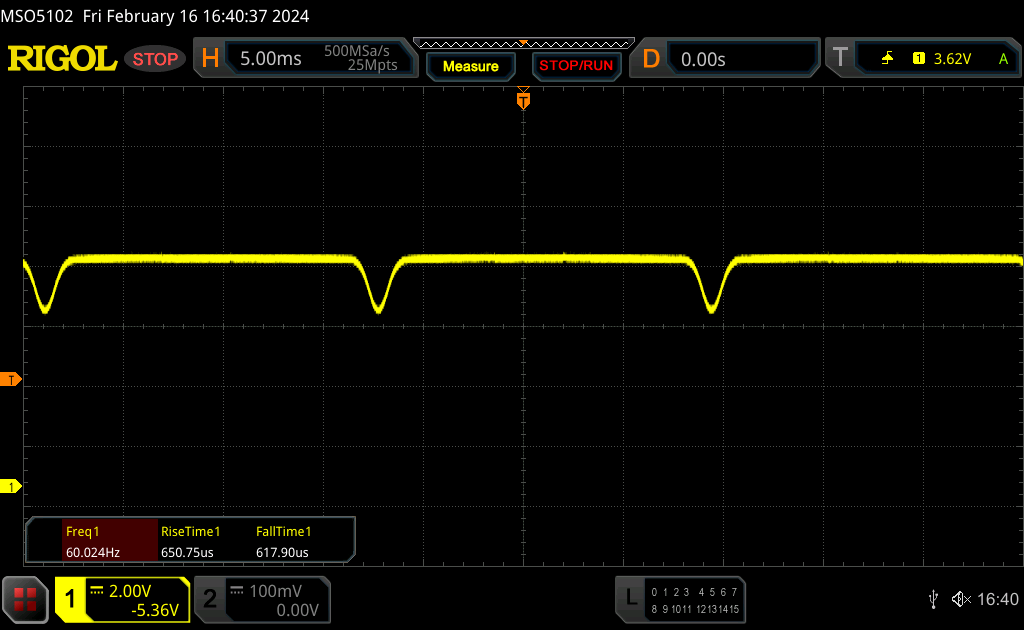
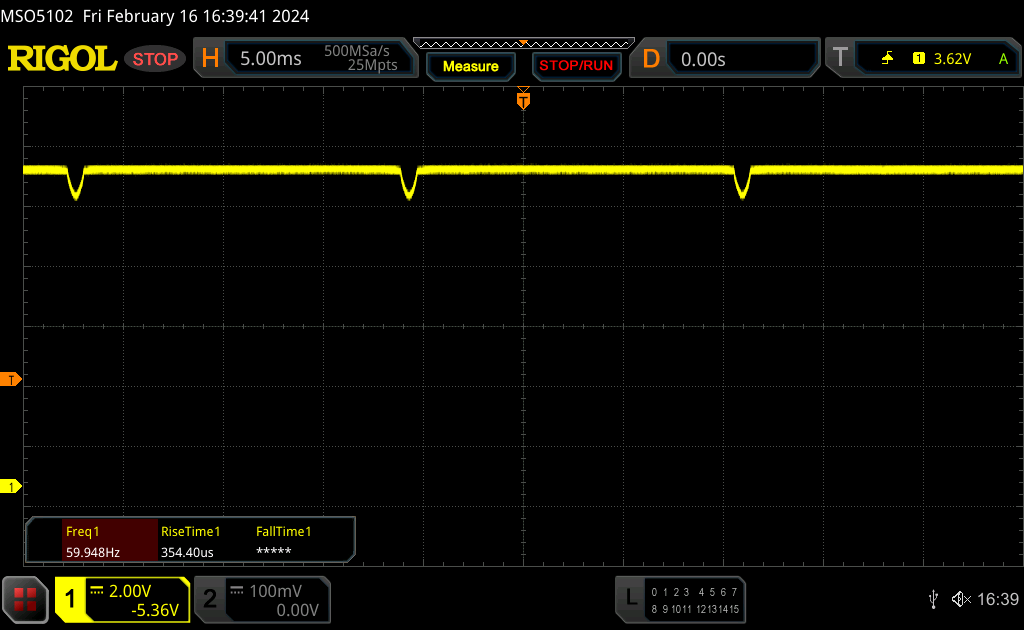
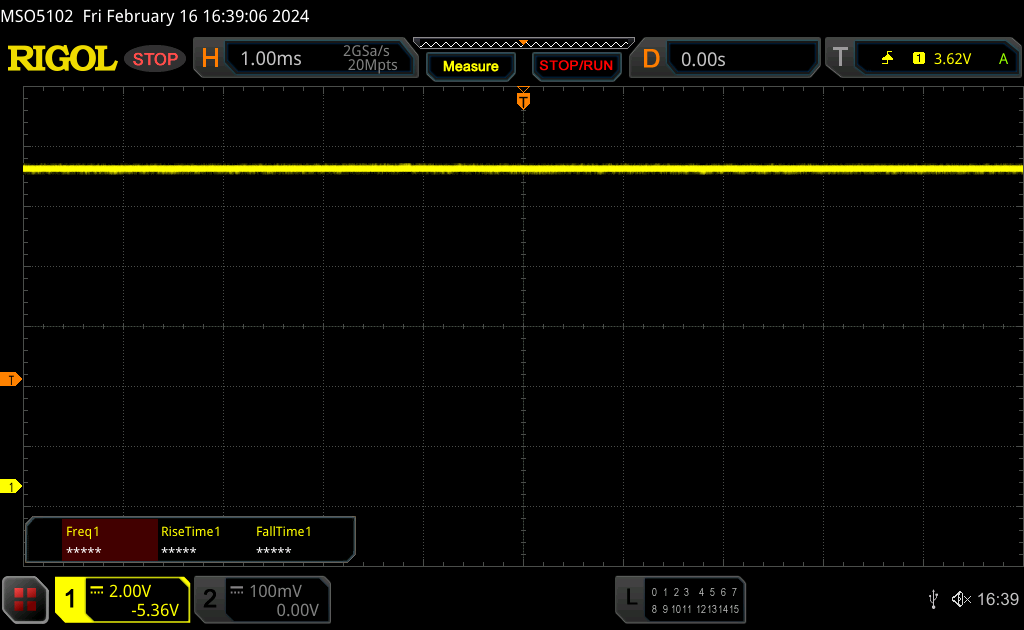
Com o PWM usado, medimos o escurecimento DC a 60 Hz dentro da faixa de brilho de 43% a 84%; a 42% ou menos, a cintilação PWM potencialmente mais prejudicial a 240 Hz entra em ação.
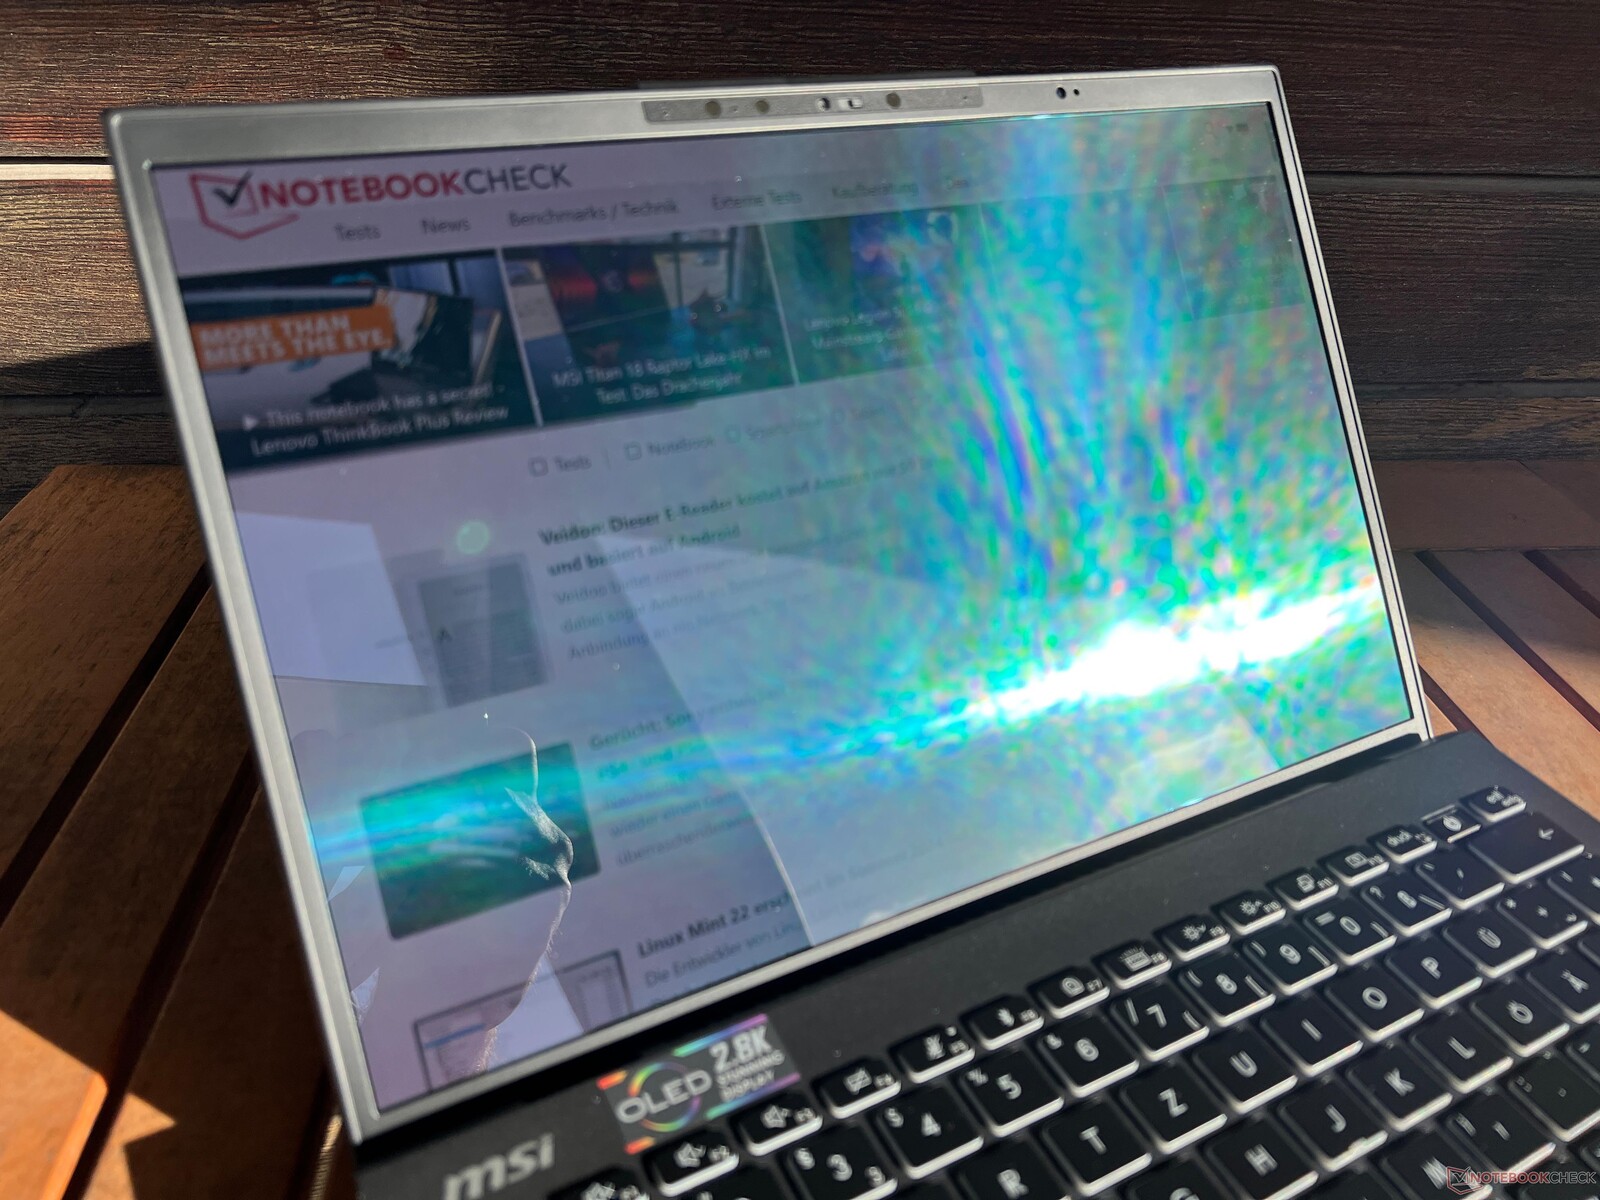
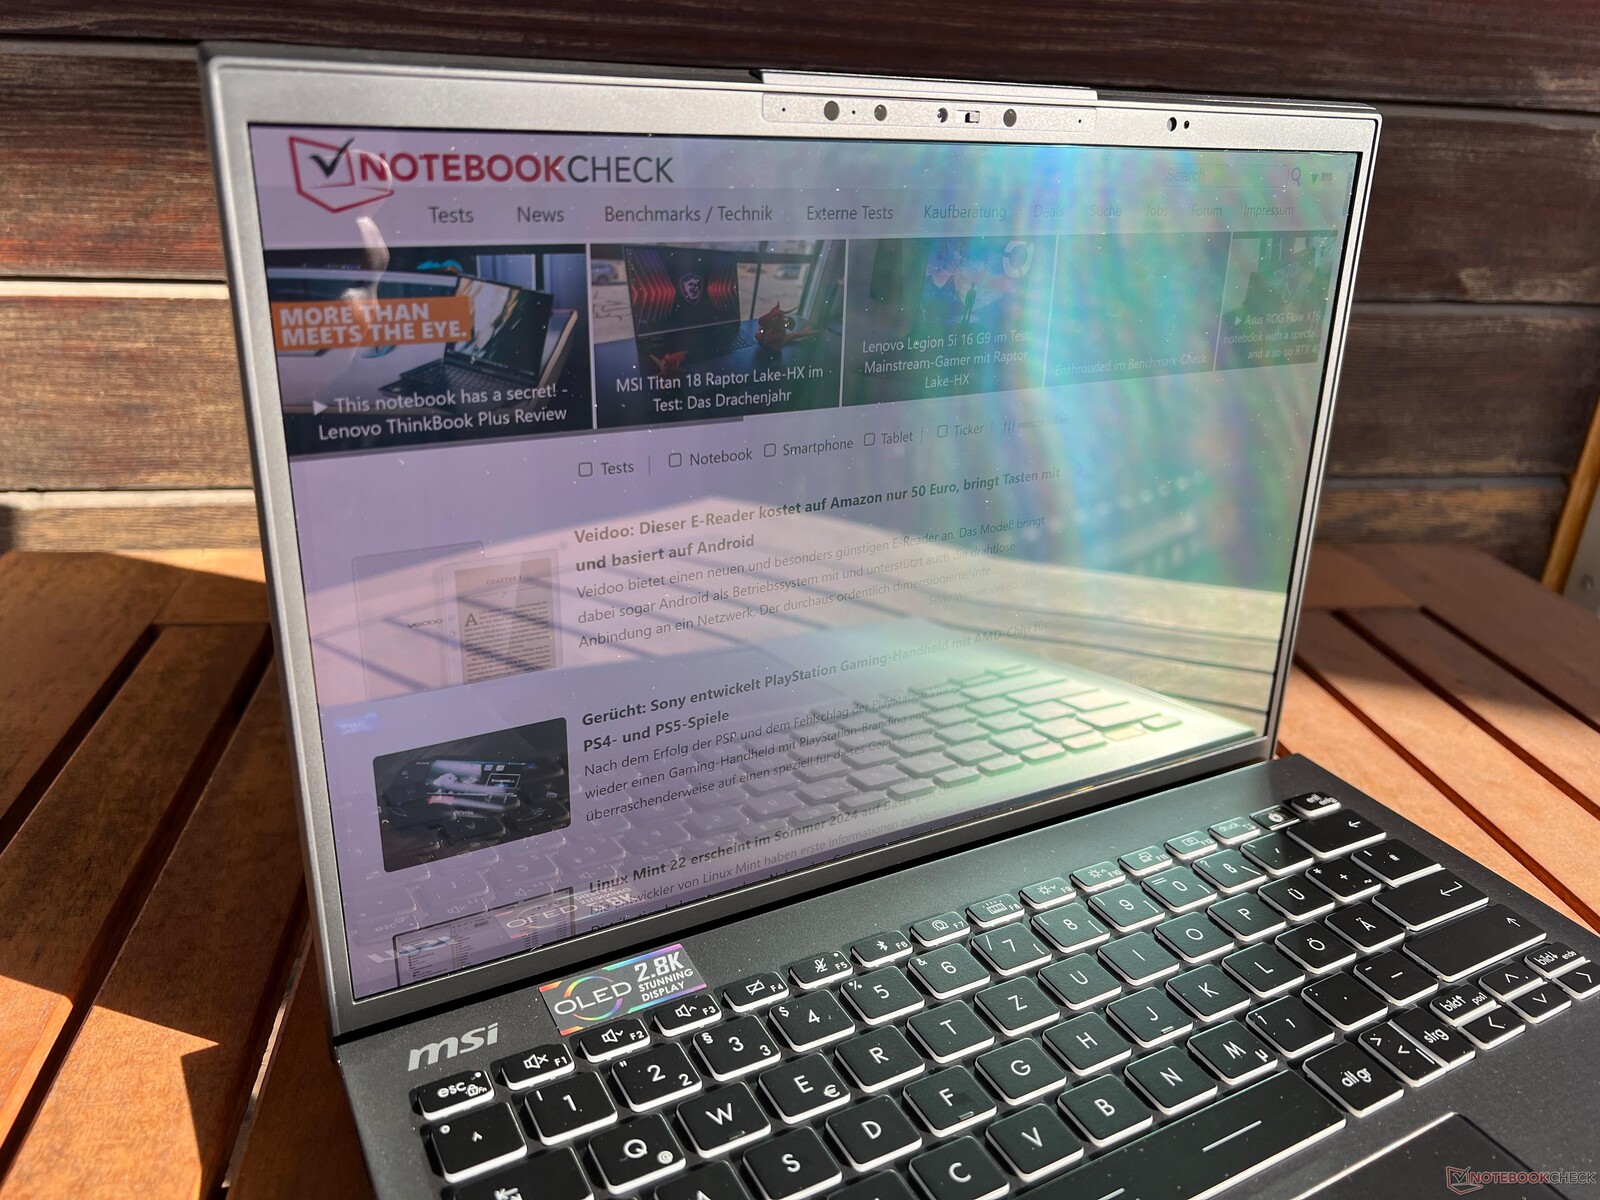

Em ambientes claros, os reflexos rapidamente se tornam um problema na tela brilhante. A estabilidade do ângulo de visão é excelente - apenas os ângulos extremos resultam no brilho azul característico do OLED.

Desempenho - Meteor Lake-H a 20 watts
Condições de teste
O MSI Center pré-instalado oferece vários perfis de energia, sendo que não notamos nenhuma grande diferença entre os perfis individuais (com exceção do modo silencioso ). Posteriormente, realizamos os seguintes benchmarks e medições usando o modo MSI AI Engine, que também é definido como padrão.
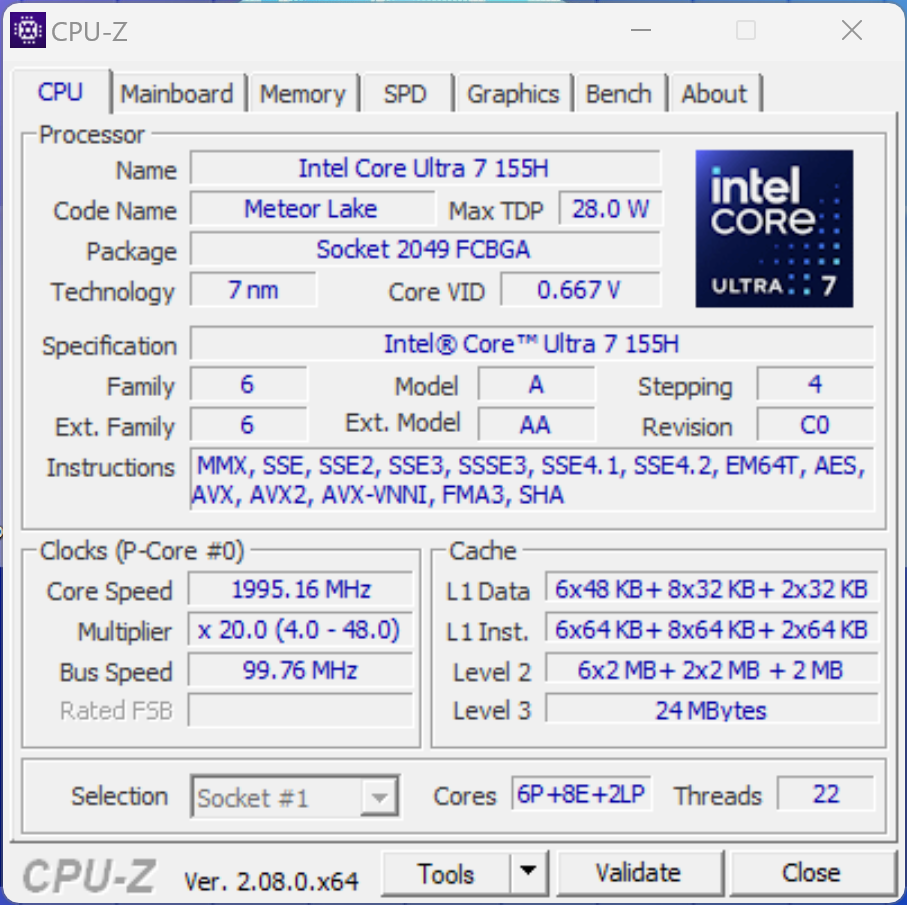
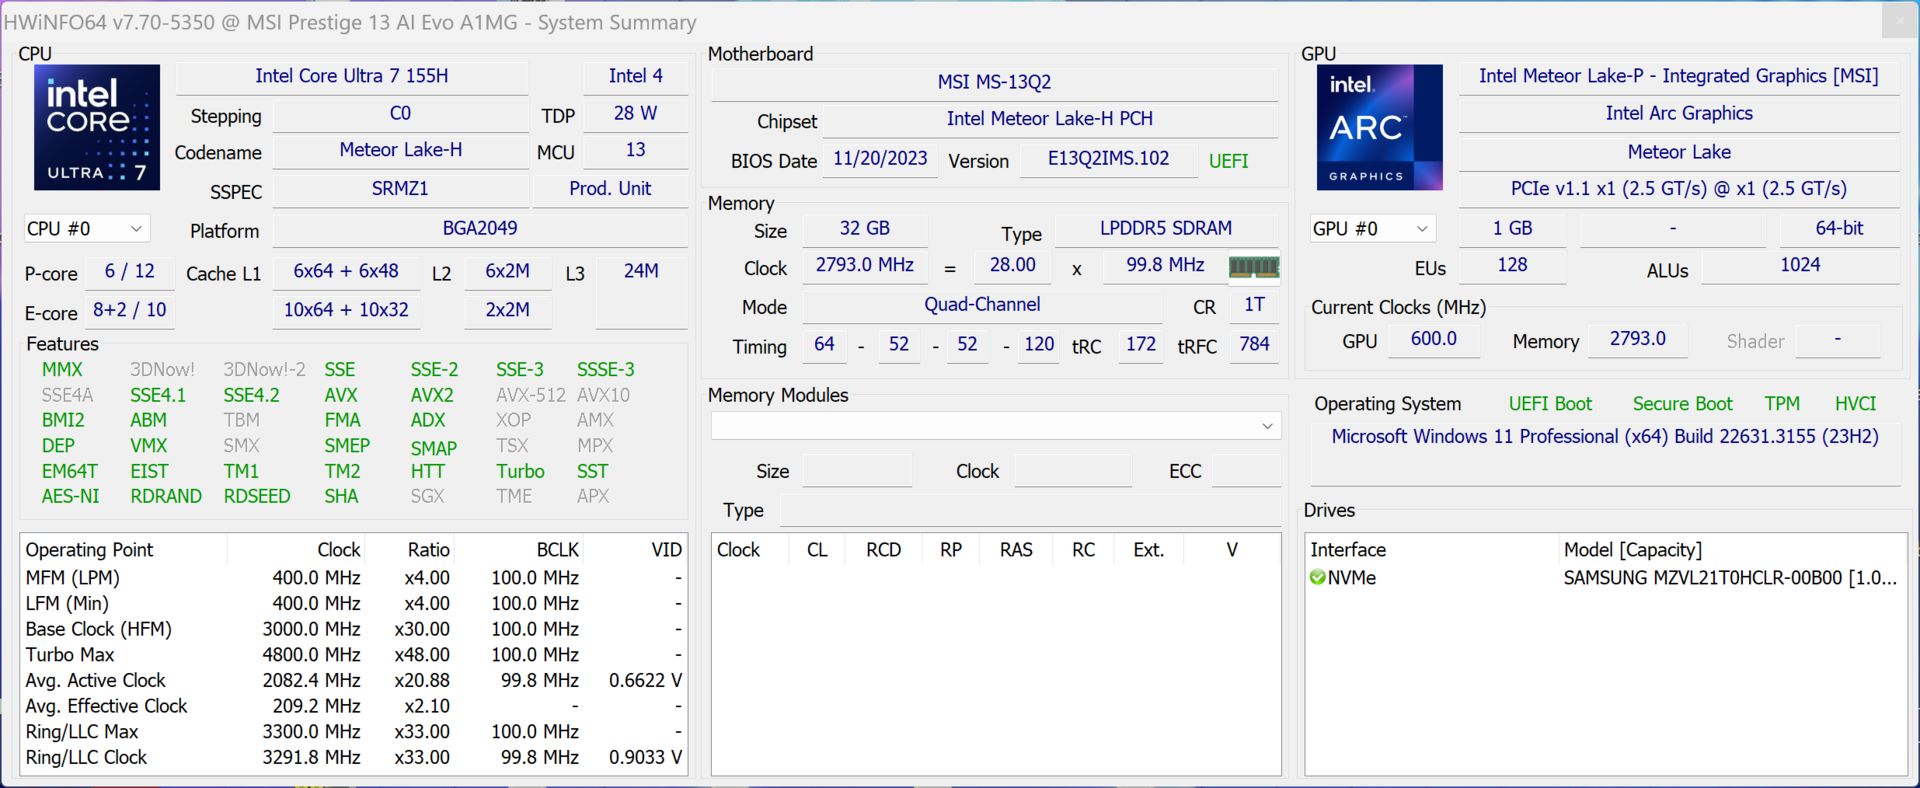
Processador - Core Ultra 7 155H
A MSI equipou o laptop com o novo Meteor-Lake Core Ultra 7 155H da Intel, que pode ser usado em uma área de TDP entre 28 e 115 watts. No caso do Prestige 13, observamos um máximo de 64 watts por cerca de 30 segundos quando o dispositivo estava frio, após o que seu consumo caiu para 20 watts. Um processador da série U provavelmente teria sido uma escolha melhor, mas como essas CPUs possuem apenas dois núcleos P rápidos, seu desempenho é bastante modesto. Sob carga de curto prazo (o que é muito mais provável em um subnotebook), seu desempenho de vários núcleos é, obviamente, muito bom. O desempenho de núcleo único é bom, mas, nesse aspecto, as CPUs Meteor-Lake não apresentam nenhuma vantagem sobre os antigos modelos Raptor-Lake. No uso da bateria, o desempenho da CPU permanece constante. Outros benchmarks de CPU podem ser encontrados aqui.
Cinebench R15 Multi continuous test
Cinebench R23: Multi Core | Single Core
Cinebench R20: CPU (Multi Core) | CPU (Single Core)
Cinebench R15: CPU Multi 64Bit | CPU Single 64Bit
Blender: v2.79 BMW27 CPU
7-Zip 18.03: 7z b 4 | 7z b 4 -mmt1
Geekbench 6.7: Multi-Core | Single-Core
Geekbench 5.5: Multi-Core | Single-Core
HWBOT x265 Benchmark v2.2: 4k Preset
LibreOffice : 20 Documents To PDF
R Benchmark 2.5: Overall mean
| CPU Performance rating | |
| Média Intel Core Ultra 7 155H | |
| Média da turma Subnotebook | |
| MSI Prestige 13 AI Evo | |
| Lenovo ThinkPad X1 Nano Gen 3 | |
| HP Dragonfly G4 -2! | |
| Asus ZenBook S13 OLED UX5304 -2! | |
| Dell Latitude 13 7340 i5-1345U -2! | |
| Cinebench R23 / Multi Core | |
| Média Intel Core Ultra 7 155H (9769 - 19007, n=52) | |
| Média da turma Subnotebook (1555 - 21812, n=60, últimos 2 anos) | |
| MSI Prestige 13 AI Evo | |
| Lenovo ThinkPad X1 Nano Gen 3 | |
| Dell Latitude 13 7340 i5-1345U | |
| HP Dragonfly G4 | |
| Asus ZenBook S13 OLED UX5304 | |
| Cinebench R23 / Single Core | |
| HP Dragonfly G4 | |
| Média da turma Subnotebook (358 - 2213, n=61, últimos 2 anos) | |
| Asus ZenBook S13 OLED UX5304 | |
| Média Intel Core Ultra 7 155H (1496 - 1815, n=52) | |
| Dell Latitude 13 7340 i5-1345U | |
| Lenovo ThinkPad X1 Nano Gen 3 | |
| MSI Prestige 13 AI Evo | |
| Cinebench R20 / CPU (Multi Core) | |
| Média Intel Core Ultra 7 155H (3798 - 7409, n=50) | |
| Média da turma Subnotebook (579 - 8541, n=57, últimos 2 anos) | |
| MSI Prestige 13 AI Evo | |
| Lenovo ThinkPad X1 Nano Gen 3 | |
| Dell Latitude 13 7340 i5-1345U | |
| HP Dragonfly G4 | |
| Asus ZenBook S13 OLED UX5304 | |
| Cinebench R20 / CPU (Single Core) | |
| HP Dragonfly G4 | |
| Asus ZenBook S13 OLED UX5304 | |
| Lenovo ThinkPad X1 Nano Gen 3 | |
| Média Intel Core Ultra 7 155H (601 - 696, n=50) | |
| Dell Latitude 13 7340 i5-1345U | |
| Média da turma Subnotebook (128 - 832, n=57, últimos 2 anos) | |
| MSI Prestige 13 AI Evo | |
| Cinebench R15 / CPU Multi 64Bit | |
| Média Intel Core Ultra 7 155H (1932 - 2880, n=56) | |
| MSI Prestige 13 AI Evo | |
| Média da turma Subnotebook (327 - 3345, n=57, últimos 2 anos) | |
| Lenovo ThinkPad X1 Nano Gen 3 | |
| Asus ZenBook S13 OLED UX5304 | |
| HP Dragonfly G4 | |
| Dell Latitude 13 7340 i5-1345U | |
| Cinebench R15 / CPU Single 64Bit | |
| Média da turma Subnotebook (72.4 - 322, n=57, últimos 2 anos) | |
| HP Dragonfly G4 | |
| Média Intel Core Ultra 7 155H (99.6 - 268, n=52) | |
| Asus ZenBook S13 OLED UX5304 | |
| MSI Prestige 13 AI Evo | |
| Dell Latitude 13 7340 i5-1345U | |
| Lenovo ThinkPad X1 Nano Gen 3 | |
| Blender / v2.79 BMW27 CPU | |
| Dell Latitude 13 7340 i5-1345U | |
| Asus ZenBook S13 OLED UX5304 | |
| Asus ZenBook S13 OLED UX5304 | |
| HP Dragonfly G4 | |
| Lenovo ThinkPad X1 Nano Gen 3 | |
| Média da turma Subnotebook (159 - 2271, n=58, últimos 2 anos) | |
| MSI Prestige 13 AI Evo | |
| Média Intel Core Ultra 7 155H (175 - 381, n=47) | |
| 7-Zip 18.03 / 7z b 4 | |
| Média Intel Core Ultra 7 155H (41739 - 70254, n=50) | |
| Média da turma Subnotebook (11668 - 77867, n=57, últimos 2 anos) | |
| MSI Prestige 13 AI Evo | |
| HP Dragonfly G4 | |
| Lenovo ThinkPad X1 Nano Gen 3 | |
| Asus ZenBook S13 OLED UX5304 | |
| Dell Latitude 13 7340 i5-1345U | |
| 7-Zip 18.03 / 7z b 4 -mmt1 | |
| HP Dragonfly G4 | |
| Lenovo ThinkPad X1 Nano Gen 3 | |
| Asus ZenBook S13 OLED UX5304 | |
| Média da turma Subnotebook (2643 - 6699, n=59, últimos 2 anos) | |
| MSI Prestige 13 AI Evo | |
| Média Intel Core Ultra 7 155H (4594 - 5621, n=50) | |
| Dell Latitude 13 7340 i5-1345U | |
| Geekbench 6.7 / Multi-Core | |
| Média da turma Subnotebook (2244 - 20325, n=63, últimos 2 anos) | |
| Média Intel Core Ultra 7 155H (7732 - 13656, n=55) | |
| Lenovo ThinkPad X1 Nano Gen 3 | |
| MSI Prestige 13 AI Evo | |
| Geekbench 6.7 / Single-Core | |
| Média da turma Subnotebook (960 - 4195, n=62, últimos 2 anos) | |
| Lenovo ThinkPad X1 Nano Gen 3 | |
| MSI Prestige 13 AI Evo | |
| Média Intel Core Ultra 7 155H (1901 - 2473, n=52) | |
| Geekbench 5.5 / Multi-Core | |
| Média Intel Core Ultra 7 155H (10017 - 13556, n=52) | |
| Média da turma Subnotebook (2557 - 17218, n=48, últimos 2 anos) | |
| MSI Prestige 13 AI Evo | |
| Lenovo ThinkPad X1 Nano Gen 3 | |
| HP Dragonfly G4 | |
| Asus ZenBook S13 OLED UX5304 | |
| Dell Latitude 13 7340 i5-1345U | |
| Geekbench 5.5 / Single-Core | |
| Média da turma Subnotebook (726 - 2224, n=48, últimos 2 anos) | |
| HP Dragonfly G4 | |
| Lenovo ThinkPad X1 Nano Gen 3 | |
| Asus ZenBook S13 OLED UX5304 | |
| MSI Prestige 13 AI Evo | |
| Média Intel Core Ultra 7 155H (1462 - 1824, n=52) | |
| Dell Latitude 13 7340 i5-1345U | |
| HWBOT x265 Benchmark v2.2 / 4k Preset | |
| Média Intel Core Ultra 7 155H (9.93 - 21.2, n=50) | |
| Média da turma Subnotebook (0.97 - 25.1, n=57, últimos 2 anos) | |
| MSI Prestige 13 AI Evo | |
| Lenovo ThinkPad X1 Nano Gen 3 | |
| HP Dragonfly G4 | |
| Asus ZenBook S13 OLED UX5304 | |
| Dell Latitude 13 7340 i5-1345U | |
| LibreOffice / 20 Documents To PDF | |
| Média da turma Subnotebook (39.9 - 220, n=56, últimos 2 anos) | |
| Lenovo ThinkPad X1 Nano Gen 3 | |
| Média Intel Core Ultra 7 155H (37.5 - 79.2, n=49) | |
| Asus ZenBook S13 OLED UX5304 | |
| HP Dragonfly G4 | |
| MSI Prestige 13 AI Evo | |
| Dell Latitude 13 7340 i5-1345U | |
| R Benchmark 2.5 / Overall mean | |
| Média da turma Subnotebook (0.4024 - 1.456, n=58, últimos 2 anos) | |
| Dell Latitude 13 7340 i5-1345U | |
| Lenovo ThinkPad X1 Nano Gen 3 | |
| Média Intel Core Ultra 7 155H (0.4457 - 0.53, n=49) | |
| Asus ZenBook S13 OLED UX5304 | |
| MSI Prestige 13 AI Evo | |
| HP Dragonfly G4 | |
* ... menor é melhor
AIDA64: FP32 Ray-Trace | FPU Julia | CPU SHA3 | CPU Queen | FPU SinJulia | FPU Mandel | CPU AES | CPU ZLib | FP64 Ray-Trace | CPU PhotoWorxx
| Performance rating | |
| Média Intel Core Ultra 7 155H | |
| Média da turma Subnotebook | |
| MSI Prestige 13 AI Evo | |
| Lenovo ThinkPad X1 Nano Gen 3 | |
| HP Dragonfly G4 | |
| Asus ZenBook S13 OLED UX5304 | |
| Dell Latitude 13 7340 i5-1345U | |
| AIDA64 / FP32 Ray-Trace | |
| Média da turma Subnotebook (1135 - 32888, n=58, últimos 2 anos) | |
| Média Intel Core Ultra 7 155H (6670 - 18470, n=50) | |
| Lenovo ThinkPad X1 Nano Gen 3 | |
| HP Dragonfly G4 | |
| MSI Prestige 13 AI Evo | |
| Asus ZenBook S13 OLED UX5304 | |
| Dell Latitude 13 7340 i5-1345U | |
| AIDA64 / FPU Julia | |
| Média Intel Core Ultra 7 155H (40905 - 93181, n=50) | |
| Média da turma Subnotebook (5218 - 123315, n=58, últimos 2 anos) | |
| MSI Prestige 13 AI Evo | |
| Lenovo ThinkPad X1 Nano Gen 3 | |
| HP Dragonfly G4 | |
| Asus ZenBook S13 OLED UX5304 | |
| Dell Latitude 13 7340 i5-1345U | |
| AIDA64 / CPU SHA3 | |
| Média Intel Core Ultra 7 155H (1940 - 4436, n=50) | |
| Média da turma Subnotebook (444 - 5287, n=58, últimos 2 anos) | |
| MSI Prestige 13 AI Evo | |
| Lenovo ThinkPad X1 Nano Gen 3 | |
| HP Dragonfly G4 | |
| Asus ZenBook S13 OLED UX5304 | |
| Dell Latitude 13 7340 i5-1345U | |
| AIDA64 / CPU Queen | |
| Lenovo ThinkPad X1 Nano Gen 3 | |
| Média Intel Core Ultra 7 155H (64698 - 94181, n=50) | |
| HP Dragonfly G4 | |
| Asus ZenBook S13 OLED UX5304 | |
| MSI Prestige 13 AI Evo | |
| Dell Latitude 13 7340 i5-1345U | |
| Média da turma Subnotebook (10579 - 95002, n=49, últimos 2 anos) | |
| AIDA64 / FPU SinJulia | |
| Média Intel Core Ultra 7 155H (5639 - 10647, n=50) | |
| Média da turma Subnotebook (744 - 18418, n=58, últimos 2 anos) | |
| MSI Prestige 13 AI Evo | |
| Lenovo ThinkPad X1 Nano Gen 3 | |
| HP Dragonfly G4 | |
| Asus ZenBook S13 OLED UX5304 | |
| Dell Latitude 13 7340 i5-1345U | |
| AIDA64 / FPU Mandel | |
| Média Intel Core Ultra 7 155H (18236 - 47685, n=50) | |
| Média da turma Subnotebook (3341 - 65433, n=58, últimos 2 anos) | |
| MSI Prestige 13 AI Evo | |
| Lenovo ThinkPad X1 Nano Gen 3 | |
| HP Dragonfly G4 | |
| Asus ZenBook S13 OLED UX5304 | |
| Dell Latitude 13 7340 i5-1345U | |
| AIDA64 / CPU AES | |
| Média Intel Core Ultra 7 155H (45713 - 152179, n=50) | |
| Média da turma Subnotebook (638 - 96917, n=58, últimos 2 anos) | |
| MSI Prestige 13 AI Evo | |
| Lenovo ThinkPad X1 Nano Gen 3 | |
| HP Dragonfly G4 | |
| Asus ZenBook S13 OLED UX5304 | |
| Dell Latitude 13 7340 i5-1345U | |
| AIDA64 / CPU ZLib | |
| Média Intel Core Ultra 7 155H (557 - 1250, n=50) | |
| Média da turma Subnotebook (164.9 - 1379, n=58, últimos 2 anos) | |
| MSI Prestige 13 AI Evo | |
| Lenovo ThinkPad X1 Nano Gen 3 | |
| HP Dragonfly G4 | |
| Asus ZenBook S13 OLED UX5304 | |
| Dell Latitude 13 7340 i5-1345U | |
| AIDA64 / FP64 Ray-Trace | |
| Média da turma Subnotebook (610 - 17495, n=58, últimos 2 anos) | |
| Média Intel Core Ultra 7 155H (3569 - 9802, n=50) | |
| Lenovo ThinkPad X1 Nano Gen 3 | |
| MSI Prestige 13 AI Evo | |
| HP Dragonfly G4 | |
| Asus ZenBook S13 OLED UX5304 | |
| Dell Latitude 13 7340 i5-1345U | |
| AIDA64 / CPU PhotoWorxx | |
| Média da turma Subnotebook (6569 - 85600, n=58, últimos 2 anos) | |
| Média Intel Core Ultra 7 155H (32719 - 54223, n=50) | |
| Lenovo ThinkPad X1 Nano Gen 3 | |
| MSI Prestige 13 AI Evo | |
| Asus ZenBook S13 OLED UX5304 | |
| HP Dragonfly G4 | |
| Dell Latitude 13 7340 i5-1345U | |
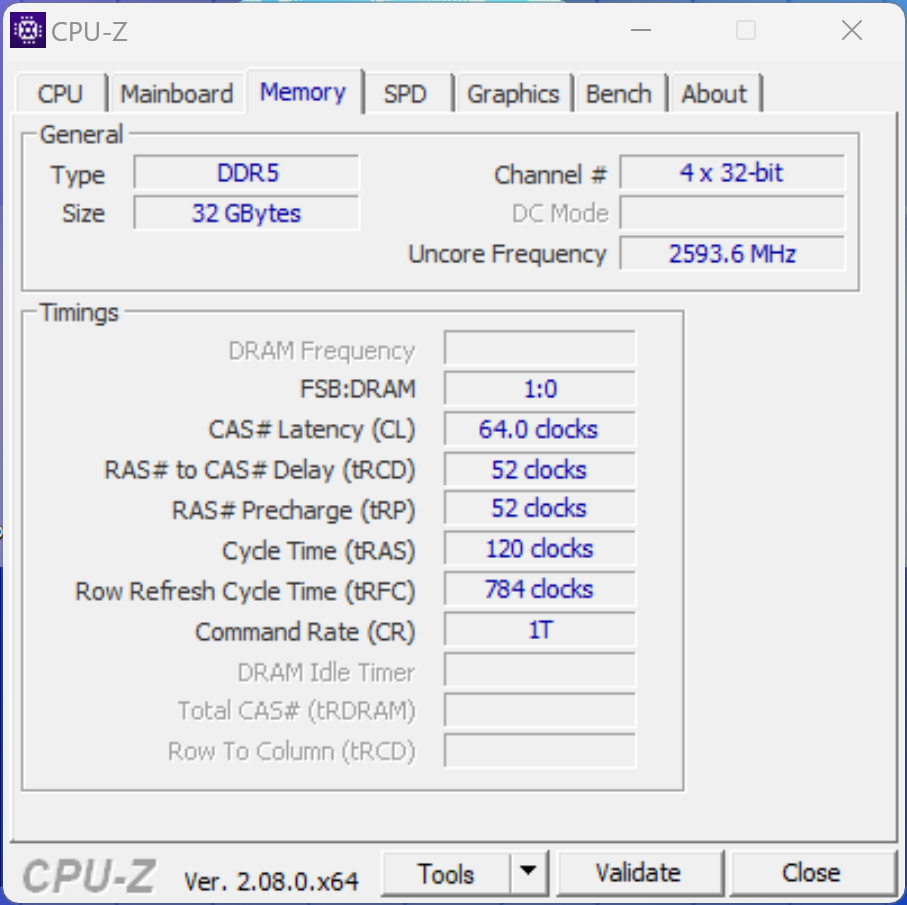
Desempenho do sistema
No uso diário, o compacto Prestige 13 é um companheiro veloz e de reação rápida, o que se deve, em parte, ao seu armazenamento SSD. A configuração de RAM da nossa amostra de teste é de 32 GB, o que deve ser mais do que suficiente para os usuários nos próximos anos. Durante nossos testes, não tivemos nenhum problema relacionado à estabilidade do sistema.
CrossMark: Overall | Productivity | Creativity | Responsiveness
WebXPRT 3: Overall
WebXPRT 4: Overall
Mozilla Kraken 1.1: Total
| PCMark 10 / Score | |
| Média da turma Subnotebook (4920 - 9939, n=45, últimos 2 anos) | |
| Média Intel Core Ultra 7 155H, Intel Arc 8-Core iGPU (4809 - 7529, n=34) | |
| MSI Prestige 13 AI Evo | |
| Lenovo ThinkPad X1 Nano Gen 3 | |
| HP Dragonfly G4 | |
| Asus ZenBook S13 OLED UX5304 | |
| Dell Latitude 13 7340 i5-1345U | |
| PCMark 10 / Essentials | |
| HP Dragonfly G4 | |
| Lenovo ThinkPad X1 Nano Gen 3 | |
| Asus ZenBook S13 OLED UX5304 | |
| Média Intel Core Ultra 7 155H, Intel Arc 8-Core iGPU (7605 - 11289, n=34) | |
| Média da turma Subnotebook (8552 - 11646, n=45, últimos 2 anos) | |
| Dell Latitude 13 7340 i5-1345U | |
| MSI Prestige 13 AI Evo | |
| PCMark 10 / Productivity | |
| Média da turma Subnotebook (5435 - 16606, n=45, últimos 2 anos) | |
| Média Intel Core Ultra 7 155H, Intel Arc 8-Core iGPU (6042 - 10591, n=34) | |
| MSI Prestige 13 AI Evo | |
| Lenovo ThinkPad X1 Nano Gen 3 | |
| HP Dragonfly G4 | |
| Asus ZenBook S13 OLED UX5304 | |
| Dell Latitude 13 7340 i5-1345U | |
| PCMark 10 / Digital Content Creation | |
| Média da turma Subnotebook (5722 - 13779, n=45, últimos 2 anos) | |
| Média Intel Core Ultra 7 155H, Intel Arc 8-Core iGPU (4985 - 10709, n=34) | |
| MSI Prestige 13 AI Evo | |
| Lenovo ThinkPad X1 Nano Gen 3 | |
| HP Dragonfly G4 | |
| Asus ZenBook S13 OLED UX5304 | |
| Dell Latitude 13 7340 i5-1345U | |
| CrossMark / Overall | |
| Lenovo ThinkPad X1 Nano Gen 3 | |
| Média da turma Subnotebook (365 - 2356, n=60, últimos 2 anos) | |
| Média Intel Core Ultra 7 155H, Intel Arc 8-Core iGPU (1366 - 1903, n=34) | |
| HP Dragonfly G4 | |
| Asus ZenBook S13 OLED UX5304 | |
| Dell Latitude 13 7340 i5-1345U | |
| MSI Prestige 13 AI Evo | |
| CrossMark / Productivity | |
| Lenovo ThinkPad X1 Nano Gen 3 | |
| HP Dragonfly G4 | |
| Média Intel Core Ultra 7 155H, Intel Arc 8-Core iGPU (1291 - 1798, n=33) | |
| Média da turma Subnotebook (364 - 2277, n=60, últimos 2 anos) | |
| Asus ZenBook S13 OLED UX5304 | |
| Dell Latitude 13 7340 i5-1345U | |
| MSI Prestige 13 AI Evo | |
| CrossMark / Creativity | |
| Lenovo ThinkPad X1 Nano Gen 3 | |
| Média da turma Subnotebook (372 - 2743, n=60, últimos 2 anos) | |
| Média Intel Core Ultra 7 155H, Intel Arc 8-Core iGPU (1519 - 1929, n=33) | |
| HP Dragonfly G4 | |
| Asus ZenBook S13 OLED UX5304 | |
| Dell Latitude 13 7340 i5-1345U | |
| MSI Prestige 13 AI Evo | |
| CrossMark / Responsiveness | |
| Lenovo ThinkPad X1 Nano Gen 3 | |
| Média Intel Core Ultra 7 155H, Intel Arc 8-Core iGPU (939 - 1802, n=33) | |
| Asus ZenBook S13 OLED UX5304 | |
| HP Dragonfly G4 | |
| Média da turma Subnotebook (312 - 1854, n=60, últimos 2 anos) | |
| Dell Latitude 13 7340 i5-1345U | |
| MSI Prestige 13 AI Evo | |
| WebXPRT 3 / Overall | |
| Média da turma Subnotebook (156 - 530, n=56, últimos 2 anos) | |
| Lenovo ThinkPad X1 Nano Gen 3 | |
| HP Dragonfly G4 | |
| Asus ZenBook S13 OLED UX5304 | |
| Média Intel Core Ultra 7 155H, Intel Arc 8-Core iGPU (252 - 299, n=34) | |
| MSI Prestige 13 AI Evo | |
| WebXPRT 4 / Overall | |
| Média da turma Subnotebook (132 - 378, n=61, últimos 2 anos) | |
| Lenovo ThinkPad X1 Nano Gen 3 | |
| HP Dragonfly G4 | |
| Asus ZenBook S13 OLED UX5304 | |
| Média Intel Core Ultra 7 155H, Intel Arc 8-Core iGPU (166.4 - 309, n=29) | |
| MSI Prestige 13 AI Evo | |
| Mozilla Kraken 1.1 / Total | |
| Dell Latitude 13 7340 i5-1345U | |
| MSI Prestige 13 AI Evo | |
| Média Intel Core Ultra 7 155H, Intel Arc 8-Core iGPU (517 - 614, n=35) | |
| Asus ZenBook S13 OLED UX5304 | |
| Lenovo ThinkPad X1 Nano Gen 3 | |
| HP Dragonfly G4 | |
| Média da turma Subnotebook (234 - 1104, n=61, últimos 2 anos) | |
* ... menor é melhor
| PCMark 10 Score | 5952 pontos | |
Ajuda | ||
| AIDA64 / Memory Copy | |
| Média da turma Subnotebook (14554 - 131023, n=58, últimos 2 anos) | |
| Média Intel Core Ultra 7 155H (62397 - 96791, n=50) | |
| MSI Prestige 13 AI Evo | |
| Lenovo ThinkPad X1 Nano Gen 3 | |
| Asus ZenBook S13 OLED UX5304 | |
| HP Dragonfly G4 | |
| Dell Latitude 13 7340 i5-1345U | |
| AIDA64 / Memory Read | |
| Média da turma Subnotebook (15948 - 127174, n=58, últimos 2 anos) | |
| Média Intel Core Ultra 7 155H (60544 - 90647, n=50) | |
| MSI Prestige 13 AI Evo | |
| Lenovo ThinkPad X1 Nano Gen 3 | |
| Asus ZenBook S13 OLED UX5304 | |
| HP Dragonfly G4 | |
| Dell Latitude 13 7340 i5-1345U | |
| AIDA64 / Memory Write | |
| Lenovo ThinkPad X1 Nano Gen 3 | |
| Média da turma Subnotebook (15709 - 135141, n=58, últimos 2 anos) | |
| MSI Prestige 13 AI Evo | |
| Média Intel Core Ultra 7 155H (58692 - 93451, n=50) | |
| Asus ZenBook S13 OLED UX5304 | |
| Dell Latitude 13 7340 i5-1345U | |
| HP Dragonfly G4 | |
| AIDA64 / Memory Latency | |
| MSI Prestige 13 AI Evo | |
| Média Intel Core Ultra 7 155H (116.2 - 233, n=50) | |
| Dell Latitude 13 7340 i5-1345U | |
| Média da turma Subnotebook (6.1 - 159.9, n=56, últimos 2 anos) | |
| Lenovo ThinkPad X1 Nano Gen 3 | |
| HP Dragonfly G4 | |
| Asus ZenBook S13 OLED UX5304 | |
* ... menor é melhor
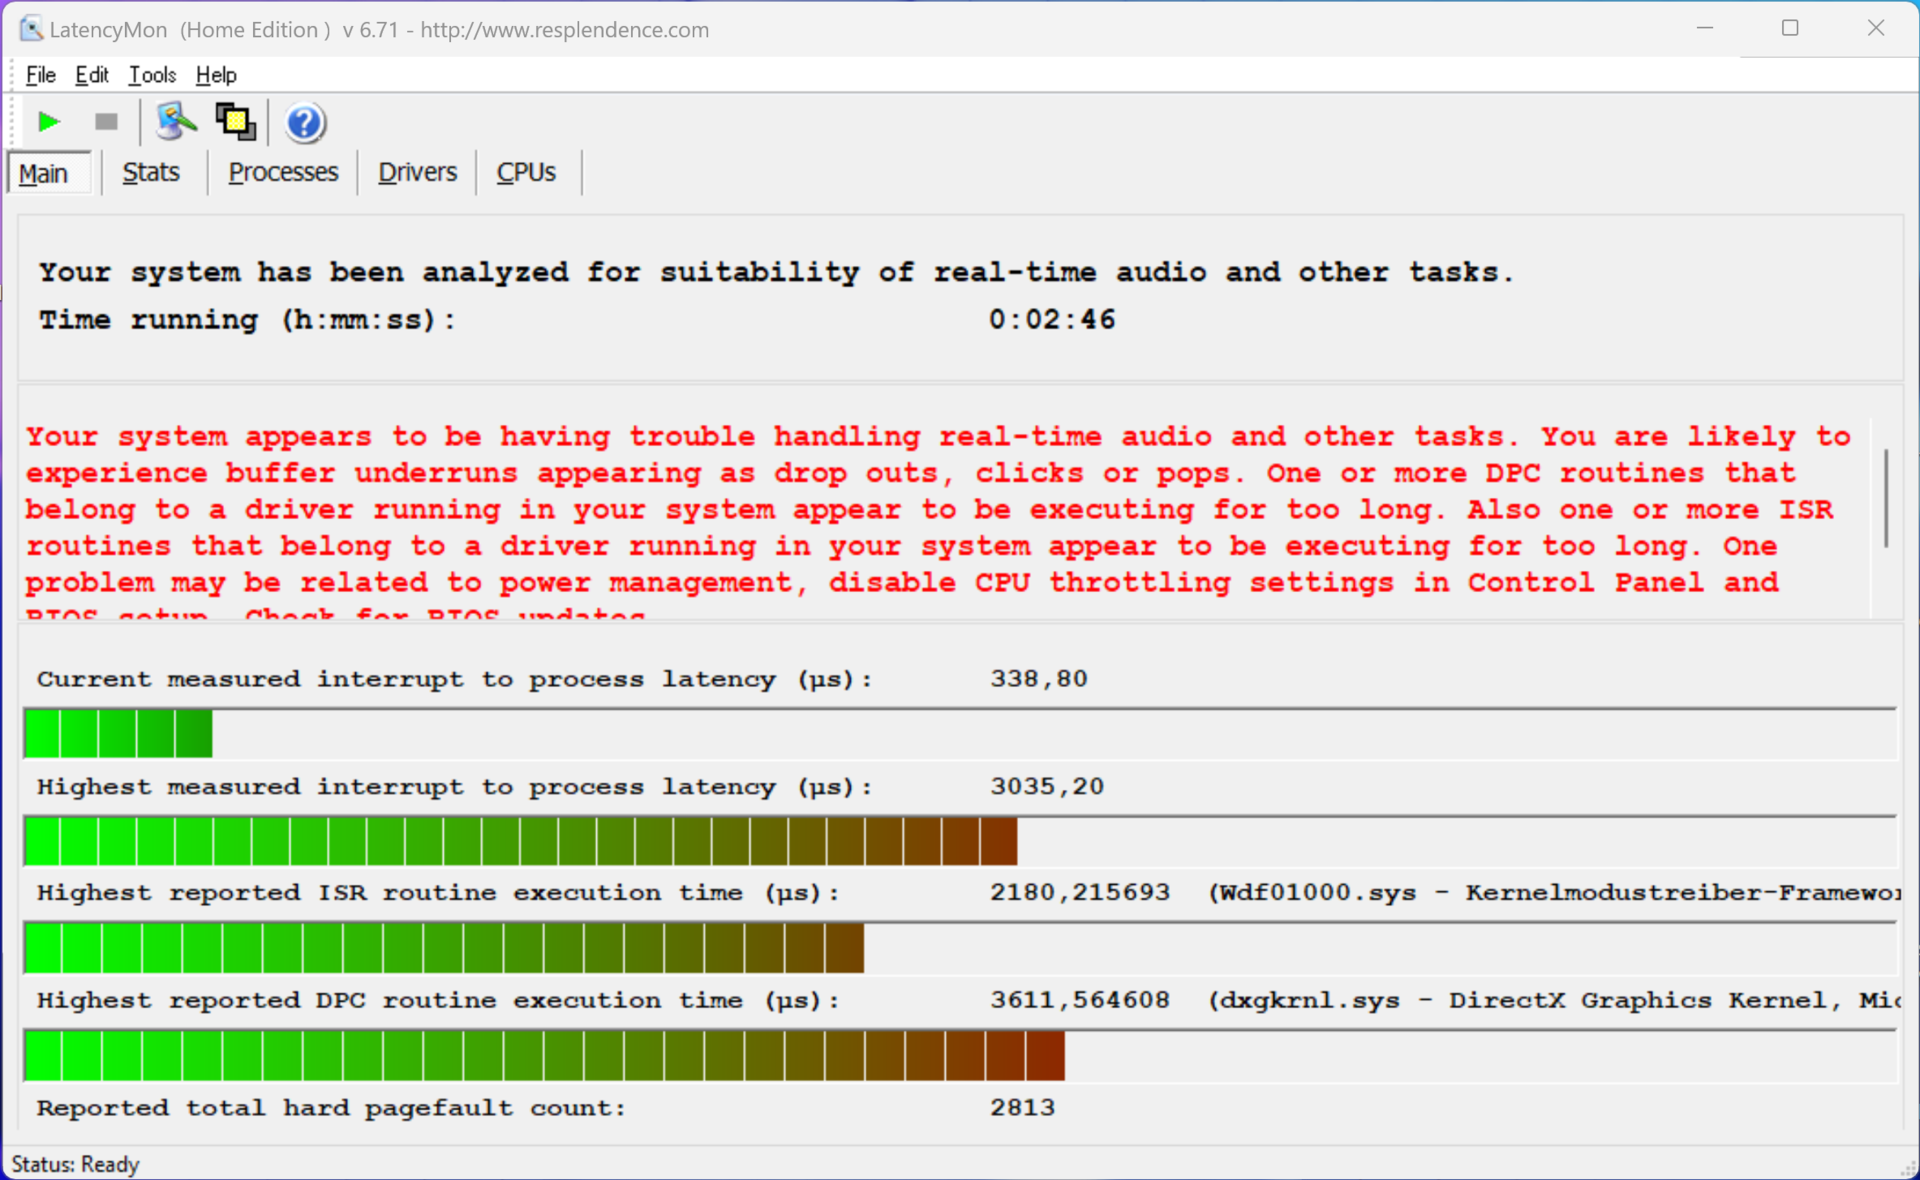
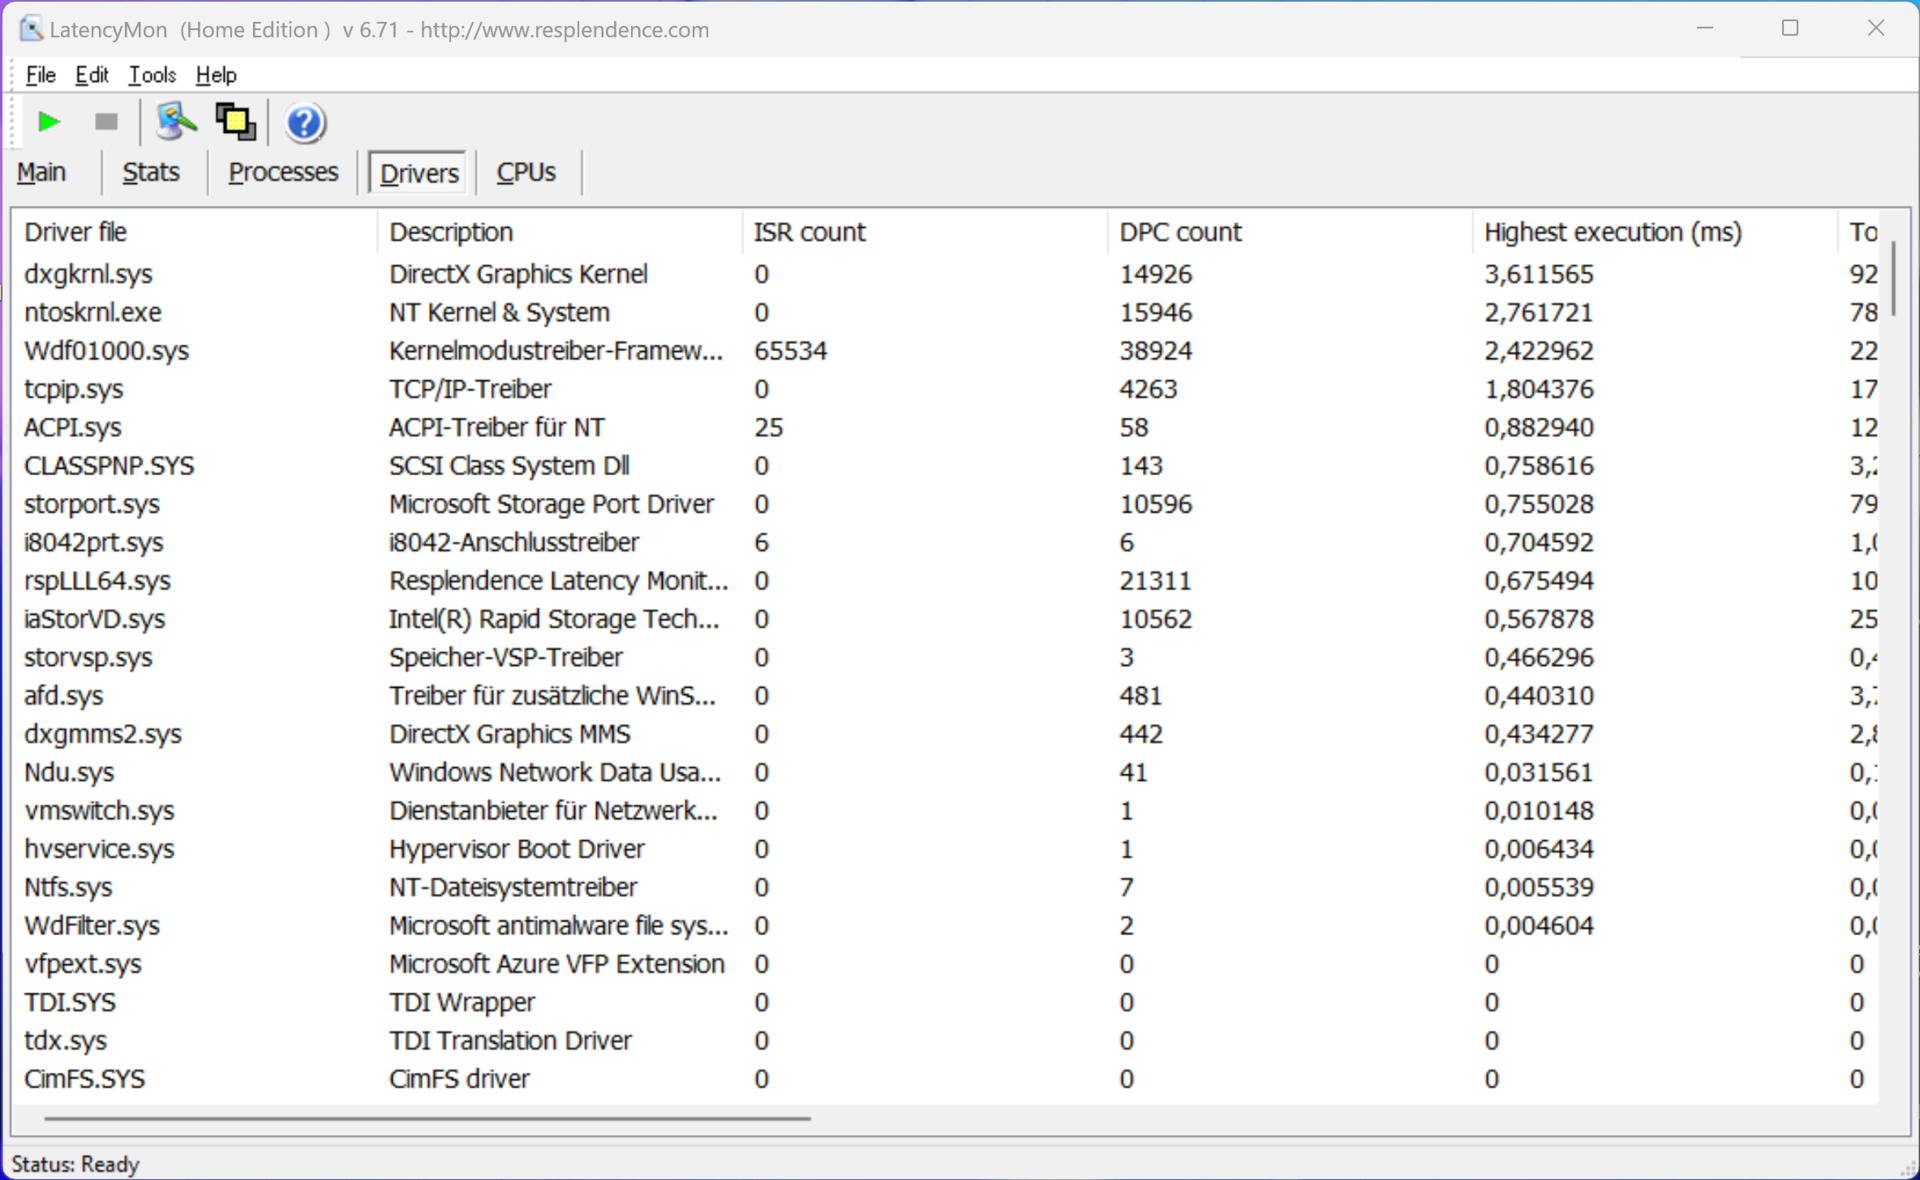
Latência DPC
Em nosso teste de latência padronizado (navegação na Web, reprodução em 4K no YouTube, carga da CPU), o dispositivo de teste com a versão atual do BIOS mostrou algumas limitações ao usar aplicativos de áudio em tempo real.
| DPC Latencies / LatencyMon - interrupt to process latency (max), Web, Youtube, Prime95 | |
| MSI Prestige 13 AI Evo | |
| Lenovo ThinkPad X1 Nano Gen 3 | |
| Dell Latitude 13 7340 i5-1345U | |
| Asus ZenBook S13 OLED UX5304 | |
| HP Dragonfly G4 | |
* ... menor é melhor
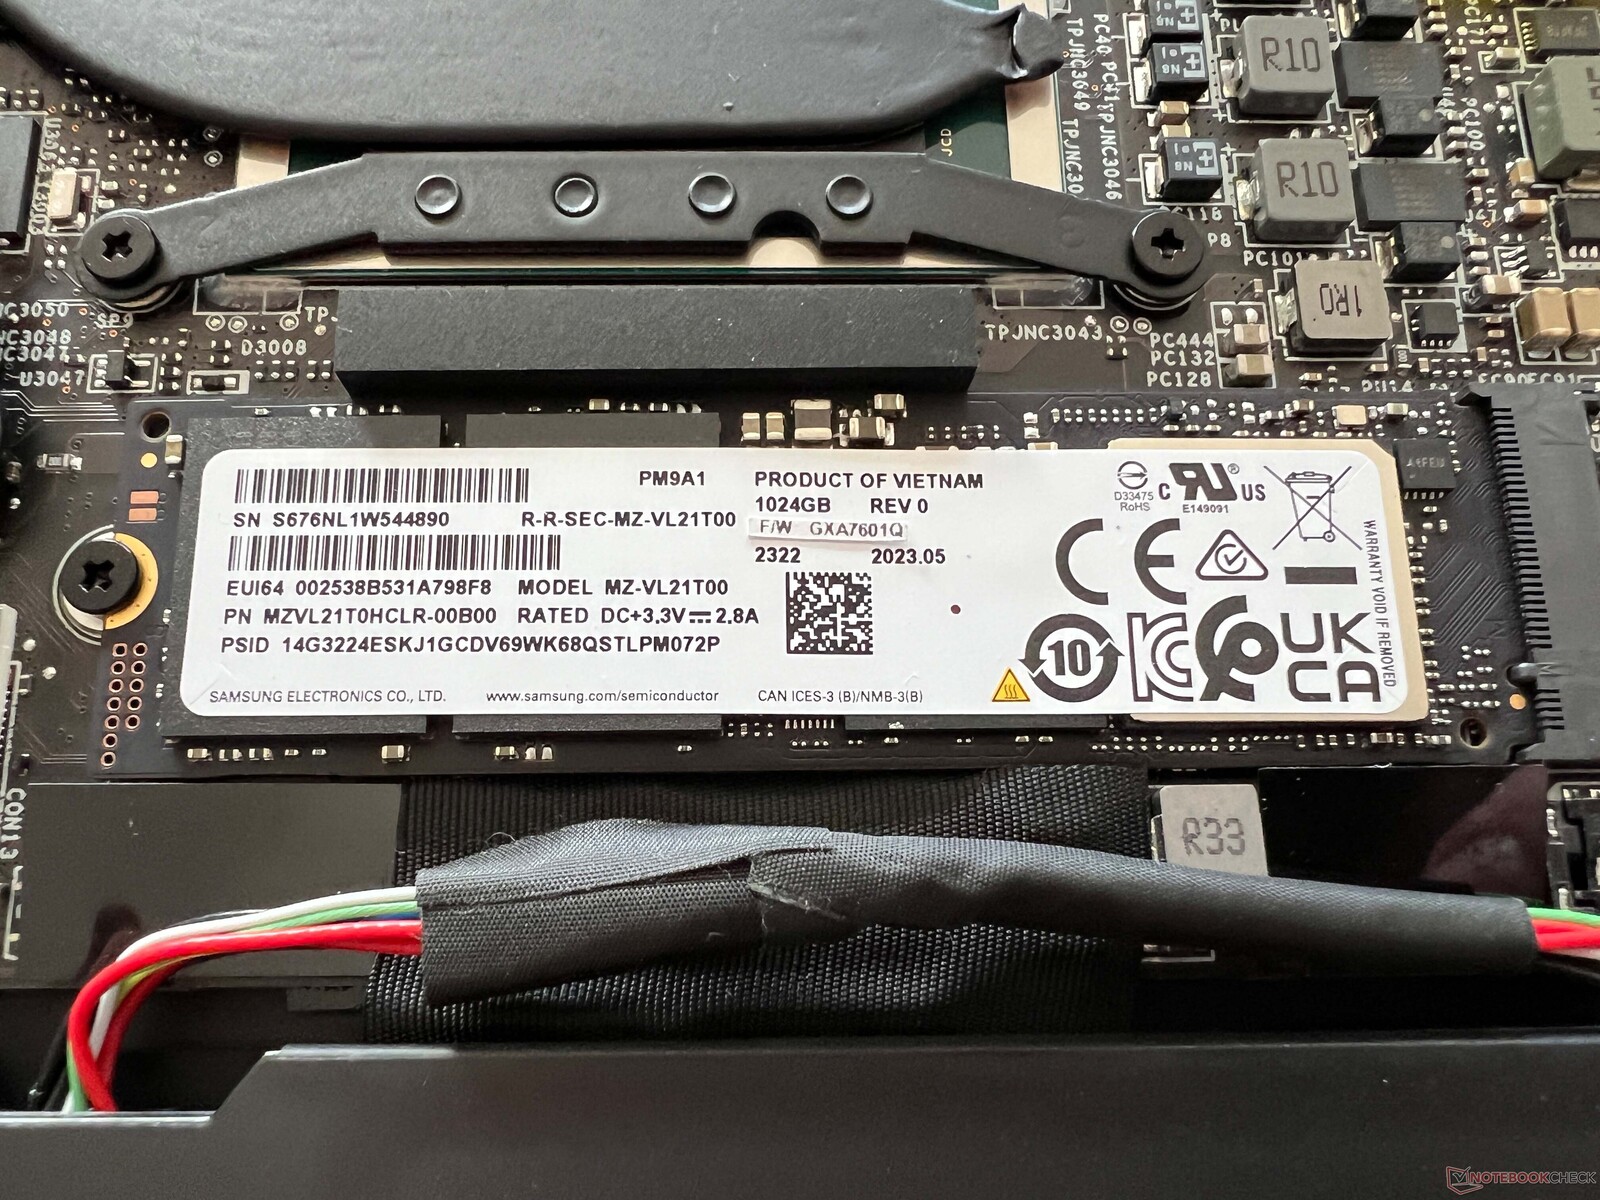
Dispositivos de armazenamento
Nosso dispositivo de teste está equipado com a versão de 1 TB do Samsung PM9A1 (versão OEM do 980 Pro), que é um dispositivo de armazenamento muito rápido. No entanto, seu desempenho não permanece constante sob carga permanente, mas isso não deve causar nenhum problema durante o uso diário. Após a primeira inicialização do dispositivo, os usuários têm 864 GB livres para usar. Outros benchmarks de SSD podem ser encontrados aqui.

* ... menor é melhor
Reading continuous performance: DiskSpd Read Loop, Queue Depth 8
Placa de vídeo
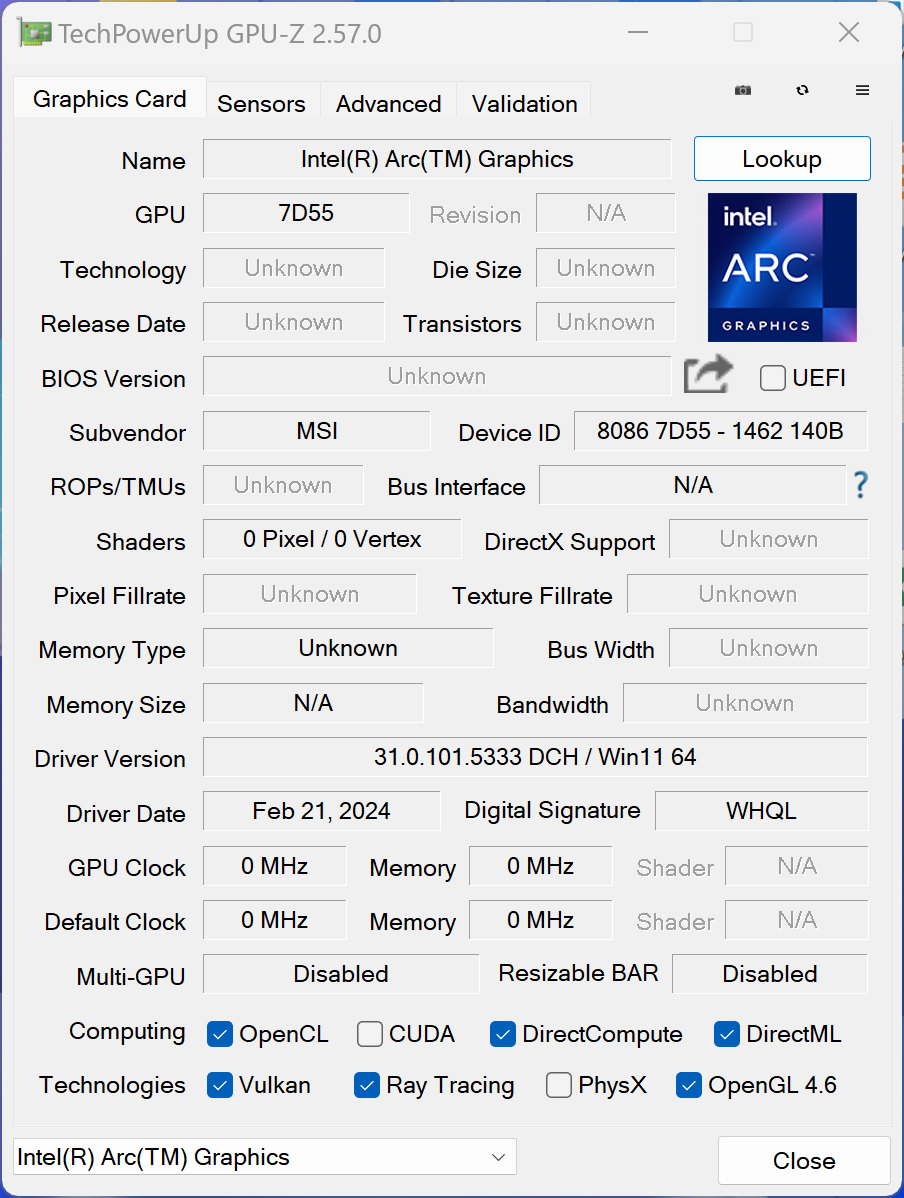
Em combinação com o Core Ultra 7 155Ha nova Intel Arc Graphics oferece 8 Xe-cores, no entanto, seu desempenho gráfico total no MSI Prestige 13 foi o pior de todos os novos notebooks Meteor-Lake que testamos até agora (-32% em comparação com a média em nosso banco de dados). Mesmo durante os benchmarks sintéticos, o MSI ficou apenas um pouco à frente do antigo Iris Xe Graphics G7. Quando se trata de tarefas cotidianas, como a reprodução de vídeos de alta resolução, a MSI não tem problemas, mas simplesmente não consegue usar a nova iGPU em todo o seu potencial.
Queremos mencionar um ponto positivo, ou seja, que o MSI não sofreu as mesmas quedas de quadros durante os testes de jogos que o Zenbook 14 ou o HP Spectre x360 14, por exemplo. Seu desempenho em jogos é bastante baixo em geral, mas é pelo menos estável. No uso da bateria, seu desempenho também permanece constante e outros benchmarks podem ser encontrados aqui.
| 3DMark 11 Performance | 8505 pontos | |
| 3DMark Fire Strike Score | 5203 pontos | |
| 3DMark Time Spy Score | 2178 pontos | |
Ajuda | ||
| Blender / v3.3 Classroom CPU | |
| Dell Latitude 13 7340 i5-1345U | |
| Asus ZenBook S13 OLED UX5304 | |
| HP Dragonfly G4 | |
| Lenovo ThinkPad X1 Nano Gen 3 | |
| MSI Prestige 13 AI Evo | |
| Média da turma Subnotebook (241 - 861, n=60, últimos 2 anos) | |
| Média Intel Arc 8-Core iGPU (294 - 692, n=43) | |
* ... menor é melhor
| Performance rating - Percent | |
| Média da turma Subnotebook | |
| MSI Prestige 13 AI Evo | |
| HP Dragonfly G4 | |
| Lenovo ThinkPad X1 Nano Gen 3 -1! | |
| Asus ZenBook S13 OLED UX5304 | |
| Dell Latitude 13 7340 i5-1345U | |
| The Witcher 3 - 1920x1080 Ultra Graphics & Postprocessing (HBAO+) | |
| Média da turma Subnotebook (13.9 - 34.6, n=13, últimos 2 anos) | |
| HP Dragonfly G4 | |
| MSI Prestige 13 AI Evo | |
| Lenovo ThinkPad X1 Nano Gen 3 | |
| Asus ZenBook S13 OLED UX5304 | |
| Dell Latitude 13 7340 i5-1345U | |
| GTA V - 1920x1080 Highest AA:4xMSAA + FX AF:16x | |
| Média da turma Subnotebook (10.7 - 43.7, n=56, últimos 2 anos) | |
| HP Dragonfly G4 | |
| MSI Prestige 13 AI Evo | |
| Asus ZenBook S13 OLED UX5304 | |
| Dell Latitude 13 7340 i5-1345U | |
| Final Fantasy XV Benchmark - 1920x1080 High Quality | |
| Média da turma Subnotebook (11.6 - 54.5, n=54, últimos 2 anos) | |
| MSI Prestige 13 AI Evo | |
| HP Dragonfly G4 | |
| Asus ZenBook S13 OLED UX5304 | |
| Lenovo ThinkPad X1 Nano Gen 3 | |
| Dell Latitude 13 7340 i5-1345U | |
| Strange Brigade - 1920x1080 ultra AA:ultra AF:16 | |
| Média da turma Subnotebook (19 - 101.3, n=50, últimos 2 anos) | |
| MSI Prestige 13 AI Evo | |
| HP Dragonfly G4 | |
| Asus ZenBook S13 OLED UX5304 | |
| Dell Latitude 13 7340 i5-1345U | |
| Lenovo ThinkPad X1 Nano Gen 3 | |
| Dota 2 Reborn - 1920x1080 ultra (3/3) best looking | |
| Média da turma Subnotebook (13 - 97, n=61, últimos 2 anos) | |
| HP Dragonfly G4 | |
| MSI Prestige 13 AI Evo | |
| Asus ZenBook S13 OLED UX5304 | |
| Dell Latitude 13 7340 i5-1345U | |
| Lenovo ThinkPad X1 Nano Gen 3 | |
| X-Plane 11.11 - 1920x1080 high (fps_test=3) | |
| Média da turma Subnotebook (20.7 - 50.5, n=53, últimos 2 anos) | |
| MSI Prestige 13 AI Evo | |
| Lenovo ThinkPad X1 Nano Gen 3 | |
| HP Dragonfly G4 | |
| Asus ZenBook S13 OLED UX5304 | |
| Dell Latitude 13 7340 i5-1345U | |
Witcher 3 FPS diagram
| baixo | média | alto | ultra | |
|---|---|---|---|---|
| GTA V (2015) | 99.1 | 93.8 | 26.2 | 9.97 |
| The Witcher 3 (2015) | 92 | 59 | 36 | 14.5 |
| Dota 2 Reborn (2015) | 89.9 | 75.9 | 57.7 | 53.3 |
| Final Fantasy XV Benchmark (2018) | 43.8 | 28 | 17 | |
| X-Plane 11.11 (2018) | 47.4 | 37.7 | 32.1 | |
| Far Cry 5 (2018) | 47 | 33 | 31 | 28 |
| Strange Brigade (2018) | 121 | 53 | 41 | 32 |
| F1 2021 (2021) | 94.8 | 50.8 | 41.3 | 20.3 |
| F1 22 (2022) | 59.1 | 49.6 | 36.8 | 9.33 |
| F1 23 (2023) | 44.1 | 36.3 | 27.1 | 7.45 |
Emissões - Alto-falantes fracos
Emissões de ruído
O laptop da MSI possui uma unidade de resfriamento composta por um tubo de calor e uma ventoinha que, infelizmente, funciona com frequência em baixa velocidade, mesmo quando o dispositivo está ocioso. Embora o ruído do zumbido não seja irritante, é possível ouvi-lo em ambientes mais silenciosos. Sob carga, a ventoinha atingiu rapidamente 32 dB(A) e, durante o teste de estresse, notamos 40 dB(A). Isso é tudo menos silencioso e, como se viu, nossa amostra de teste foi a mais barulhenta no campo de comparação. Usando a função CoolerBooster, a pequena ventoinha chegou a atingir 51 dB(A). Não notamos nenhum ruído eletrônico adicional.
Barulho
| Ocioso |
| 23.4 / 26.9 / 26.9 dB |
| Carga |
| 32 / 40.3 dB |
 | ||
30 dB silencioso 40 dB(A) audível 50 dB(A) ruidosamente alto |
||
min: | ||
| MSI Prestige 13 AI Evo Arc 8-Core, Ultra 7 155H, Samsung PM9A1 MZVL21T0HCLR | Lenovo ThinkPad X1 Nano Gen 3 Iris Xe G7 96EUs, i7-1360P, Lenovo UMIS AM6A0 RPJTJ512MKP1QDQ | Dell Latitude 13 7340 i5-1345U Iris Xe G7 80EUs, i5-1345U, Kioxia BG5 KBG50ZNS512G | HP Dragonfly G4 Iris Xe G7 96EUs, i7-1365U, Micron 3400 MTFDKBA512TFH 512GB | Asus ZenBook S13 OLED UX5304 Iris Xe G7 96EUs, i7-1355U, Samsung PM9A1 MZVL21T0HCLR | |
|---|---|---|---|---|---|
| Noise | 3% | -1% | 6% | -2% | |
| desligado / ambiente * (dB) | 23.4 | 22.9 2% | 25.02 -7% | 23.3 -0% | 23.3 -0% |
| Idle Minimum * (dB) | 23.4 | 23 2% | 25.02 -7% | 23.5 -0% | 23.3 -0% |
| Idle Average * (dB) | 26.9 | 23 14% | 25.02 7% | 23.5 13% | 23.3 13% |
| Idle Maximum * (dB) | 26.9 | 23 14% | 25.02 7% | 26.8 -0% | 23.3 13% |
| Load Average * (dB) | 32 | 32.8 -2% | 35.07 -10% | 27.2 15% | 37.7 -18% |
| Witcher 3 ultra * (dB) | 32 | 36.9 -15% | 32.7 -2% | 40.1 -25% | |
| Load Maximum * (dB) | 40.3 | 36.9 8% | 38.2 5% | 35 13% | 40.1 -0% |
* ... menor é melhor
Temperatura
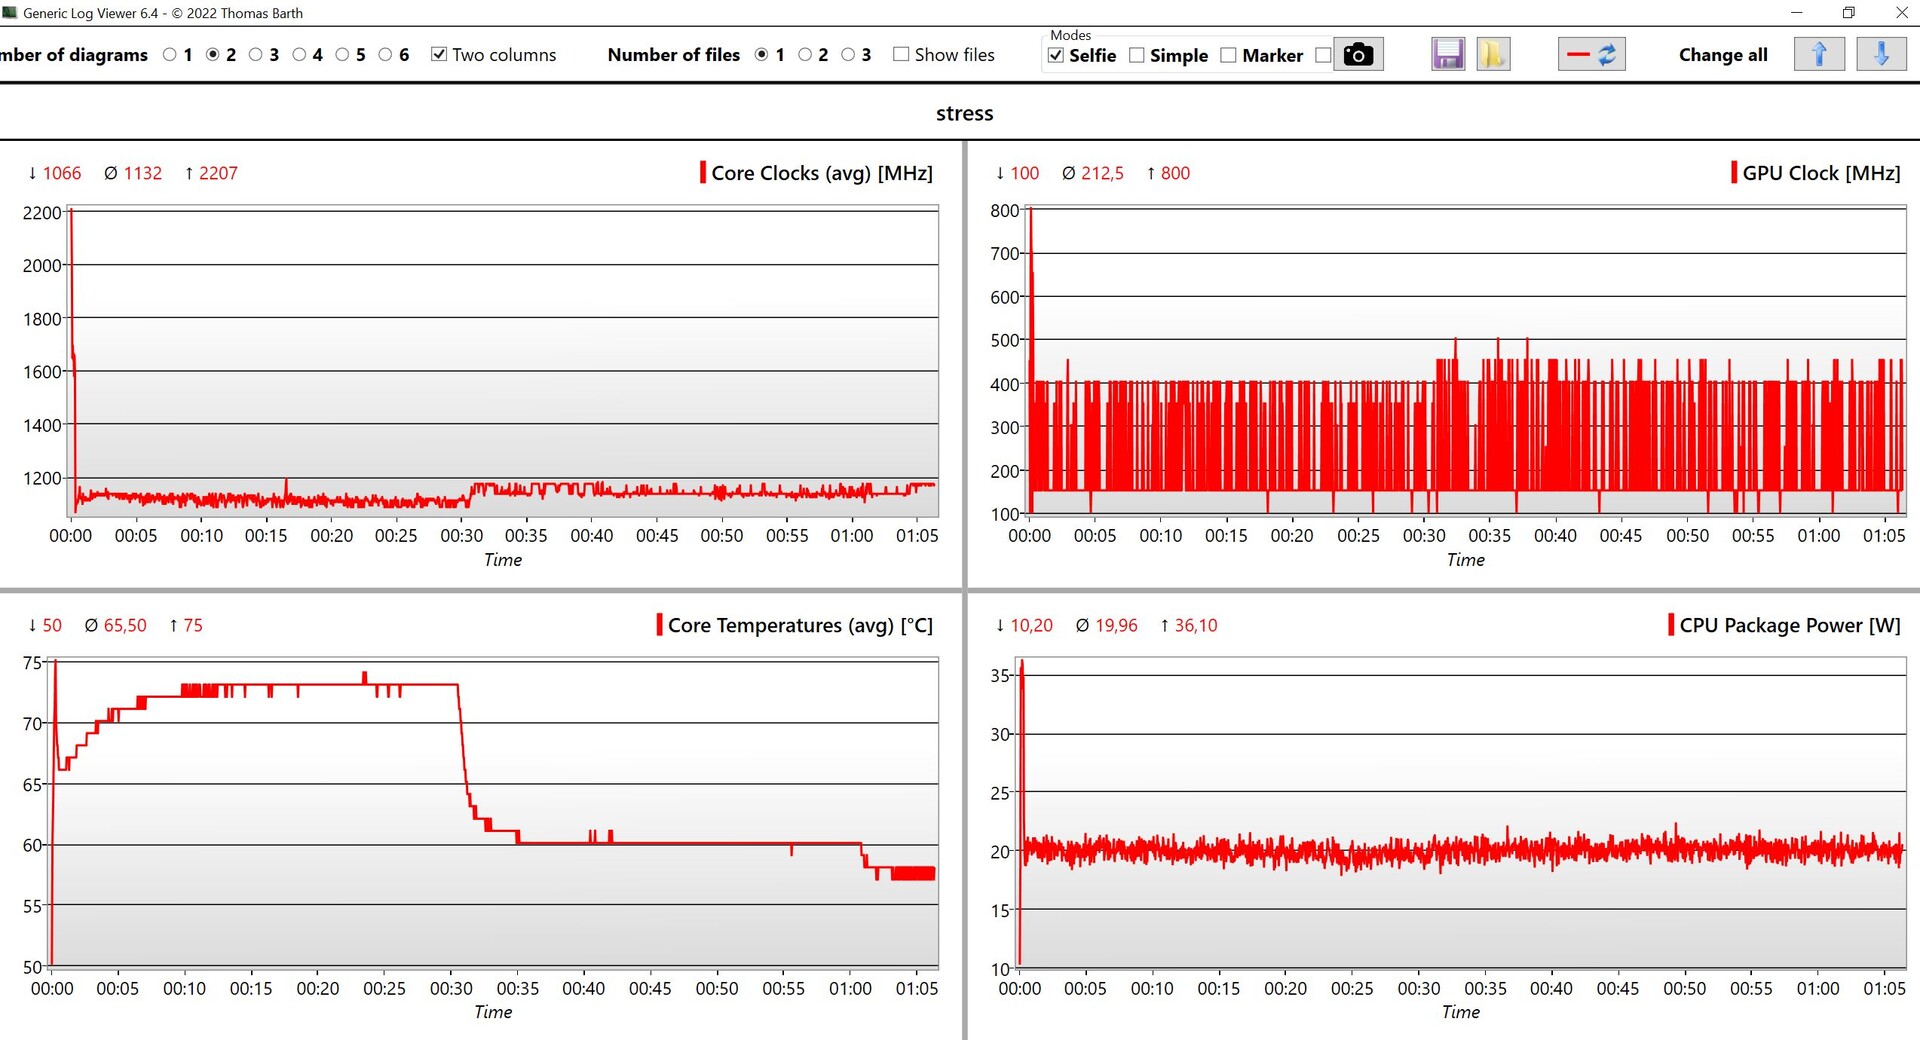
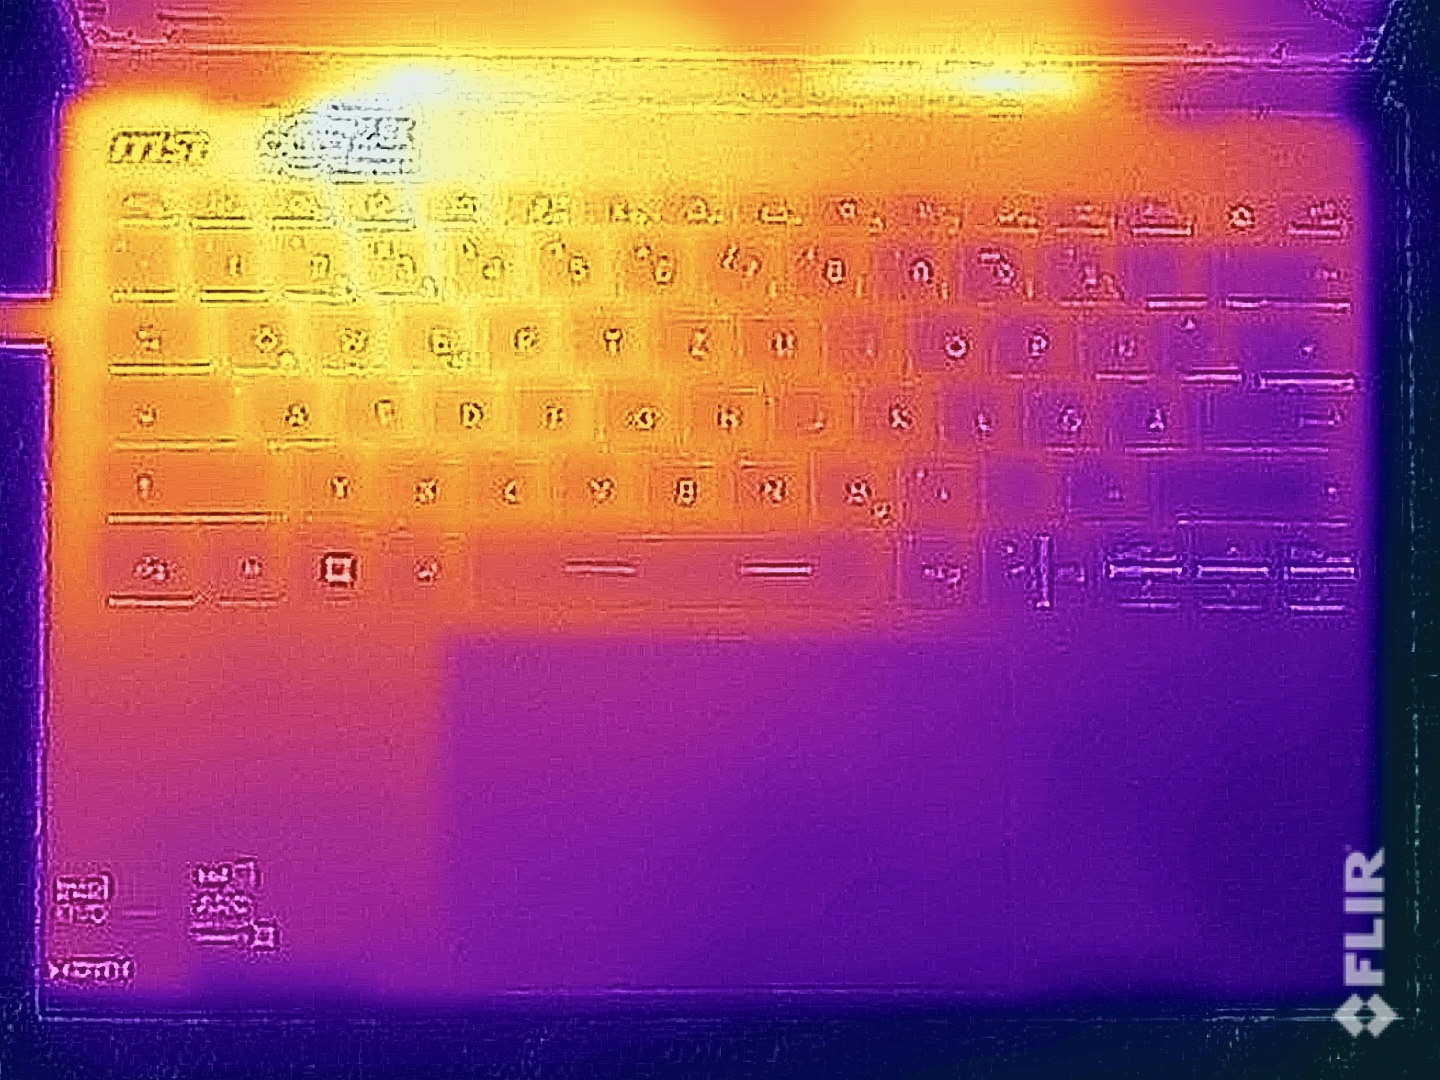
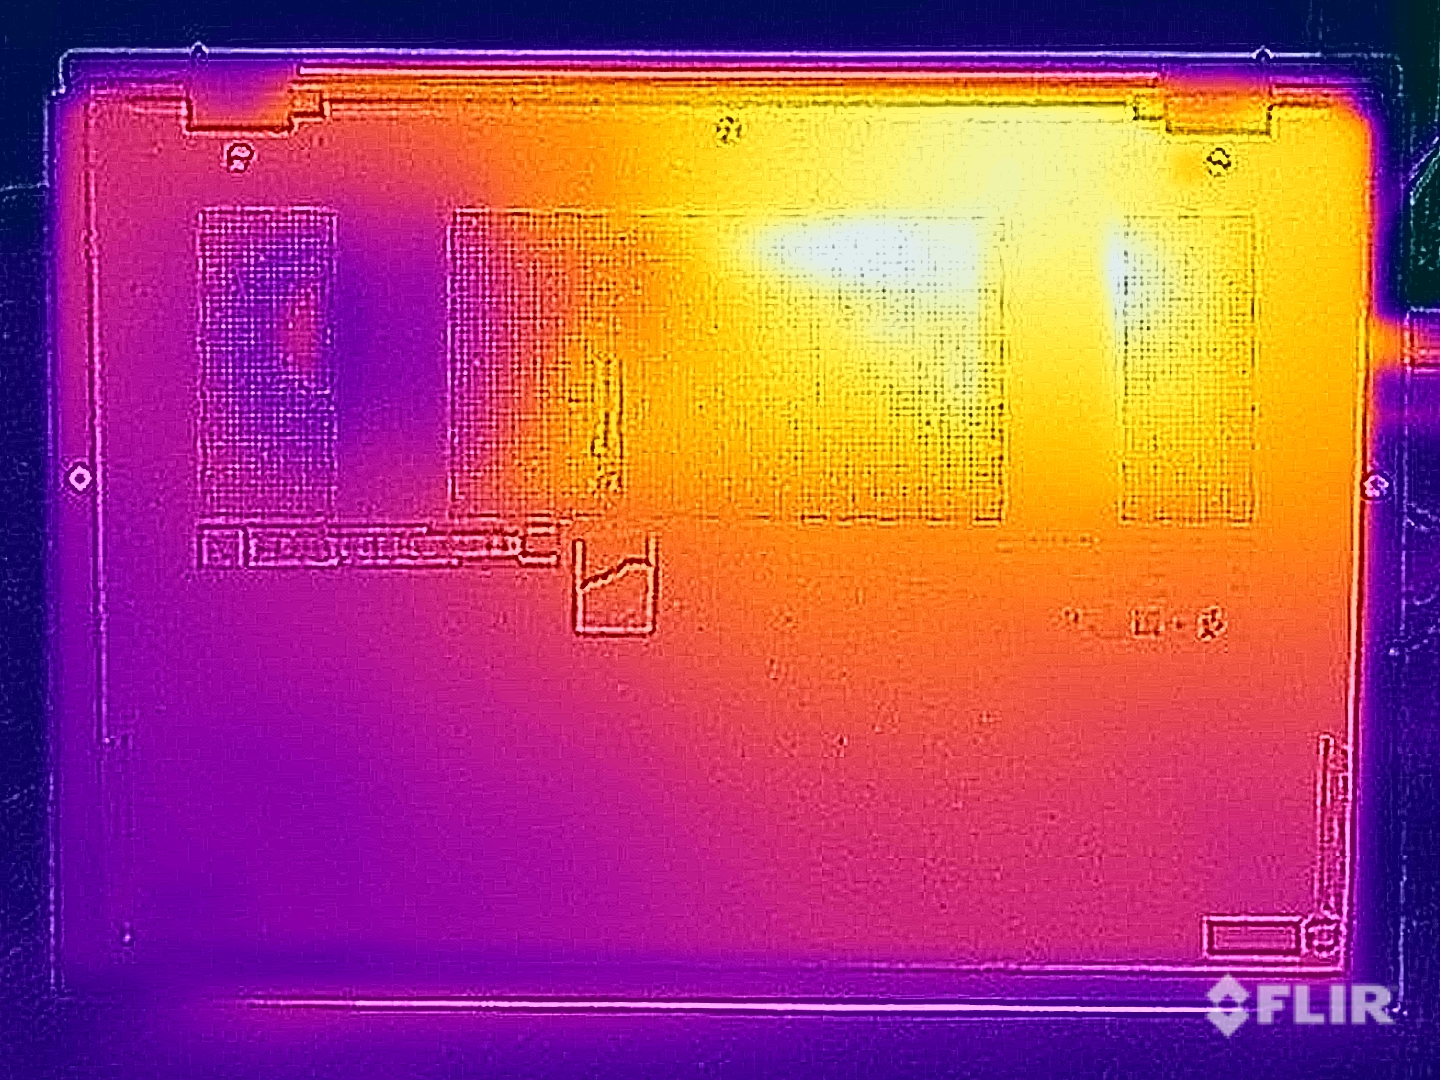
No uso diário, o Prestige 13 permanece frio e, mesmo durante o teste de estresse, medimos um máximo de 40 °C na parte superior e inferior da unidade base. O cooler está situado no lado esquerdo, e é por isso que essa área esquenta mais. Durante o teste de estresse, o consumo de energia da CPU rapidamente se equilibrou em 20 watts e depois permaneceu nesse nível.
(±) A temperatura máxima no lado superior é 40.9 °C / 106 F, em comparação com a média de 35.9 °C / 97 F , variando de 21.4 a 59 °C para a classe Subnotebook.
(±) A parte inferior aquece até um máximo de 40.4 °C / 105 F, em comparação com a média de 39.2 °C / 103 F
(+) Em uso inativo, a temperatura média para o lado superior é 23.3 °C / 74 F, em comparação com a média do dispositivo de 30.8 °C / ### class_avg_f### F.
(+) Jogando The Witcher 3, a temperatura média para o lado superior é 30.9 °C / 88 F, em comparação com a média do dispositivo de 30.8 °C / ## #class_avg_f### F.
(+) Os apoios para as mãos e o touchpad são mais frios que a temperatura da pele, com um máximo de 27.9 °C / 82.2 F e, portanto, são frios ao toque.
(±) A temperatura média da área do apoio para as mãos de dispositivos semelhantes foi 28.2 °C / 82.8 F (+0.3 °C / 0.6 F).
| MSI Prestige 13 AI Evo Intel Core Ultra 7 155H, Intel Arc 8-Core iGPU | Lenovo ThinkPad X1 Nano Gen 3 Intel Core i7-1360P, Intel Iris Xe Graphics G7 96EUs | Dell Latitude 13 7340 i5-1345U Intel Core i5-1345U, Intel Iris Xe Graphics G7 80EUs | HP Dragonfly G4 Intel Core i7-1365U, Intel Iris Xe Graphics G7 96EUs | Asus ZenBook S13 OLED UX5304 Intel Core i7-1355U, Intel Iris Xe Graphics G7 96EUs | |
|---|---|---|---|---|---|
| Heat | -4% | -1% | -5% | -9% | |
| Maximum Upper Side * (°C) | 40.9 | 44 -8% | 34.3 16% | 38.6 6% | 43.1 -5% |
| Maximum Bottom * (°C) | 40.4 | 43.2 -7% | 37.6 7% | 40.4 -0% | 45 -11% |
| Idle Upper Side * (°C) | 25 | 25.6 -2% | 28.4 -14% | 28.2 -13% | 27.3 -9% |
| Idle Bottom * (°C) | 25.5 | 25.6 -0% | 28.8 -13% | 29 -14% | 27.8 -9% |
* ... menor é melhor
Alto-falantes
Os alto-falantes estéreo são os aspectos mais fracos do subnotebook compacto. Seu volume máximo pode ser decente, mas o som em si não tem muita dimensão e claramente não tem o que muitos dos concorrentes do dispositivo podem oferecer.
MSI Prestige 13 AI Evo análise de áudio
(±) | o volume do alto-falante é médio, mas bom (###valor### dB)
Graves 100 - 315Hz
(-) | quase nenhum baixo - em média 20.5% menor que a mediana
(±) | a linearidade dos graves é média (8.4% delta para a frequência anterior)
Médios 400 - 2.000 Hz
(±) | médios mais altos - em média 6.1% maior que a mediana
(+) | médios são lineares (5.9% delta para frequência anterior)
Altos 2 - 16 kHz
(+) | agudos equilibrados - apenas 4.7% longe da mediana
(+) | os máximos são lineares (5.4% delta da frequência anterior)
Geral 100 - 16.000 Hz
(±) | a linearidade do som geral é média (19% diferença em relação à mediana)
Comparado com a mesma classe
» 58% de todos os dispositivos testados nesta classe foram melhores, 6% semelhantes, 36% piores
» O melhor teve um delta de 5%, a média foi 18%, o pior foi 53%
Comparado com todos os dispositivos testados
» 45% de todos os dispositivos testados foram melhores, 7% semelhantes, 48% piores
» O melhor teve um delta de 4%, a média foi 23%, o pior foi 134%
Dell Latitude 13 7340 i5-1345U análise de áudio
(+) | os alto-falantes podem tocar relativamente alto (###valor### dB)
Graves 100 - 315Hz
(±) | graves reduzidos - em média 6.2% menor que a mediana
(±) | a linearidade dos graves é média (9.6% delta para a frequência anterior)
Médios 400 - 2.000 Hz
(+) | médios equilibrados - apenas 2.3% longe da mediana
(+) | médios são lineares (5.1% delta para frequência anterior)
Altos 2 - 16 kHz
(±) | máximos mais altos - em média 5.6% maior que a mediana
(±) | a linearidade dos máximos é média (7.9% delta para frequência anterior)
Geral 100 - 16.000 Hz
(+) | o som geral é linear (9% diferença em relação à mediana)
Comparado com a mesma classe
» 4% de todos os dispositivos testados nesta classe foram melhores, 1% semelhantes, 95% piores
» O melhor teve um delta de 5%, a média foi 18%, o pior foi 53%
Comparado com todos os dispositivos testados
» 3% de todos os dispositivos testados foram melhores, 1% semelhantes, 96% piores
» O melhor teve um delta de 4%, a média foi 23%, o pior foi 134%
HP Dragonfly G4 análise de áudio
(+) | os alto-falantes podem tocar relativamente alto (###valor### dB)
Graves 100 - 315Hz
(±) | graves reduzidos - em média 8.4% menor que a mediana
(±) | a linearidade dos graves é média (11.6% delta para a frequência anterior)
Médios 400 - 2.000 Hz
(+) | médios equilibrados - apenas 2.3% longe da mediana
(+) | médios são lineares (4.8% delta para frequência anterior)
Altos 2 - 16 kHz
(+) | agudos equilibrados - apenas 3.2% longe da mediana
(+) | os máximos são lineares (4.6% delta da frequência anterior)
Geral 100 - 16.000 Hz
(+) | o som geral é linear (9.1% diferença em relação à mediana)
Comparado com a mesma classe
» 4% de todos os dispositivos testados nesta classe foram melhores, 1% semelhantes, 95% piores
» O melhor teve um delta de 5%, a média foi 18%, o pior foi 53%
Comparado com todos os dispositivos testados
» 3% de todos os dispositivos testados foram melhores, 1% semelhantes, 96% piores
» O melhor teve um delta de 4%, a média foi 23%, o pior foi 134%
Gerenciamento de energia - Boa resistência com uma bateria de 75 Wh
Consumo de energia
Não notamos nenhuma discrepância durante as medições de consumo e o consumo máximo do laptop em modo inativo é de cerca de 9 watts. Como acontece com todos os painéis OLED, o senhor deve se certificar de definir imagens de fundo mais escuras e usar o modo escuro do Windows para ajudar a minimizar o consumo de energia. Sob carga, a fonte de alimentação atinge seu limite de 65 watts por um curto período, depois se equilibra rapidamente em 33 watts e, durante o teste de estresse, permaneceu nesse nível.
| desligado | |
| Ocioso | |
| Carga |
|
Key:
min: | |
| MSI Prestige 13 AI Evo Ultra 7 155H, Arc 8-Core, Samsung PM9A1 MZVL21T0HCLR, OLED, 2880x1800, 13.3" | Lenovo ThinkPad X1 Nano Gen 3 i7-1360P, Iris Xe G7 96EUs, Lenovo UMIS AM6A0 RPJTJ512MKP1QDQ, IPS, 2160x1350, 13" | Dell Latitude 13 7340 i5-1345U i5-1345U, Iris Xe G7 80EUs, Kioxia BG5 KBG50ZNS512G, IPS, 1920x1200, 13.3" | HP Dragonfly G4 i7-1365U, Iris Xe G7 96EUs, Micron 3400 MTFDKBA512TFH 512GB, IPS, 1920x1280, 13.5" | Asus ZenBook S13 OLED UX5304 i7-1355U, Iris Xe G7 96EUs, Samsung PM9A1 MZVL21T0HCLR, OLED, 2880x1800, 13.3" | Média Intel Arc 8-Core iGPU | Média da turma Subnotebook | |
|---|---|---|---|---|---|---|---|
| Power Consumption | 6% | 3% | -1% | -3% | -28% | 5% | |
| Idle Minimum * (Watt) | 4.5 | 3.3 27% | 2.37 47% | 4.1 9% | 5.8 -29% | 5.31 ? -18% | 3.76 ? 16% |
| Idle Average * (Watt) | 8 | 6.5 19% | 6.19 23% | 7.5 6% | 8.5 -6% | 8.56 ? -7% | 6.54 ? 18% |
| Idle Maximum * (Watt) | 8.7 | 7.1 18% | 14.1 -62% | 8.2 6% | 8.8 -1% | 11.9 ? -37% | 7.89 ? 9% |
| Load Average * (Watt) | 36.1 | 40.7 -13% | 36.3 -1% | 35.5 2% | 35.1 3% | 53.6 ? -48% | 42 ? -16% |
| Witcher 3 ultra * (Watt) | 29.7 | 37 -25% | 24.9 16% | 37.5 -26% | 27.6 7% | ||
| Load Maximum * (Watt) | 65 | 58.6 10% | 69.13 -6% | 66.5 -2% | 59.5 8% | 84.2 ? -30% | 64.8 ? -0% |
* ... menor é melhor
Power consumption Witcher 3 / stress test
Power consumption with external monitor
Tempos de execução
Apesar de seu baixo peso, a MSI instalou uma bateria de 75 Wh, que proporciona bons tempos de funcionamento, apesar do painel OLED do laptop. Embora seus equivalentes IPS geralmente funcionem por mais tempo, ele foi capaz de superar o Zenbook S13 OLED da Asus por uma pequena distância. Durante nosso teste de WLAN a 150 cd/m² (57% do brilho SDR máximo do dispositivo), a amostra de teste funcionou por cerca de 11,5 horas e, com brilho total, por cerca de 7,5 horas. É possível reproduzir vídeos por 16,5 horas (150 cd/m²), enquanto um vídeo HDR com brilho total pode ser executado por 6 horas. Uma carga completa leva 220 minutos com o dispositivo ligado, sendo que 80% de sua capacidade está disponível após 114 minutos.
| MSI Prestige 13 AI Evo Ultra 7 155H, Arc 8-Core, 75 Wh | Lenovo ThinkPad X1 Nano Gen 3 i7-1360P, Iris Xe G7 96EUs, 49.5 Wh | Dell Latitude 13 7340 i5-1345U i5-1345U, Iris Xe G7 80EUs, 57 Wh | HP Dragonfly G4 i7-1365U, Iris Xe G7 96EUs, 68 Wh | Asus ZenBook S13 OLED UX5304 i7-1355U, Iris Xe G7 96EUs, 63 Wh | Média da turma Subnotebook | |
|---|---|---|---|---|---|---|
| Duração da bateria | -33% | 17% | 26% | -11% | -6% | |
| H.264 (h) | 16.7 | 13.8 -17% | 15.4 ? -8% | |||
| WiFi v1.3 (h) | 11.6 | 7.8 -33% | 15 29% | 15.9 37% | 11.3 -3% | 14 ? 21% |
| Load (h) | 2.8 | 2.9 4% | 3.2 14% | 2.4 -14% | 1.969 ? -30% |
Pro
Contra
Veredicto - O MSI Prestige 13 impressiona pelo seu baixo peso e pelo painel OLED

O foco do novo MSI Prestige 13 AI Evo está claramente na portabilidade e, nesse aspecto, o nosso dispositivo de teste, com sua construção leve e bons tempos de execução, prova ser um sucesso. Além disso, seu painel OLED oferece uma qualidade de imagem excepcional, incluindo algumas vantagens em comparação com muitos modelos IPS; no entanto, ele não é perfeito se o seu objetivo for editar fotos. Se o senhor costuma trabalhar em movimento, os reflexos do painel brilhante também podem atrapalhar.
Seus dados técnicos na forma do novo Core Ultra 7 155H prometem muito desempenho, mas, na realidade, esse é o modelo Meteor-Lake-H mais lento que testamos até agora. Para o uso diário, ele deve ser suficiente em muitos casos, mas o senhor não deve se esquecer de como o dispositivo ainda está longe de seu potencial real de desempenho (CPU e GPU). A RAM não pode ser atualizada, mas, mesmo assim, 32 GB devem ser mais do que suficientes para a maioria dos usuários (afinal, não se trata de uma estação de trabalho).
O MSI Prestige 13 AI Evo pesa menos de 1 quilo e, mesmo assim, o senhor não precisa se contentar com ótimos tempos de execução, muitas portas e um painel OLED. Apesar de seu processador Meteor Lake, o desempenho do dispositivo ainda não é o melhor - além disso, seu cooler está quase sempre ativo no uso diário.
Quando se trata das portas e da conectividade do laptop, incluindo Wi-Fi 7 e um leitor de cartão rápido, não temos muito do que reclamar, embora seu gabinete compacto também exija alguns compromissos. Isso inclui a unidade de resfriamento que consiste em apenas um ventilador, que também está quase sempre ativo, o que torna um dispositivo realmente silencioso uma raridade. Além disso, o teclado parece um pouco apertado, mesmo que a mecânica em si seja boa. Por fim, seus fracos alto-falantes deixam mais a desejar e a concorrência oferece algumas vantagens claras nesse aspecto.
O HP Dragonfly G4 é provavelmente o maior concorrente do Prestige 13 e, além de seus melhores alto-falantes, também apresenta um teclado melhor e tempos de execução mais longos - mas, em contrapartida, tem um painel IPS (sem PWM) com uma resolução mais baixa e uma qualidade de imagem subjetivamente pior. Seu MRSP é mais alto, mas talvez o senhor já consiga encontrá-lo por um preço mais baixo on-line.
Preço e disponibilidade
O MSI Prestige 13 AI Evo pode ser encontrado atualmente na Amazon por US$ 1.280,71.
MSI Prestige 13 AI Evo
- 03/06/2024 v7 (old)
Andreas Osthoff
Transparência
A seleção dos dispositivos a serem analisados é feita pela nossa equipe editorial. A amostra de teste foi fornecida ao autor como empréstimo pelo fabricante ou varejista para fins desta revisão. O credor não teve influência nesta revisão, nem o fabricante recebeu uma cópia desta revisão antes da publicação. Não houve obrigação de publicar esta revisão. Como empresa de mídia independente, a Notebookcheck não está sujeita à autoridade de fabricantes, varejistas ou editores.
É assim que o Notebookcheck está testando
Todos os anos, o Notebookcheck analisa de forma independente centenas de laptops e smartphones usando procedimentos padronizados para garantir que todos os resultados sejam comparáveis. Desenvolvemos continuamente nossos métodos de teste há cerca de 20 anos e definimos padrões da indústria no processo. Em nossos laboratórios de teste, equipamentos de medição de alta qualidade são utilizados por técnicos e editores experientes. Esses testes envolvem um processo de validação em vários estágios. Nosso complexo sistema de classificação é baseado em centenas de medições e benchmarks bem fundamentados, o que mantém a objetividade.Price comparison

