Análise do laptop HP Dragonfly G4: Pequenas atualizações em relação ao já excelente Dragonfly G3

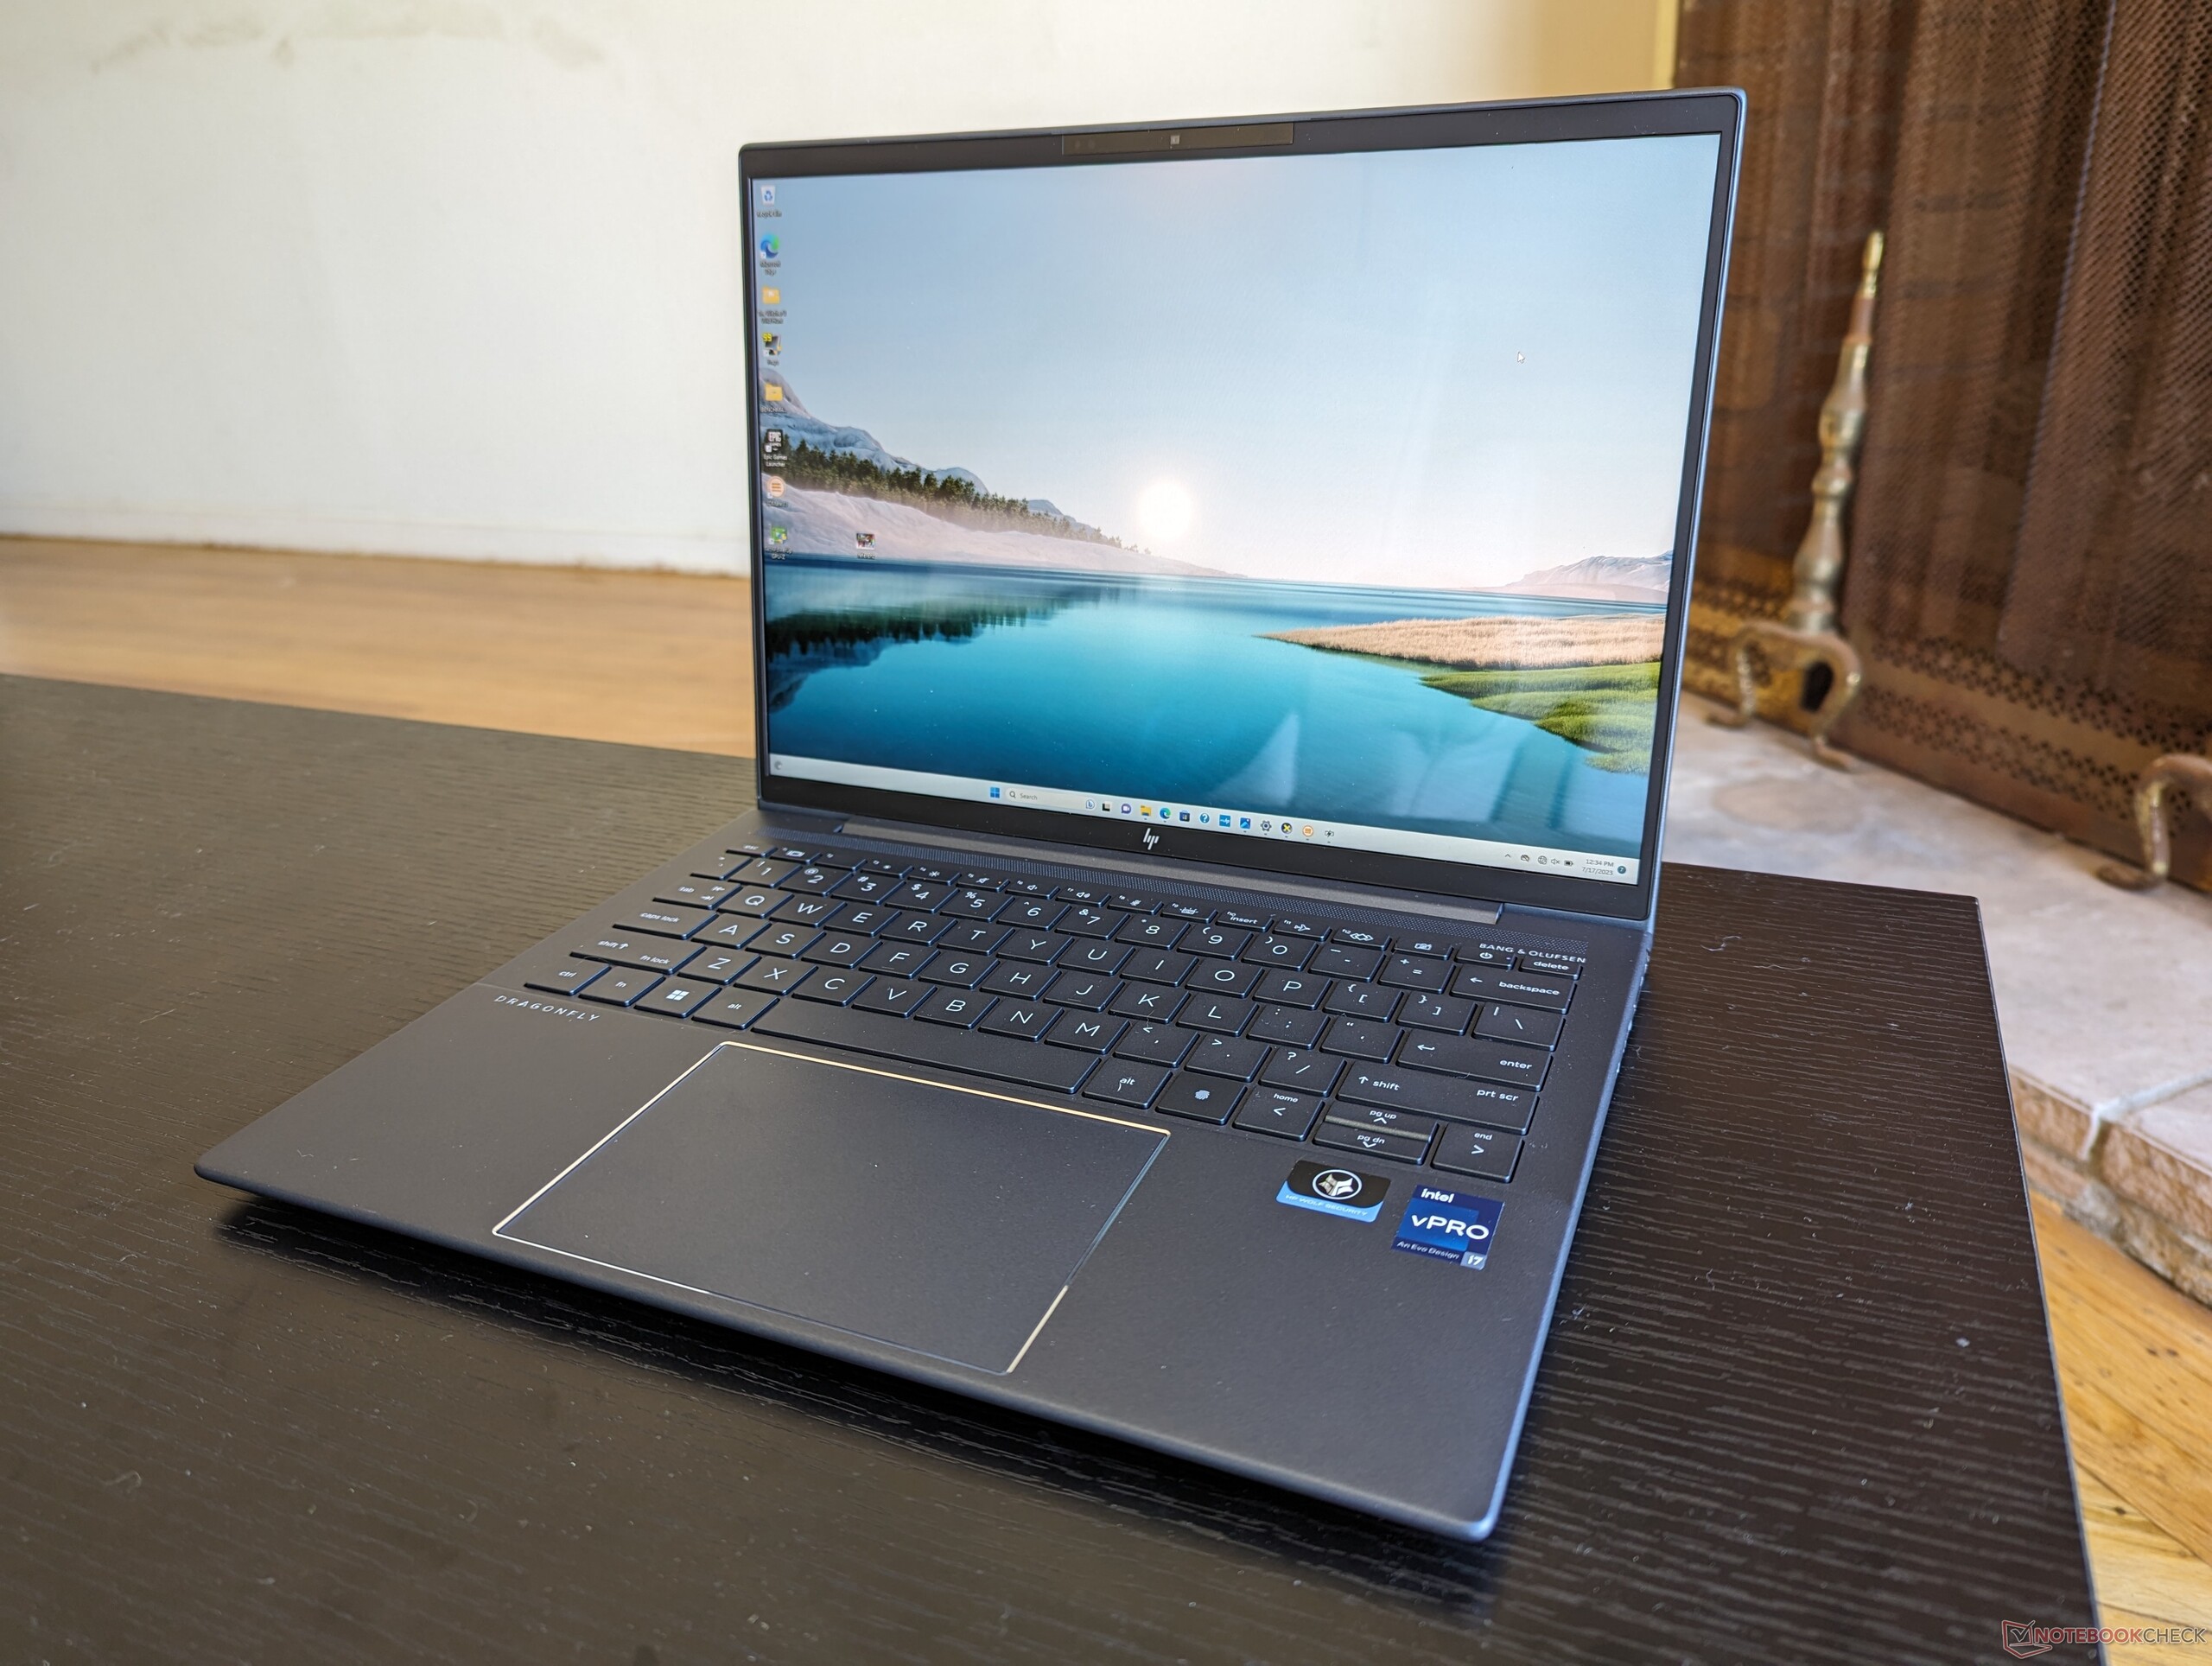
O Dragonfly G4 sucede diretamente o Elite Dragonfly G3 do ano passado, abandonando oficialmente o apelido "Elite" e substituindo as opções Alder Lake-U de 12ª geração pelas opções Raptor Lake-U de 13ª geração. Fora isso, o chassi externo permanece idêntico em relação ao ano anterior e, por isso, recomendamos conferir nossa análise do Elite Dragonfly G3 para saber mais sobre os recursos físicos do laptop.
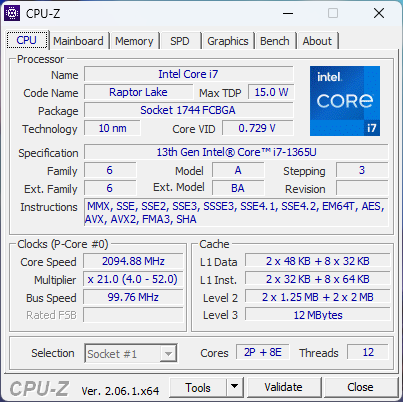
Nossa unidade de análise é uma configuração de médio porte com CPU Core i7-1365U e tela IPS sem toque de 1280p e 400 nit por aproximadamente US$ 1.700. Outras SKUs variam do Core i5-1335U até a tela OLED de 3000 x 2000 a partir de US$ 1300 até quase US$ 2400, dependendo da RAM e do armazenamento.
O Dragonfly G4 concorre diretamente com outros notebooks ultrafinos de alta qualidade para uso pessoal ou comercial, como o Lenovo ThinkPad X13 G3, Dell Latitude 9330, Microsoft Surface seriesou o Asus ZenBook S 13.
Mais análises da HP:
Possíveis concorrentes em comparação
Avaliação | Data | Modelo | Peso | Altura | Size | Resolução | Preço |
|---|---|---|---|---|---|---|---|
| 91.9 % v7 (old) | 07/2023 | HP Dragonfly G4 i7-1365U, Iris Xe G7 96EUs | 1.1 kg | 16.3 mm | 13.50" | 1920x1280 | |
| 91 % v7 (old) | 08/2022 | HP Elite Dragonfly G3 i7-1265U, Iris Xe G7 96EUs | 1.2 kg | 16.3 mm | 13.50" | 1920x1280 | |
| 86.2 % v7 (old) | 05/2023 | Framework Laptop 13.5 13th Gen Intel i7-1370P, Iris Xe G7 96EUs | 1.3 kg | 15.85 mm | 13.50" | 2256x1504 | |
| 90.6 % v7 (old) | 06/2023 | Lenovo ThinkPad X13 G3 21CM002UGE R5 PRO 6650U, Radeon 660M | 1.3 kg | 18.1 mm | 13.30" | 1920x1200 | |
| 89 % v7 (old) | 11/2022 | Dell Latitude 9330 i7-1260U, Iris Xe G7 96EUs | 1.2 kg | 14.1 mm | 13.30" | 2560x1600 | |
| 92.3 % v7 (old) | 07/2022 | Apple MacBook Air M2 Entry M2, M2 8-Core GPU | 1.2 kg | 11.3 mm | 13.60" | 2560x1664 |
Caso - parte prosumer, parte business
Comunicação
Webcam
Os notebooks HP Spectre, EliteBook e Dragonfly continuam a ser fornecidos com webcams de 5 MP ou mais, proporcionando imagens visivelmente mais nítidas do que as webcams da maioria dos outros notebooks, onde os sensores de 1 MP e 2 MP ainda são comuns. O IR e um obturador de privacidade são padrão.
O software da câmera HP agora suporta correção de distorção para cortar ou achatar um feed de vídeo para compartilhar quadros brancos ou papéis, câmera automática com tecnologia de IA para manter seus olhos focados na câmera em vez de na tela e suporte a várias câmeras para transmitir dois feeds de vídeo simultaneamente.


Manutenção
Ao contrário da maioria dos outros fabricantes, a HP envia vídeos muito úteis sobre como fazer a manutenção ou desmontar muitos de seus laptops, incluindo o Dragonfly G4. Recomendamos que você confira o vídeoabaixo para ver a desmontagem completa.
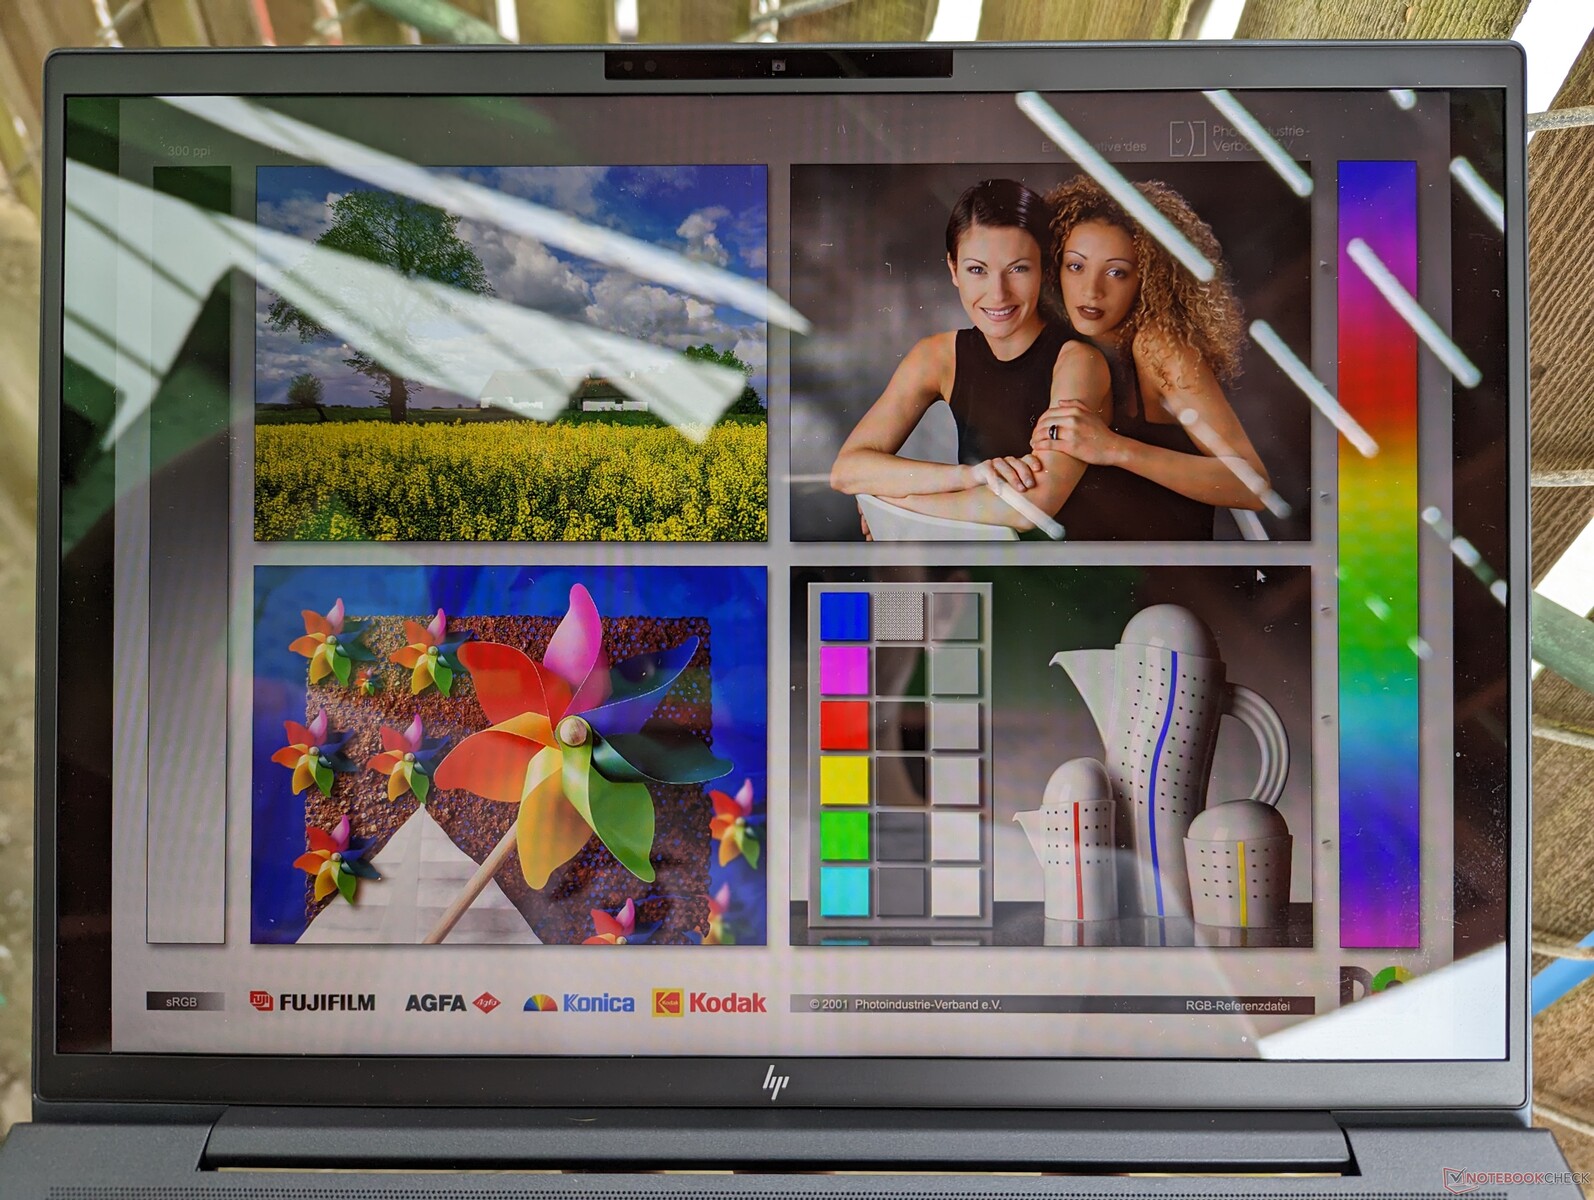
Tela
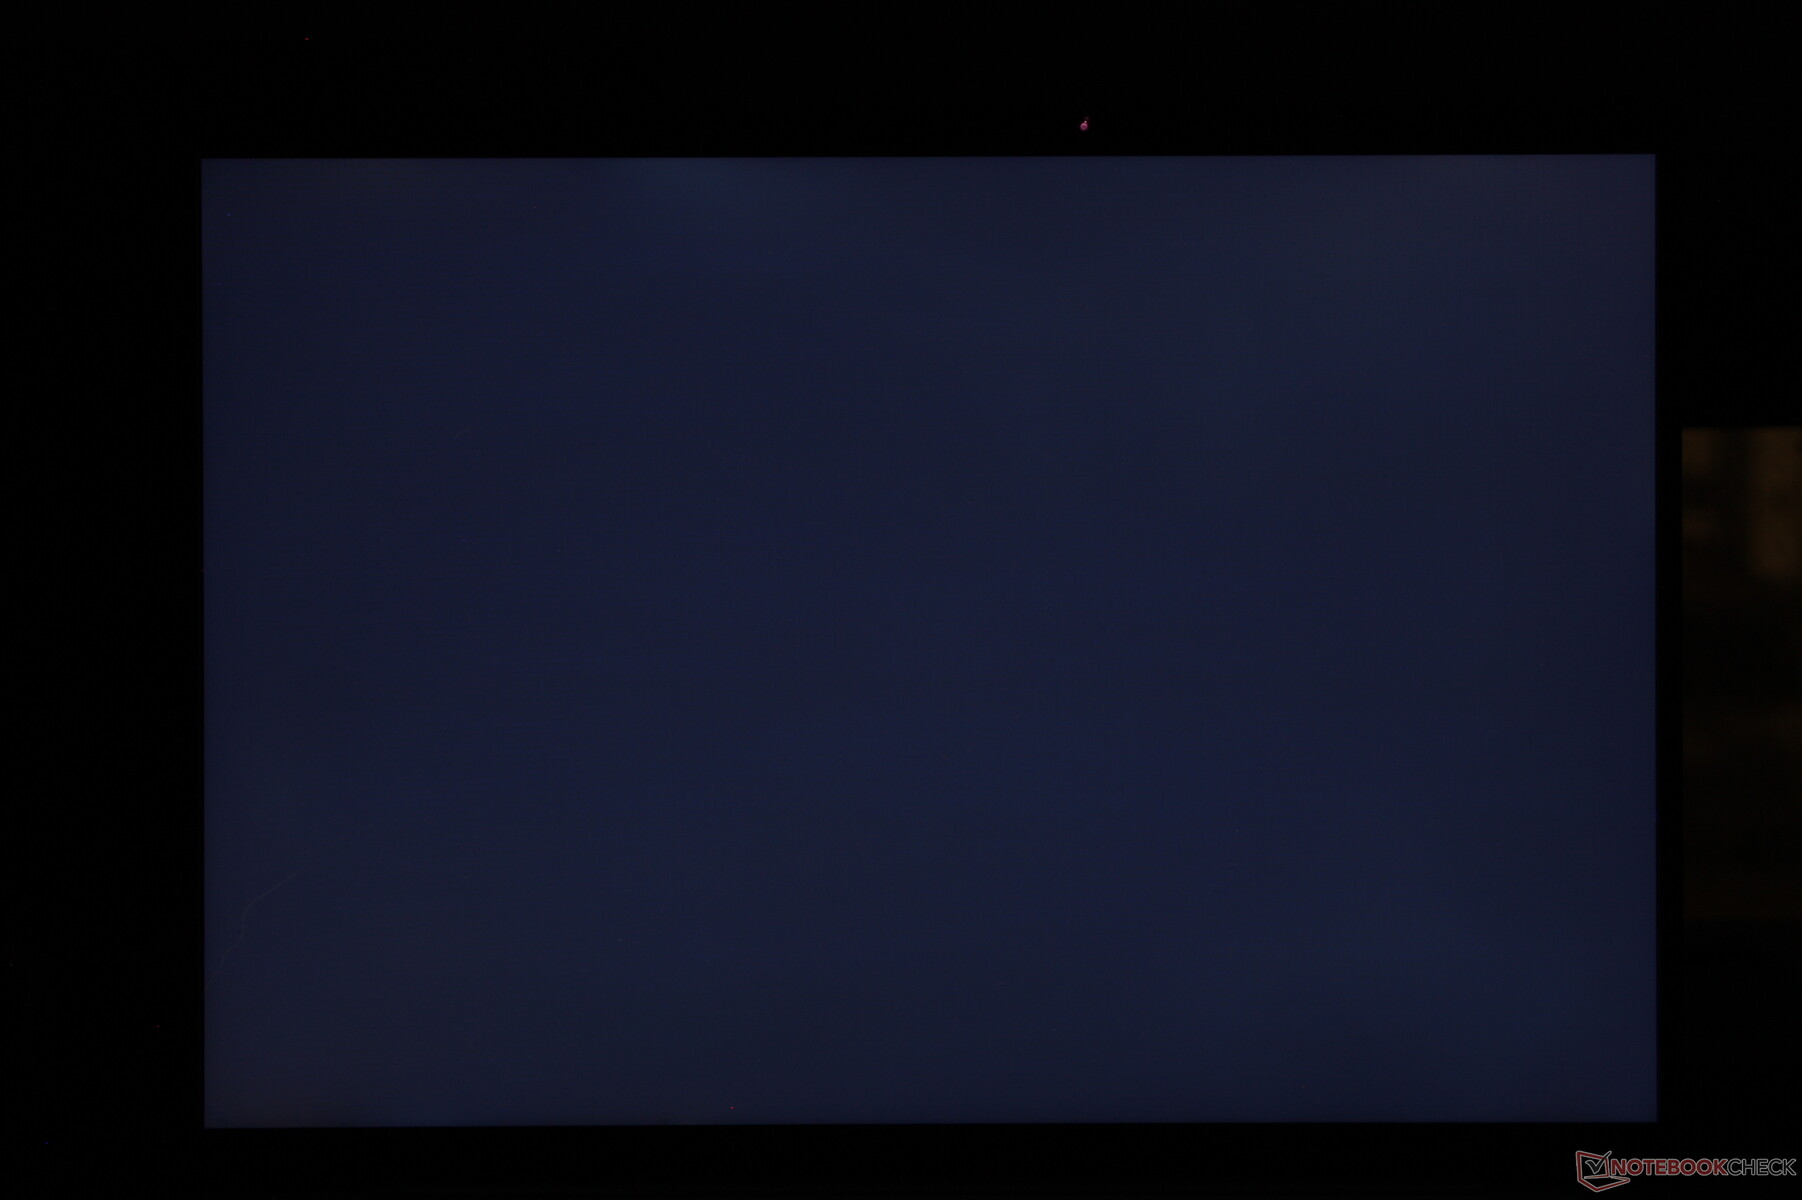
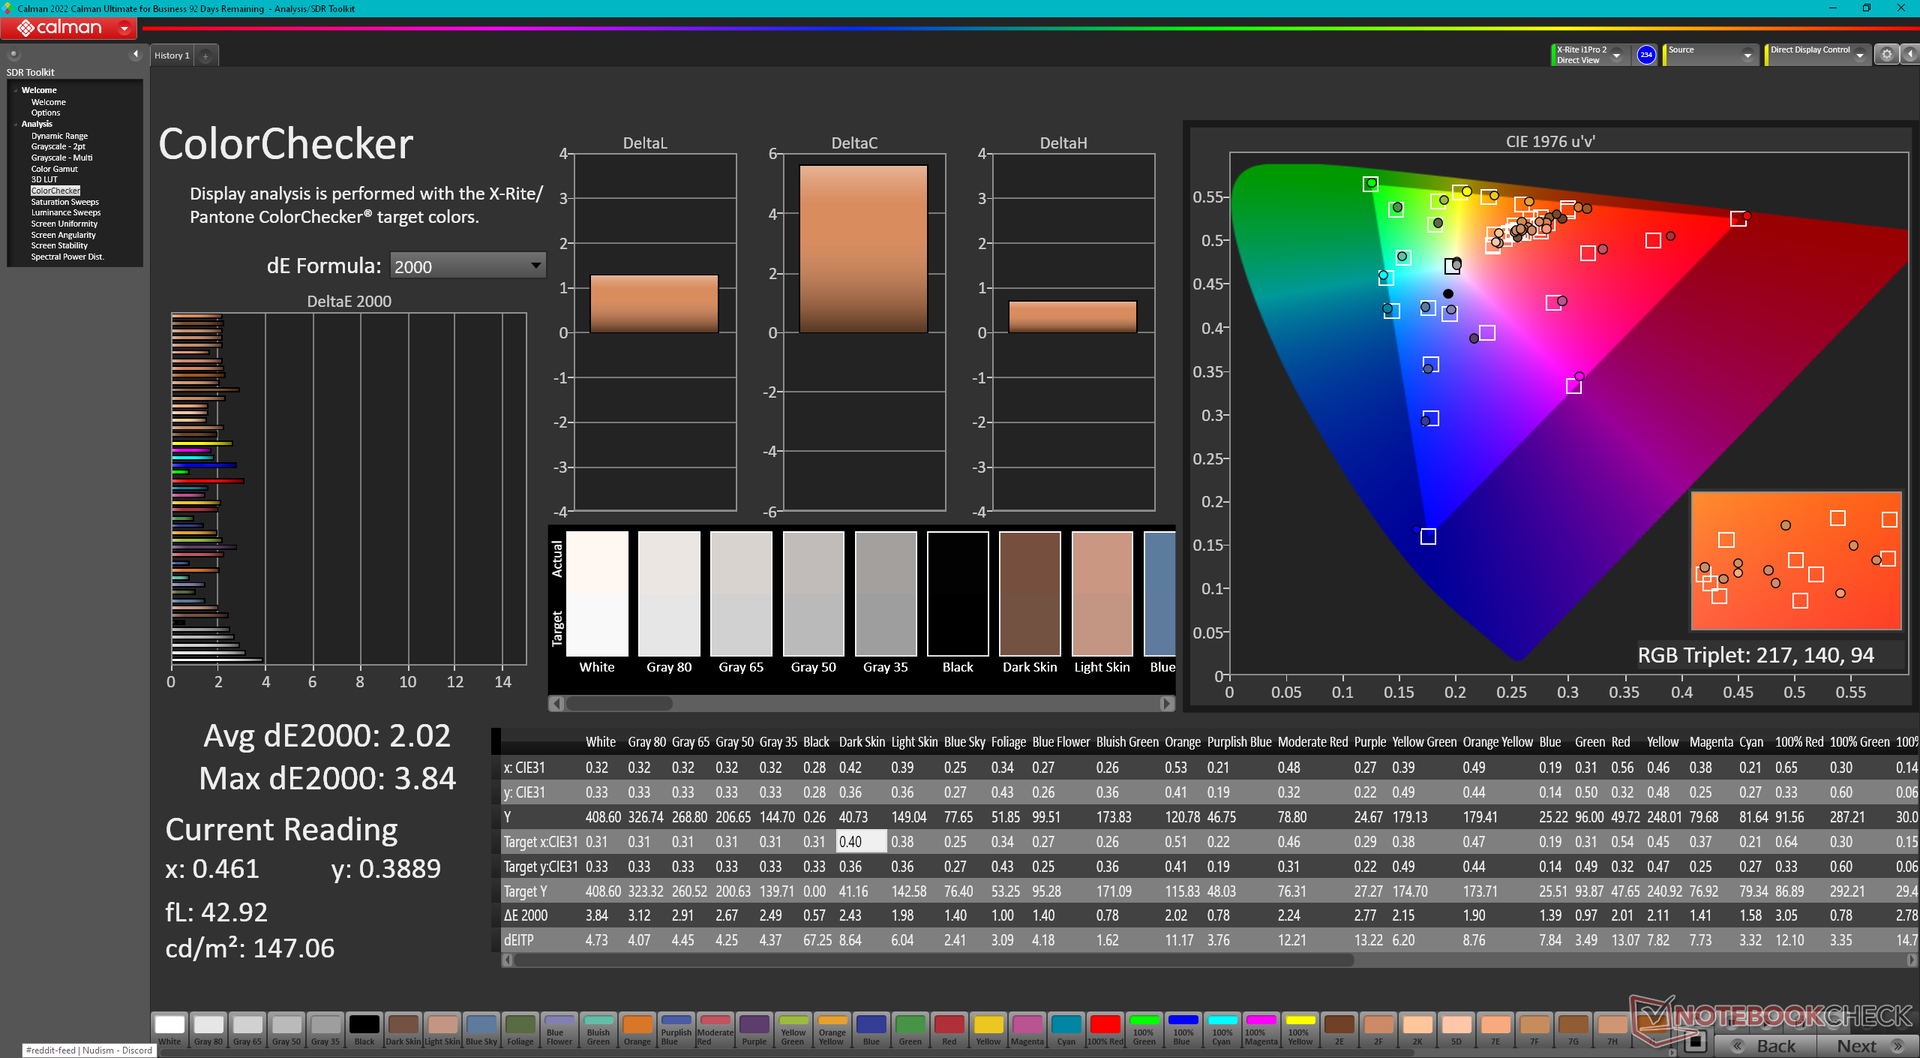
O modelo oferece seis opções de tela que variam de IPS de 1280p a OLED de 2000p. As opções de tela sensível ao toque, Sure View e 1000 nits também estão disponíveis, mas somente para determinadas configurações IPS de 1280p. Nossa unidade de teste vem com o painel básico Chi Mei CMN13C0 de 1280p e 400 nits, que é idêntico ao que a HP ofereceu no Dragonfly G3. Portanto, a experiência de visualização ano a ano permanece idêntica.

| |||||||||||||||||||||||||
iluminação: 90 %
iluminação com acumulador: 408.8 cd/m²
Contraste: 1278:1 (Preto: 0.32 cd/m²)
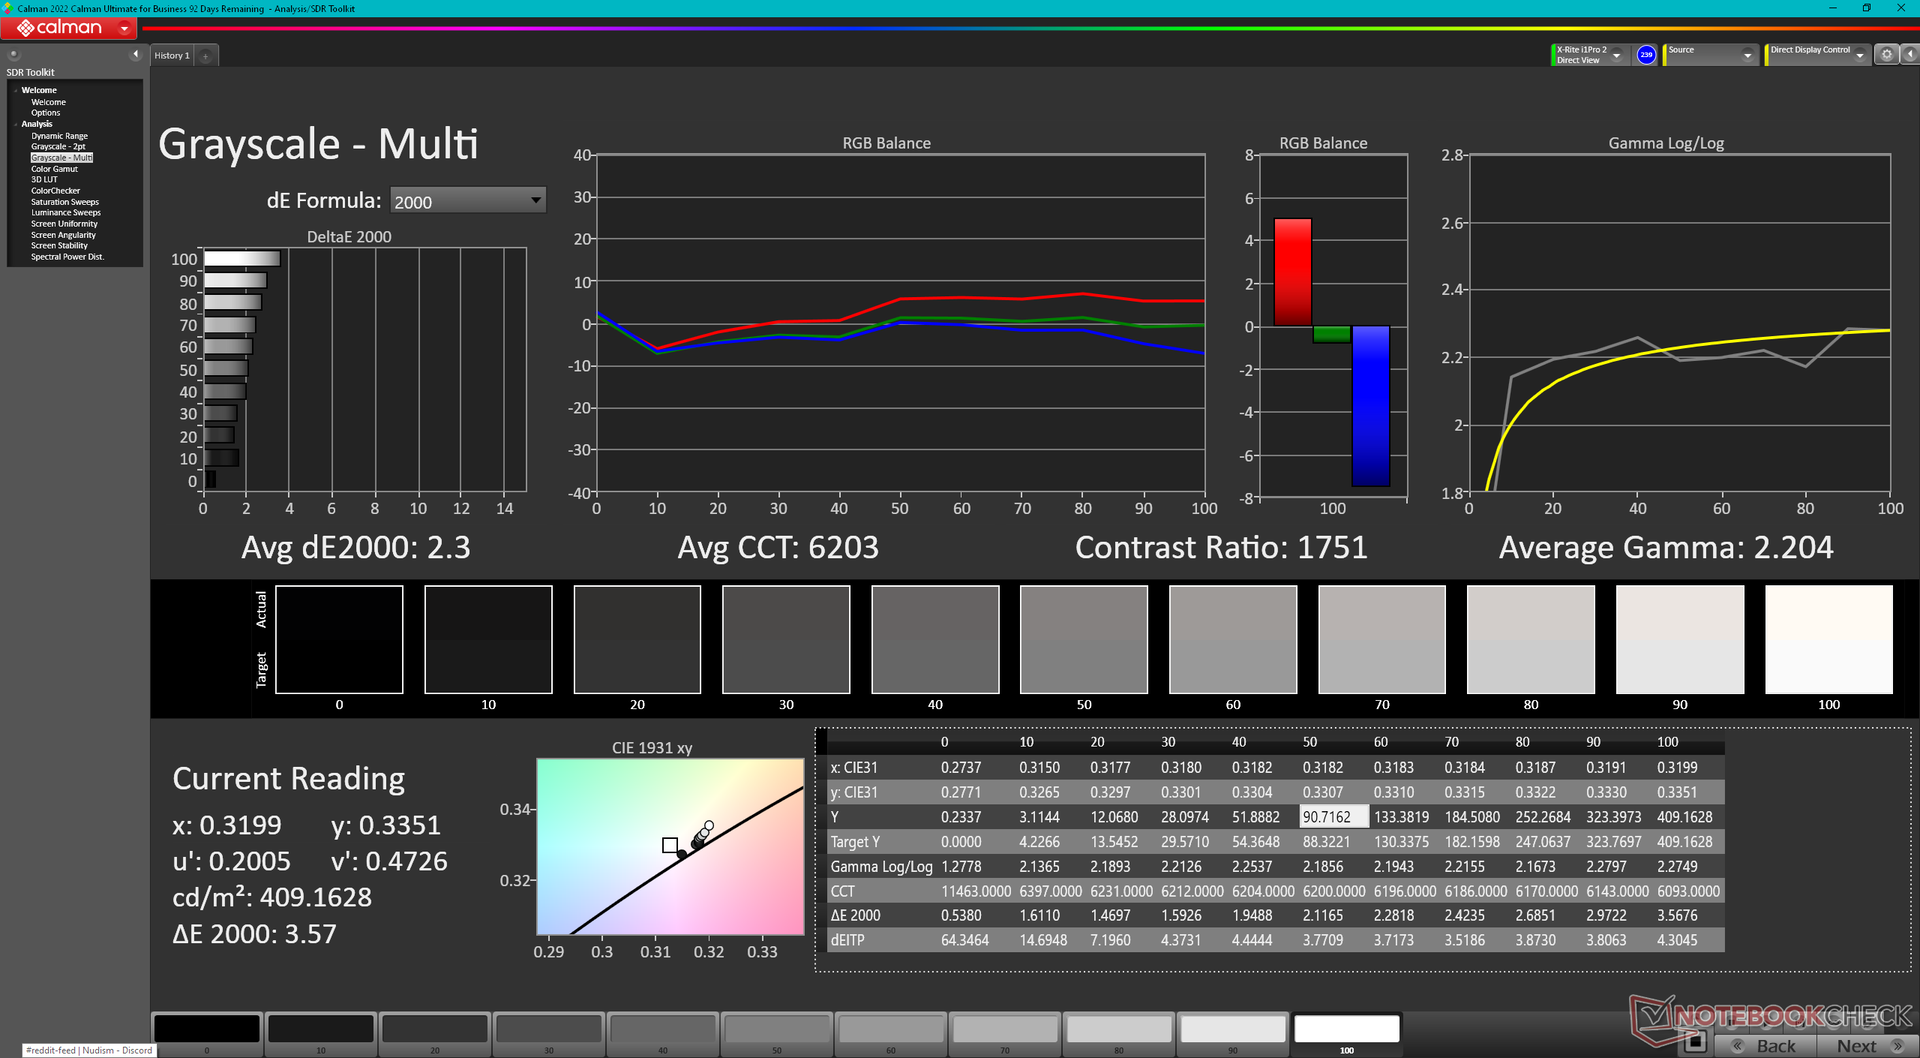
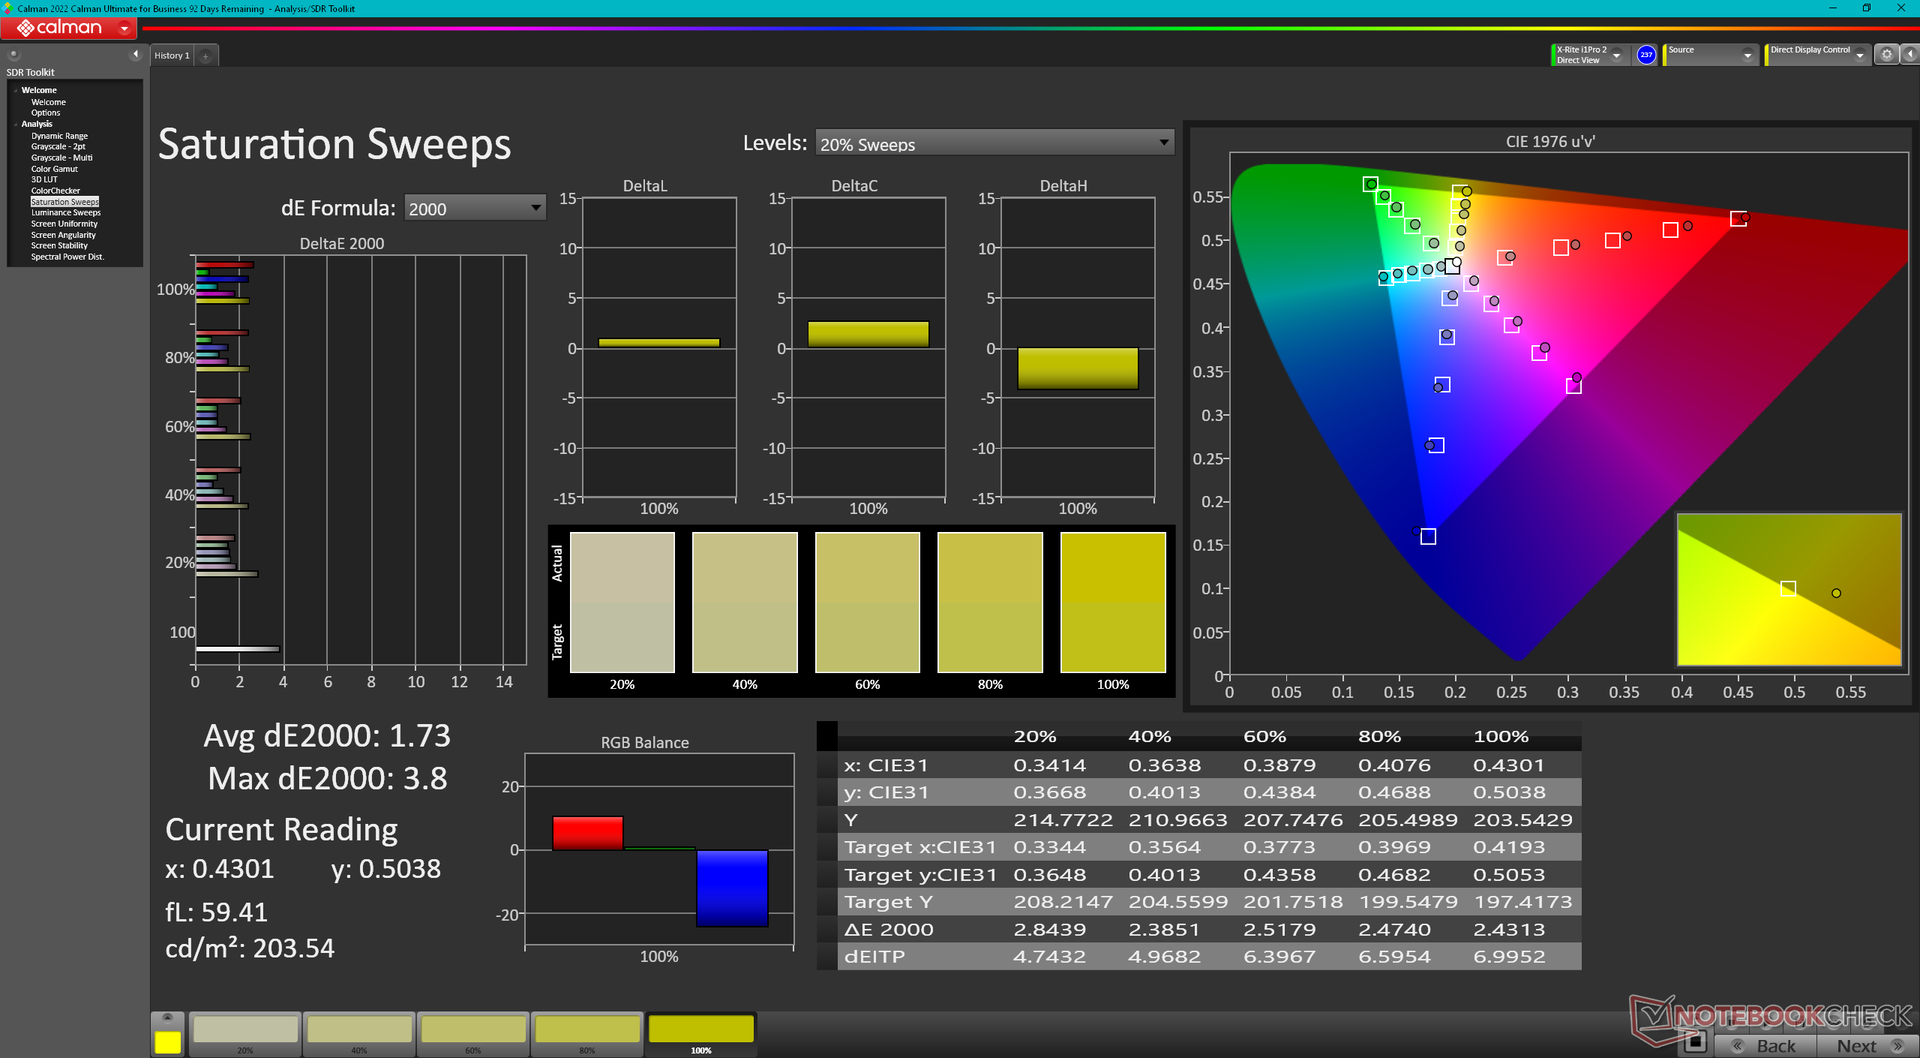
ΔE ColorChecker Calman: 2.02 | ∀{0.5-29.43 Ø4.71}
calibrated: 0.61
ΔE Greyscale Calman: 2.3 | ∀{0.09-98 Ø4.96}
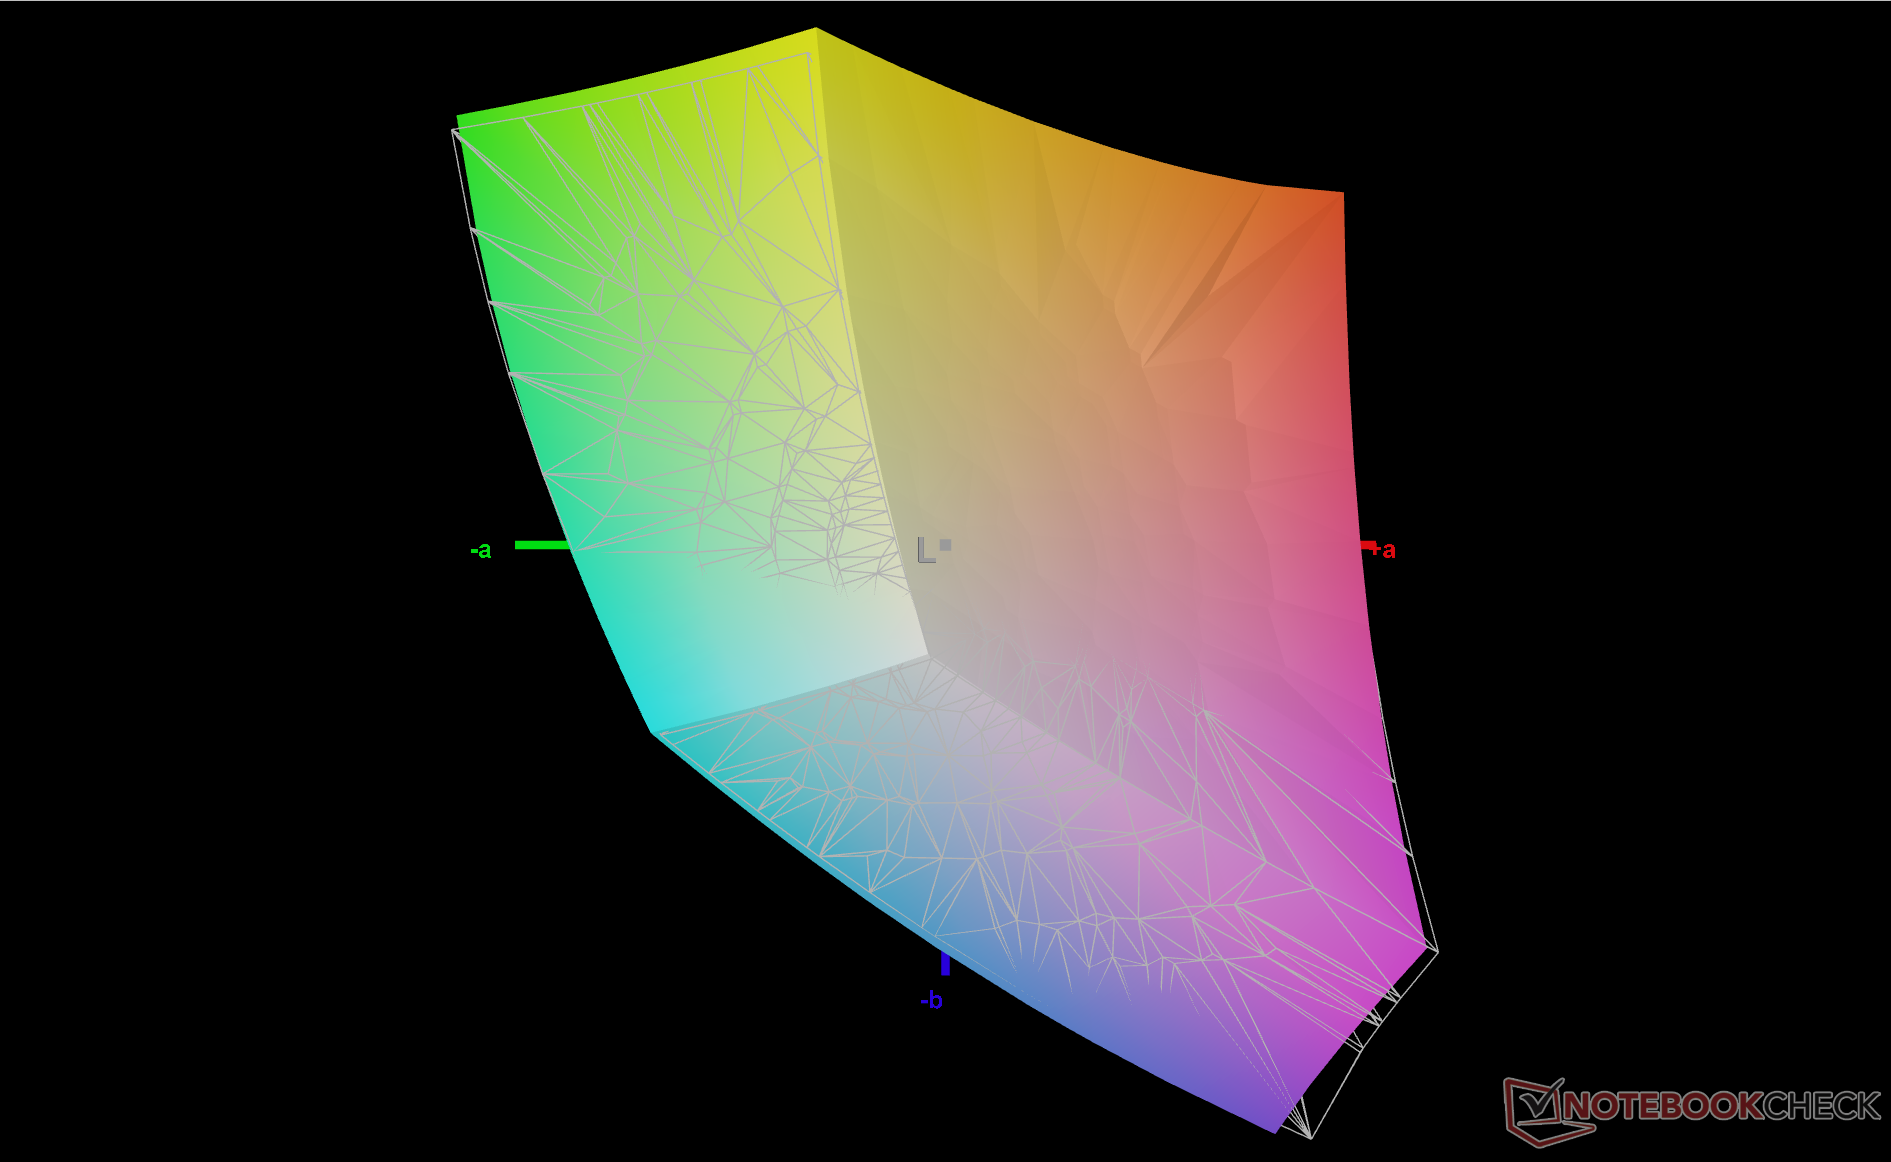
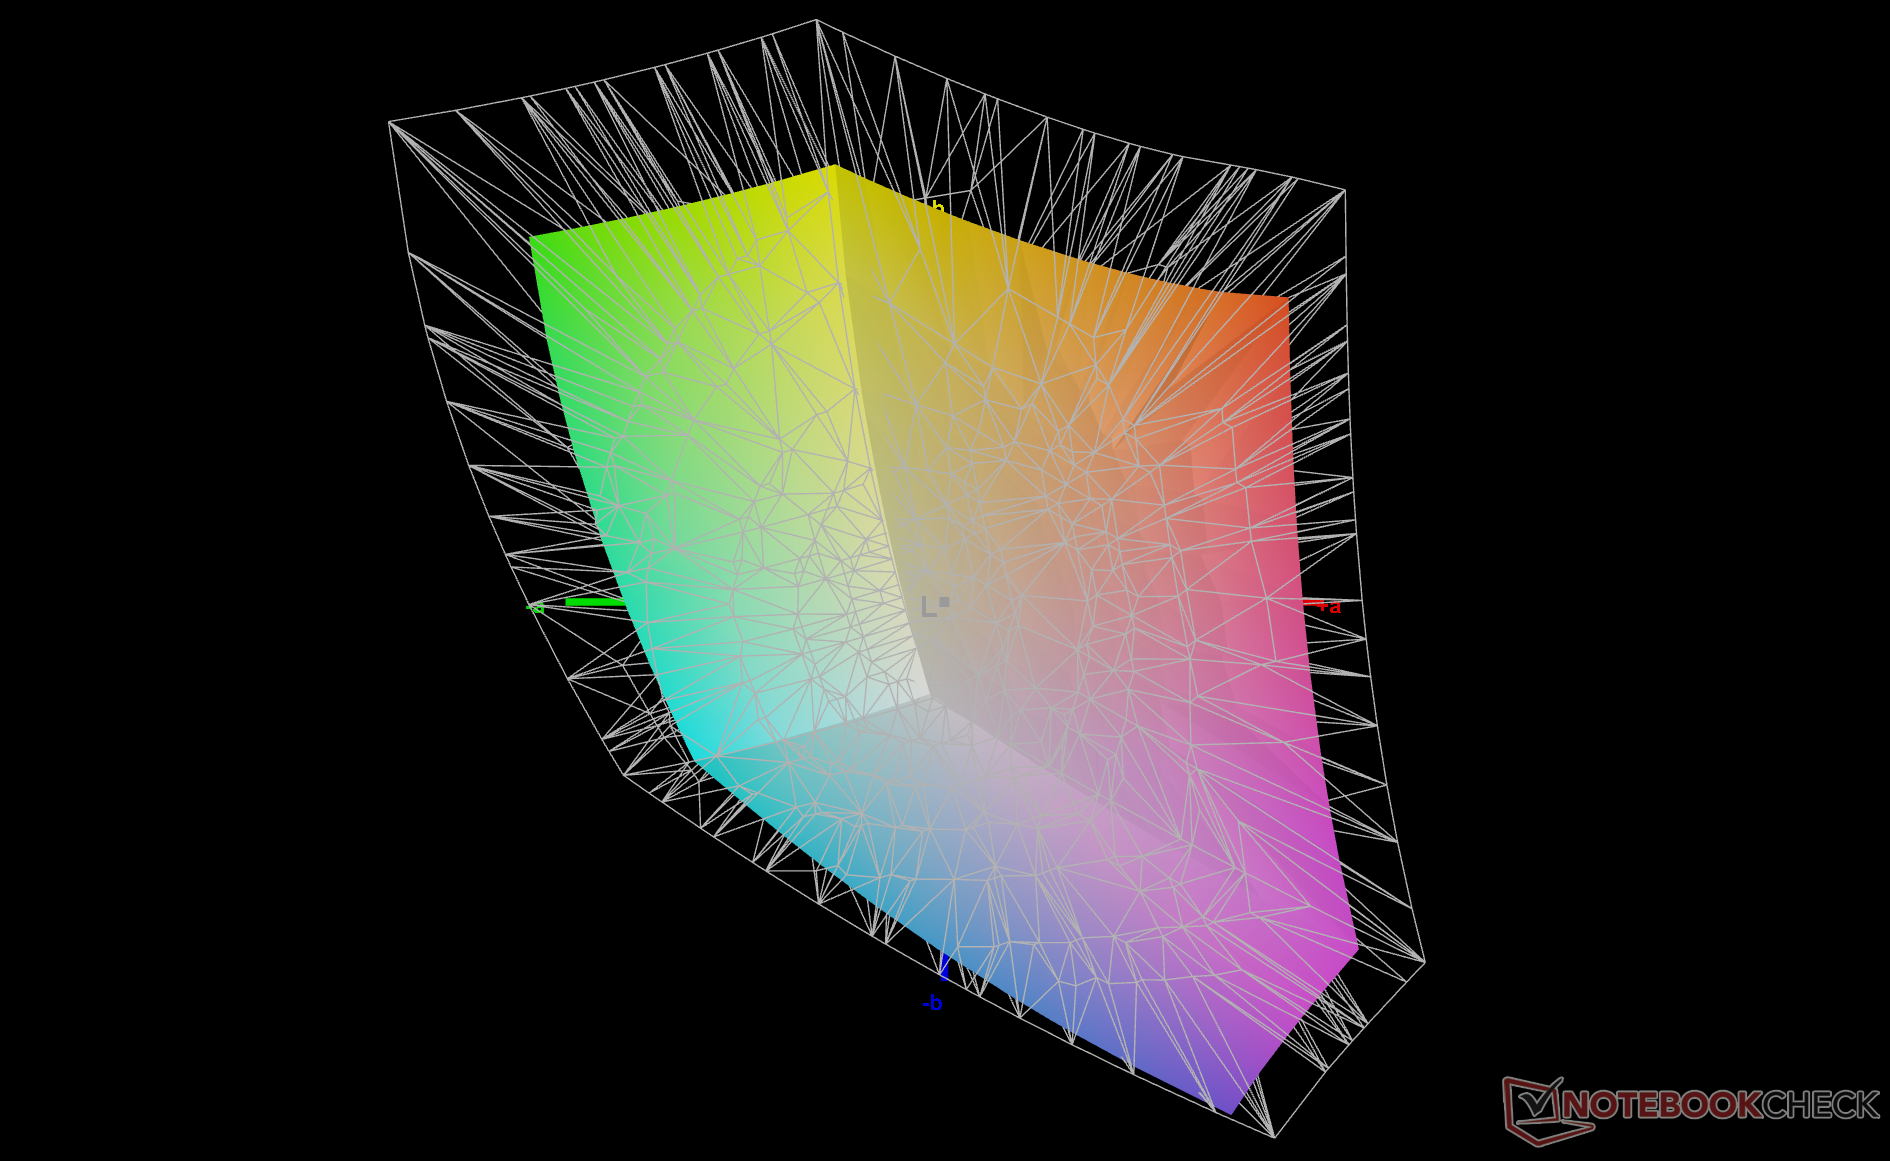
70.4% AdobeRGB 1998 (Argyll 3D)
98.3% sRGB (Argyll 3D)
68.4% Display P3 (Argyll 3D)
Gamma: 2.2
CCT: 6203 K
| HP Dragonfly G4 Chi Mei CMN13C0, IPS, 1920x1280, 13.5" | HP Elite Dragonfly G3 Chi Mei CMN13C0, IPS, 1920x1280, 13.5" | Framework Laptop 13.5 13th Gen Intel BOE CQ NE135FBM-N41, IPS, 2256x1504, 13.5" | Lenovo ThinkPad X13 G3 21CM002UGE M133NW4J R3, IPS LED, 1920x1200, 13.3" | Dell Latitude 9330 AU Optronics B133QAA, IPS, 2560x1600, 13.3" | Apple MacBook Air M2 Entry IPS, 2560x1664, 13.6" | |
|---|---|---|---|---|---|---|
| Display | -1% | 0% | 0% | 9% | 23% | |
| Display P3 Coverage (%) | 68.4 | 68 -1% | 68.9 1% | 69 1% | 77.8 14% | 98.4 44% |
| sRGB Coverage (%) | 98.3 | 98.3 0% | 97.5 -1% | 98.4 0% | 99.9 2% | 99.9 2% |
| AdobeRGB 1998 Coverage (%) | 70.4 | 69.9 -1% | 71.1 1% | 70.3 0% | 77.5 10% | 87.6 24% |
| Response Times | -8% | -10% | 10% | -50% | 27% | |
| Response Time Grey 50% / Grey 80% * (ms) | 48.8 ? | 50.8 ? -4% | 54.9 ? -13% | 44.2 ? 9% | 67.6 ? -39% | 32.9 ? 33% |
| Response Time Black / White * (ms) | 31.3 ? | 35.2 ? -12% | 33.5 ? -7% | 28.1 ? 10% | 50.4 ? -61% | 24.9 ? 20% |
| PWM Frequency (Hz) | ||||||
| Screen | -7% | -36% | 0% | -12% | 11% | |
| Brightness middle (cd/m²) | 408.8 | 387.2 -5% | 503 23% | 348 -15% | 542.3 33% | 526 29% |
| Brightness (cd/m²) | 399 | 360 -10% | 472 18% | 321 -20% | 516 29% | 486 22% |
| Brightness Distribution (%) | 90 | 80 -11% | 87 -3% | 85 -6% | 85 -6% | 87 -3% |
| Black Level * (cd/m²) | 0.32 | 0.26 19% | 0.36 -13% | 0.34 -6% | 0.38 -19% | 0.38 -19% |
| Contrast (:1) | 1278 | 1489 17% | 1397 9% | 1024 -20% | 1427 12% | 1384 8% |
| Colorchecker dE 2000 * | 2.02 | 2.36 -17% | 3.38 -67% | 1.3 36% | 3.18 -57% | 1.3 36% |
| Colorchecker dE 2000 max. * | 3.84 | 4.79 -25% | 7.08 -84% | 2.5 35% | 6.05 -58% | 2.7 30% |
| Colorchecker dE 2000 calibrated * | 0.61 | 0.63 -3% | 1.21 -98% | 1 -64% | 0.67 -10% | 0.7 -15% |
| Greyscale dE 2000 * | 2.3 | 3 -30% | 4.8 -109% | 0.9 61% | 3.1 -35% | 2 13% |
| Gamma | 2.2 100% | 2.17 101% | 2.13 103% | 2.16 102% | 2.08 106% | 2.25 98% |
| CCT | 6203 105% | 6137 106% | 6235 104% | 6431 101% | 6140 106% | 6858 95% |
| Média Total (Programa/Configurações) | -5% /
-6% | -15% /
-25% | 3% /
2% | -18% /
-13% | 20% /
16% |
* ... menor é melhor
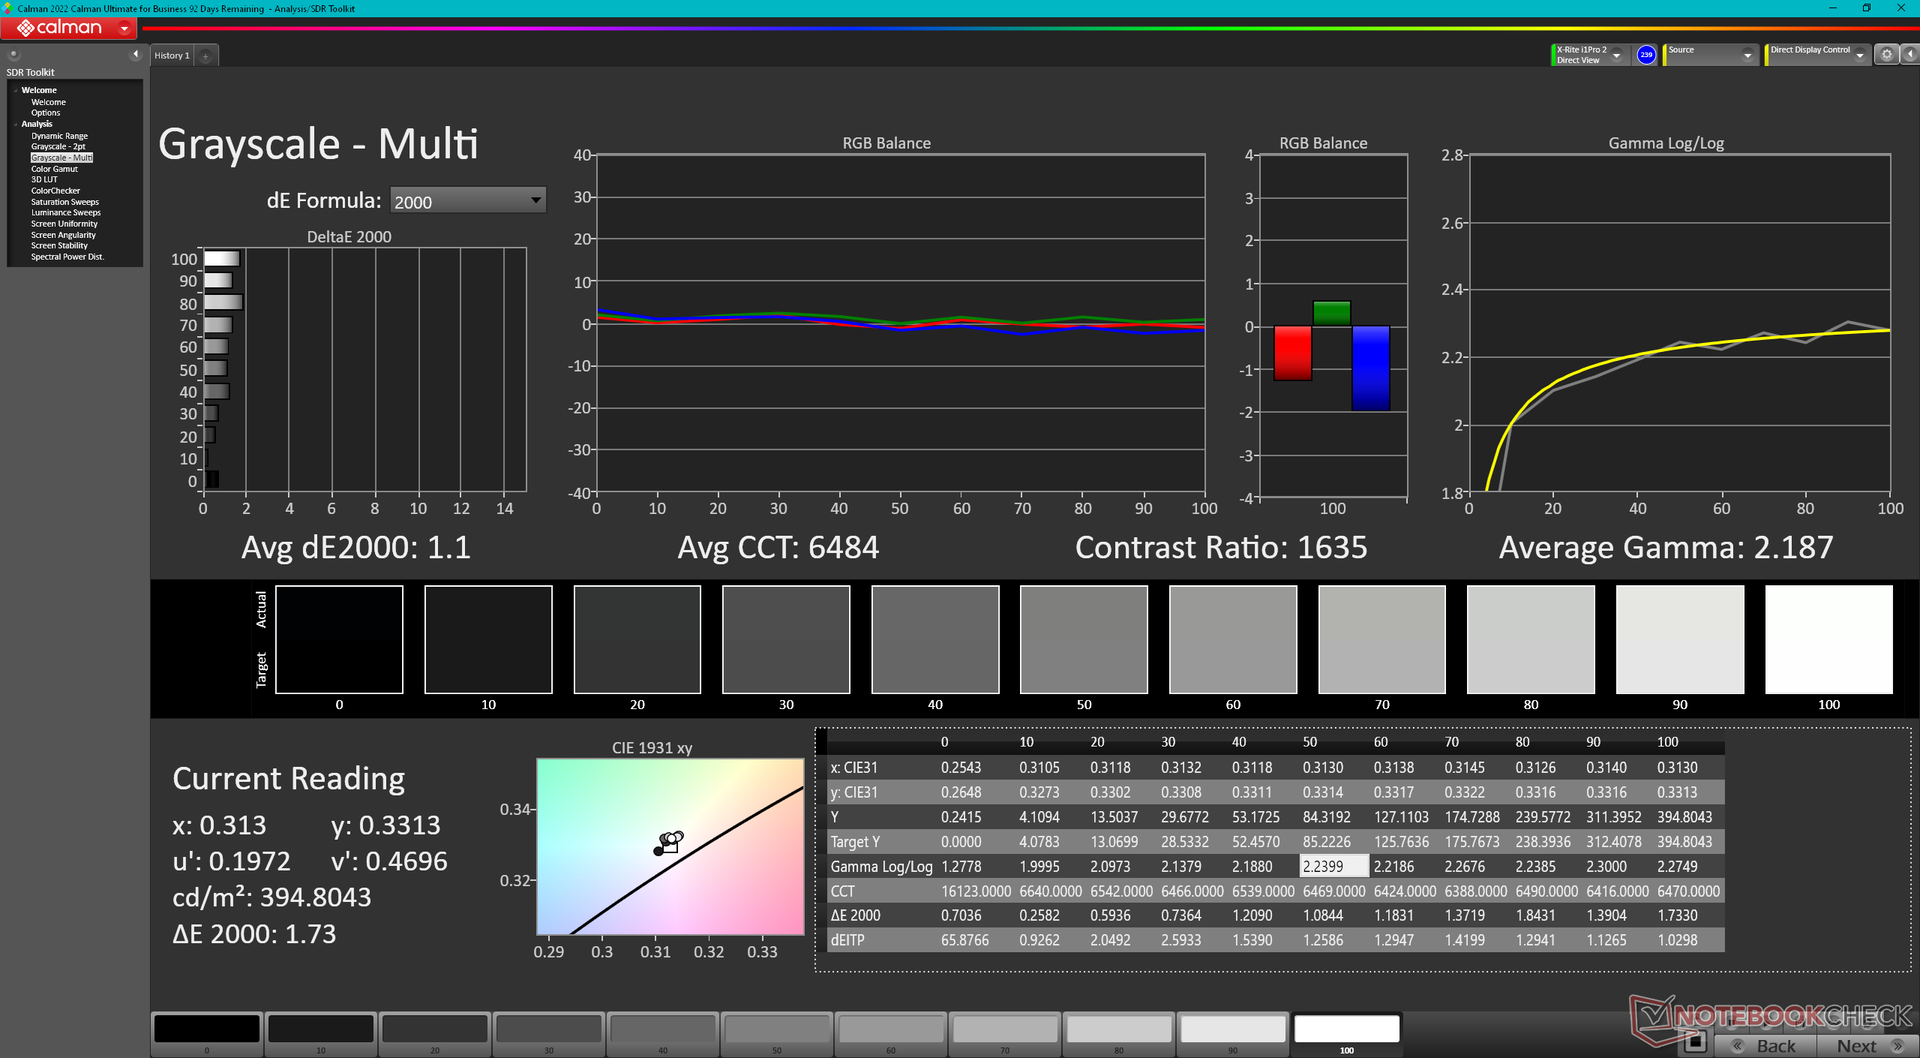
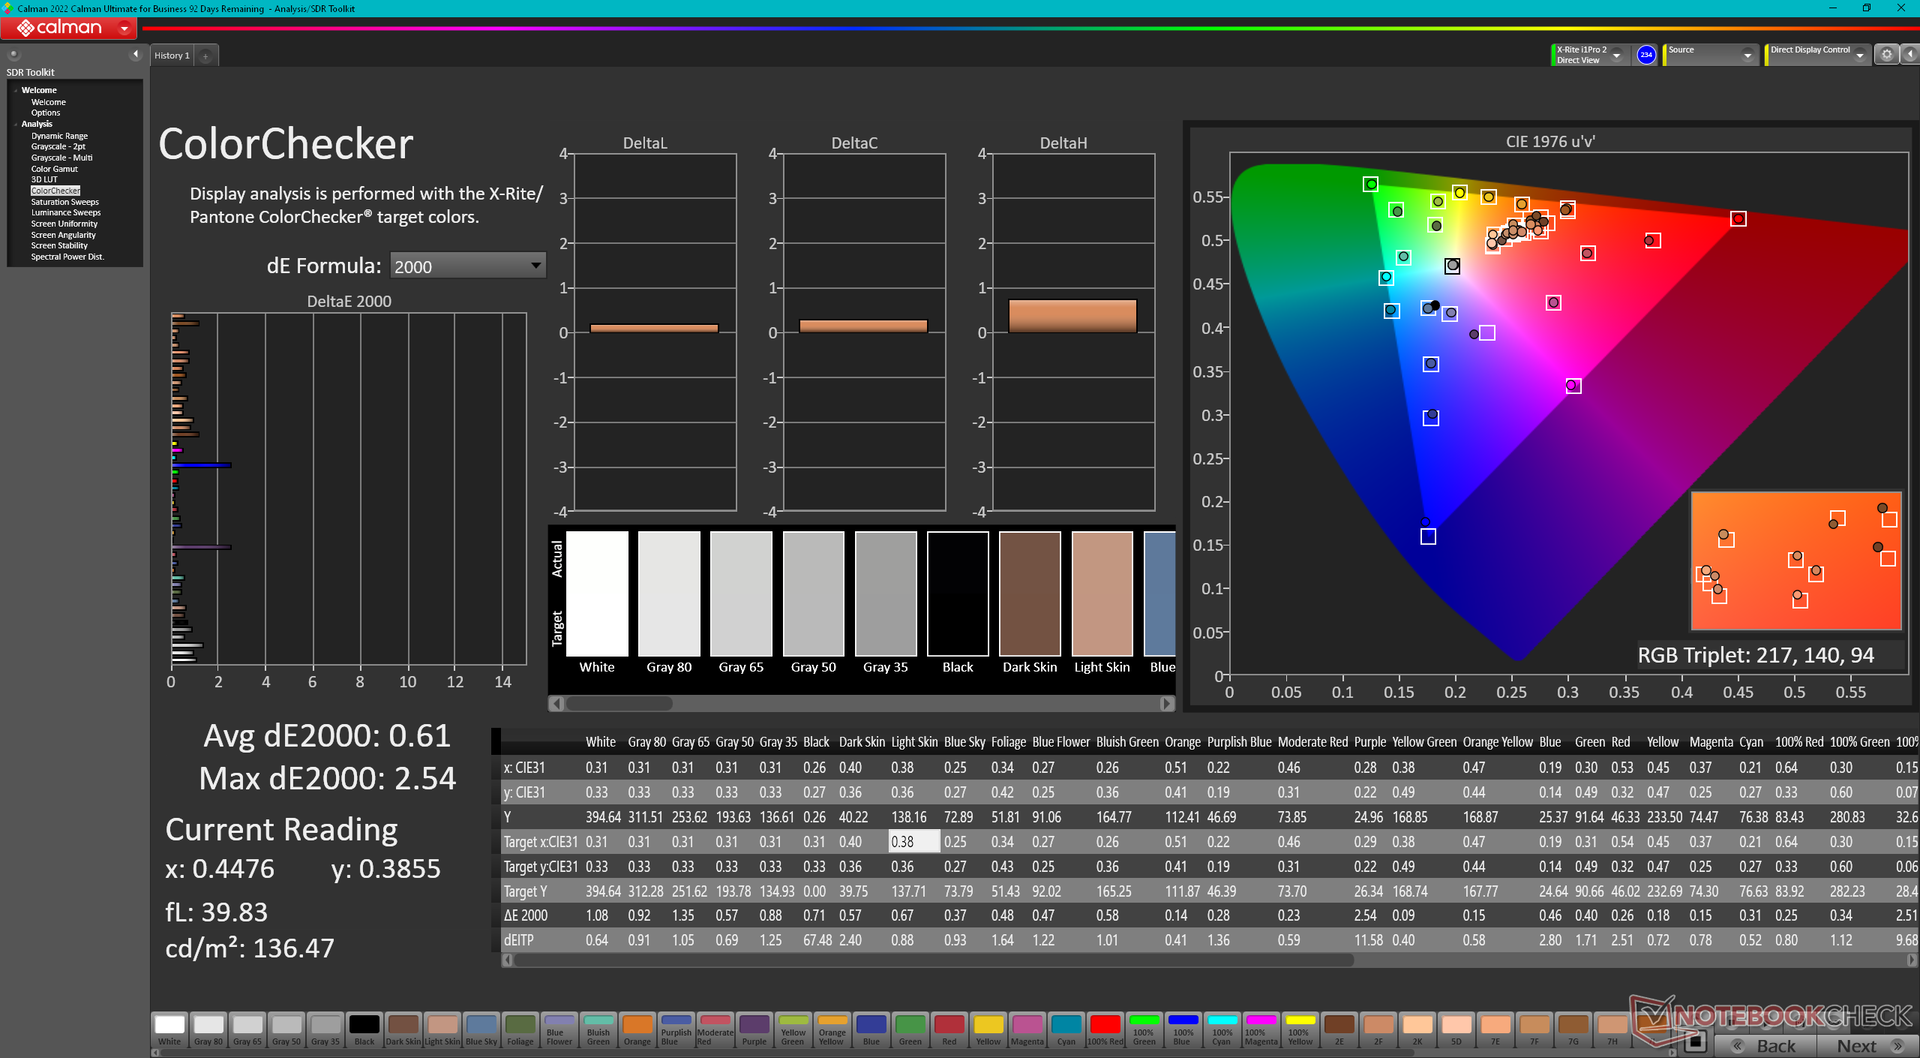
A tela vem bem calibrada de fábrica, embora a HP não anuncie a calibração de fábrica. Calibrar o painel com um colorímetro X-Rite melhoraria ainda mais os valores médios de escala de cinza e deltaE de cor, de 2,3 e 2,02 para apenas 1,1 e 0,61, respectivamente. Os usuários podem fazer o download e aplicar nosso perfil ICM calibrado acima.
Exibir tempos de resposta
| ↔ Tempo de resposta preto para branco | ||
|---|---|---|
| 31.3 ms ... ascensão ↗ e queda ↘ combinadas | ↗ 16.3 ms ascensão | 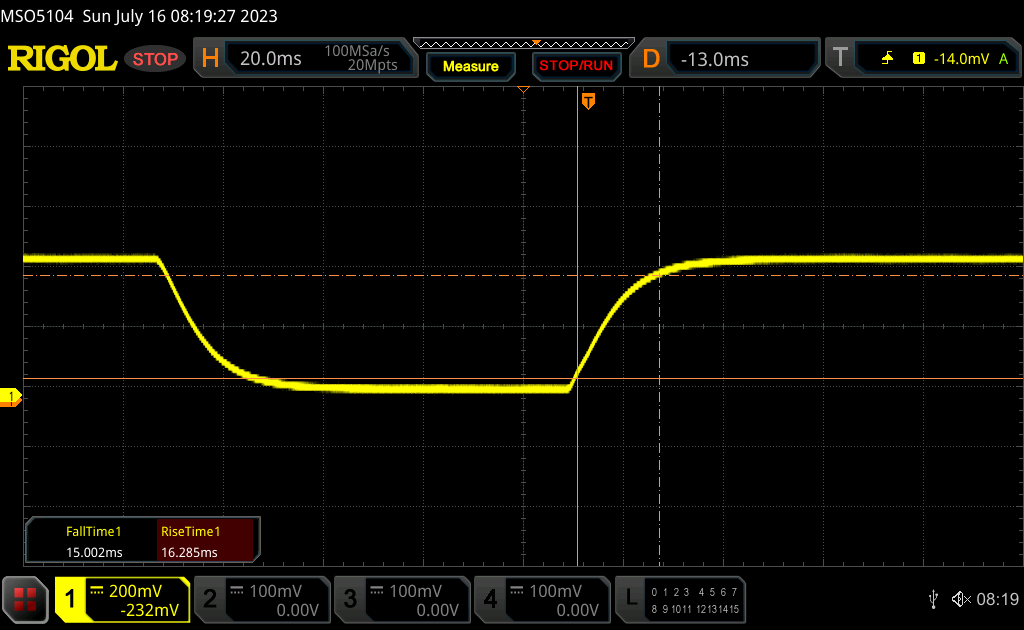 |
| ↘ 15 ms queda | ||
| A tela mostra taxas de resposta lentas em nossos testes e será insatisfatória para os jogadores. Em comparação, todos os dispositivos testados variam de 0.1 (mínimo) a 240 (máximo) ms. » 85 % de todos os dispositivos são melhores. Isso significa que o tempo de resposta medido é pior que a média de todos os dispositivos testados (19.8 ms). | ||
| ↔ Tempo de resposta 50% cinza a 80% cinza | ||
| 48.8 ms ... ascensão ↗ e queda ↘ combinadas | ↗ 22.9 ms ascensão | 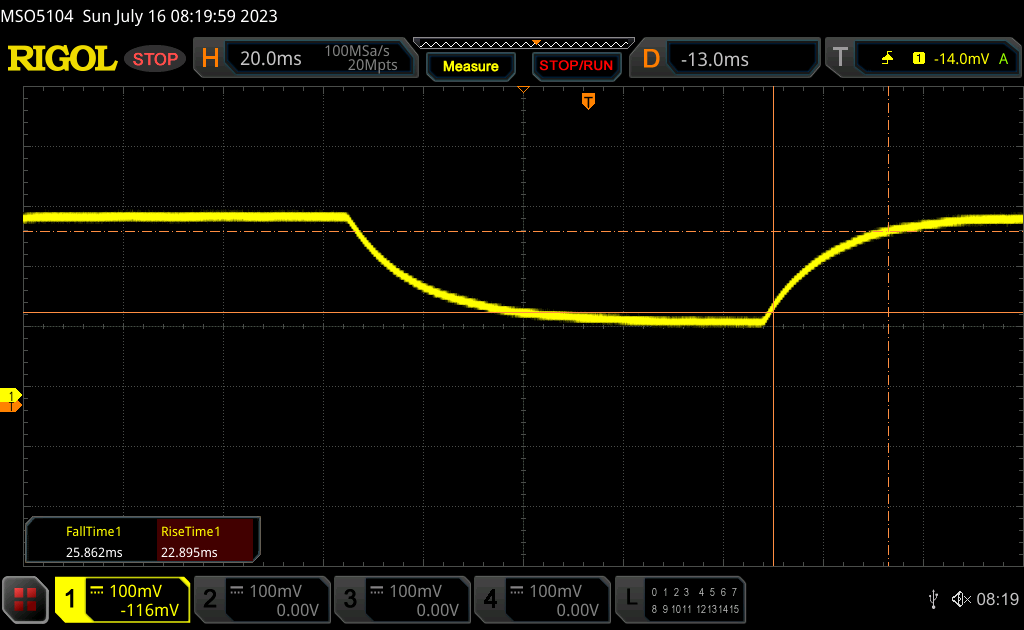 |
| ↘ 25.9 ms queda | ||
| A tela mostra taxas de resposta lentas em nossos testes e será insatisfatória para os jogadores. Em comparação, todos os dispositivos testados variam de 0.165 (mínimo) a 636 (máximo) ms. » 84 % de todos os dispositivos são melhores. Isso significa que o tempo de resposta medido é pior que a média de todos os dispositivos testados (31 ms). | ||
Cintilação da tela / PWM (modulação por largura de pulso)
| Tela tremeluzindo / PWM não detectado | 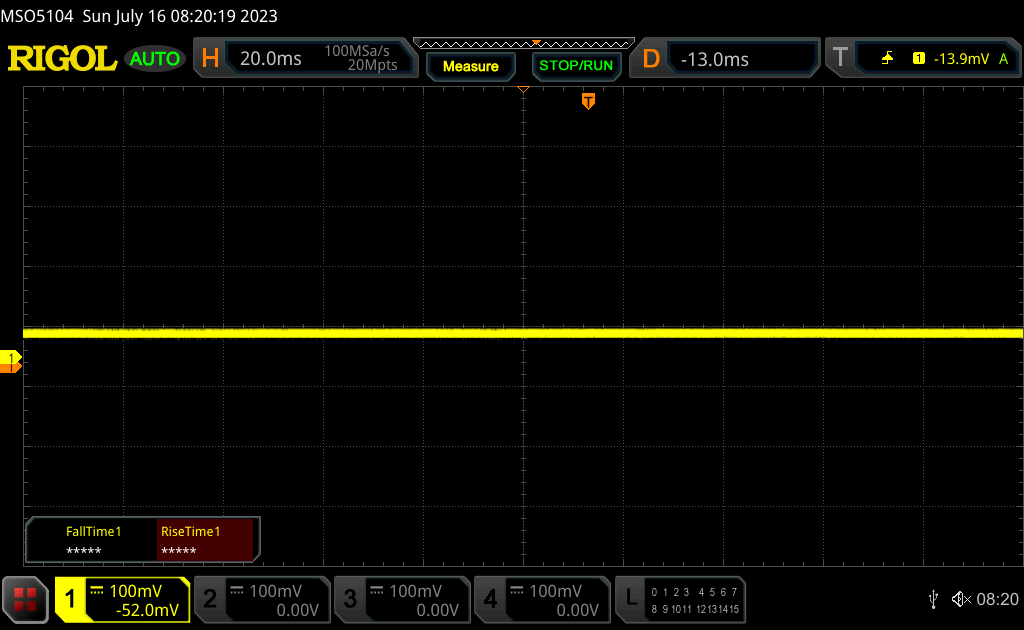 | ||
[pwm_comparison] Em comparação: 52 % de todos os dispositivos testados não usam PWM para escurecer a tela. Se PWM foi detectado, uma média de 7754 (mínimo: 5 - máximo: 343500) Hz foi medida. | |||
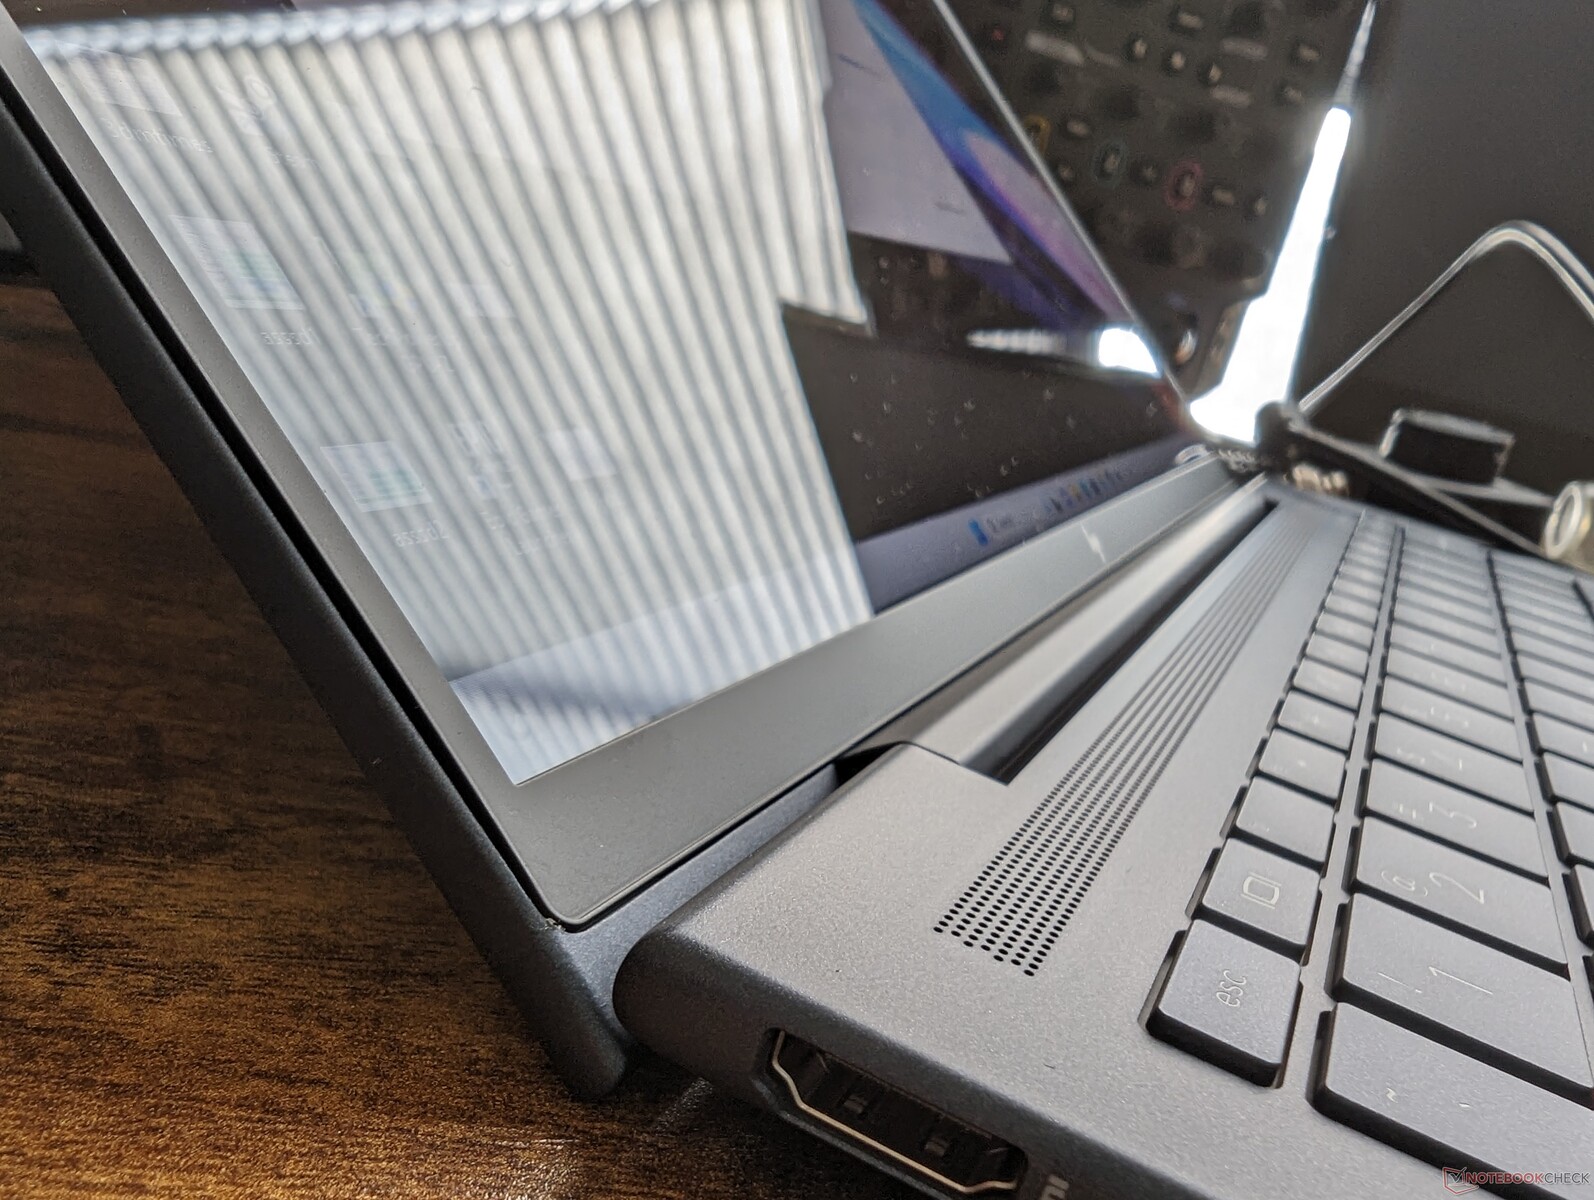
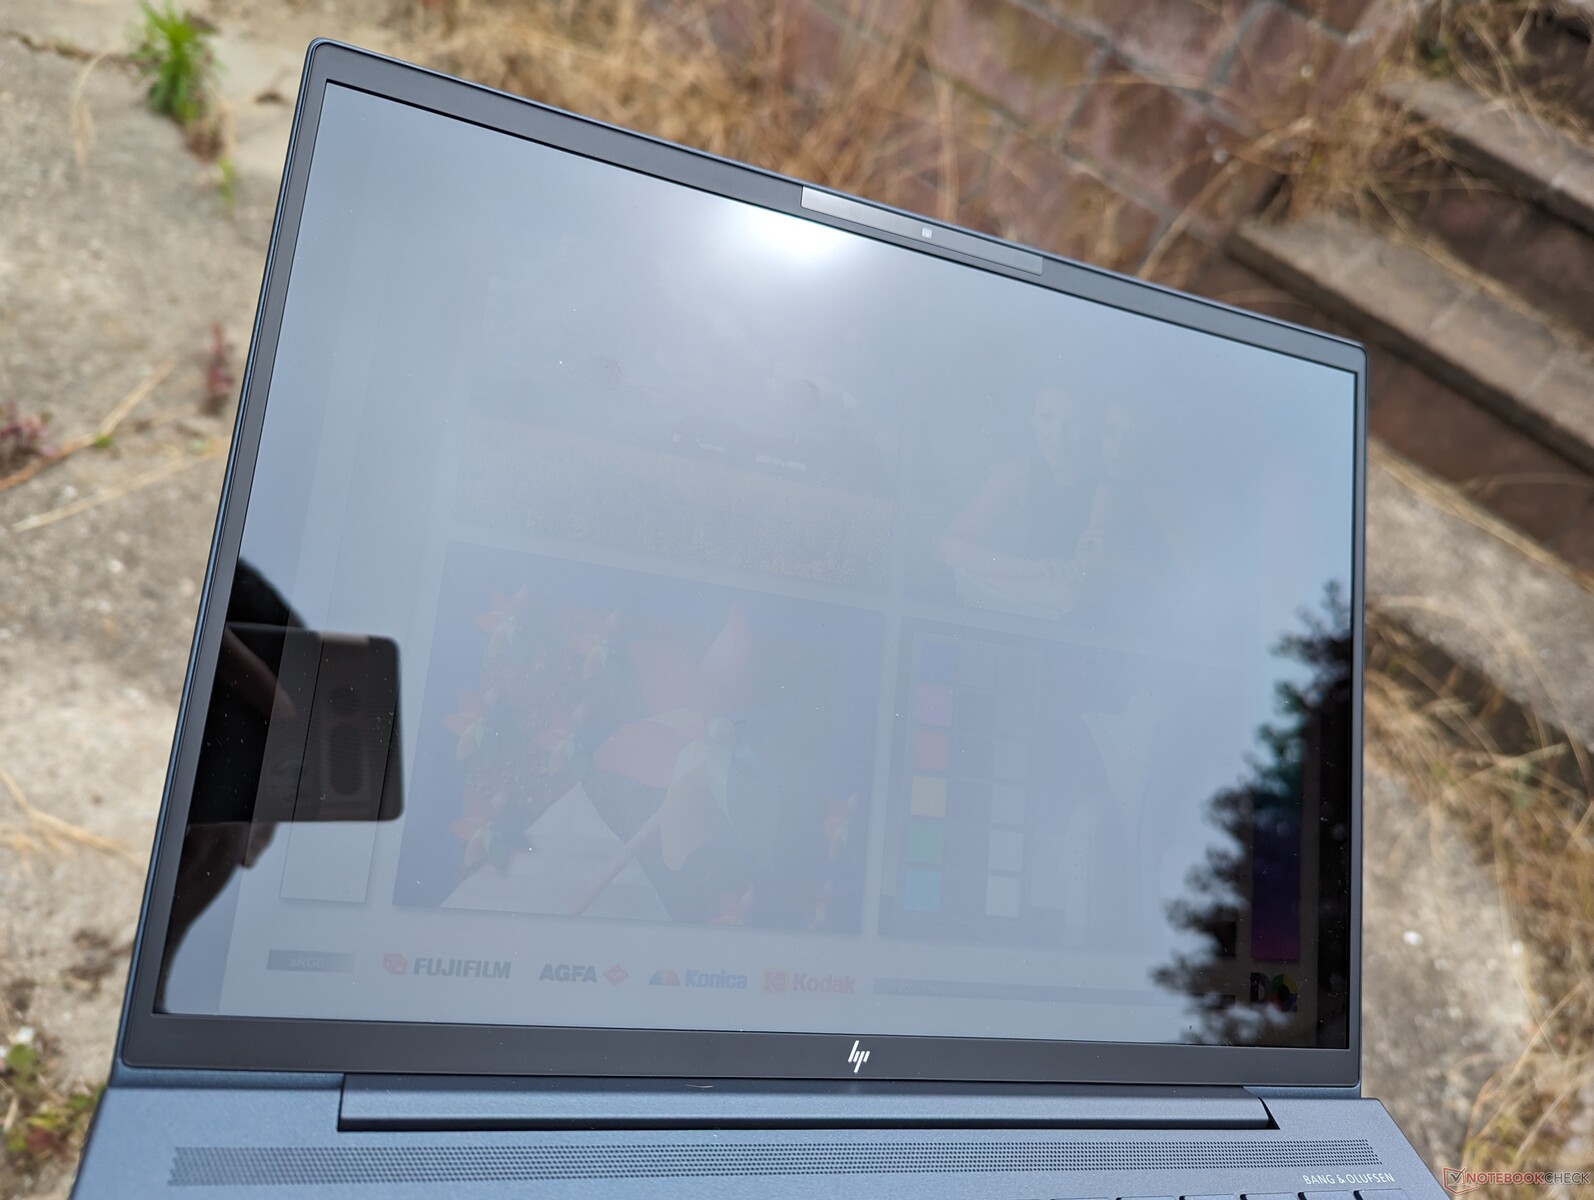
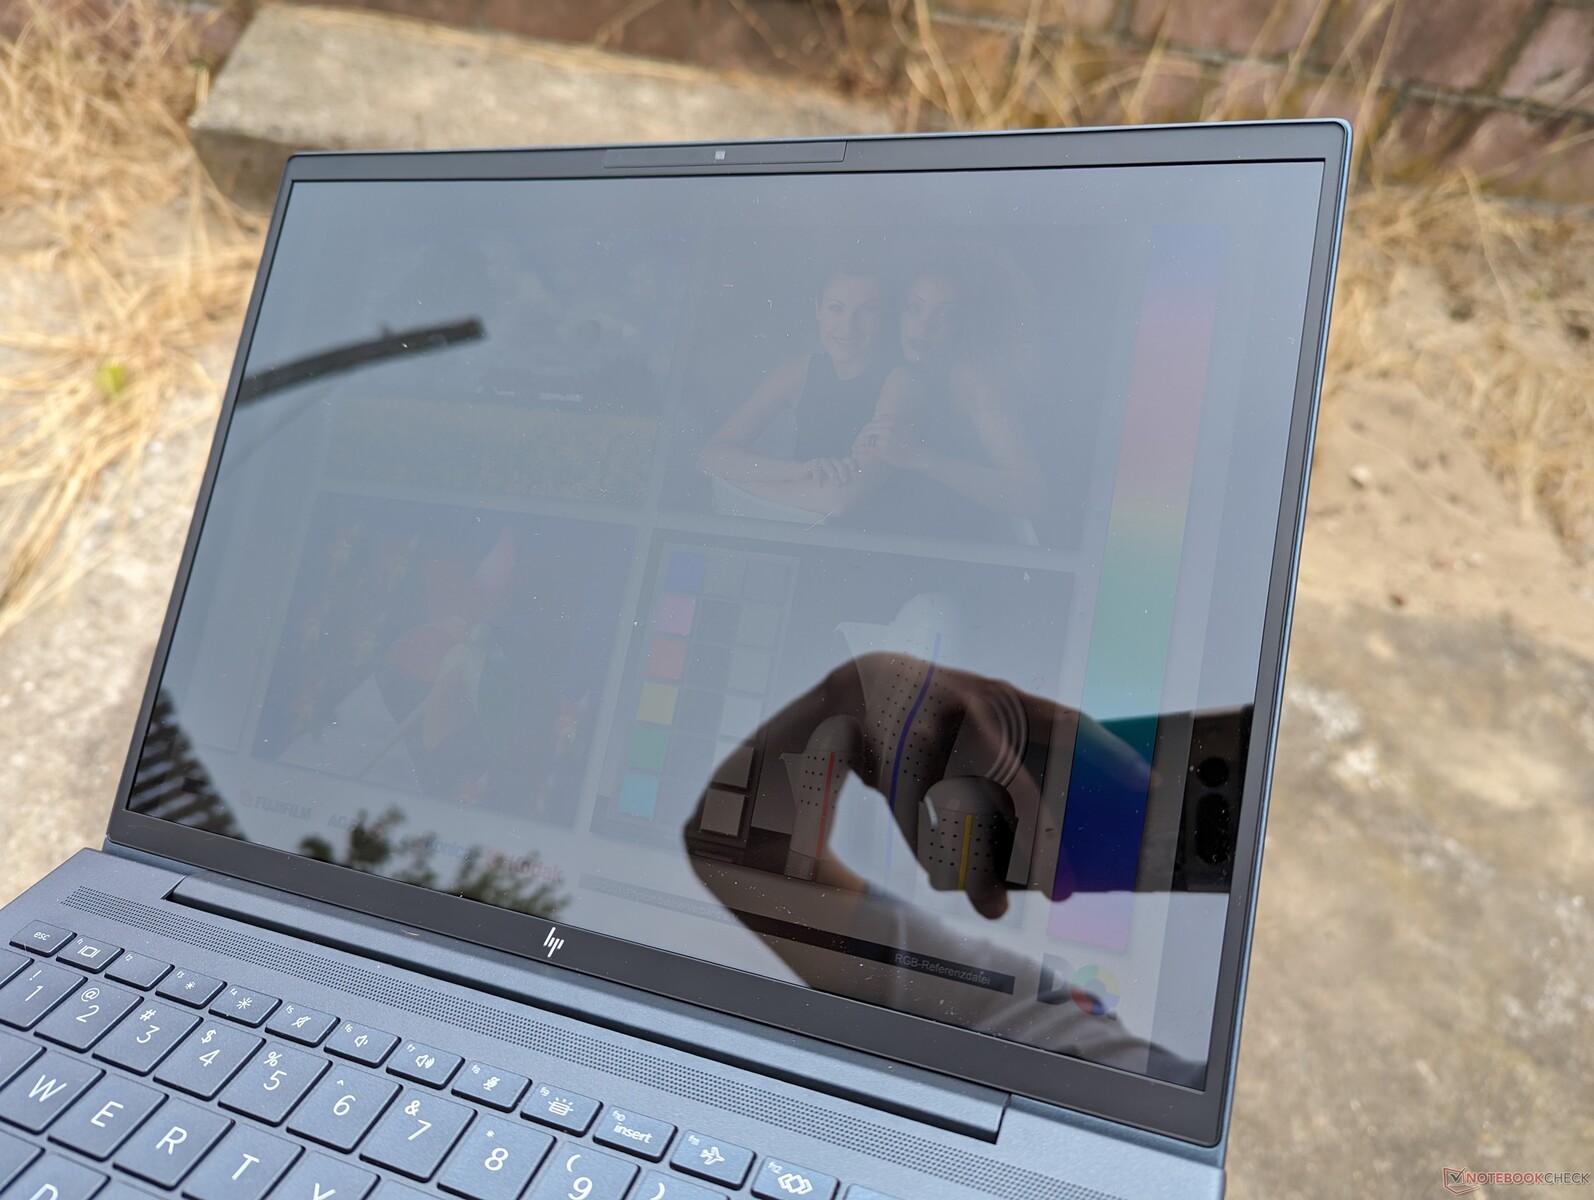
A sobreposição superbrilhante e seu consequente brilho prejudicam a visibilidade em ambientes externos. Felizmente, a HP continua sendo um dos únicos grandes fabricantes a oferecer opções de painel de 1000 nit, até duas vezes mais brilhante do que a maioria dos outros subnotebooks empresariais.
Desempenho
Condições de teste
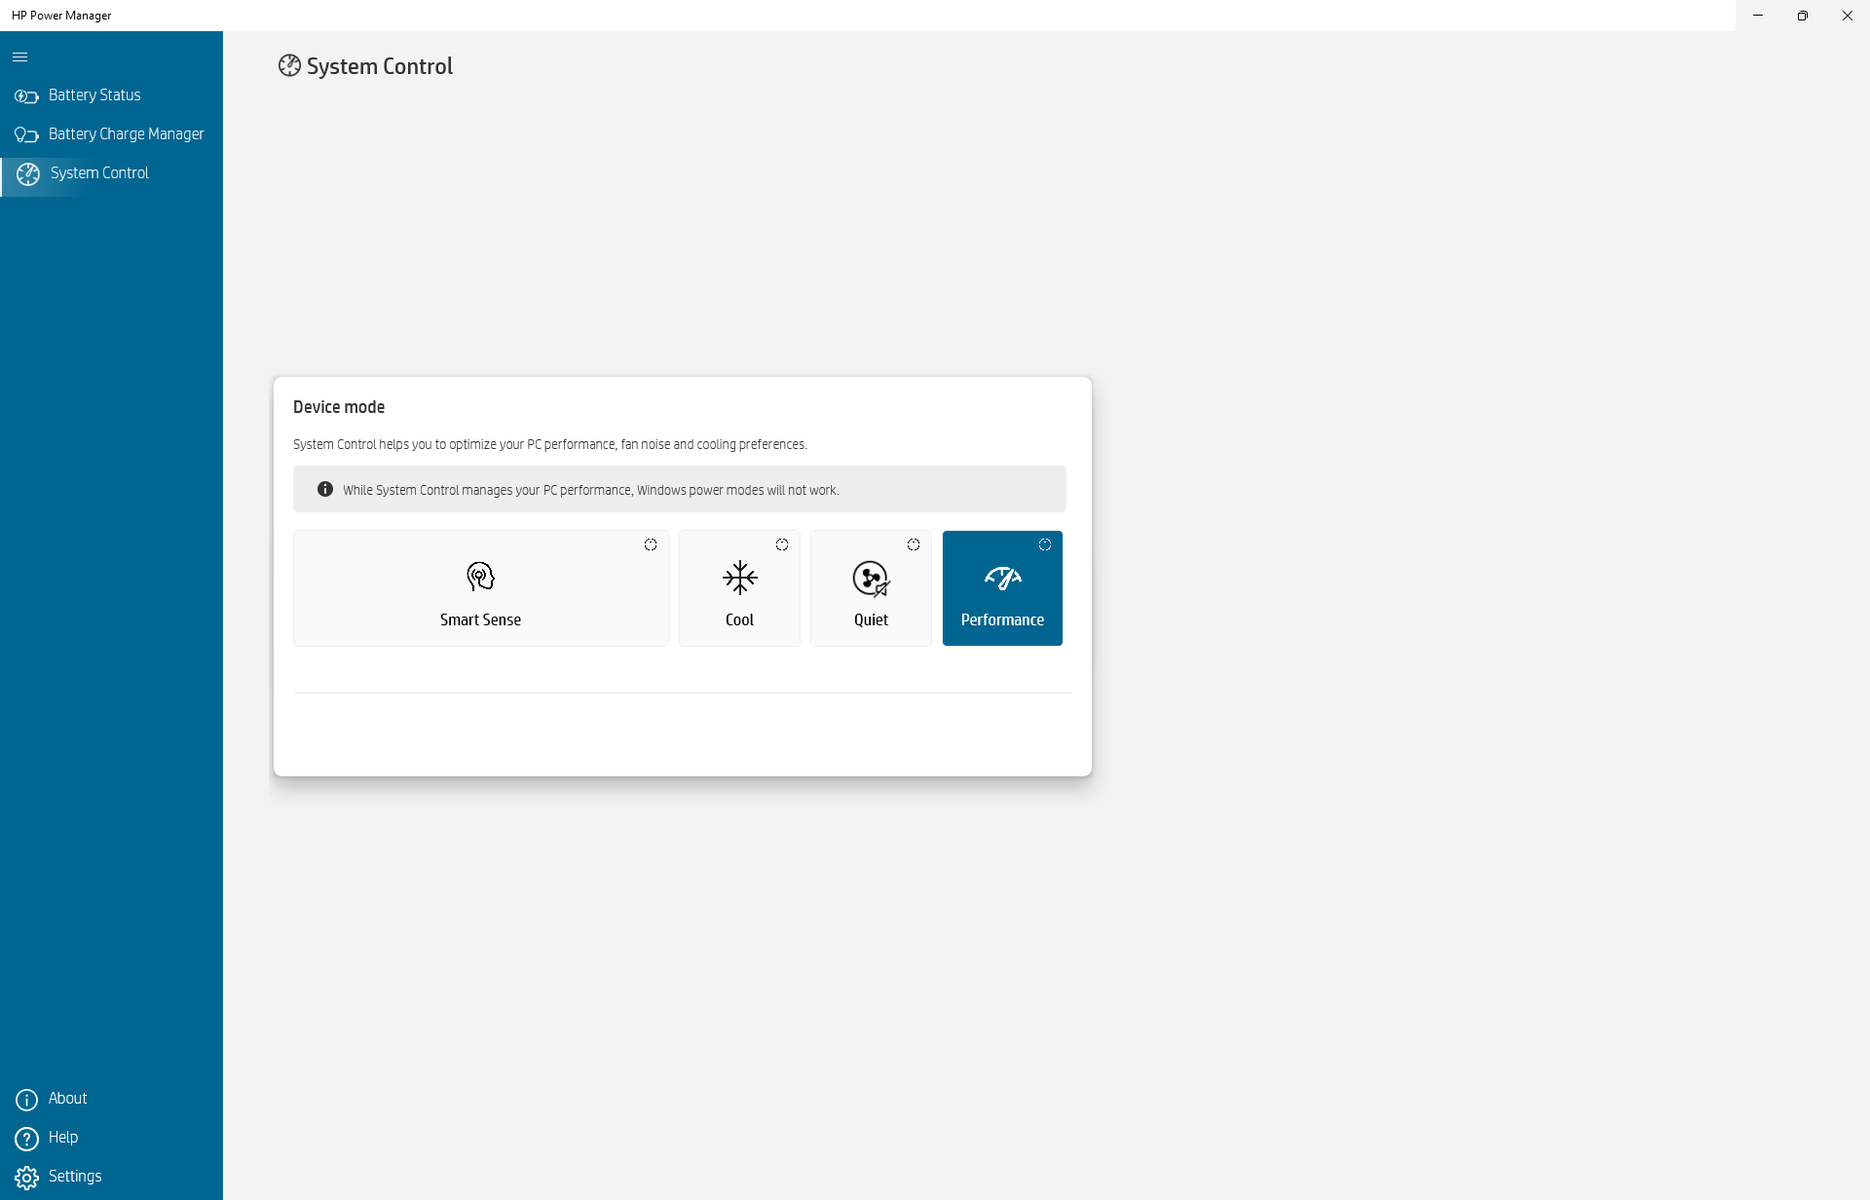
Definimos nossa unidade para o modo Desempenho por meio do HP Power Manager antes de executar os benchmarks abaixo. O software Power Manager é novo na série este ano e afirma convenientemente que suas configurações de perfil de energia substituem os perfis de energia padrão do Windows, conforme mostrado na captura de tela abaixo.

Processador
O desempenho multi-thread bruto é até 20% mais rápido do que a 12ª geração do Core i7-1265U do Dragonfly G3 do ano passado. Quando o Turbo Boost se estabiliza, no entanto, a vantagem de desempenho entre o i7-1365U e o i7-1265U se torna menor, apenas 10%, como mostram os resultados do nosso teste de loop CineBench R15 xT abaixo. Em geral, a nova CPU é considerada uma pequena atualização ou reformulação das opções Alder Lake-U do ano passado.
O desempenho geral é mais lento do que na maioria dos outros laptops equipados com o mesmo processador Core i7-1365U em cerca de 15%. De fato, oSamsung Galaxy Book3 15da Samsung, que vem com o processador Core i5-1335Umais barato, é capaz de superar consistentemente nossa unidade Core i7 Dragonfly G4 em cargas de trabalho multithread. A HP tem o hábito de executar CPUs em sua série Dragonfly um pouco mais lentas do que a concorrência.
É uma pena que a série não ofereça nenhuma opção Core-P, como o Core i7-1370P teria aumentado significativamente o desempenho multi-thread em até 75%, com base em nosso tempo com o Framework 13.5.
Cinebench R15 Multi Loop
Cinebench R23: Multi Core | Single Core
Cinebench R20: CPU (Multi Core) | CPU (Single Core)
Cinebench R15: CPU Multi 64Bit | CPU Single 64Bit
Blender: v2.79 BMW27 CPU
7-Zip 18.03: 7z b 4 | 7z b 4 -mmt1
Geekbench 5.5: Multi-Core | Single-Core
HWBOT x265 Benchmark v2.2: 4k Preset
LibreOffice : 20 Documents To PDF
R Benchmark 2.5: Overall mean
| CPU Performance rating | |
| Framework Laptop 13.5 13th Gen Intel | |
| Dell XPS 13 Plus 9320 i7-1280P OLED | |
| Média Intel Core i7-1365U | |
| Asus Zenbook S 13 OLED | |
| HP Dragonfly G4 | |
| Samsung Galaxy Book3 15, Core i5-1335U | |
| Lenovo ThinkBook 13s G3 20YA0005GE | |
| Apple MacBook Air M2 Entry -5! | |
| Dell Latitude 9330 | |
| Lenovo ThinkPad X13 G3 21CM002UGE | |
| HP Elite Dragonfly G3 | |
| Lenovo Yoga 6 13ALC6 -2! | |
| Dell XPS 13 7390 Core i7-10710U -6! | |
| Dell Inspiron 13 7306-6TYH5 | |
| Cinebench R23 / Multi Core | |
| Framework Laptop 13.5 13th Gen Intel | |
| Dell XPS 13 Plus 9320 i7-1280P OLED | |
| Asus Zenbook S 13 OLED | |
| Samsung Galaxy Book3 15, Core i5-1335U | |
| Média Intel Core i7-1365U (7532 - 9576, n=4) | |
| Apple MacBook Air M2 Entry | |
| Lenovo ThinkBook 13s G3 20YA0005GE | |
| Lenovo ThinkPad X13 G3 21CM002UGE | |
| HP Dragonfly G4 | |
| Lenovo Yoga 6 13ALC6 | |
| Dell Latitude 9330 | |
| HP Elite Dragonfly G3 | |
| Dell Inspiron 13 7306-6TYH5 | |
| Cinebench R23 / Single Core | |
| Framework Laptop 13.5 13th Gen Intel | |
| HP Dragonfly G4 | |
| Média Intel Core i7-1365U (1877 - 1891, n=4) | |
| Samsung Galaxy Book3 15, Core i5-1335U | |
| Dell XPS 13 Plus 9320 i7-1280P OLED | |
| Apple MacBook Air M2 Entry | |
| Dell Latitude 9330 | |
| HP Elite Dragonfly G3 | |
| Asus Zenbook S 13 OLED | |
| Dell Inspiron 13 7306-6TYH5 | |
| Lenovo ThinkPad X13 G3 21CM002UGE | |
| Lenovo ThinkBook 13s G3 20YA0005GE | |
| Lenovo Yoga 6 13ALC6 | |
| Cinebench R20 / CPU (Multi Core) | |
| Framework Laptop 13.5 13th Gen Intel | |
| Dell XPS 13 Plus 9320 i7-1280P OLED | |
| Asus Zenbook S 13 OLED | |
| Samsung Galaxy Book3 15, Core i5-1335U | |
| Média Intel Core i7-1365U (2902 - 3669, n=4) | |
| Lenovo ThinkPad X13 G3 21CM002UGE | |
| Lenovo ThinkBook 13s G3 20YA0005GE | |
| Lenovo Yoga 6 13ALC6 | |
| HP Dragonfly G4 | |
| Dell Latitude 9330 | |
| Dell XPS 13 7390 Core i7-10710U | |
| HP Elite Dragonfly G3 | |
| Apple MacBook Air M2 Entry | |
| Dell Inspiron 13 7306-6TYH5 | |
| Cinebench R20 / CPU (Single Core) | |
| Framework Laptop 13.5 13th Gen Intel | |
| Média Intel Core i7-1365U (703 - 741, n=4) | |
| HP Dragonfly G4 | |
| Samsung Galaxy Book3 15, Core i5-1335U | |
| Dell XPS 13 Plus 9320 i7-1280P OLED | |
| Dell Latitude 9330 | |
| HP Elite Dragonfly G3 | |
| Dell Inspiron 13 7306-6TYH5 | |
| Asus Zenbook S 13 OLED | |
| Lenovo ThinkBook 13s G3 20YA0005GE | |
| Lenovo ThinkPad X13 G3 21CM002UGE | |
| Lenovo Yoga 6 13ALC6 | |
| Dell XPS 13 7390 Core i7-10710U | |
| Apple MacBook Air M2 Entry | |
| Cinebench R15 / CPU Multi 64Bit | |
| Framework Laptop 13.5 13th Gen Intel | |
| Lenovo ThinkBook 13s G3 20YA0005GE | |
| Lenovo ThinkBook 13s G3 20YA0005GE | |
| Dell XPS 13 Plus 9320 i7-1280P OLED | |
| Asus Zenbook S 13 OLED | |
| Samsung Galaxy Book3 15, Core i5-1335U | |
| Média Intel Core i7-1365U (1348 - 1604, n=4) | |
| HP Dragonfly G4 | |
| Lenovo ThinkPad X13 G3 21CM002UGE | |
| Apple MacBook Air M2 Entry | |
| HP Elite Dragonfly G3 | |
| Lenovo Yoga 6 13ALC6 | |
| Dell Latitude 9330 | |
| Dell XPS 13 7390 Core i7-10710U | |
| Dell Inspiron 13 7306-6TYH5 | |
| Dell Inspiron 13 7306-6TYH5 | |
| Cinebench R15 / CPU Single 64Bit | |
| Framework Laptop 13.5 13th Gen Intel | |
| Média Intel Core i7-1365U (261 - 268, n=4) | |
| HP Dragonfly G4 | |
| Samsung Galaxy Book3 15, Core i5-1335U | |
| Asus Zenbook S 13 OLED | |
| Lenovo ThinkPad X13 G3 21CM002UGE | |
| Lenovo ThinkBook 13s G3 20YA0005GE | |
| Dell XPS 13 Plus 9320 i7-1280P OLED | |
| Dell Inspiron 13 7306-6TYH5 | |
| Dell Inspiron 13 7306-6TYH5 | |
| HP Elite Dragonfly G3 | |
| Apple MacBook Air M2 Entry | |
| Dell Latitude 9330 | |
| Lenovo Yoga 6 13ALC6 | |
| Dell XPS 13 7390 Core i7-10710U | |
| 7-Zip 18.03 / 7z b 4 | |
| Framework Laptop 13.5 13th Gen Intel | |
| Dell XPS 13 Plus 9320 i7-1280P OLED | |
| Asus Zenbook S 13 OLED | |
| Lenovo ThinkBook 13s G3 20YA0005GE | |
| Lenovo Yoga 6 13ALC6 | |
| Samsung Galaxy Book3 15, Core i5-1335U | |
| Média Intel Core i7-1365U (33476 - 40424, n=4) | |
| Lenovo ThinkPad X13 G3 21CM002UGE | |
| HP Dragonfly G4 | |
| Dell Latitude 9330 | |
| HP Elite Dragonfly G3 | |
| Dell XPS 13 7390 Core i7-10710U | |
| Dell Inspiron 13 7306-6TYH5 | |
| 7-Zip 18.03 / 7z b 4 -mmt1 | |
| Framework Laptop 13.5 13th Gen Intel | |
| Média Intel Core i7-1365U (5722 - 5941, n=4) | |
| HP Dragonfly G4 | |
| Asus Zenbook S 13 OLED | |
| Lenovo ThinkBook 13s G3 20YA0005GE | |
| Samsung Galaxy Book3 15, Core i5-1335U | |
| Lenovo ThinkPad X13 G3 21CM002UGE | |
| Dell Inspiron 13 7306-6TYH5 | |
| Dell XPS 13 Plus 9320 i7-1280P OLED | |
| HP Elite Dragonfly G3 | |
| Dell Latitude 9330 | |
| Lenovo Yoga 6 13ALC6 | |
| Dell XPS 13 7390 Core i7-10710U | |
| Geekbench 5.5 / Multi-Core | |
| Framework Laptop 13.5 13th Gen Intel | |
| Dell XPS 13 Plus 9320 i7-1280P OLED | |
| Apple MacBook Air M2 Entry | |
| HP Dragonfly G4 | |
| Média Intel Core i7-1365U (8272 - 8778, n=4) | |
| HP Elite Dragonfly G3 | |
| Samsung Galaxy Book3 15, Core i5-1335U | |
| Asus Zenbook S 13 OLED | |
| Dell Latitude 9330 | |
| Lenovo ThinkBook 13s G3 20YA0005GE | |
| Lenovo ThinkPad X13 G3 21CM002UGE | |
| Dell Inspiron 13 7306-6TYH5 | |
| Geekbench 5.5 / Single-Core | |
| Framework Laptop 13.5 13th Gen Intel | |
| Apple MacBook Air M2 Entry | |
| HP Dragonfly G4 | |
| Média Intel Core i7-1365U (1841 - 1938, n=4) | |
| Dell XPS 13 Plus 9320 i7-1280P OLED | |
| Samsung Galaxy Book3 15, Core i5-1335U | |
| Dell Latitude 9330 | |
| Dell Inspiron 13 7306-6TYH5 | |
| HP Elite Dragonfly G3 | |
| Asus Zenbook S 13 OLED | |
| Lenovo ThinkBook 13s G3 20YA0005GE | |
| Lenovo ThinkPad X13 G3 21CM002UGE | |
| HWBOT x265 Benchmark v2.2 / 4k Preset | |
| Framework Laptop 13.5 13th Gen Intel | |
| Dell XPS 13 Plus 9320 i7-1280P OLED | |
| Asus Zenbook S 13 OLED | |
| Samsung Galaxy Book3 15, Core i5-1335U | |
| Lenovo ThinkBook 13s G3 20YA0005GE | |
| Média Intel Core i7-1365U (8.61 - 10.3, n=4) | |
| Lenovo ThinkPad X13 G3 21CM002UGE | |
| Lenovo Yoga 6 13ALC6 | |
| HP Dragonfly G4 | |
| Dell Latitude 9330 | |
| HP Elite Dragonfly G3 | |
| Dell XPS 13 7390 Core i7-10710U | |
| Dell Inspiron 13 7306-6TYH5 | |
| LibreOffice / 20 Documents To PDF | |
| Lenovo ThinkPad X13 G3 21CM002UGE | |
| Lenovo Yoga 6 13ALC6 | |
| HP Elite Dragonfly G3 | |
| Asus Zenbook S 13 OLED | |
| Dell Latitude 9330 | |
| Lenovo ThinkBook 13s G3 20YA0005GE | |
| Dell XPS 13 Plus 9320 i7-1280P OLED | |
| Samsung Galaxy Book3 15, Core i5-1335U | |
| Dell Inspiron 13 7306-6TYH5 | |
| HP Dragonfly G4 | |
| Média Intel Core i7-1365U (42.2 - 47.5, n=4) | |
| Framework Laptop 13.5 13th Gen Intel | |
| R Benchmark 2.5 / Overall mean | |
| Lenovo ThinkPad X13 G3 21CM002UGE | |
| Lenovo Yoga 6 13ALC6 | |
| Dell Inspiron 13 7306-6TYH5 | |
| Lenovo ThinkBook 13s G3 20YA0005GE | |
| HP Elite Dragonfly G3 | |
| Dell Latitude 9330 | |
| Asus Zenbook S 13 OLED | |
| Samsung Galaxy Book3 15, Core i5-1335U | |
| Dell XPS 13 Plus 9320 i7-1280P OLED | |
| HP Dragonfly G4 | |
| Média Intel Core i7-1365U (0.4504 - 0.4586, n=4) | |
| Framework Laptop 13.5 13th Gen Intel | |
Cinebench R23: Multi Core | Single Core
Cinebench R20: CPU (Multi Core) | CPU (Single Core)
Cinebench R15: CPU Multi 64Bit | CPU Single 64Bit
Blender: v2.79 BMW27 CPU
7-Zip 18.03: 7z b 4 | 7z b 4 -mmt1
Geekbench 5.5: Multi-Core | Single-Core
HWBOT x265 Benchmark v2.2: 4k Preset
LibreOffice : 20 Documents To PDF
R Benchmark 2.5: Overall mean
* ... menor é melhor
AIDA64: FP32 Ray-Trace | FPU Julia | CPU SHA3 | CPU Queen | FPU SinJulia | FPU Mandel | CPU AES | CPU ZLib | FP64 Ray-Trace | CPU PhotoWorxx
| Performance rating | |
| Framework Laptop 13.5 13th Gen Intel | |
| Lenovo ThinkPad X13 G3 21CM002UGE | |
| Média Intel Core i7-1365U | |
| HP Dragonfly G4 | |
| Dell Latitude 9330 | |
| HP Elite Dragonfly G3 | |
| AIDA64 / FP32 Ray-Trace | |
| Framework Laptop 13.5 13th Gen Intel | |
| Lenovo ThinkPad X13 G3 21CM002UGE | |
| Média Intel Core i7-1365U (6720 - 8270, n=4) | |
| HP Dragonfly G4 | |
| Dell Latitude 9330 | |
| HP Elite Dragonfly G3 | |
| AIDA64 / FPU Julia | |
| Framework Laptop 13.5 13th Gen Intel | |
| Lenovo ThinkPad X13 G3 21CM002UGE | |
| Média Intel Core i7-1365U (33777 - 41487, n=4) | |
| Dell Latitude 9330 | |
| HP Dragonfly G4 | |
| HP Elite Dragonfly G3 | |
| AIDA64 / CPU SHA3 | |
| Framework Laptop 13.5 13th Gen Intel | |
| Média Intel Core i7-1365U (1754 - 2216, n=4) | |
| Lenovo ThinkPad X13 G3 21CM002UGE | |
| Dell Latitude 9330 | |
| HP Dragonfly G4 | |
| HP Elite Dragonfly G3 | |
| AIDA64 / CPU Queen | |
| Framework Laptop 13.5 13th Gen Intel | |
| HP Dragonfly G4 | |
| Lenovo ThinkPad X13 G3 21CM002UGE | |
| Média Intel Core i7-1365U (67557 - 69991, n=4) | |
| HP Elite Dragonfly G3 | |
| Dell Latitude 9330 | |
| AIDA64 / FPU SinJulia | |
| Framework Laptop 13.5 13th Gen Intel | |
| Lenovo ThinkPad X13 G3 21CM002UGE | |
| Média Intel Core i7-1365U (4589 - 5145, n=4) | |
| HP Dragonfly G4 | |
| HP Elite Dragonfly G3 | |
| Dell Latitude 9330 | |
| AIDA64 / FPU Mandel | |
| Lenovo ThinkPad X13 G3 21CM002UGE | |
| Framework Laptop 13.5 13th Gen Intel | |
| Média Intel Core i7-1365U (16808 - 20668, n=4) | |
| Dell Latitude 9330 | |
| HP Dragonfly G4 | |
| HP Elite Dragonfly G3 | |
| AIDA64 / CPU AES | |
| Framework Laptop 13.5 13th Gen Intel | |
| Média Intel Core i7-1365U (34968 - 41413, n=4) | |
| Lenovo ThinkPad X13 G3 21CM002UGE | |
| HP Dragonfly G4 | |
| Dell Latitude 9330 | |
| HP Elite Dragonfly G3 | |
| AIDA64 / CPU ZLib | |
| Framework Laptop 13.5 13th Gen Intel | |
| Média Intel Core i7-1365U (519 - 650, n=4) | |
| HP Dragonfly G4 | |
| Dell Latitude 9330 | |
| Lenovo ThinkPad X13 G3 21CM002UGE | |
| HP Elite Dragonfly G3 | |
| AIDA64 / FP64 Ray-Trace | |
| Framework Laptop 13.5 13th Gen Intel | |
| Lenovo ThinkPad X13 G3 21CM002UGE | |
| Média Intel Core i7-1365U (3513 - 4367, n=4) | |
| Dell Latitude 9330 | |
| HP Dragonfly G4 | |
| HP Elite Dragonfly G3 | |
| AIDA64 / CPU PhotoWorxx | |
| Média Intel Core i7-1365U (37846 - 43780, n=4) | |
| HP Elite Dragonfly G3 | |
| HP Dragonfly G4 | |
| Dell Latitude 9330 | |
| Framework Laptop 13.5 13th Gen Intel | |
| Lenovo ThinkPad X13 G3 21CM002UGE | |
Desempenho do sistema
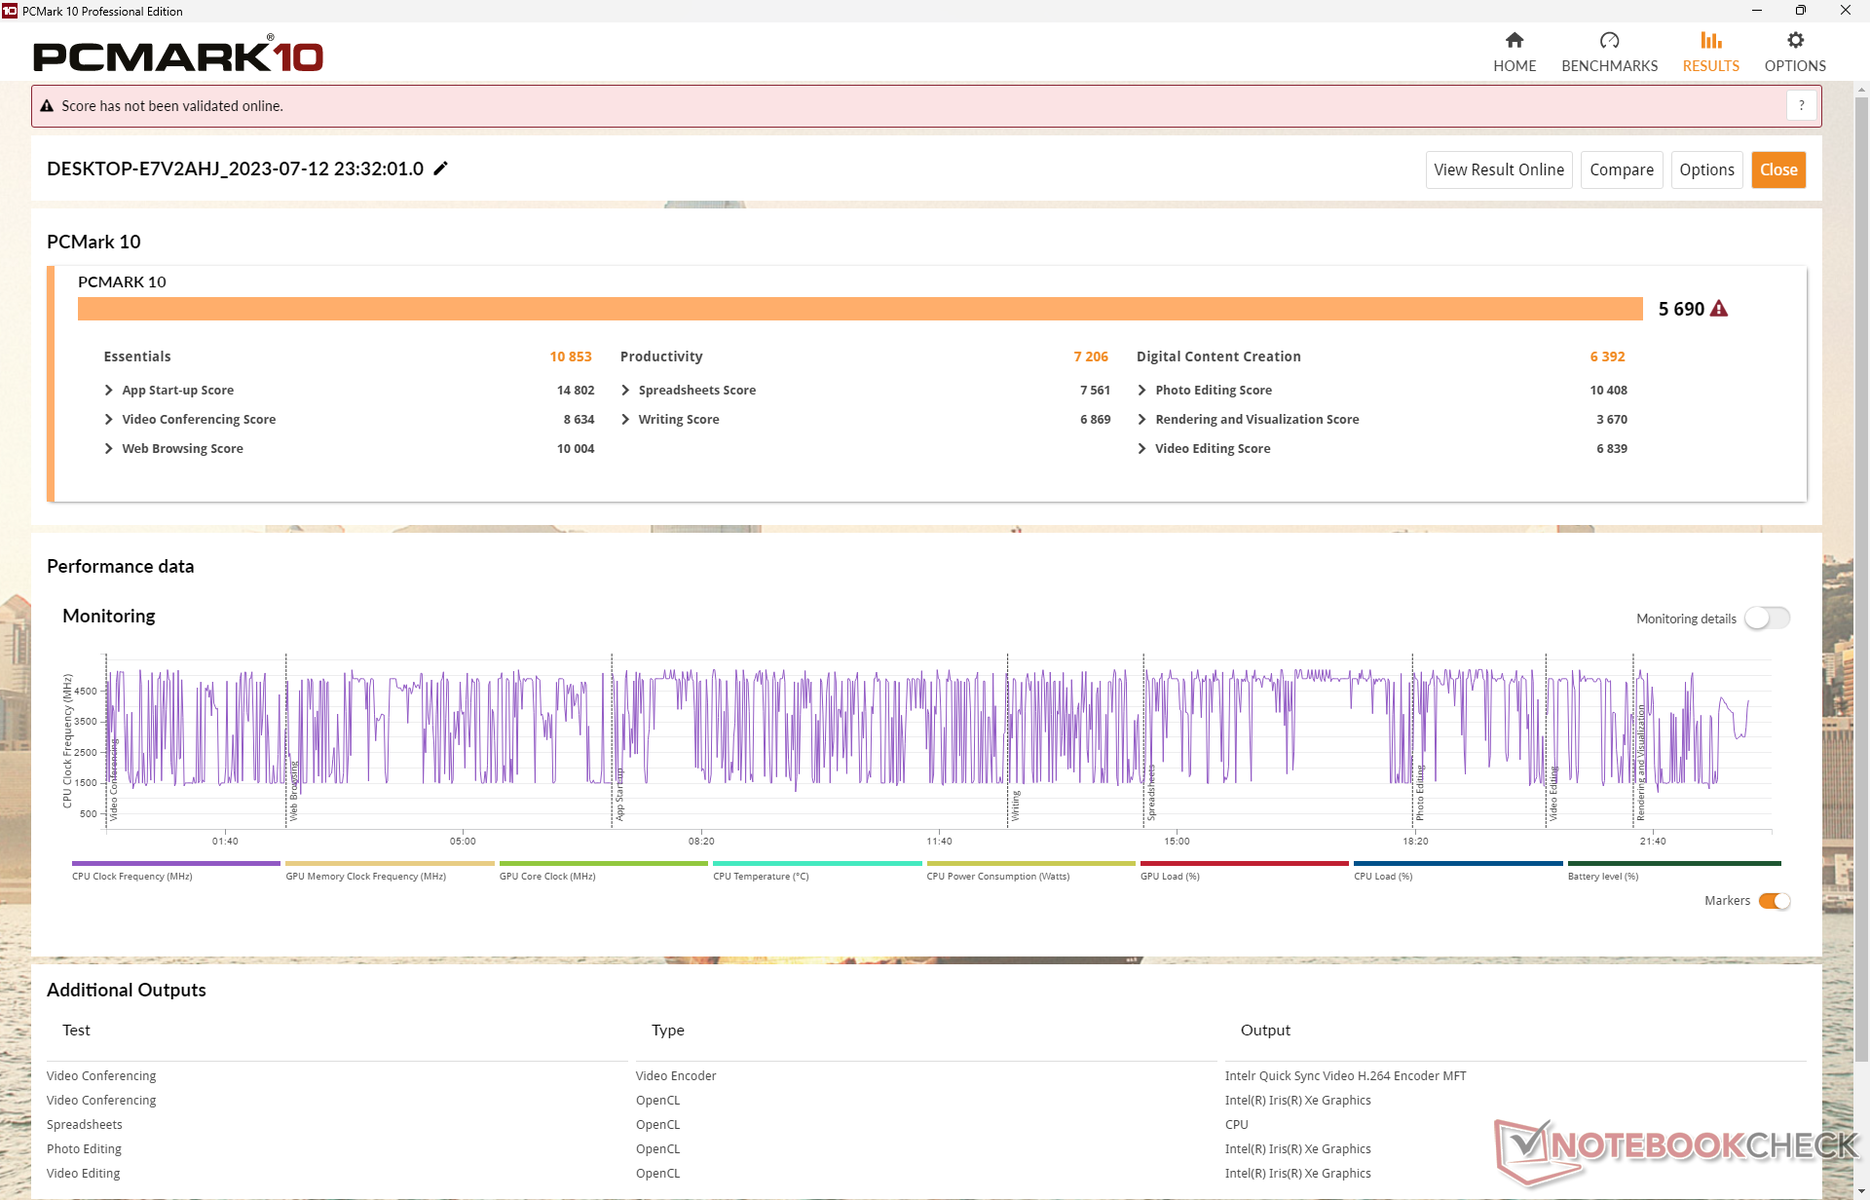
As pontuações do PCMark são consistentemente mais altas do que as do modelo do ano passado, mas ficam um pouco abaixo do Framework 13.5 e de sua CPU Core-P mais rápida. Os resultados são comparáveis aos doDell Latitude 9440 2 em 1 que vem com a mesma CPU Core i7-1365U.
CrossMark: Overall | Productivity | Creativity | Responsiveness
| PCMark 10 / Score | |
| Framework Laptop 13.5 13th Gen Intel | |
| Média Intel Core i7-1365U, Intel Iris Xe Graphics G7 96EUs (5690 - 5980, n=4) | |
| HP Dragonfly G4 | |
| Lenovo ThinkPad X13 G3 21CM002UGE | |
| Dell Latitude 9330 | |
| HP Elite Dragonfly G3 | |
| PCMark 10 / Essentials | |
| Framework Laptop 13.5 13th Gen Intel | |
| Média Intel Core i7-1365U, Intel Iris Xe Graphics G7 96EUs (10635 - 11827, n=4) | |
| HP Dragonfly G4 | |
| Dell Latitude 9330 | |
| Lenovo ThinkPad X13 G3 21CM002UGE | |
| HP Elite Dragonfly G3 | |
| PCMark 10 / Productivity | |
| Lenovo ThinkPad X13 G3 21CM002UGE | |
| Framework Laptop 13.5 13th Gen Intel | |
| Média Intel Core i7-1365U, Intel Iris Xe Graphics G7 96EUs (7206 - 7708, n=4) | |
| HP Dragonfly G4 | |
| Dell Latitude 9330 | |
| HP Elite Dragonfly G3 | |
| PCMark 10 / Digital Content Creation | |
| Framework Laptop 13.5 13th Gen Intel | |
| Média Intel Core i7-1365U, Intel Iris Xe Graphics G7 96EUs (6392 - 6735, n=4) | |
| HP Dragonfly G4 | |
| Lenovo ThinkPad X13 G3 21CM002UGE | |
| HP Elite Dragonfly G3 | |
| Dell Latitude 9330 | |
| CrossMark / Overall | |
| Framework Laptop 13.5 13th Gen Intel | |
| Média Intel Core i7-1365U, Intel Iris Xe Graphics G7 96EUs (1605 - 1675, n=4) | |
| HP Dragonfly G4 | |
| Apple MacBook Air M2 Entry | |
| HP Elite Dragonfly G3 | |
| Lenovo ThinkPad X13 G3 21CM002UGE | |
| CrossMark / Productivity | |
| Framework Laptop 13.5 13th Gen Intel | |
| HP Dragonfly G4 | |
| Média Intel Core i7-1365U, Intel Iris Xe Graphics G7 96EUs (1582 - 1650, n=4) | |
| HP Elite Dragonfly G3 | |
| Apple MacBook Air M2 Entry | |
| Lenovo ThinkPad X13 G3 21CM002UGE | |
| CrossMark / Creativity | |
| Framework Laptop 13.5 13th Gen Intel | |
| Apple MacBook Air M2 Entry | |
| Média Intel Core i7-1365U, Intel Iris Xe Graphics G7 96EUs (1713 - 1797, n=4) | |
| HP Dragonfly G4 | |
| HP Elite Dragonfly G3 | |
| Lenovo ThinkPad X13 G3 21CM002UGE | |
| CrossMark / Responsiveness | |
| Framework Laptop 13.5 13th Gen Intel | |
| Média Intel Core i7-1365U, Intel Iris Xe Graphics G7 96EUs (1373 - 1427, n=4) | |
| HP Dragonfly G4 | |
| HP Elite Dragonfly G3 | |
| Lenovo ThinkPad X13 G3 21CM002UGE | |
| Apple MacBook Air M2 Entry | |
| PCMark 10 Score | 5690 pontos | |
Ajuda | ||
| AIDA64 / Memory Copy | |
| Dell Latitude 9330 | |
| HP Elite Dragonfly G3 | |
| Média Intel Core i7-1365U (57654 - 69736, n=4) | |
| HP Dragonfly G4 | |
| Lenovo ThinkPad X13 G3 21CM002UGE | |
| Framework Laptop 13.5 13th Gen Intel | |
| AIDA64 / Memory Read | |
| HP Elite Dragonfly G3 | |
| Dell Latitude 9330 | |
| Média Intel Core i7-1365U (49203 - 54068, n=4) | |
| Framework Laptop 13.5 13th Gen Intel | |
| HP Dragonfly G4 | |
| Lenovo ThinkPad X13 G3 21CM002UGE | |
| AIDA64 / Memory Write | |
| Média Intel Core i7-1365U (70434 - 85570, n=4) | |
| HP Dragonfly G4 | |
| Dell Latitude 9330 | |
| HP Elite Dragonfly G3 | |
| Lenovo ThinkPad X13 G3 21CM002UGE | |
| Framework Laptop 13.5 13th Gen Intel | |
| AIDA64 / Memory Latency | |
| Lenovo ThinkPad X13 G3 21CM002UGE | |
| Dell Latitude 9330 | |
| HP Elite Dragonfly G3 | |
| Média Intel Core i7-1365U (90.2 - 102.2, n=4) | |
| HP Dragonfly G4 | |
| Framework Laptop 13.5 13th Gen Intel | |
* ... menor é melhor
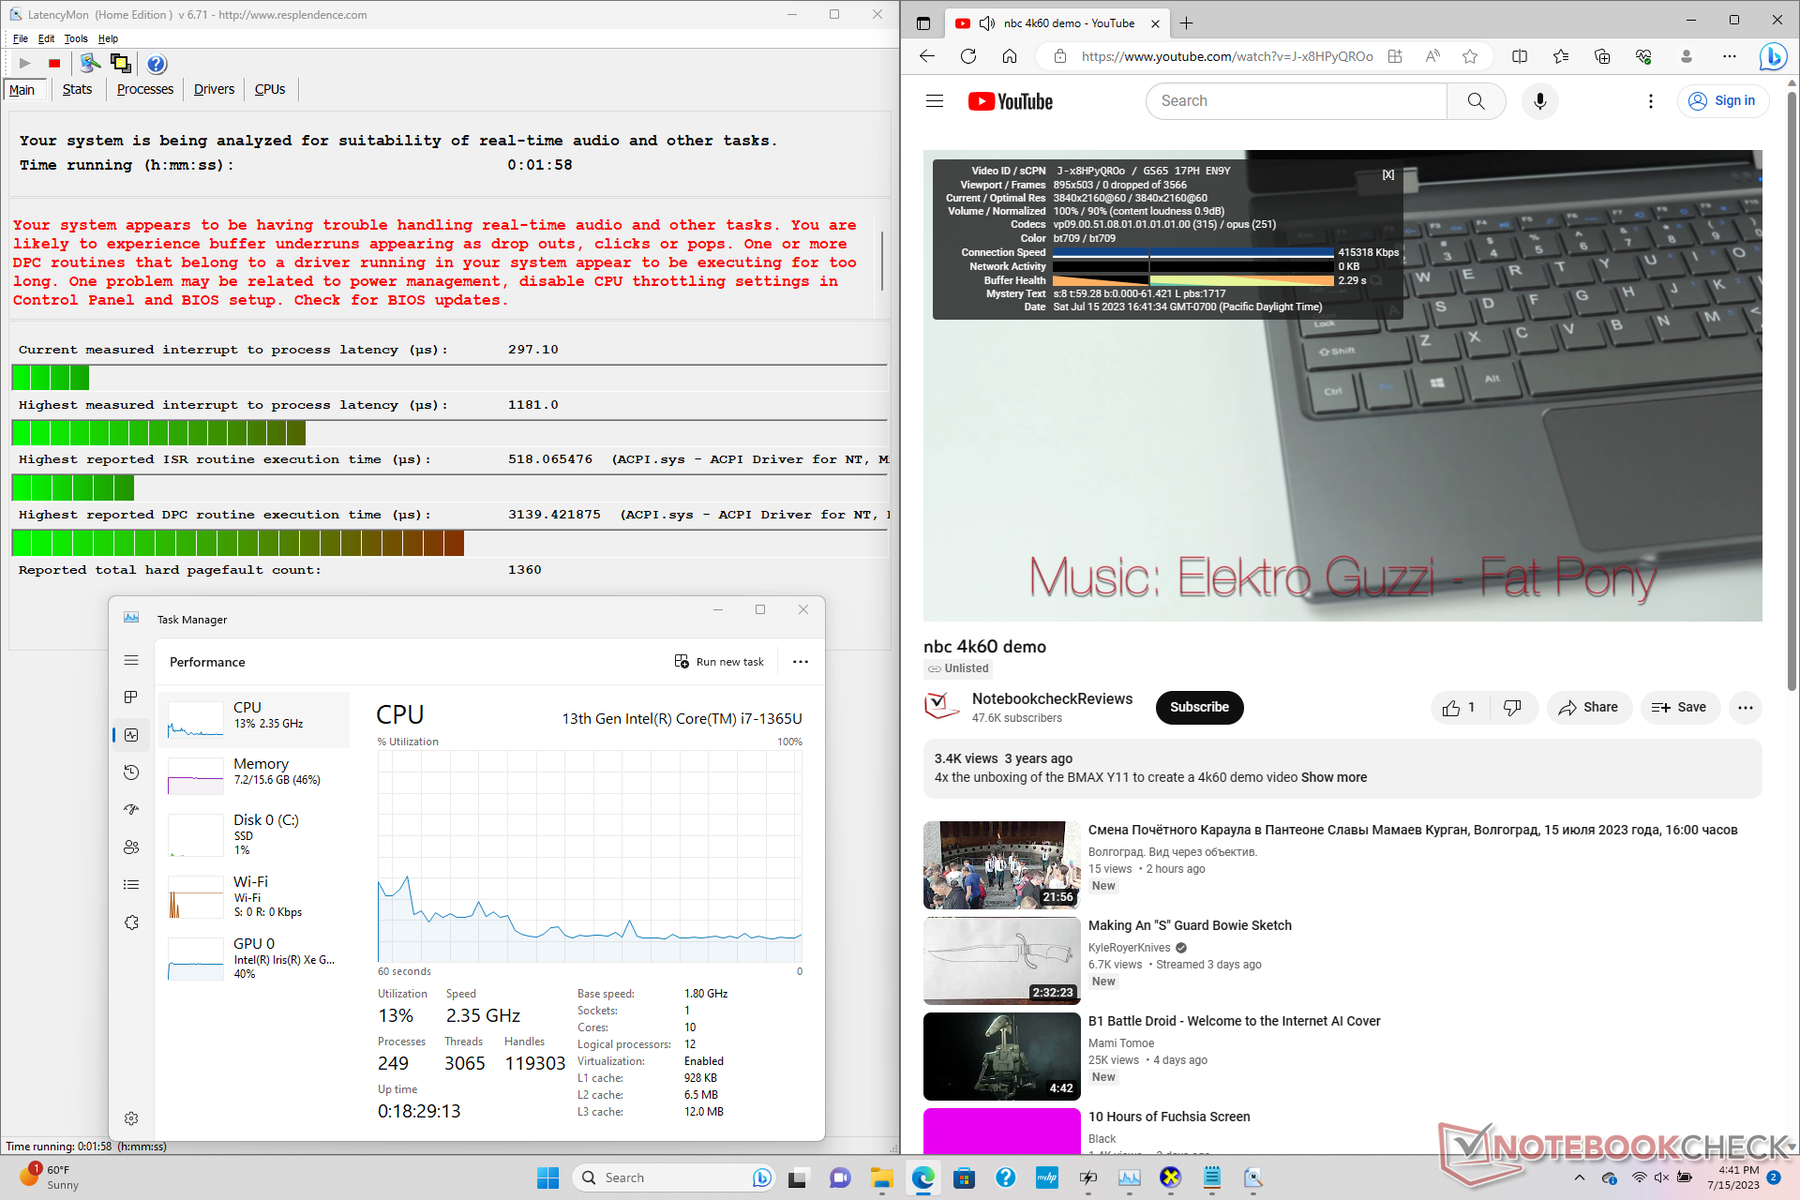
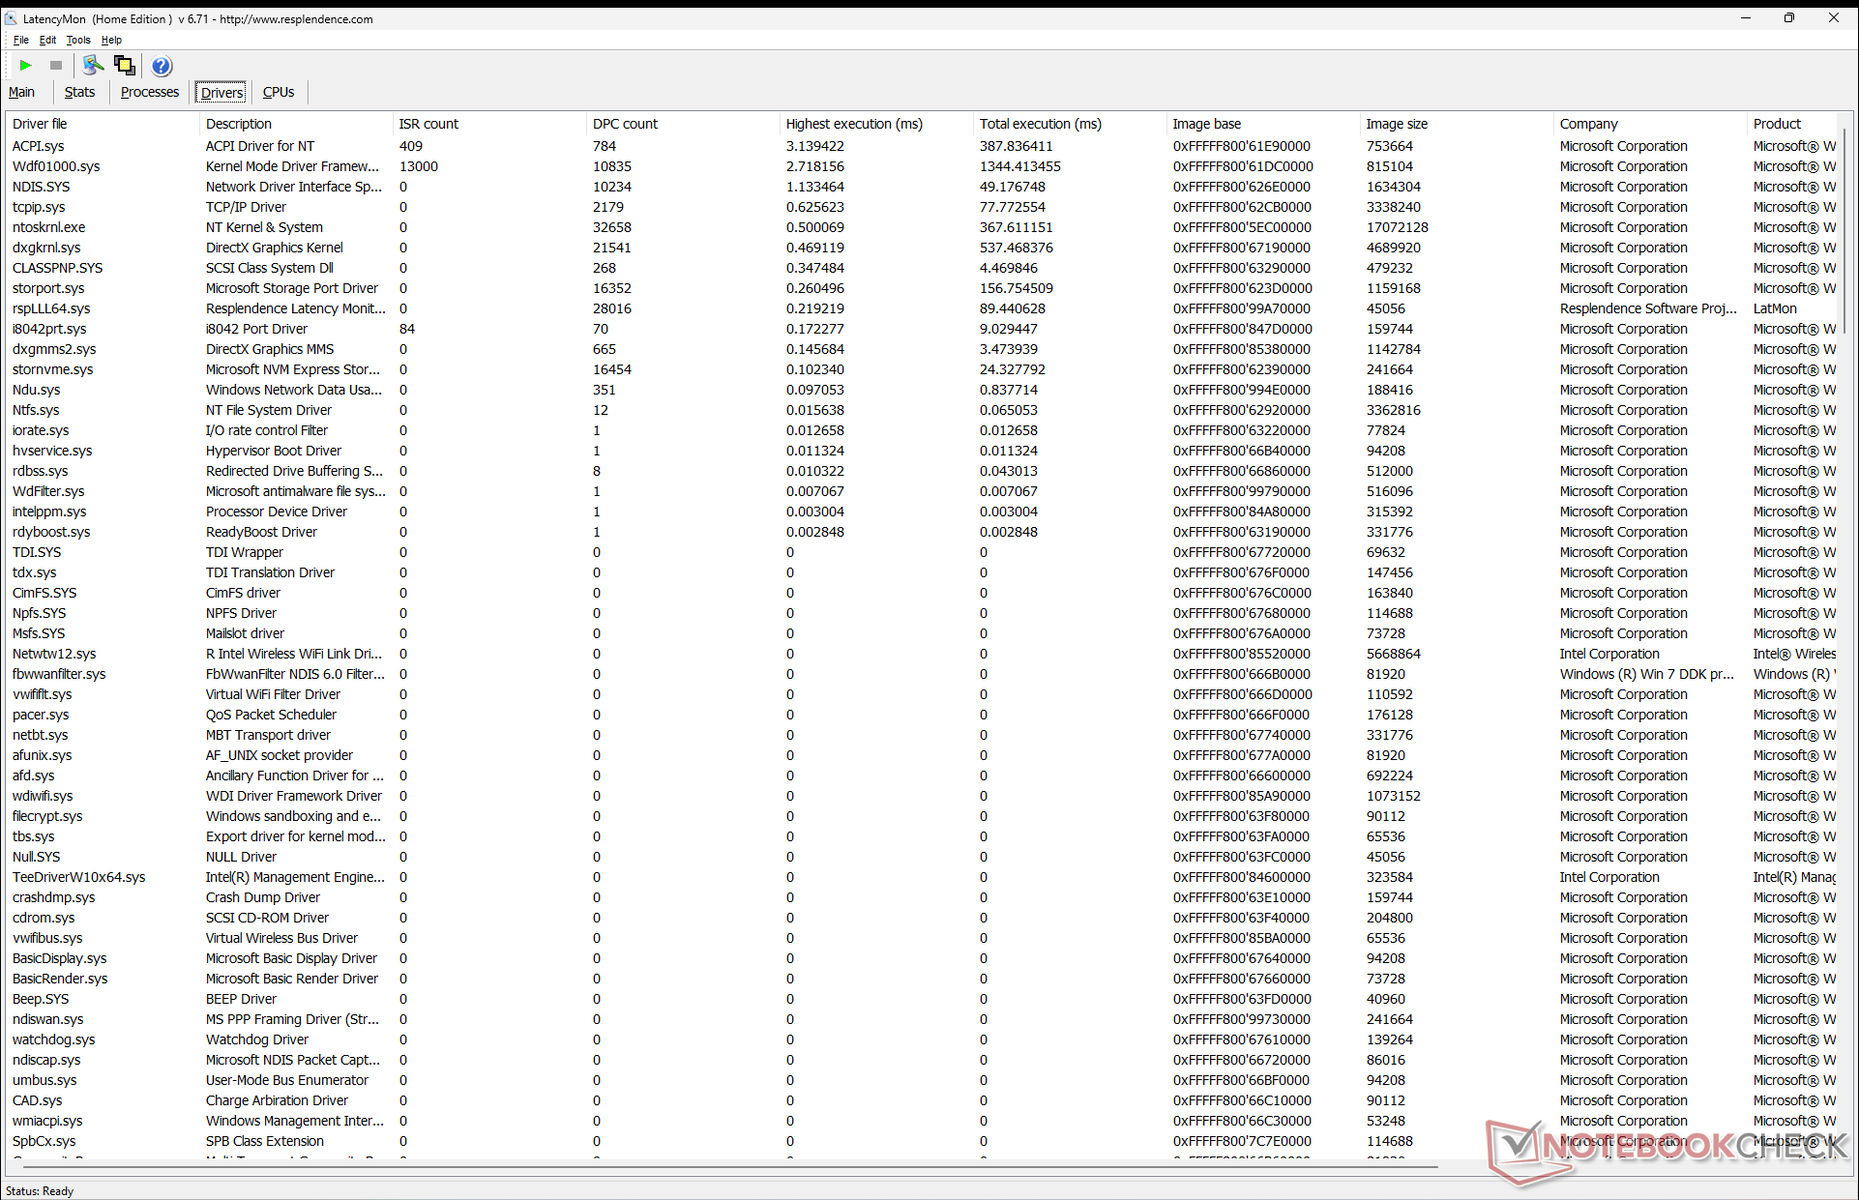
Latência DPC
O LatencyMon mostra apenas pequenos problemas de DPC ao abrir várias guias do navegador em nossa página inicial. a reprodução de vídeo 4K a 60 FPS é perfeita, sem perda de quadros.
| DPC Latencies / LatencyMon - interrupt to process latency (max), Web, Youtube, Prime95 | |
| Dell Latitude 9330 | |
| HP Dragonfly G4 | |
| HP Elite Dragonfly G3 | |
| Lenovo ThinkPad X13 G3 21CM002UGE | |
| Framework Laptop 13.5 13th Gen Intel | |
* ... menor é melhor
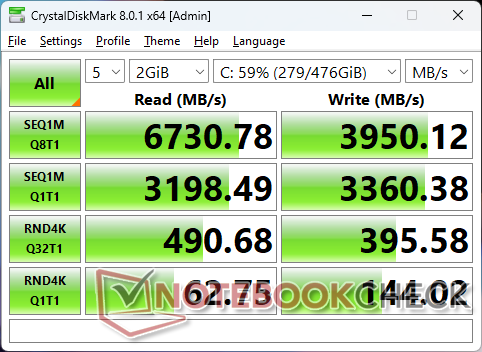
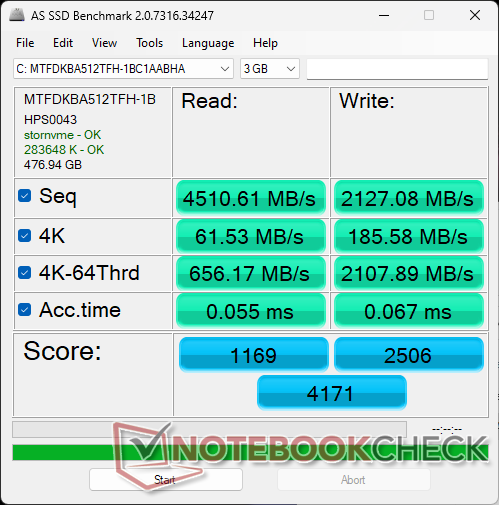
Dispositivos de armazenamento
A HP está usando o SSD Micron 3400 NVMe pelo segundo ano consecutivo, em contraste com a série Dell XPS 13, que pode incluir SSDs da Samsung, Micron ou Western Digital.

| Drive Performance rating - Percent | |
| Framework Laptop 13.5 13th Gen Intel | |
| HP Dragonfly G4 | |
| Lenovo ThinkPad X13 G3 21CM002UGE | |
| HP Elite Dragonfly G3 | |
| Dell Latitude 9330 | |
* ... menor é melhor
Disk Throttling: DiskSpd Read Loop, Queue Depth 8
Desempenho da GPU
O desempenho gráfico é um pouco mais rápido do que no Dragonfly G3 do ano passado, devido principalmente à CPU um pouco mais rápida. Para obter um aumento mais significativo, os compradores terão que procurar em outro lugar a AMD Radeon 680M ou 780M como noAsus Zenbook S 13 ou no Lenovo Yoga Pro 7 14.
A execução do sistema no modo balanceado em vez do modo de desempenho pode prejudicar o desempenho da CPU e da GPU em até 12% e 6%, respectivamente, como mostra a tabela de comparação do 3DMark 11 abaixo.
| Perfil de energia | Pontuação de gráficos | Pontuação de física | Pontuação combinada |
| Modo equilibrado | 6061 (-6%) | 10145 (-12%) | 4879 (-16%) |
| Modo de desempenho | 6440 | 11465 | 5780 |
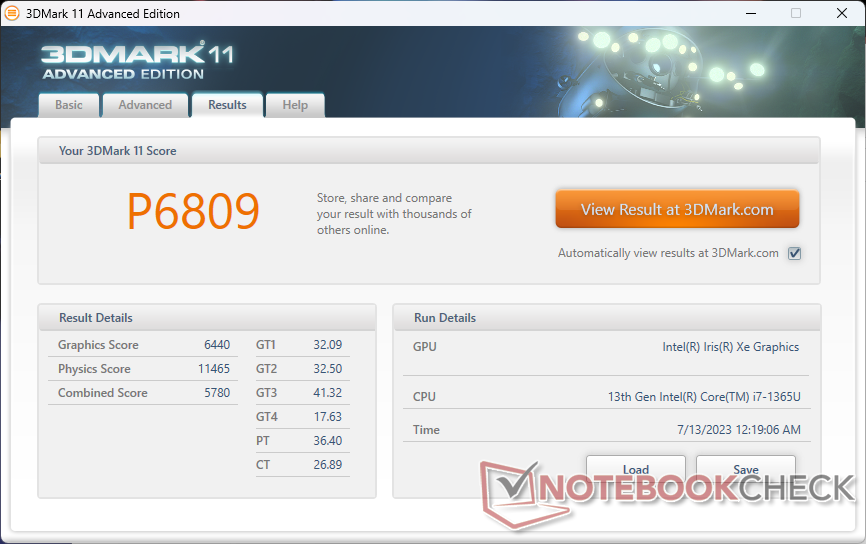
| 3DMark 11 Performance | 6809 pontos | |
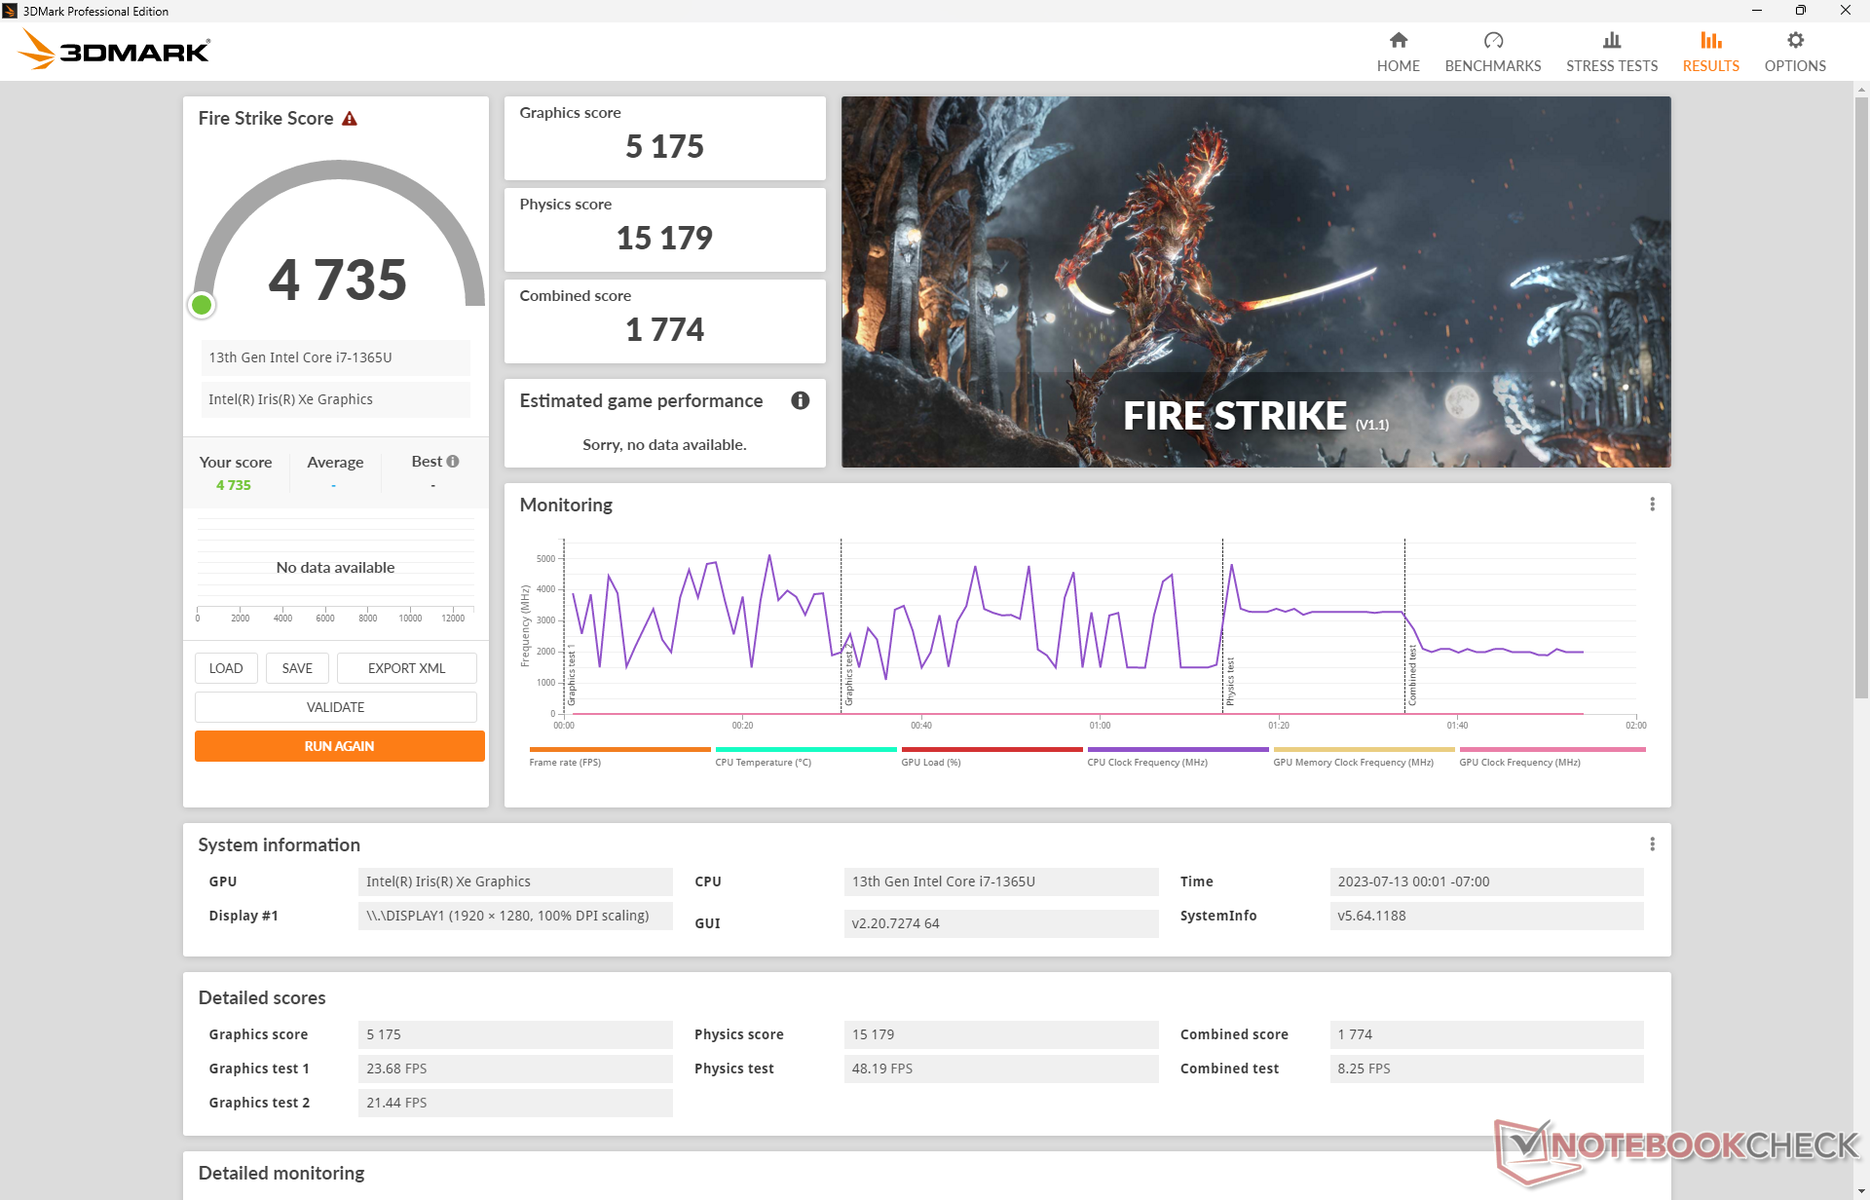
| 3DMark Fire Strike Score | 4735 pontos | |
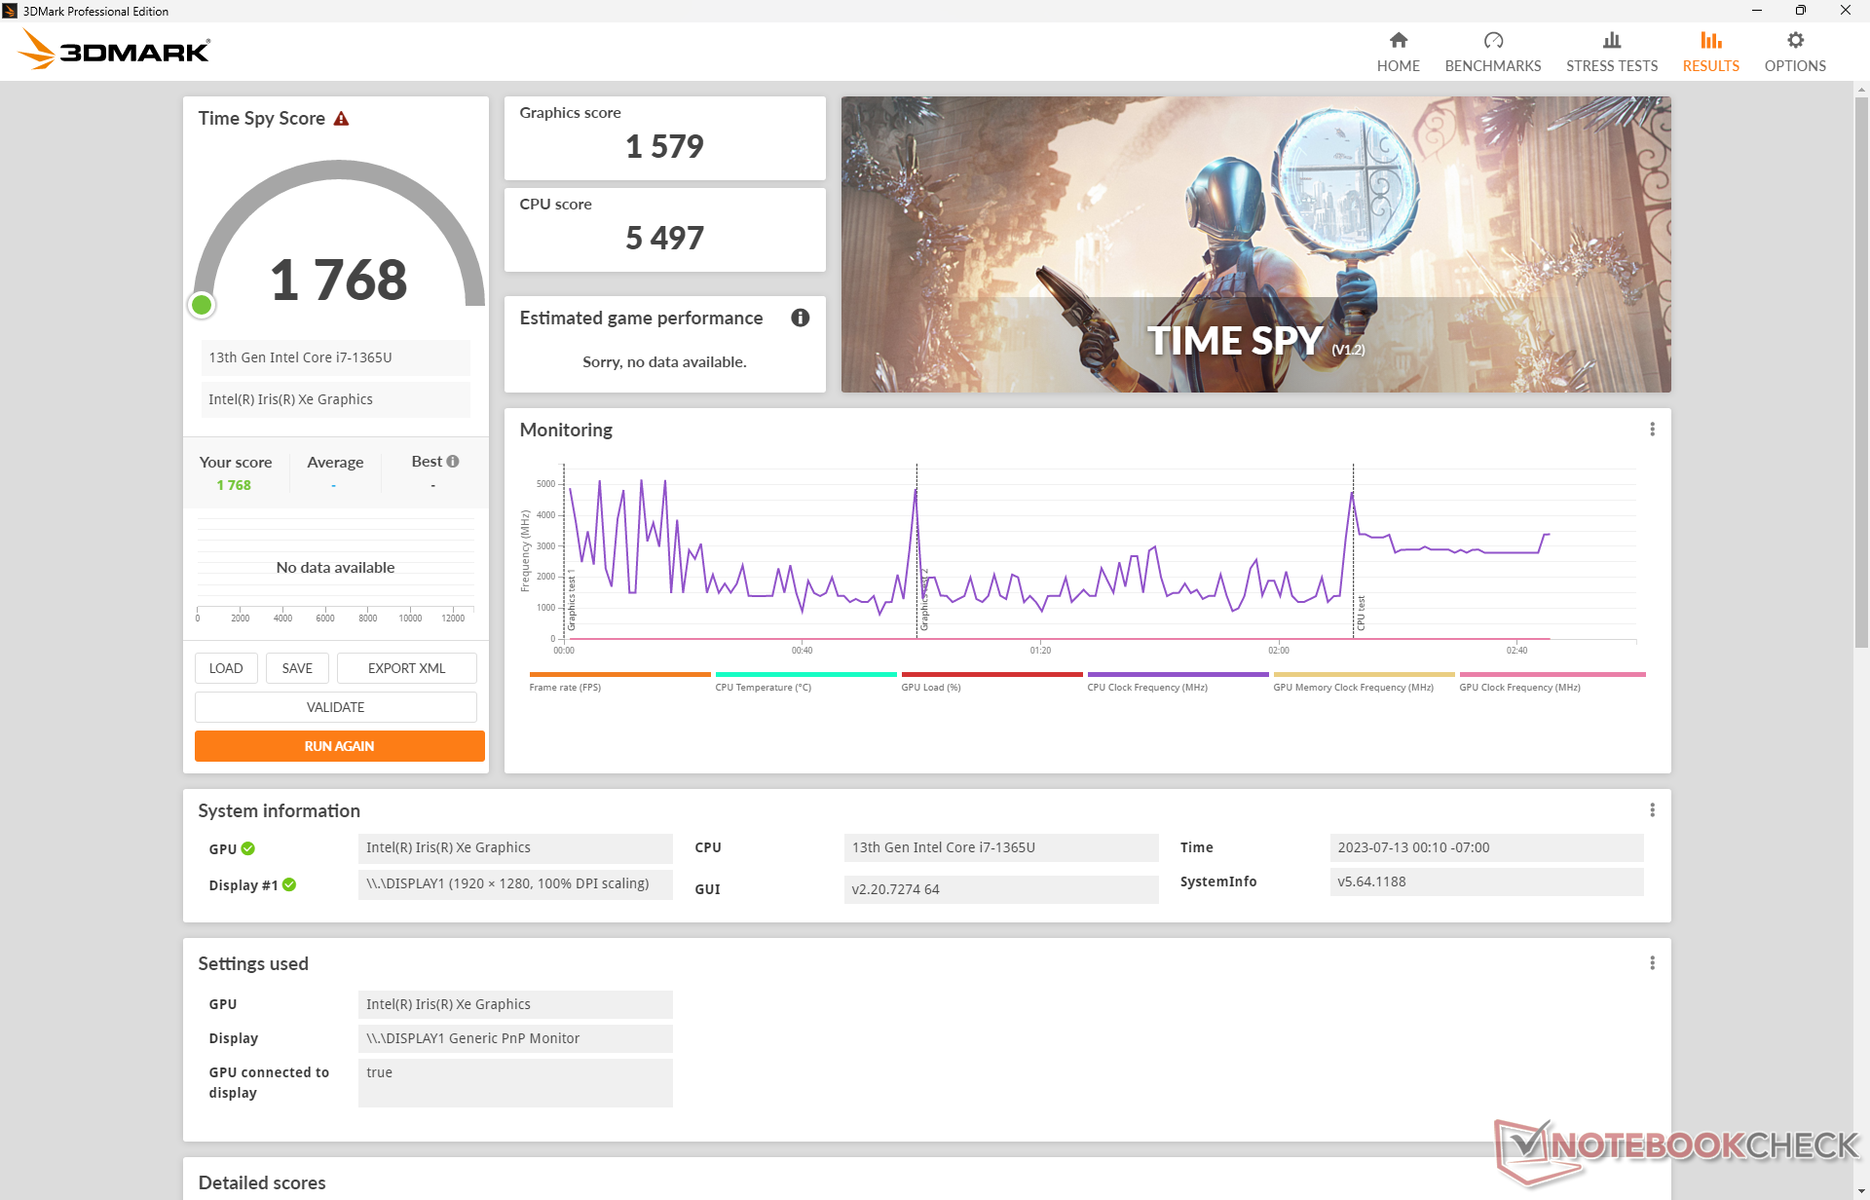
| 3DMark Time Spy Score | 1768 pontos | |
Ajuda | ||
* ... menor é melhor
| Tiny Tina's Wonderlands | |
| 1280x720 Lowest Preset (DX12) | |
| HP Dragonfly G4 | |
| Média Intel Iris Xe Graphics G7 96EUs (25.9 - 67.3, n=32) | |
| 1920x1080 Low Preset (DX12) | |
| Framework Laptop 13.5 13th Gen Intel | |
| Média Intel Iris Xe Graphics G7 96EUs (22.3 - 53, n=32) | |
| HP Dragonfly G4 | |
| 1920x1080 Medium Preset (DX12) | |
| Framework Laptop 13.5 13th Gen Intel | |
| Média Intel Iris Xe Graphics G7 96EUs (17 - 40.1, n=30) | |
| HP Dragonfly G4 | |
| 1920x1080 High Preset (DX12) | |
| Framework Laptop 13.5 13th Gen Intel | |
| Média Intel Iris Xe Graphics G7 96EUs (10.6 - 24.1, n=29) | |
| HP Dragonfly G4 | |
| 1920x1080 Badass Preset (DX12) | |
| Framework Laptop 13.5 13th Gen Intel | |
| Média Intel Iris Xe Graphics G7 96EUs (8.4 - 18.4, n=26) | |
| HP Dragonfly G4 | |
| F1 22 | |
| 1280x720 Ultra Low Preset AA:T AF:16x | |
| Framework Laptop 13.5 13th Gen Intel | |
| Média Intel Iris Xe Graphics G7 96EUs (57.4 - 94.9, n=53) | |
| HP Dragonfly G4 | |
| Lenovo ThinkPad X13 G3 21CM002UGE | |
| 1920x1080 Low Preset AA:T AF:16x | |
| Framework Laptop 13.5 13th Gen Intel | |
| Média Intel Iris Xe Graphics G7 96EUs (33.3 - 57.2, n=58) | |
| HP Dragonfly G4 | |
| Lenovo ThinkPad X13 G3 21CM002UGE | |
| 1920x1080 Medium Preset AA:T AF:16x | |
| Framework Laptop 13.5 13th Gen Intel | |
| Média Intel Iris Xe Graphics G7 96EUs (28 - 52.3, n=58) | |
| HP Dragonfly G4 | |
| Lenovo ThinkPad X13 G3 21CM002UGE | |
| 1920x1080 High Preset AA:T AF:16x | |
| Framework Laptop 13.5 13th Gen Intel | |
| Média Intel Iris Xe Graphics G7 96EUs (21.7 - 37.1, n=58) | |
| HP Dragonfly G4 | |
| Lenovo ThinkPad X13 G3 21CM002UGE | |
| 1920x1080 Ultra High Preset AA:T AF:16x | |
| Framework Laptop 13.5 13th Gen Intel | |
| Média Intel Iris Xe Graphics G7 96EUs (16.1 - 28.2, n=49) | |
| HP Dragonfly G4 | |
| Lenovo ThinkPad X13 G3 21CM002UGE | |
Witcher 3 FPS Chart
| baixo | média | alto | ultra | |
|---|---|---|---|---|
| GTA V (2015) | 99.8 | 84.1 | 23.4 | 10.1 |
| The Witcher 3 (2015) | 78.9 | 54.2 | 31 | 14.7 |
| Dota 2 Reborn (2015) | 101.4 | 76.3 | 60.2 | 53.3 |
| Final Fantasy XV Benchmark (2018) | 40.9 | 23.2 | 16.4 | |
| X-Plane 11.11 (2018) | 37.6 | 31.8 | 29.1 | |
| Strange Brigade (2018) | 88.8 | 38.4 | 30.4 | 24.7 |
| Cyberpunk 2077 1.6 (2022) | 19.7 | 16.3 | 12.7 | 9.3 |
| Tiny Tina's Wonderlands (2022) | 25.9 | 21.2 | 14.1 | 11.1 |
| F1 22 (2022) | 43.6 | 39.4 | 27.4 | 22.2 |
Emissões
Ruído do sistema
Os notebooks HP Dragonfly são geralmente mais silenciosos do que a maioria dos modelos concorrentes, ao custo de taxas de clock da CPU mais lentas do que a média. Conseguimos medir um máximo de apenas 35 dB(A) em comparação com mais de 40 dB(A) noLatitude 9330. Mesmo assim, o máximo de 35 dB(A) é apenas um breve surto antes de cair e se estabilizar em torno de 33 dB(A) ao executar cargas exigentes.
Barulho
| Ocioso |
| 23.5 / 23.5 / 26.8 dB |
| Carga |
| 27.2 / 35 dB |
 | ||
30 dB silencioso 40 dB(A) audível 50 dB(A) ruidosamente alto |
||
min: | ||
| HP Dragonfly G4 Iris Xe G7 96EUs, i7-1365U, Micron 3400 MTFDKBA512TFH 512GB | HP Elite Dragonfly G3 Iris Xe G7 96EUs, i7-1265U, Micron 3400 MTFDKBA512TFH 512GB | Framework Laptop 13.5 13th Gen Intel Iris Xe G7 96EUs, i7-1370P, WD PC SN740 SDDPNQD-1T00 | Lenovo ThinkPad X13 G3 21CM002UGE Radeon 660M, R5 PRO 6650U, Samsung PM9A1 MZVL2512HCJQ | Dell Latitude 9330 Iris Xe G7 96EUs, i7-1260U | |
|---|---|---|---|---|---|
| Noise | 4% | -20% | 0% | -8% | |
| desligado / ambiente * (dB) | 23.3 | 22.8 2% | 23.2 -0% | 23.1 1% | 23 1% |
| Idle Minimum * (dB) | 23.5 | 23.2 1% | 23.2 1% | 23.1 2% | 23 2% |
| Idle Average * (dB) | 23.5 | 23.2 1% | 23.2 1% | 23.1 2% | 23.1 2% |
| Idle Maximum * (dB) | 26.8 | 23.2 13% | 23.2 13% | 23.1 14% | 23.1 14% |
| Load Average * (dB) | 27.2 | 25.1 8% | 45.3 -67% | 27 1% | 37.1 -36% |
| Witcher 3 ultra * (dB) | 32.7 | 32 2% | 47.9 -46% | 38.7 -18% | 40.6 -24% |
| Load Maximum * (dB) | 35 | 35.2 -1% | 49.2 -41% | 35.5 -1% | 40.5 -16% |
* ... menor é melhor
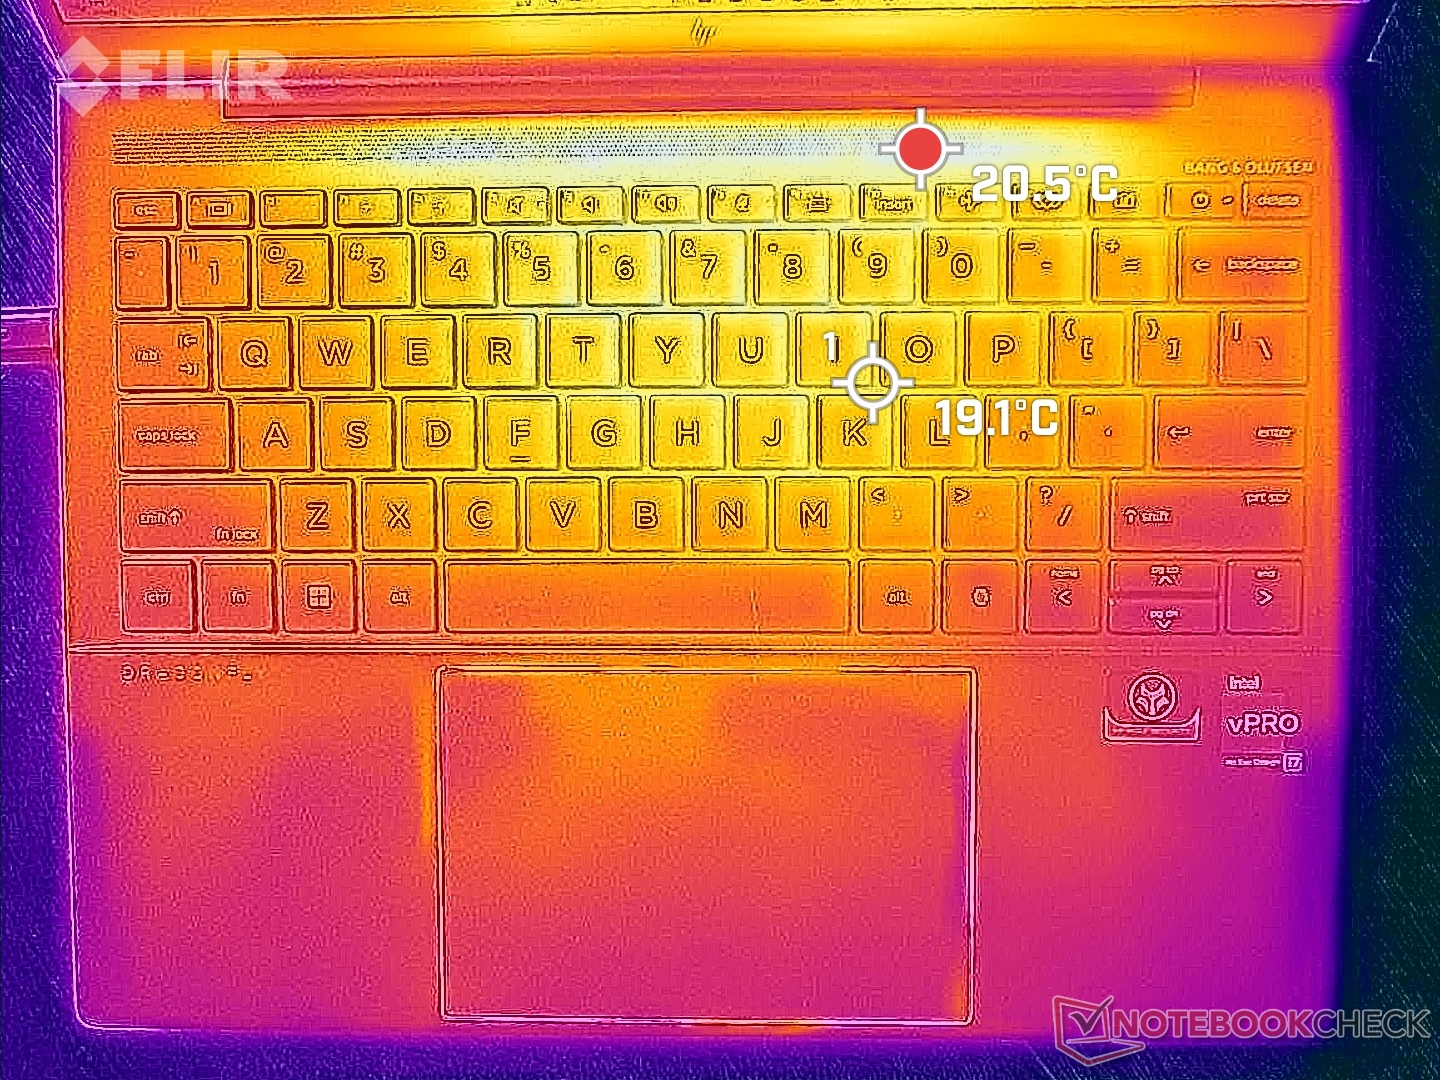
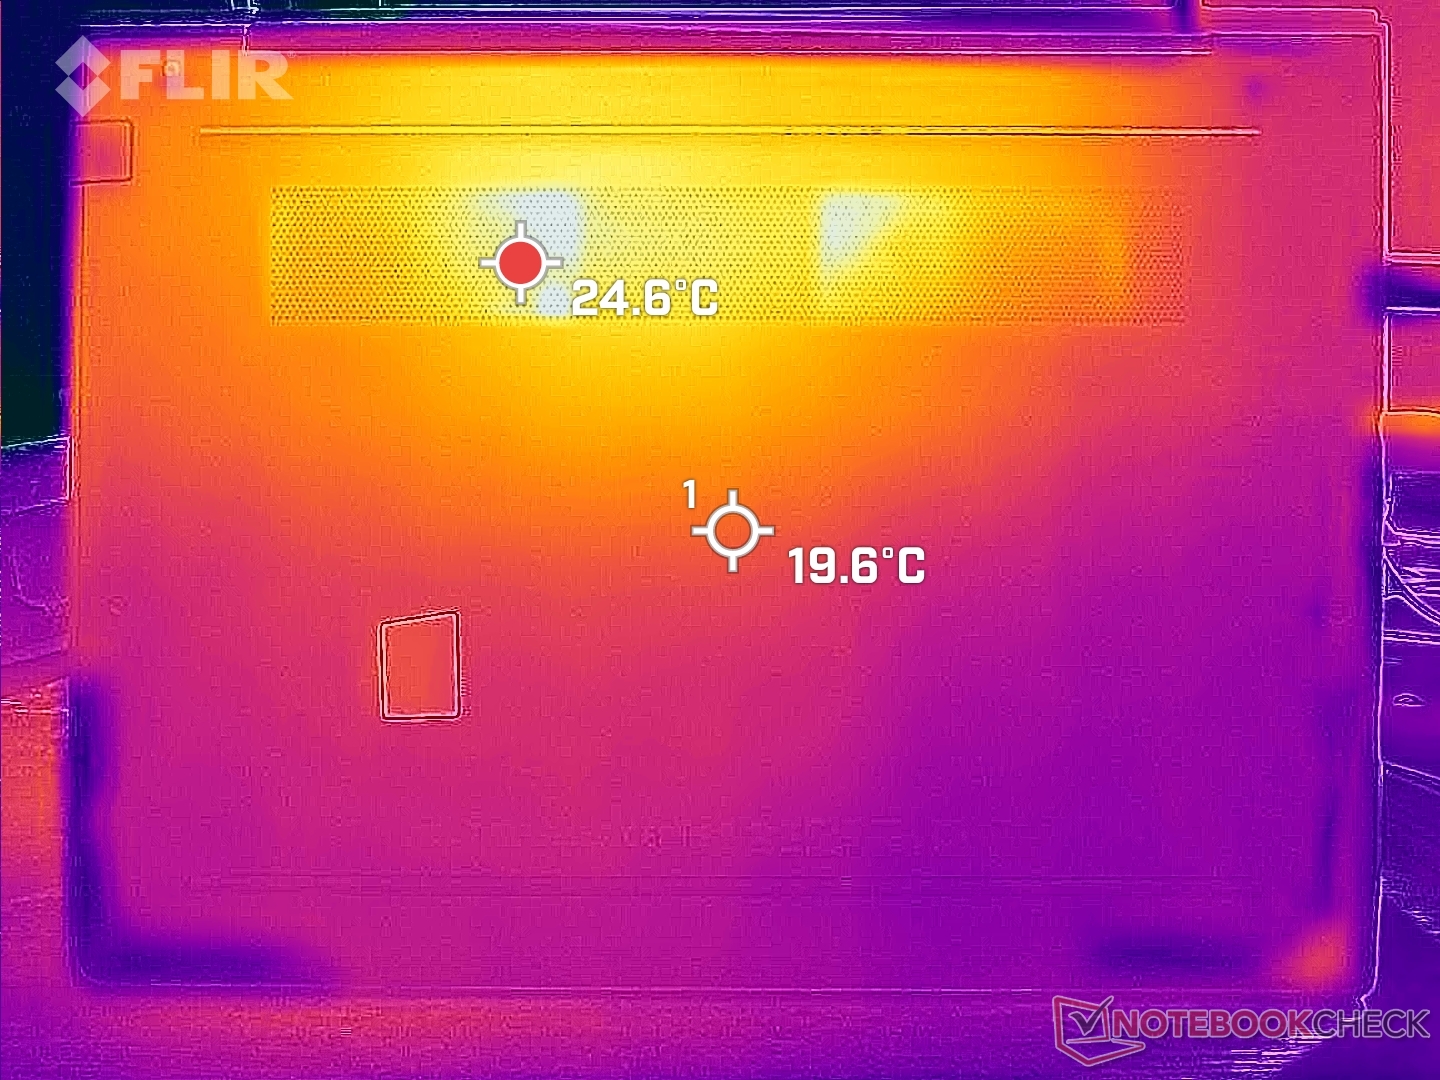
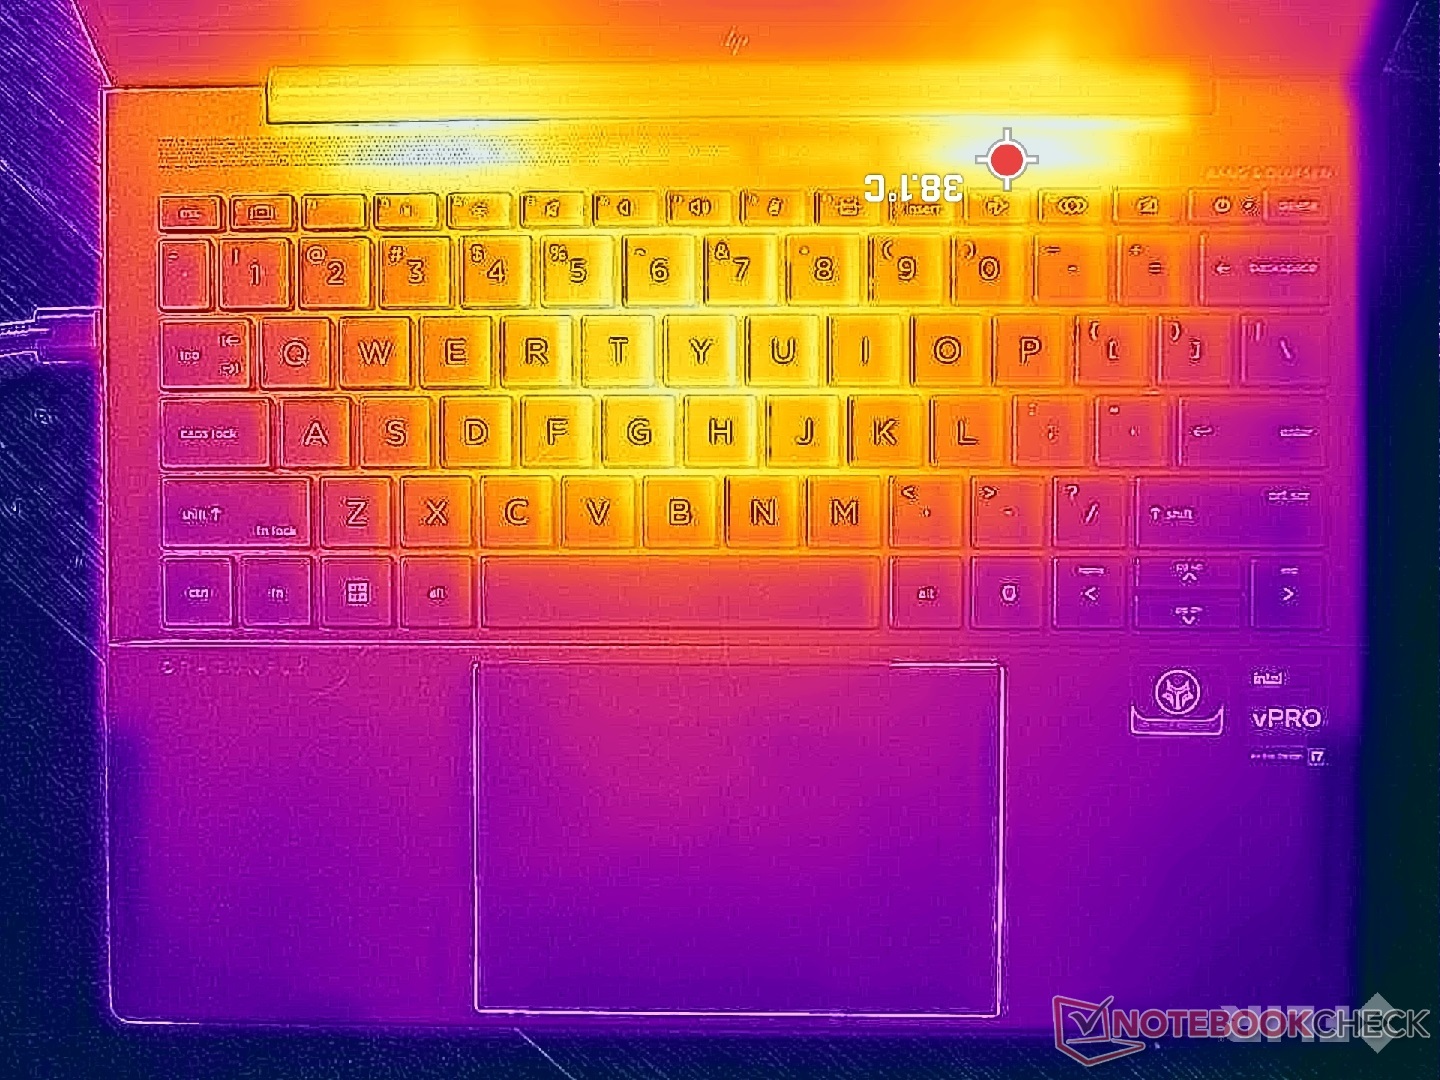
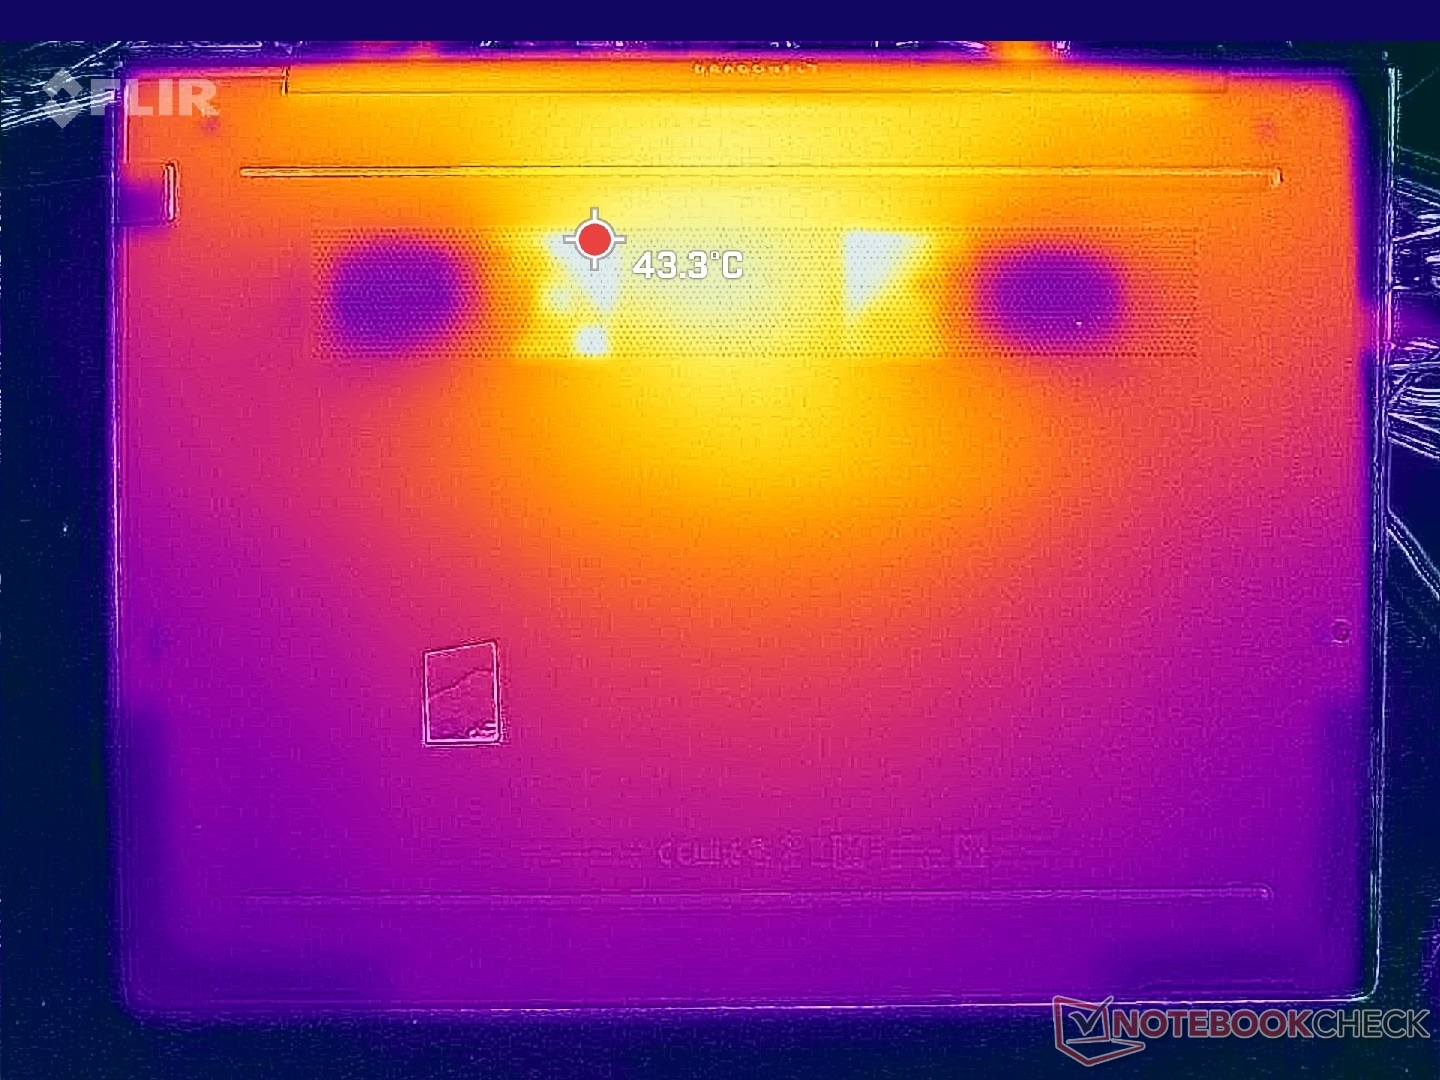
Temperatura
As temperaturas da superfície podem chegar a pouco mais de 40 °C quando submetidas a cargas pesadas, em comparação com 45 °C no mais rápidoXPS 13 Plus ou até mesmo 50 °C no Latitude 13 9330. Os pontos quentes estão localizados na parte traseira do chassi, longe dos apoios para as mãos e do clickpad.
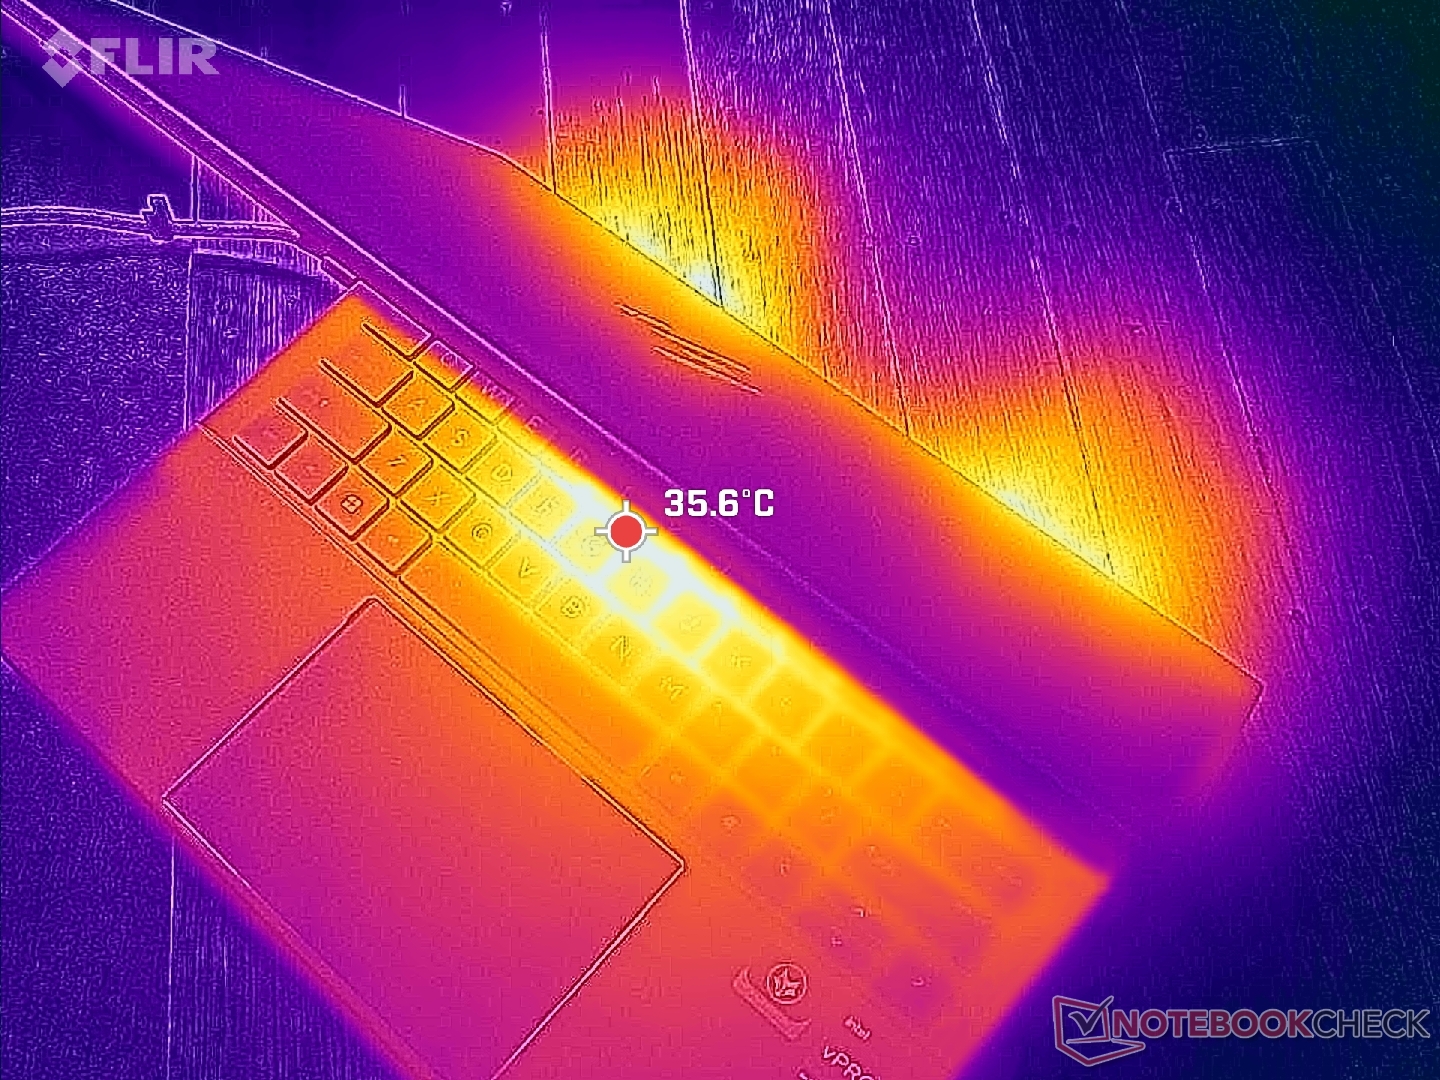
(+) A temperatura máxima no lado superior é 38.6 °C / 101 F, em comparação com a média de 35.9 °C / 97 F , variando de 21.4 a 59 °C para a classe Subnotebook.
(±) A parte inferior aquece até um máximo de 40.4 °C / 105 F, em comparação com a média de 39.2 °C / 103 F
(+) Em uso inativo, a temperatura média para o lado superior é 26.5 °C / 80 F, em comparação com a média do dispositivo de 30.8 °C / ### class_avg_f### F.
(+) Os apoios para as mãos e o touchpad são mais frios que a temperatura da pele, com um máximo de 27 °C / 80.6 F e, portanto, são frios ao toque.
(±) A temperatura média da área do apoio para as mãos de dispositivos semelhantes foi 28.2 °C / 82.8 F (+1.2 °C / 2.2 F).
| HP Dragonfly G4 Intel Core i7-1365U, Intel Iris Xe Graphics G7 96EUs | HP Elite Dragonfly G3 Intel Core i7-1265U, Intel Iris Xe Graphics G7 96EUs | Framework Laptop 13.5 13th Gen Intel Intel Core i7-1370P, Intel Iris Xe Graphics G7 96EUs | Lenovo ThinkPad X13 G3 21CM002UGE AMD Ryzen 5 PRO 6650U, AMD Radeon 660M | Dell Latitude 9330 Intel Core i7-1260U, Intel Iris Xe Graphics G7 96EUs | Apple MacBook Air M2 Entry Apple M2, Apple M2 8-Core GPU | |
|---|---|---|---|---|---|---|
| Heat | 1% | 3% | -8% | -3% | 2% | |
| Maximum Upper Side * (°C) | 38.6 | 39 -1% | 38.2 1% | 38.1 1% | 40.6 -5% | 44.5 -15% |
| Maximum Bottom * (°C) | 40.4 | 42.2 -4% | 41.4 -2% | 40.1 1% | 50.2 -24% | 44.4 -10% |
| Idle Upper Side * (°C) | 28.2 | 26.8 5% | 25.8 9% | 33.6 -19% | 25 11% | 23.9 15% |
| Idle Bottom * (°C) | 29 | 28.2 3% | 27.6 5% | 33.4 -15% | 27.6 5% | 23.6 19% |
* ... menor é melhor
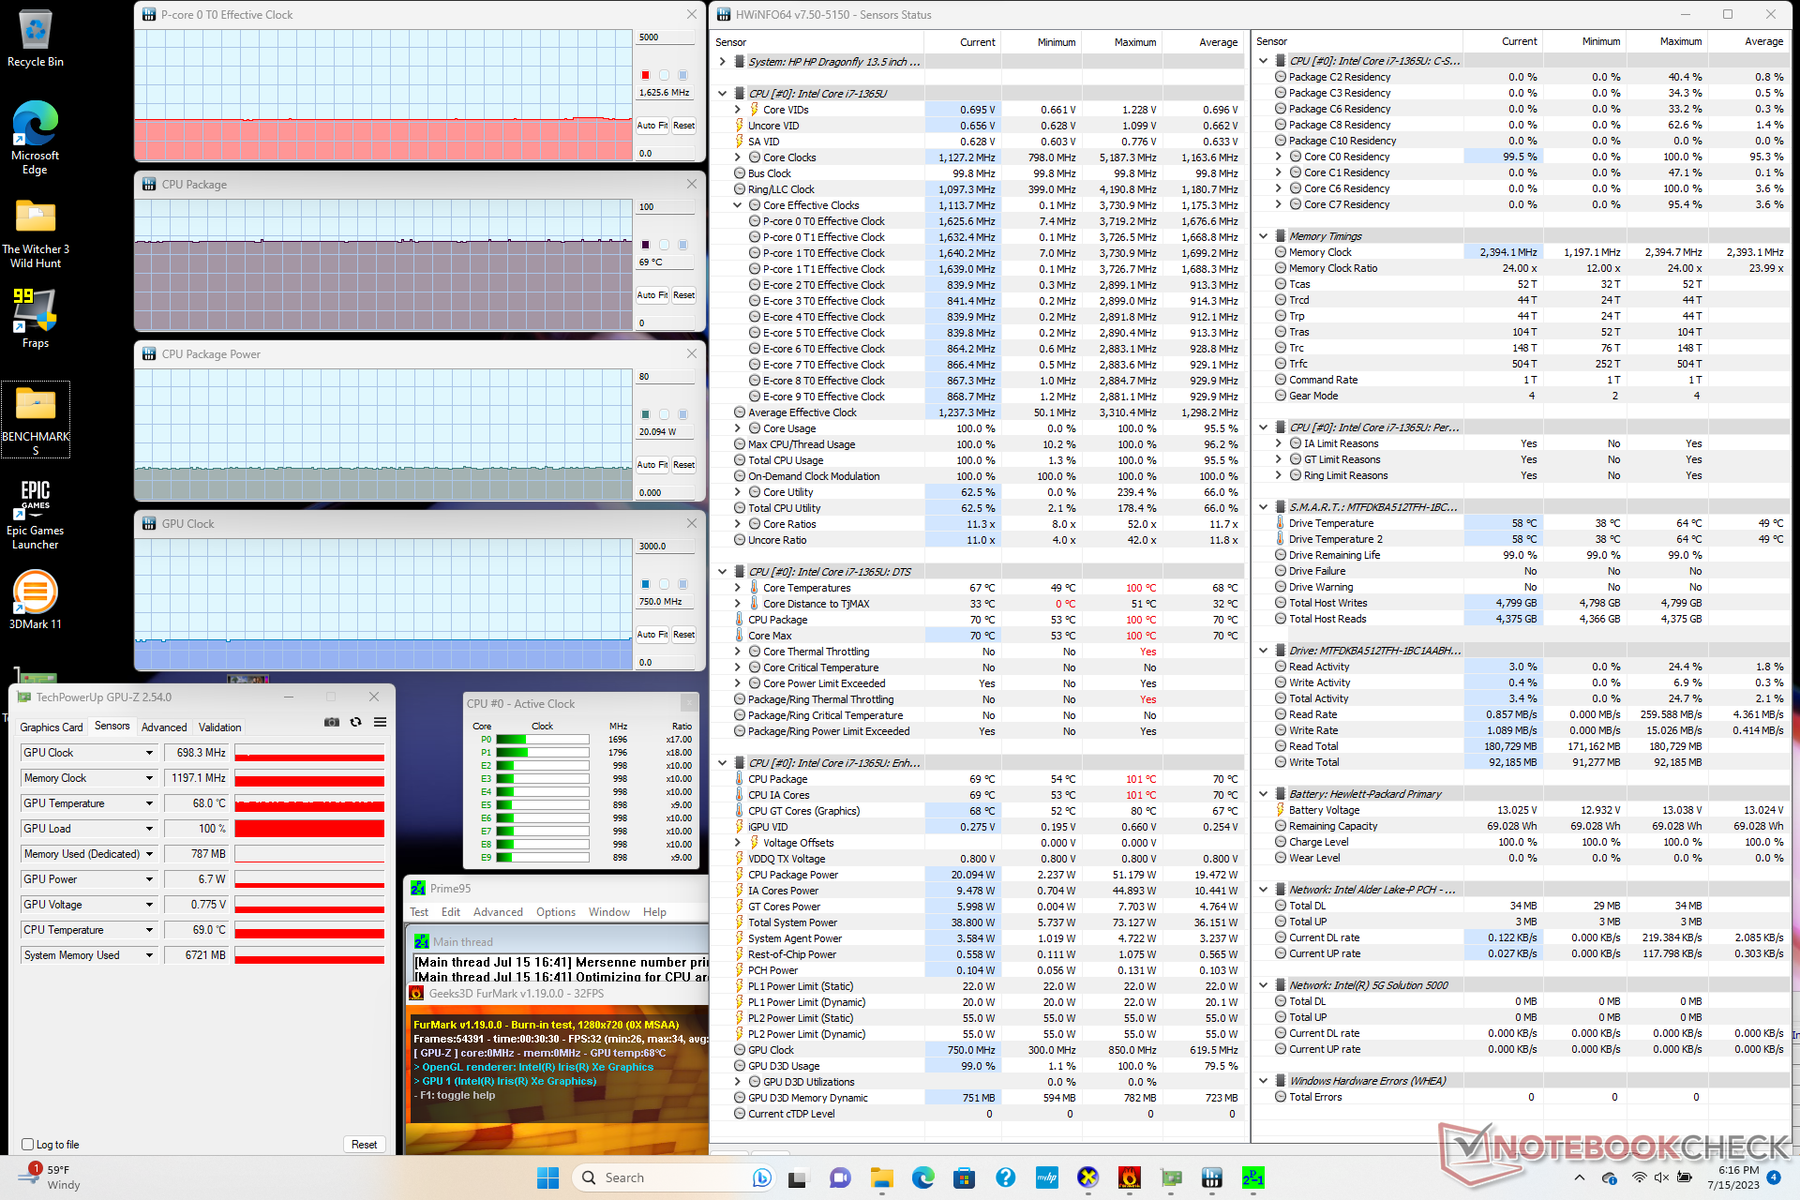
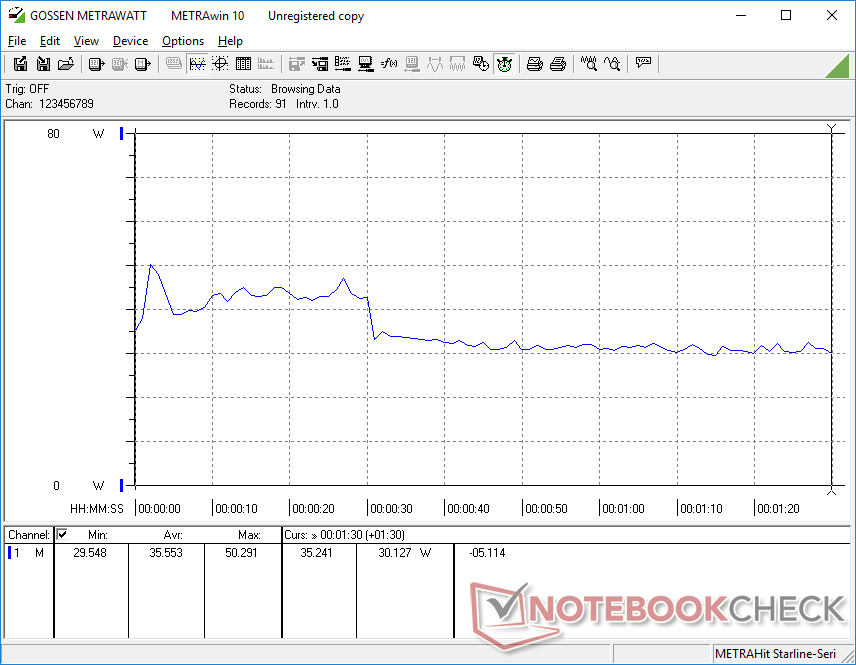
Teste de estresse
Ao executar o Prime95 para estressar a CPU, as taxas de clock e o consumo de energia da placa aumentam para 3,7 GHz e 51 W, respectivamente, atingindo também uma temperatura central de 100 C. Essa temperatura não é ideal para a longevidade do processador e, portanto, as taxas de clock e o consumo de energia da placa caem rapidamente para apenas 2,3 GHz e 20 W para manter uma temperatura central mais razoável de 76 C.
A taxa de clock e a temperatura da GPU durante a execução Witcher 3 para representar uma carga alta consistente se estabilizariam em 1200 MHz e 69 C, respectivamente, o que é semelhante ao que registramos no recente Dell Latitude 7440.
A execução com a energia da bateria reduz um pouco o desempenho da CPU. Um teste 3DMark 11 com a bateria retornaria pontuações de física e gráficos de 10619 e 5959 pontos, respectivamente, em comparação com 11465 e 5780 pontos quando ligado à rede elétrica.
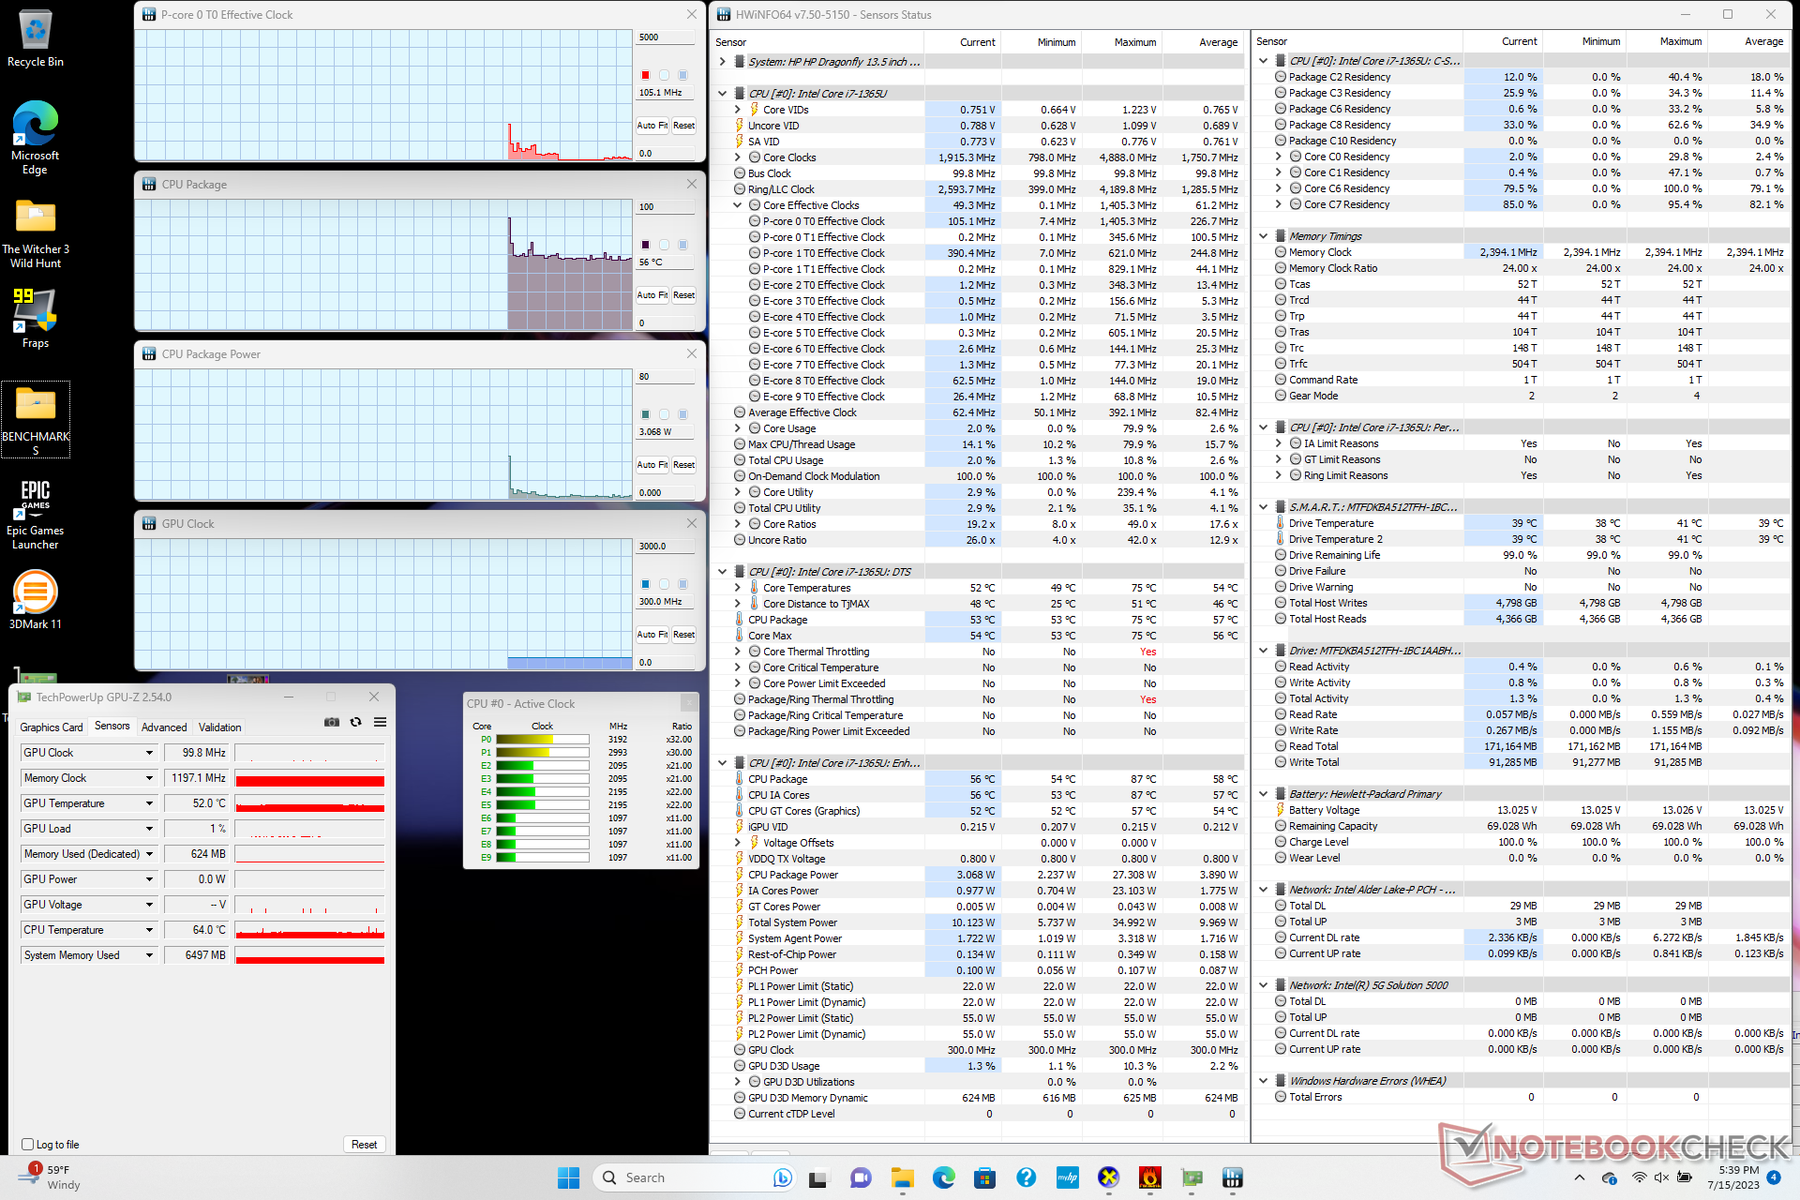
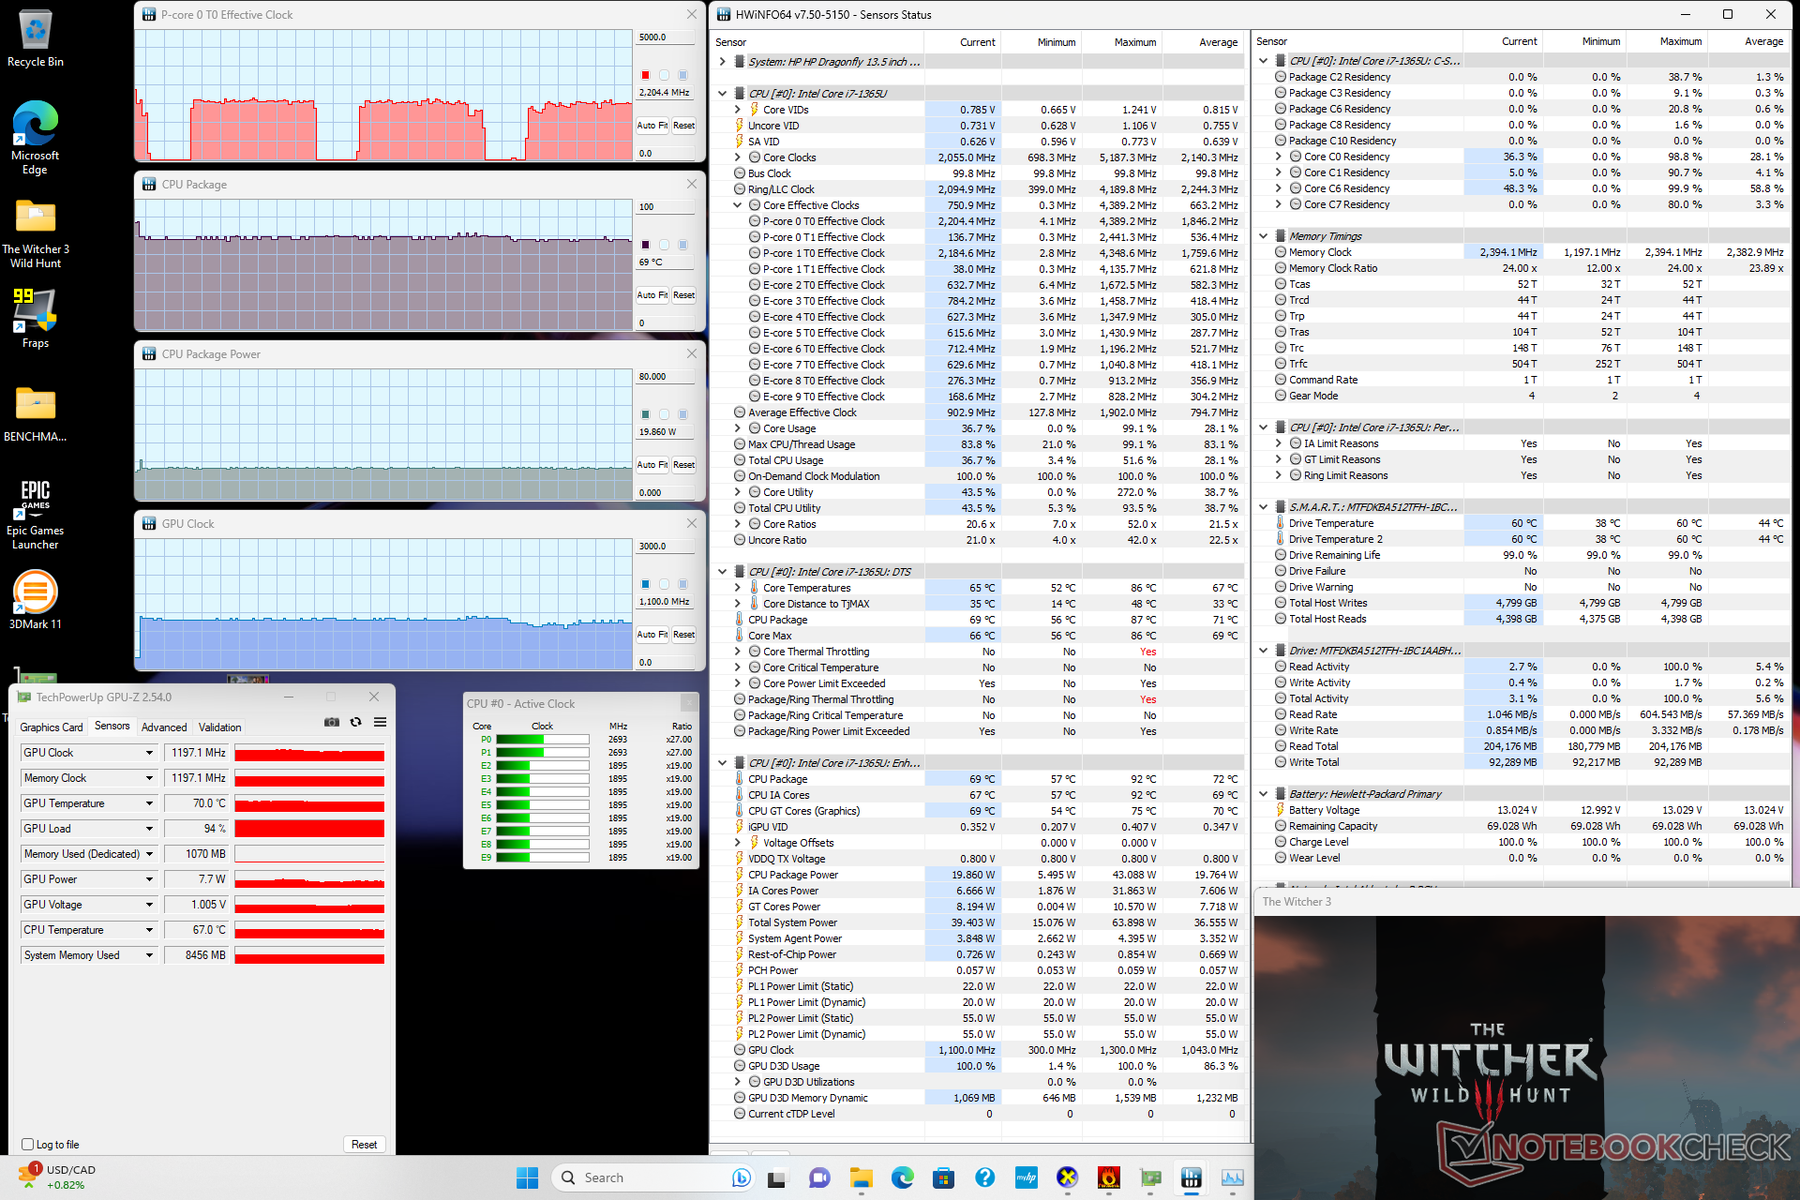
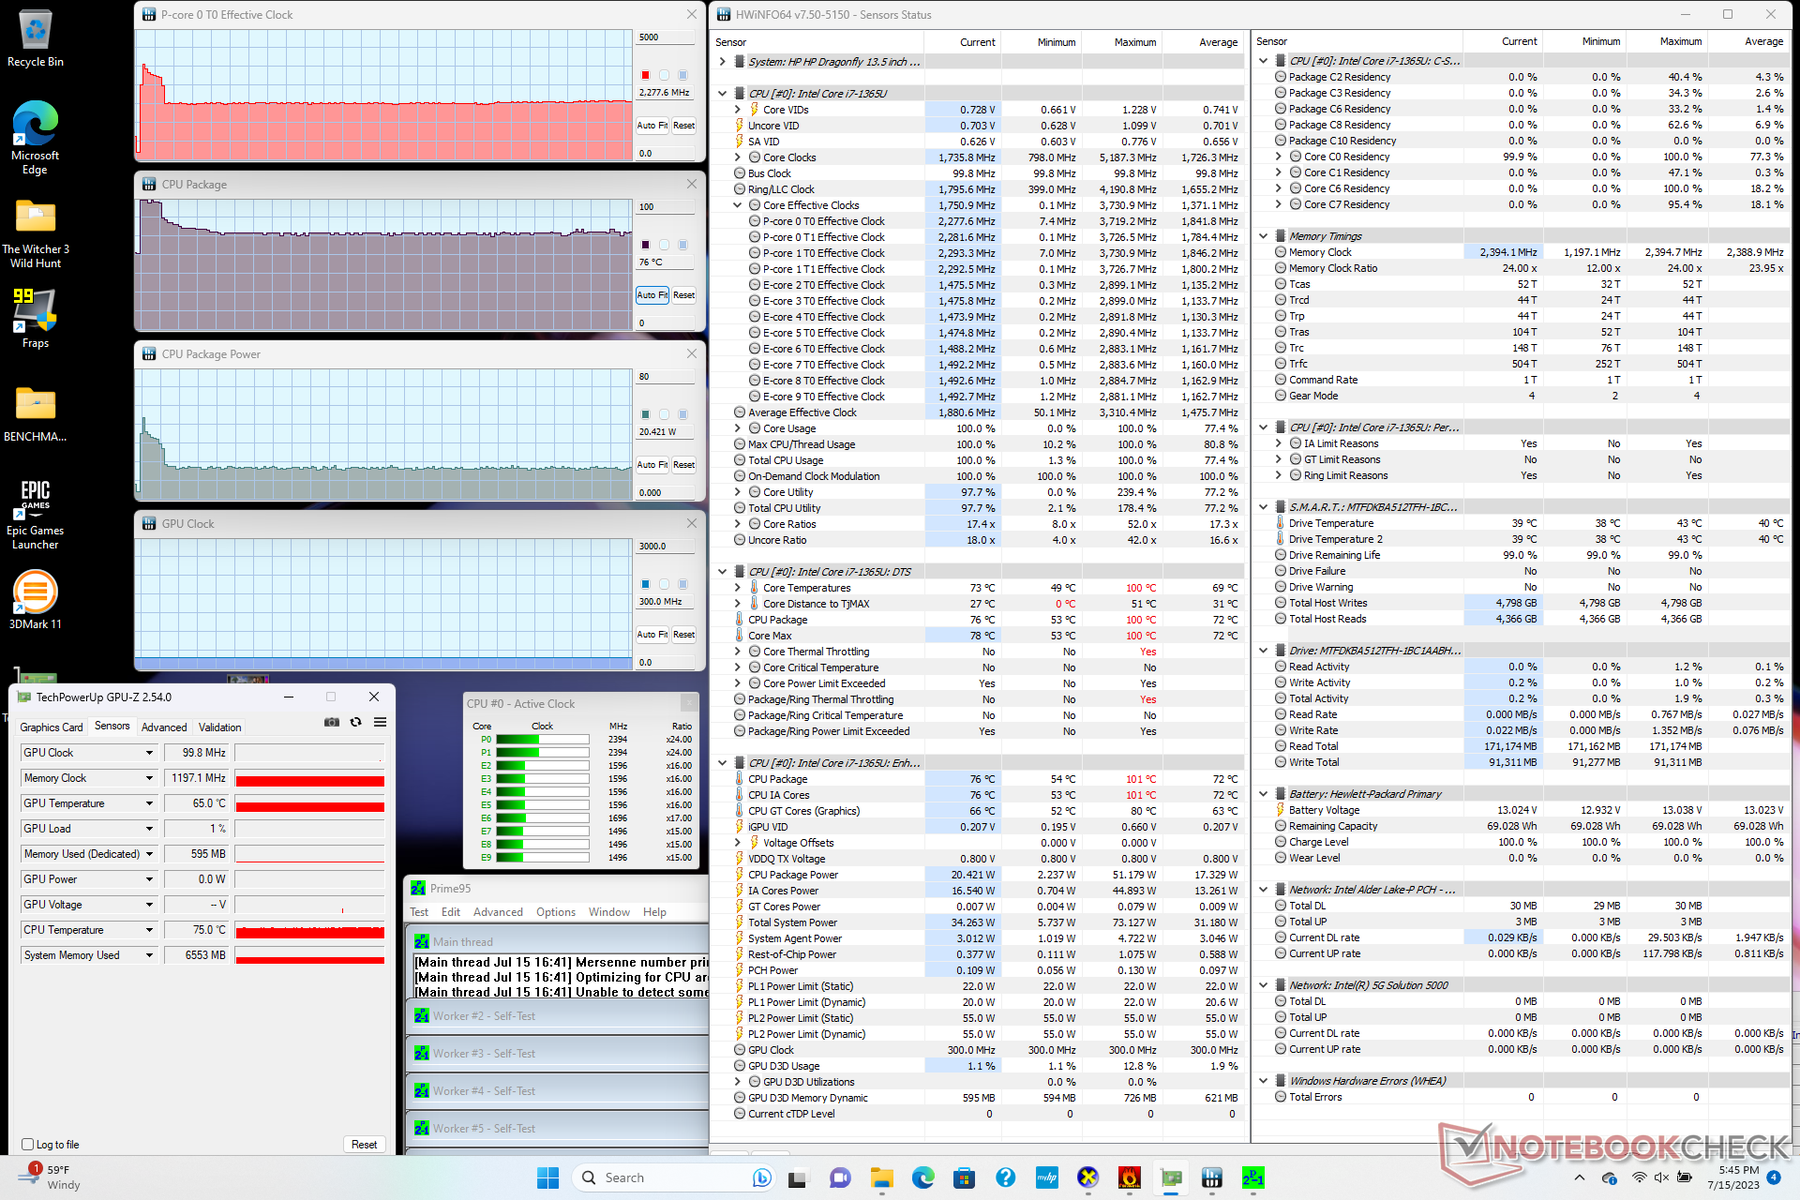
| Clock da CPU (GHz) | Clock da GPU (MHz) | Temperatura média da CPU (°C) | |
| Sistema ocioso | -- | -- | 56 |
| Estresse doPrime95 | 2.3 | -- | 76 |
| EstressePrime95 + FurMark | 1.6 | 698 | 69 |
| Witcher 3 Estresse | ~2,2 | 1197 | 69 |
Alto-falantes
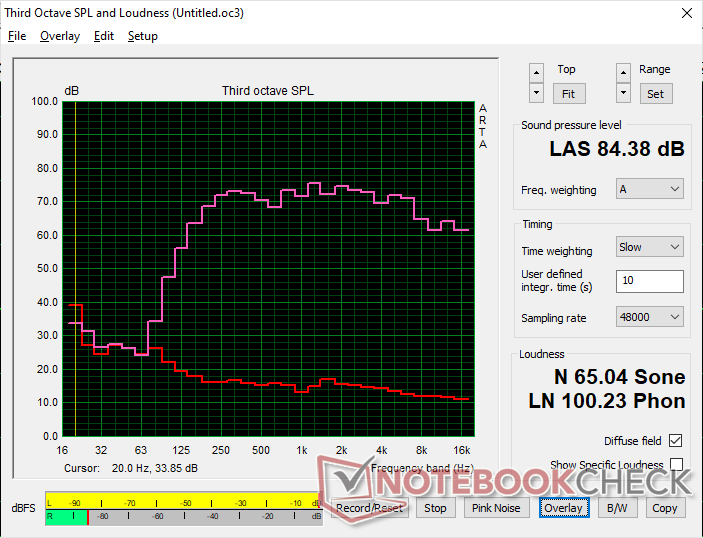
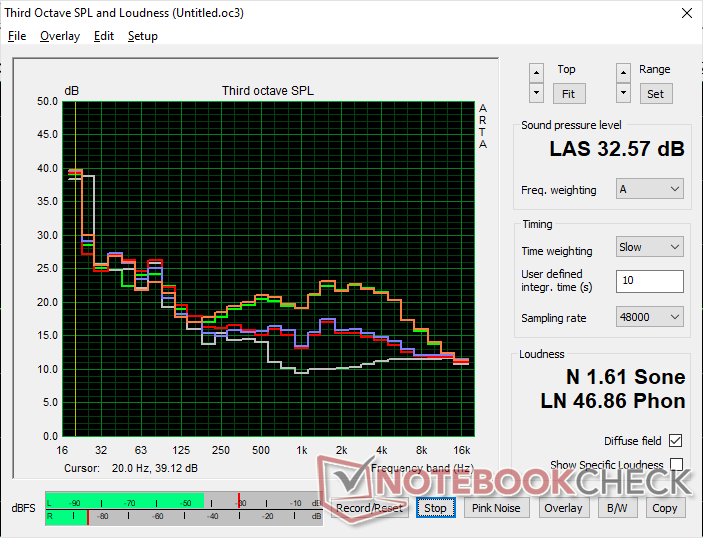
HP Dragonfly G4 análise de áudio
(+) | os alto-falantes podem tocar relativamente alto (###valor### dB)
Graves 100 - 315Hz
(±) | graves reduzidos - em média 8.4% menor que a mediana
(±) | a linearidade dos graves é média (11.6% delta para a frequência anterior)
Médios 400 - 2.000 Hz
(+) | médios equilibrados - apenas 2.3% longe da mediana
(+) | médios são lineares (4.8% delta para frequência anterior)
Altos 2 - 16 kHz
(+) | agudos equilibrados - apenas 3.2% longe da mediana
(+) | os máximos são lineares (4.6% delta da frequência anterior)
Geral 100 - 16.000 Hz
(+) | o som geral é linear (9.1% diferença em relação à mediana)
Comparado com a mesma classe
» 4% de todos os dispositivos testados nesta classe foram melhores, 1% semelhantes, 95% piores
» O melhor teve um delta de 5%, a média foi 18%, o pior foi 53%
Comparado com todos os dispositivos testados
» 3% de todos os dispositivos testados foram melhores, 1% semelhantes, 96% piores
» O melhor teve um delta de 4%, a média foi 23%, o pior foi 134%
Apple MacBook Pro 16 2021 M1 Pro análise de áudio
(+) | os alto-falantes podem tocar relativamente alto (###valor### dB)
Graves 100 - 315Hz
(+) | bons graves - apenas 3.8% longe da mediana
(+) | o baixo é linear (5.2% delta para a frequência anterior)
Médios 400 - 2.000 Hz
(+) | médios equilibrados - apenas 1.3% longe da mediana
(+) | médios são lineares (2.1% delta para frequência anterior)
Altos 2 - 16 kHz
(+) | agudos equilibrados - apenas 1.9% longe da mediana
(+) | os máximos são lineares (2.7% delta da frequência anterior)
Geral 100 - 16.000 Hz
(+) | o som geral é linear (4.6% diferença em relação à mediana)
Comparado com a mesma classe
» 0% de todos os dispositivos testados nesta classe foram melhores, 0% semelhantes, 100% piores
» O melhor teve um delta de 5%, a média foi 17%, o pior foi 45%
Comparado com todos os dispositivos testados
» 0% de todos os dispositivos testados foram melhores, 0% semelhantes, 100% piores
» O melhor teve um delta de 4%, a média foi 23%, o pior foi 134%
Gerenciamento de energia
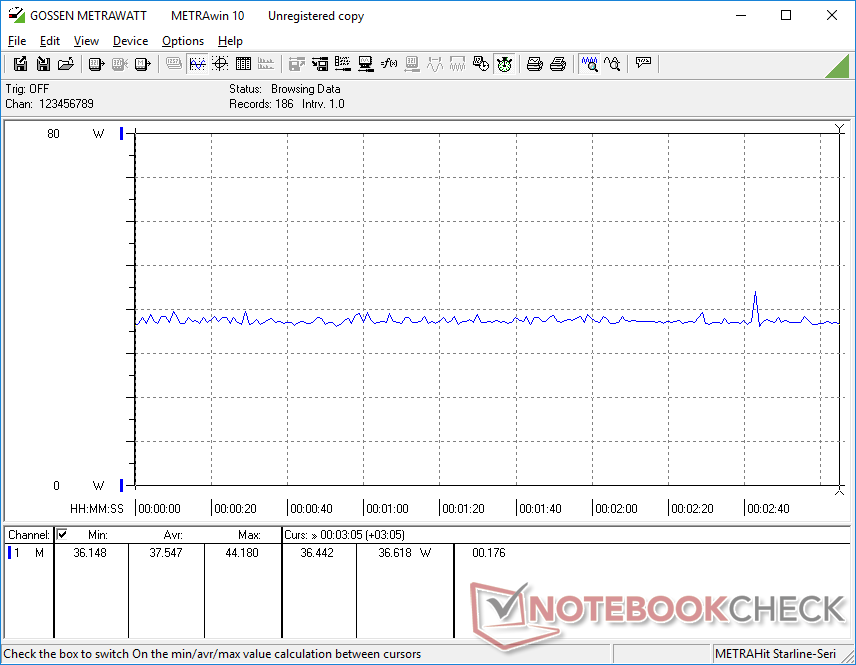
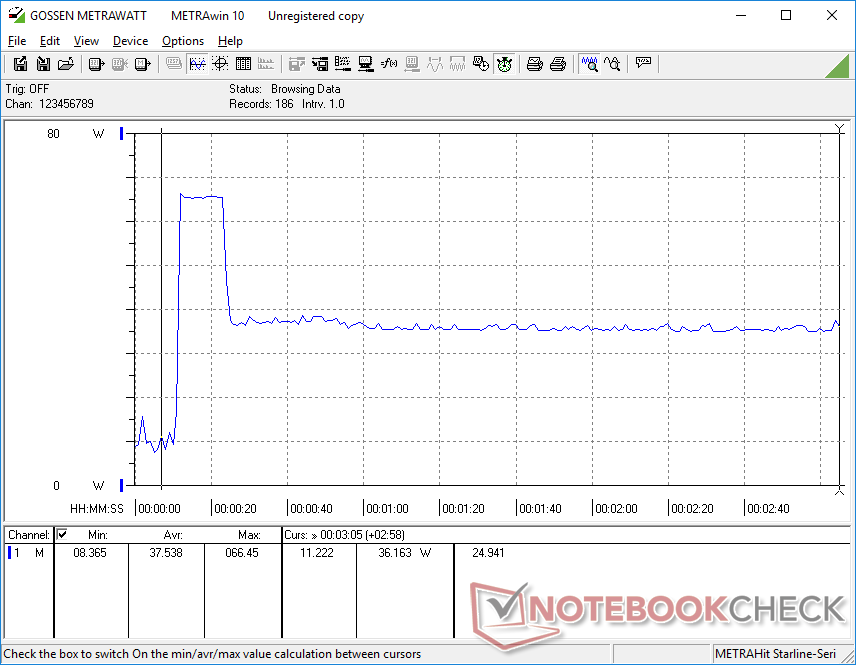
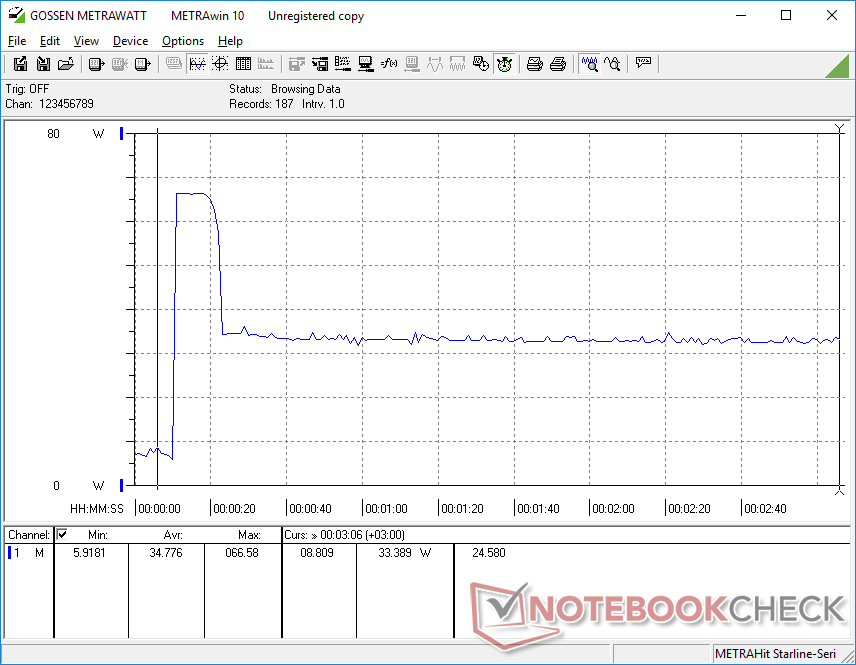
Consumo de energia
O consumo geral de energia é quase igual ao do Dragonfly G3, o que é de se esperar, já que os dois modelos compartilham a mesma tela, SSD, chassi e até mesmo as metas PL2 e PL1, de acordo com os resultados do nosso teste de estresse acima. Portanto, o desempenho por watt é praticamente o mesmo, se não for apenas um pouco melhor, ao passar do Core i7-1265U para o Core i7-1365U. Os notebooks com a Radeon 680M da concorrência, como o Acer Swift Edge SFE16 consomem mais energia sob carga, mas são capazes de oferecer um desempenho de GPU muito mais rápido para compensar.
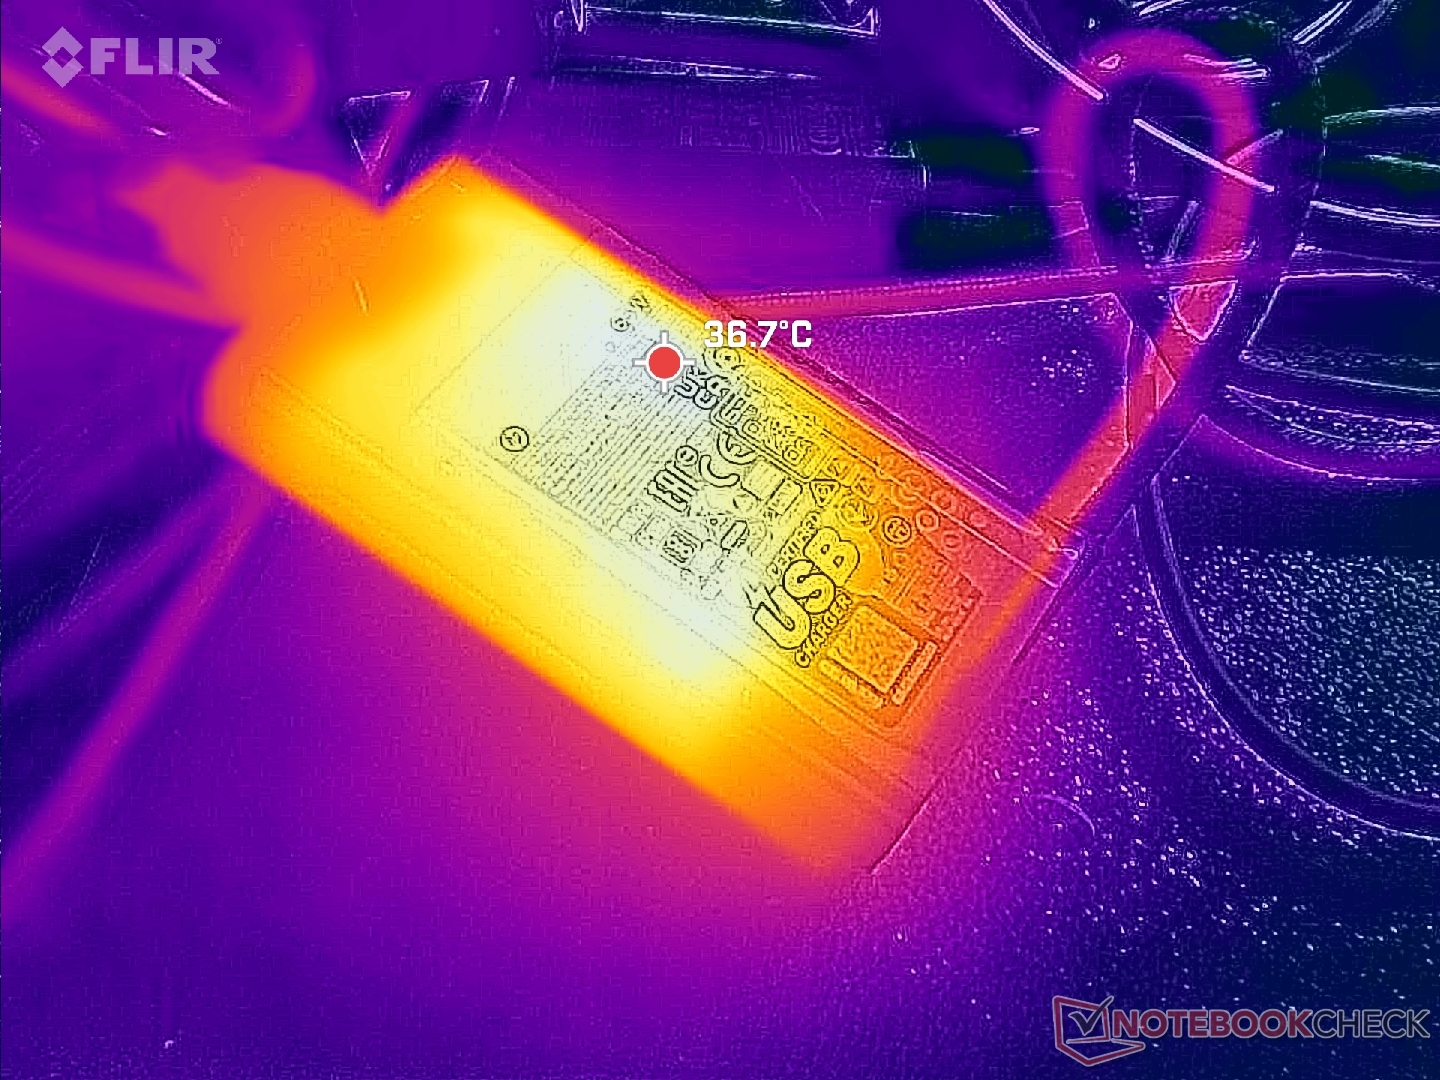
Conseguimos medir um consumo máximo temporário de 67 W com o pequeno adaptador CA USB-C de 65 W (~9,8 x 5,3 x 2 cm).
| desligado | |
| Ocioso | |
| Carga |
|
Key:
min: | |
| HP Dragonfly G4 i7-1365U, Iris Xe G7 96EUs, Micron 3400 MTFDKBA512TFH 512GB, IPS, 1920x1280, 13.5" | HP Elite Dragonfly G3 i7-1265U, Iris Xe G7 96EUs, Micron 3400 MTFDKBA512TFH 512GB, IPS, 1920x1280, 13.5" | Framework Laptop 13.5 13th Gen Intel i7-1370P, Iris Xe G7 96EUs, WD PC SN740 SDDPNQD-1T00, IPS, 2256x1504, 13.5" | Lenovo ThinkPad X13 G3 21CM002UGE R5 PRO 6650U, Radeon 660M, Samsung PM9A1 MZVL2512HCJQ, IPS LED, 1920x1200, 13.3" | Dell Latitude 9330 i7-1260U, Iris Xe G7 96EUs, , IPS, 2560x1600, 13.3" | Apple MacBook Air M2 Entry M2, M2 8-Core GPU, Apple SSD AP0256Z, IPS, 2560x1664, 13.6" | |
|---|---|---|---|---|---|---|
| Power Consumption | 5% | -13% | 18% | 2% | 20% | |
| Idle Minimum * (Watt) | 4.1 | 3.4 17% | 2.9 29% | 3.2 22% | 4.7 -15% | 1.87 54% |
| Idle Average * (Watt) | 7.5 | 5.6 25% | 6.3 16% | 5.2 31% | 8.2 -9% | 9.2 -23% |
| Idle Maximum * (Watt) | 8.2 | 8.4 -2% | 9.9 -21% | 6.1 26% | 8.4 -2% | 9.3 -13% |
| Load Average * (Watt) | 35.5 | 40.8 -15% | 56.2 -58% | 33.6 5% | 36.8 -4% | 28.5 20% |
| Witcher 3 ultra * (Watt) | 37.5 | 35.5 5% | 56.6 -51% | 39.3 -5% | 30.4 19% | 27.4 27% |
| Load Maximum * (Watt) | 66.5 | 68.4 -3% | 60.8 9% | 49.1 26% | 49.9 25% | 31 53% |
* ... menor é melhor
Power Consumption Witcher 3 / Stresstest
Power Consumption external Monitor
Duração da bateria
A capacidade da bateria permanece a mesma do Dragonfly G3, com 68 Wh. No entanto, o tempo de execução da WLAN é maior no modelo mais novo, com um total de quase 16 horas antes do desligamento automático. Isso é várias horas a mais do que na maioria dos outros notebooks com Windows e é comparável ao MacBook Air M2.
O carregamento da bateria vazia até a capacidade total leva cerca de 90 minutos.
| HP Dragonfly G4 i7-1365U, Iris Xe G7 96EUs, 68 Wh | HP Elite Dragonfly G3 i7-1265U, Iris Xe G7 96EUs, 68 Wh | Framework Laptop 13.5 13th Gen Intel i7-1370P, Iris Xe G7 96EUs, 61 Wh | Lenovo ThinkPad X13 G3 21CM002UGE R5 PRO 6650U, Radeon 660M, 54.7 Wh | Dell Latitude 9330 i7-1260U, Iris Xe G7 96EUs, 50 Wh | Apple MacBook Air M2 Entry M2, M2 8-Core GPU, 52.6 Wh | |
|---|---|---|---|---|---|---|
| Duração da bateria | -9% | -45% | -37% | -44% | -15% | |
| Reader / Idle (h) | 42.5 | 37.8 -11% | 15.4 -64% | |||
| WiFi v1.3 (h) | 15.9 | 11.8 -26% | 8.8 -45% | 12.5 -21% | 9.4 -41% | 15.2 -4% |
| Load (h) | 3.2 | 3.5 9% | 1.5 -53% | 2.3 -28% | 2.4 -25% | |
| H.264 (h) | 16.5 |
Pro
Contra
Veredicto - Apenas um pequeno impulso da Intel de 13ª geração
Muito parecido com nossas descobertas sobre o 2023 Dell XPS 13 Pluso Dragonfly G4 2023 é apenas uma pequena atualização em relação ao Elite Dragonfly G3. Tão pequena, na verdade, que a maioria dos usuários provavelmente não notará o pequeno aumento no desempenho entre as CPUs de 12ª geração do Dragonfly G3 e as opções de 13ª geração do Dragonfly G4. Outros aspectos do modelo, como as opções de tela, não foram alterados, enquanto o novo software Power Manager não é um grande divisor de águas.
O Dragonfly G4 é uma pequena atualização do já excelente Dragonfly G3. No entanto, se a nova CPU não for atraente, o Dragonfly G3 pode oferecer essencialmente a mesma experiência.
As pequenas atualizações deste ano não são inesperadas, pois o Dragonfly G3 já foi completamente redesenhado e tem apenas um ano de idade. Elogiamos o Dragonfly G3 por sua funcionalidade, recursos e aparência, e o Dragonfly G4 apenas reforça esses pontos fortes. Os compradores interessados podem, portanto, considerar o Dragonfly G3 de 2022, mais barato, já que o Dragonfly G4 de 2023 não traz muito mais para a mesa. Para obter um aumento maior no desempenho, os usuários podem considerar oFramework 13.5 ou oAsus Zenbook S 13 que oferecem opções de CPU além da série Core-U.
Preço e disponibilidade
A HP agora está enviando o Dragonfly G4 a partir de US$ 1.300 para a configuração básica com Core i5 e 1280p, até US$ 2.400 quando totalmente configurado.
HP Dragonfly G4
- 07/18/2023 v7 (old)
Allen Ngo
Transparência
A seleção dos dispositivos a serem analisados é feita pela nossa equipe editorial. A amostra de teste foi fornecida ao autor como empréstimo pelo fabricante ou varejista para fins desta revisão. O credor não teve influência nesta revisão, nem o fabricante recebeu uma cópia desta revisão antes da publicação. Não houve obrigação de publicar esta revisão. Como empresa de mídia independente, a Notebookcheck não está sujeita à autoridade de fabricantes, varejistas ou editores.
É assim que o Notebookcheck está testando
Todos os anos, o Notebookcheck analisa de forma independente centenas de laptops e smartphones usando procedimentos padronizados para garantir que todos os resultados sejam comparáveis. Desenvolvemos continuamente nossos métodos de teste há cerca de 20 anos e definimos padrões da indústria no processo. Em nossos laboratórios de teste, equipamentos de medição de alta qualidade são utilizados por técnicos e editores experientes. Esses testes envolvem um processo de validação em vários estágios. Nosso complexo sistema de classificação é baseado em centenas de medições e benchmarks bem fundamentados, o que mantém a objetividade.Price comparison

