Análise do Asus Zenbook S 13 OLED 2023 - O ultrabook OLED mais fino do mundo tem problemas com fãs irritantes
A Asus reformulou completamente seu ultrabook compacto ZenBook S 13 de 13 polegadas, concentrando-se principalmente em trazer um dispositivo ainda mais leve e fino para o mercado. De acordo com o material de marketing, esse é até mesmo o ultrabook OLED de 13,3 polegadas mais fino do mundo. Nessa reformulação, o fabricante também decidiu substituir o excelente processador AMD do modelo do ano passado por um chip Raptor Lake atual da Intel. É claro que avaliaremos se essa foi a decisão correta.
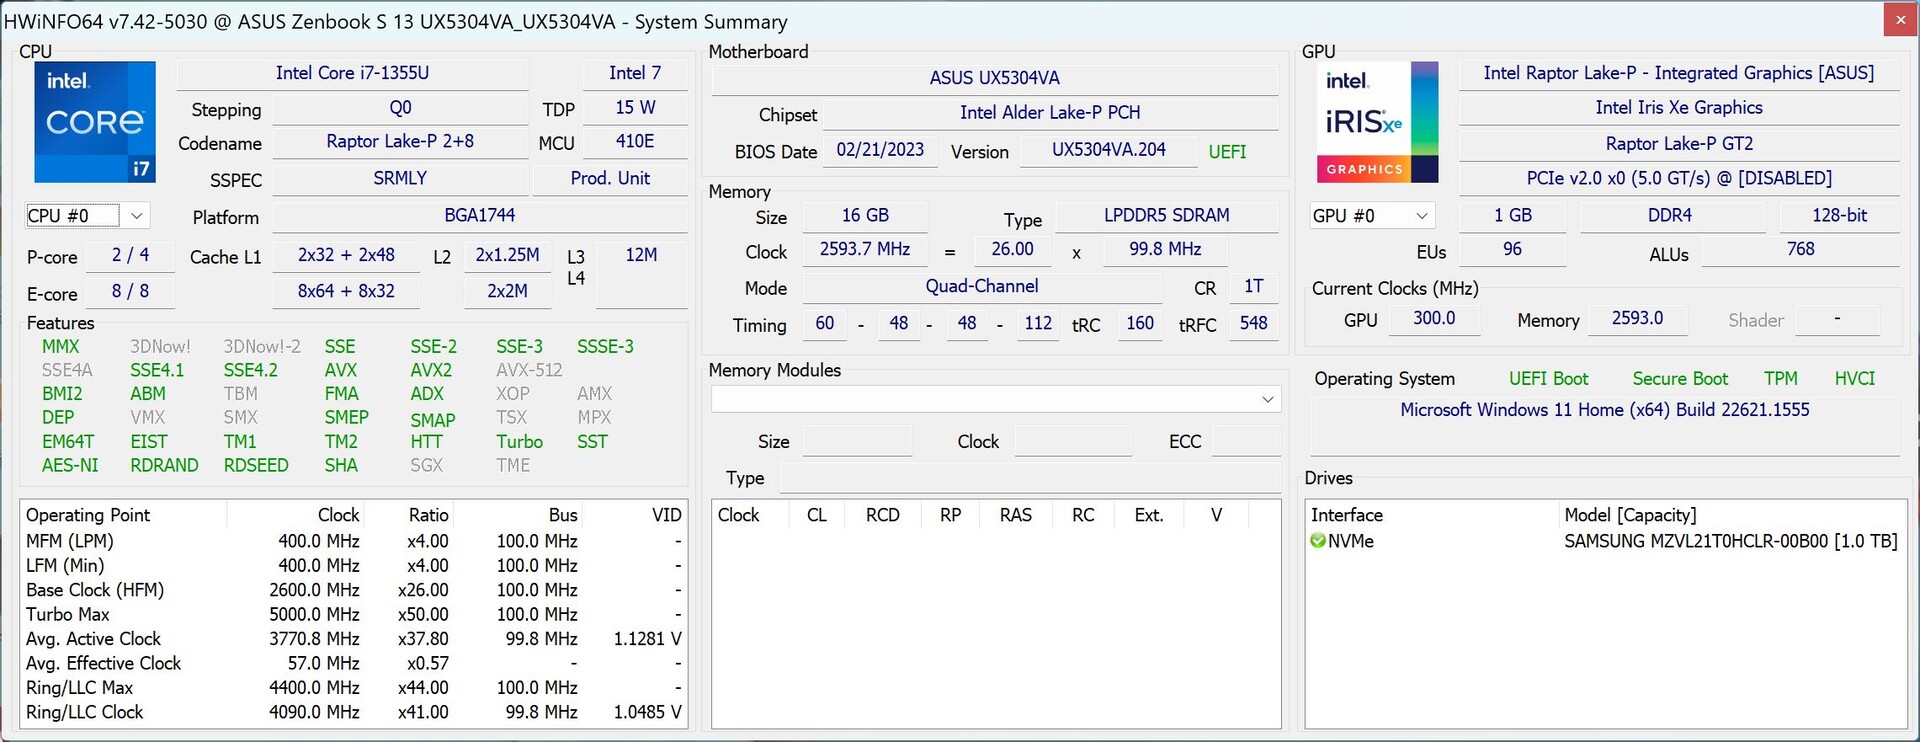
Nossa unidade de teste do Zenbook S 13 OLED está novamente equipada com um painel OLED de 13,3 polegadas no formato 16:10. Além disso, há um processadorIntel Core i7-1355U16 GB de RAM e um grande SSD PCIe 4.0 de 1 TB por um preço sugerido de 1.499 euros (~$1.657). Mas também temos boas notícias para os fãs do zenbook S 13 do ano passadodo ano passado, já que também haverá uma atualização com as CPUs Zen4 da AMD.
Possíveis concorrentes em comparação
Avaliação | Data | Modelo | Peso | Altura | Size | Resolução | Preço |
|---|---|---|---|---|---|---|---|
| 85.4 % v7 (old) | 05/2023 | Asus ZenBook S13 OLED UX5304 i7-1355U, Iris Xe G7 96EUs | 1 kg | 11.8 mm | 13.30" | 2880x1800 | |
| 90.1 % v7 (old) | 07/2022 | Asus Zenbook S 13 OLED R7 6800U, Radeon 680M | 1.1 kg | 14.9 mm | 13.30" | 2880x1800 | |
| 92 % v7 (old) | 08/2022 | Apple MacBook Air M2 10C GPU M2, M2 10-Core GPU | 1.2 kg | 11.3 mm | 13.60" | 2560x1664 | |
| 86.4 % v7 (old) | 10/2022 | Lenovo Yoga Slim 7 Carbon 13IAP7-82U9005FGE i7-1260P, Iris Xe G7 96EUs | 986 g | 14.8 mm | 13.30" | 2560x1600 | |
| 87.3 % v7 (old) | 09/2022 | Dell XPS 13 Plus 9320 i7-1280P OLED i7-1280P, Iris Xe G7 96EUs | 1.3 kg | 15.28 mm | 13.40" | 3456x2160 | |
| 86.7 % v7 (old) | 05/2022 | Samsung Galaxy Book2 Pro 13 NP930XED-KA1DE i5-1240P, Iris Xe G7 80EUs | 885 g | 11 mm | 13.30" | 1920x1080 |
Gabinete - A Asus usa um revestimento de cerâmica de plasma
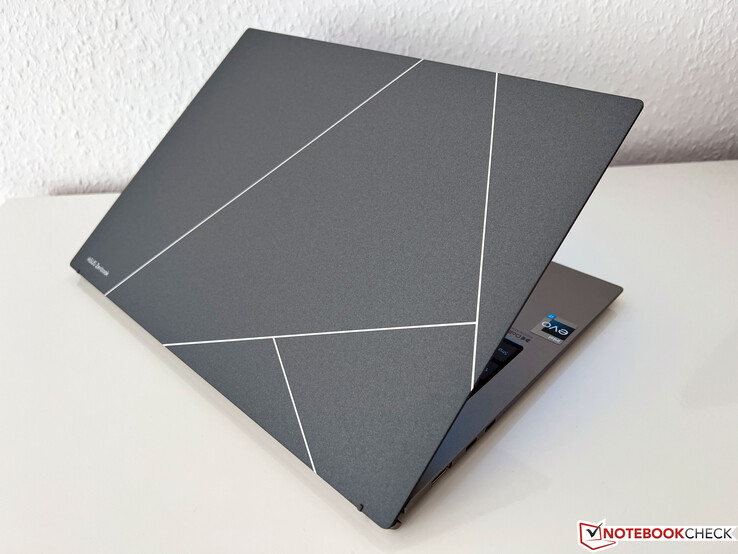
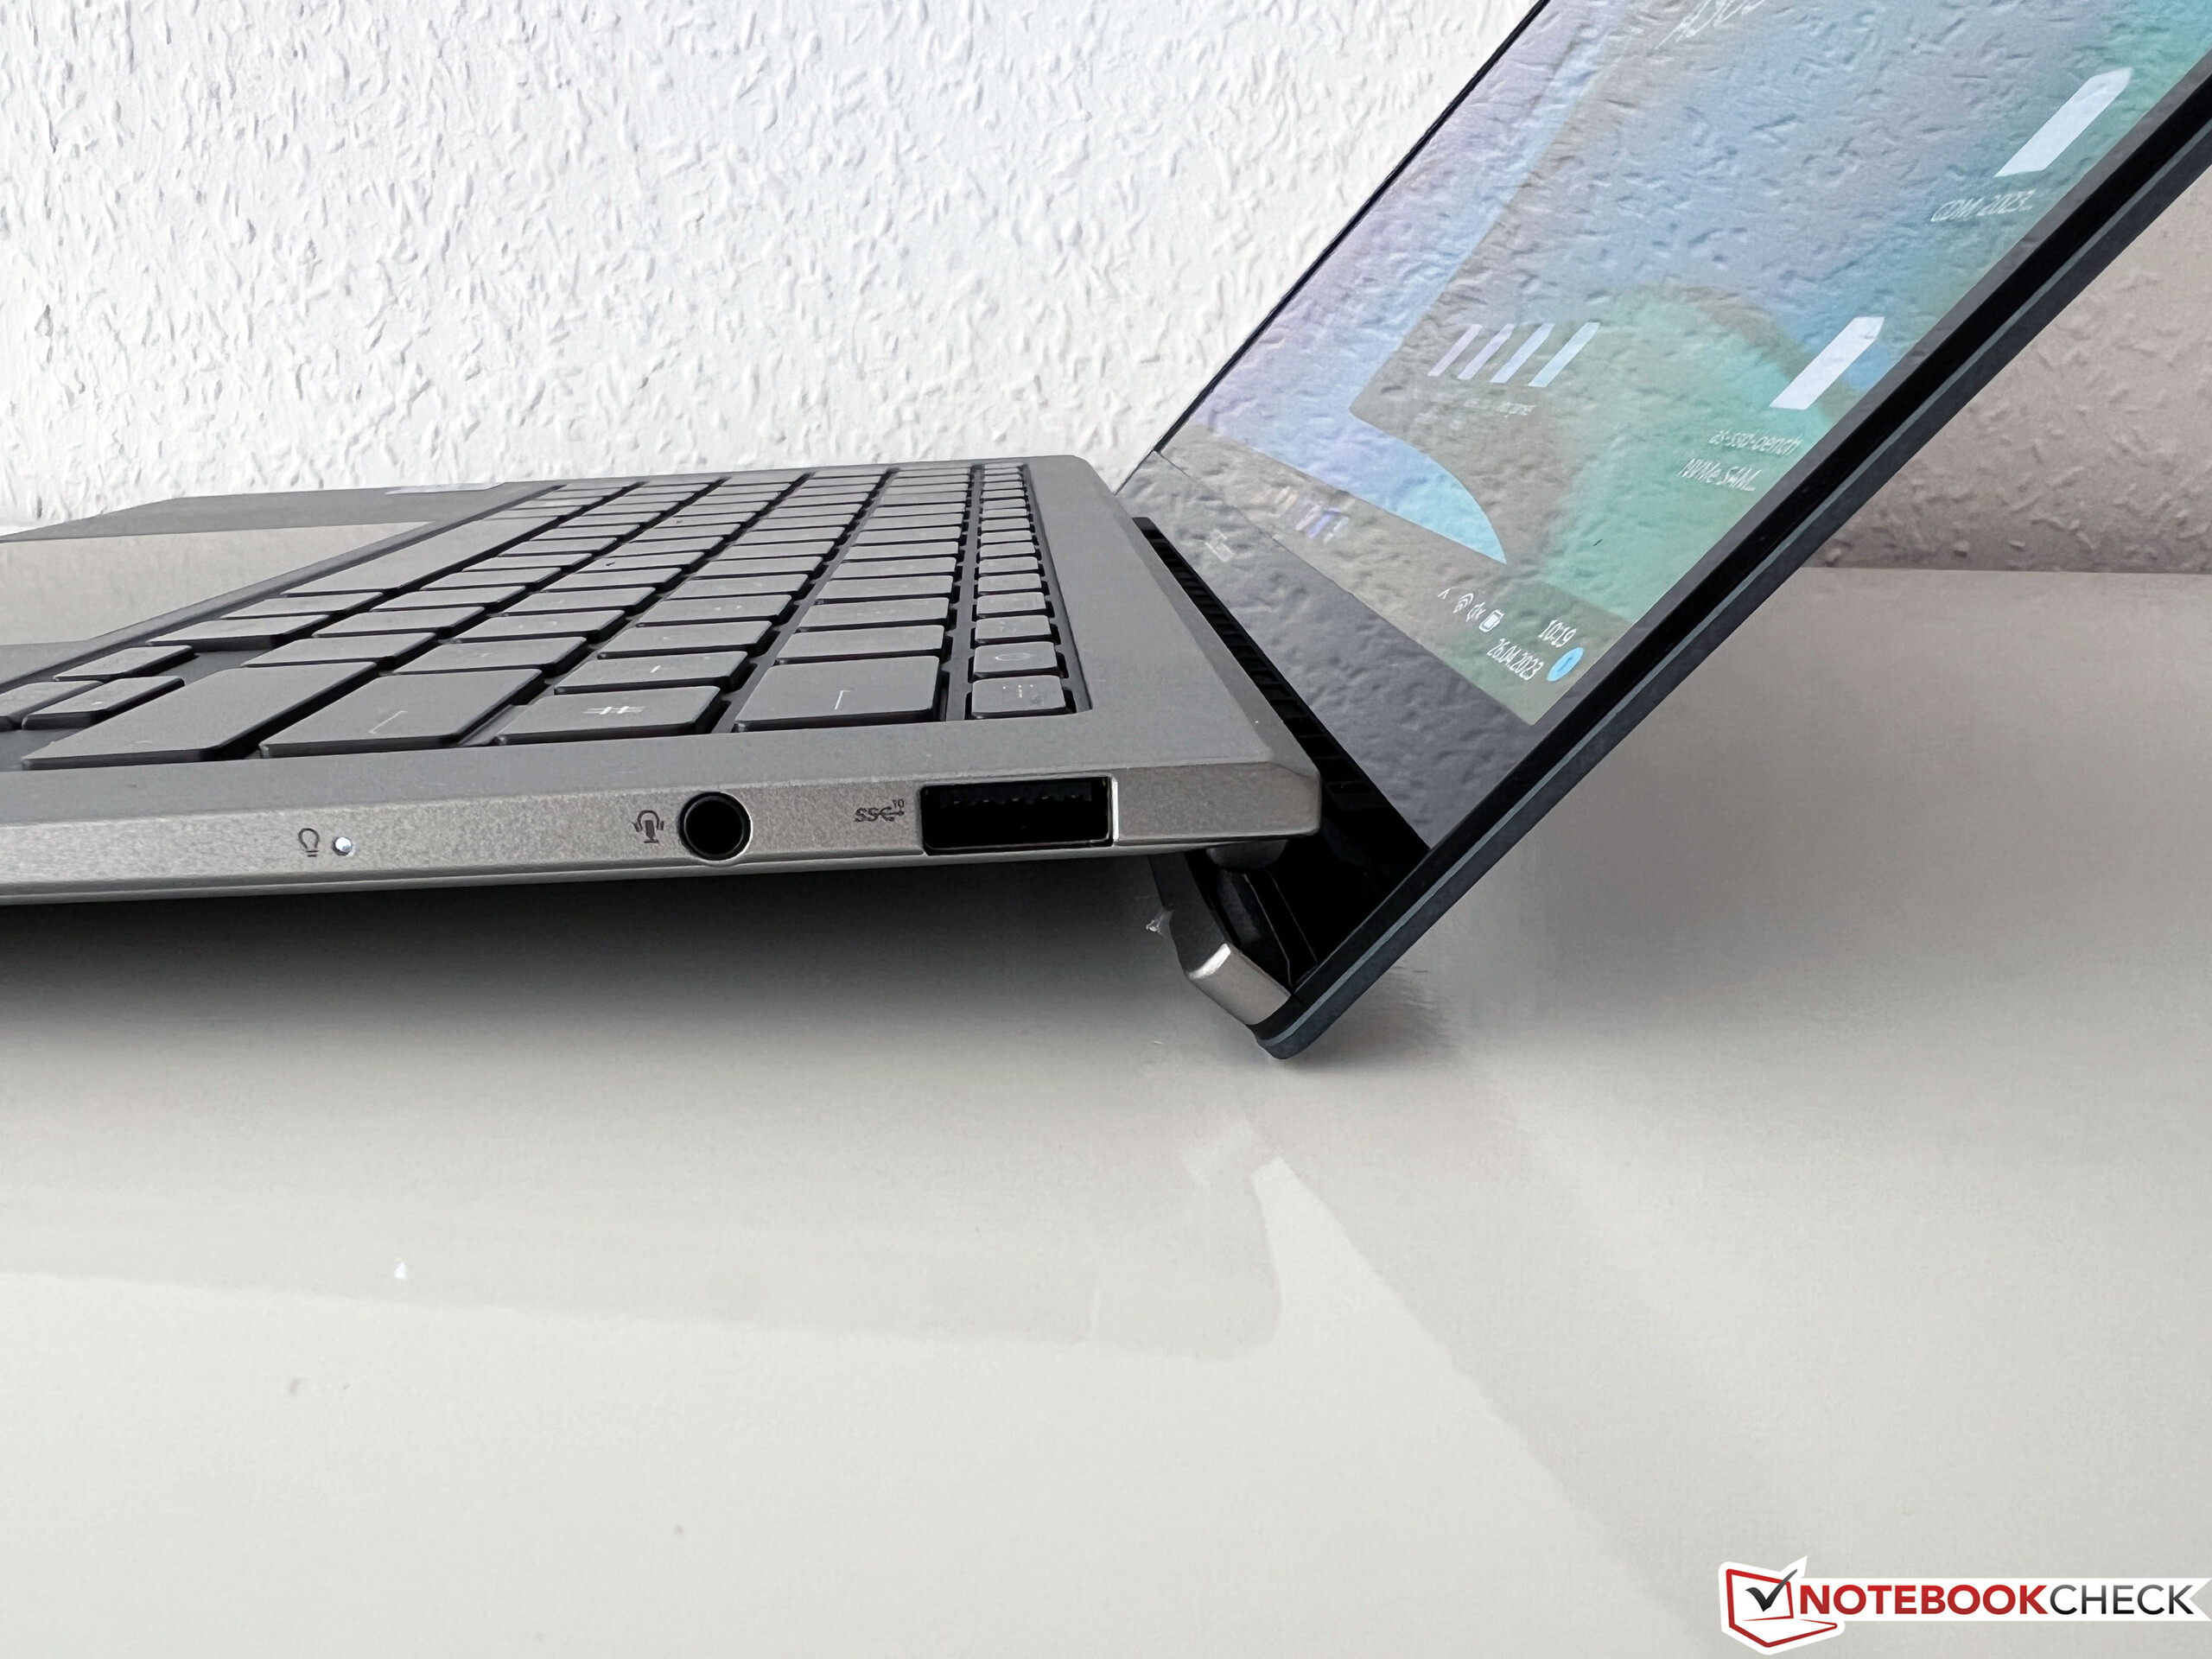
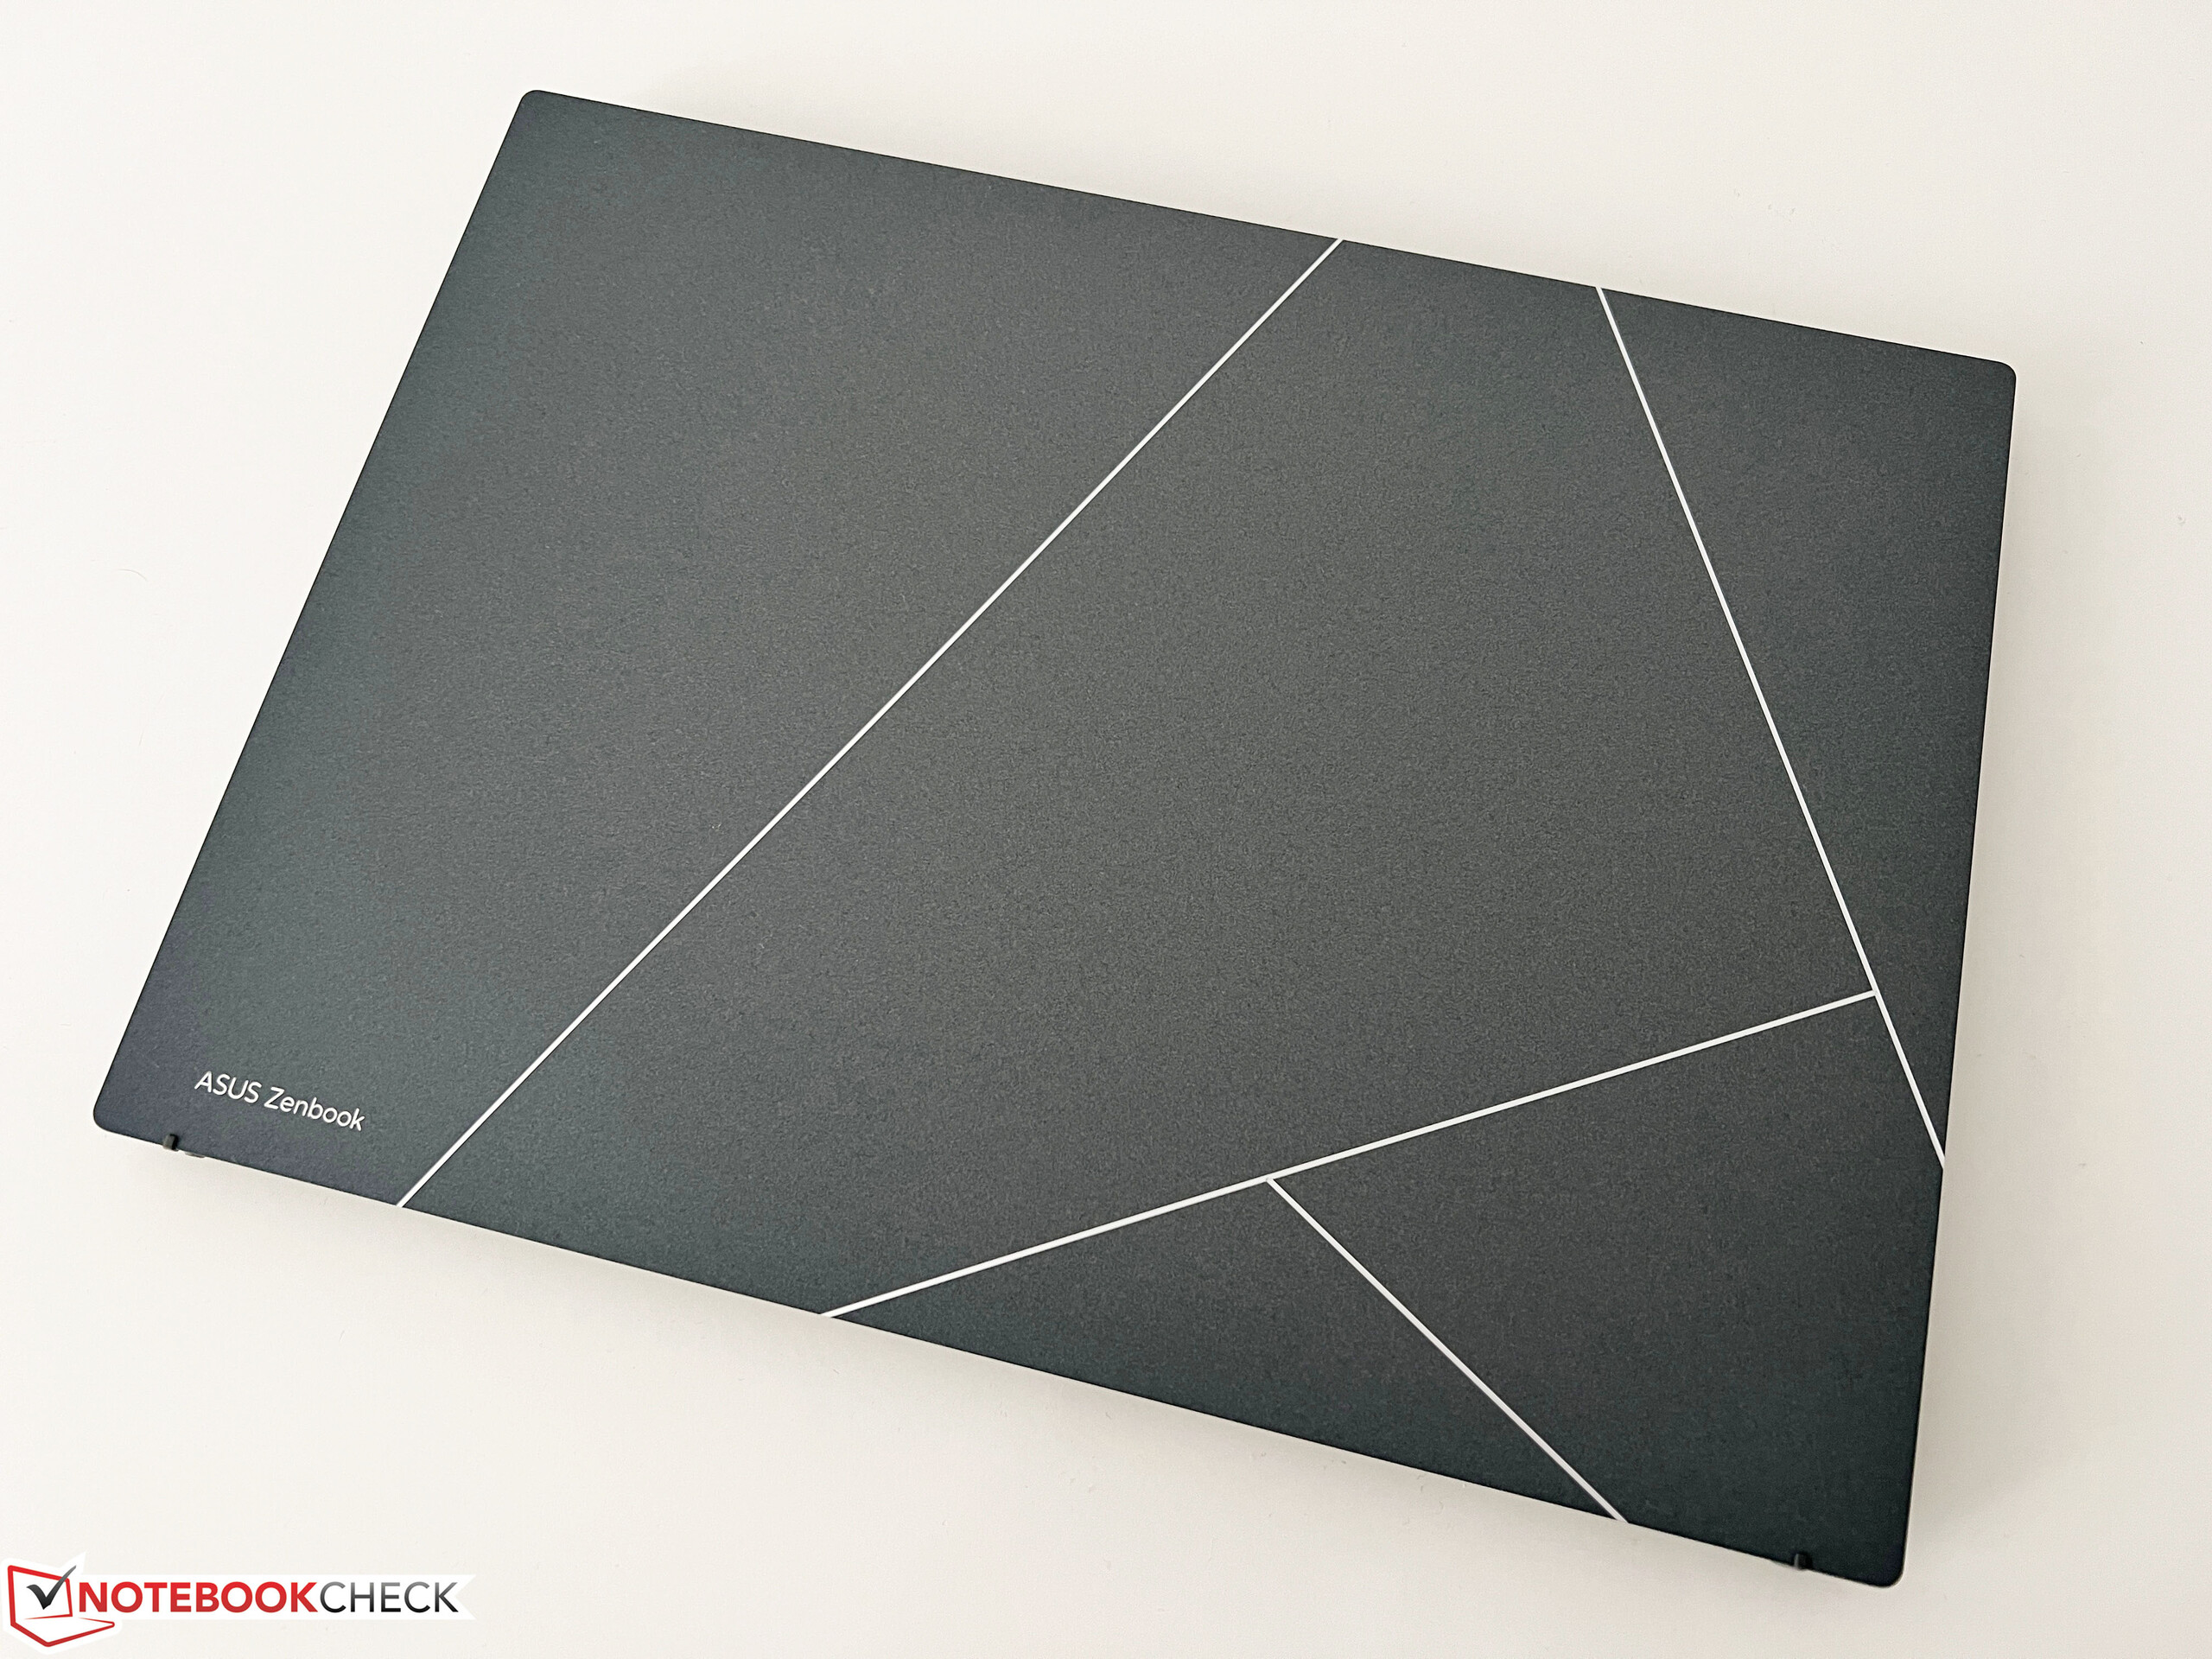
O gabinete do Zenbook S 13 2023 segue um novo design, incluindo uma nova dobradiça para a tela. Esse é um mecanismo ErgoLift em que a unidade de base fica inclinada ao levantar a tampa. Isso tem vantagens e desvantagens e, embora a unidade de base inclinada torne a digitação mais confortável, agora há uma borda rígida ao colocar o dispositivo sobre as coxas. O novo Zenbook está disponível nas cores Ponder Blue ou Basalt Grey, e nossa unidade de teste cinza parece muito boa e elegante com os vários tons de cinza. Além disso, gostamos muito do grande logotipo da ProArt na parte superior da tampa da tela.
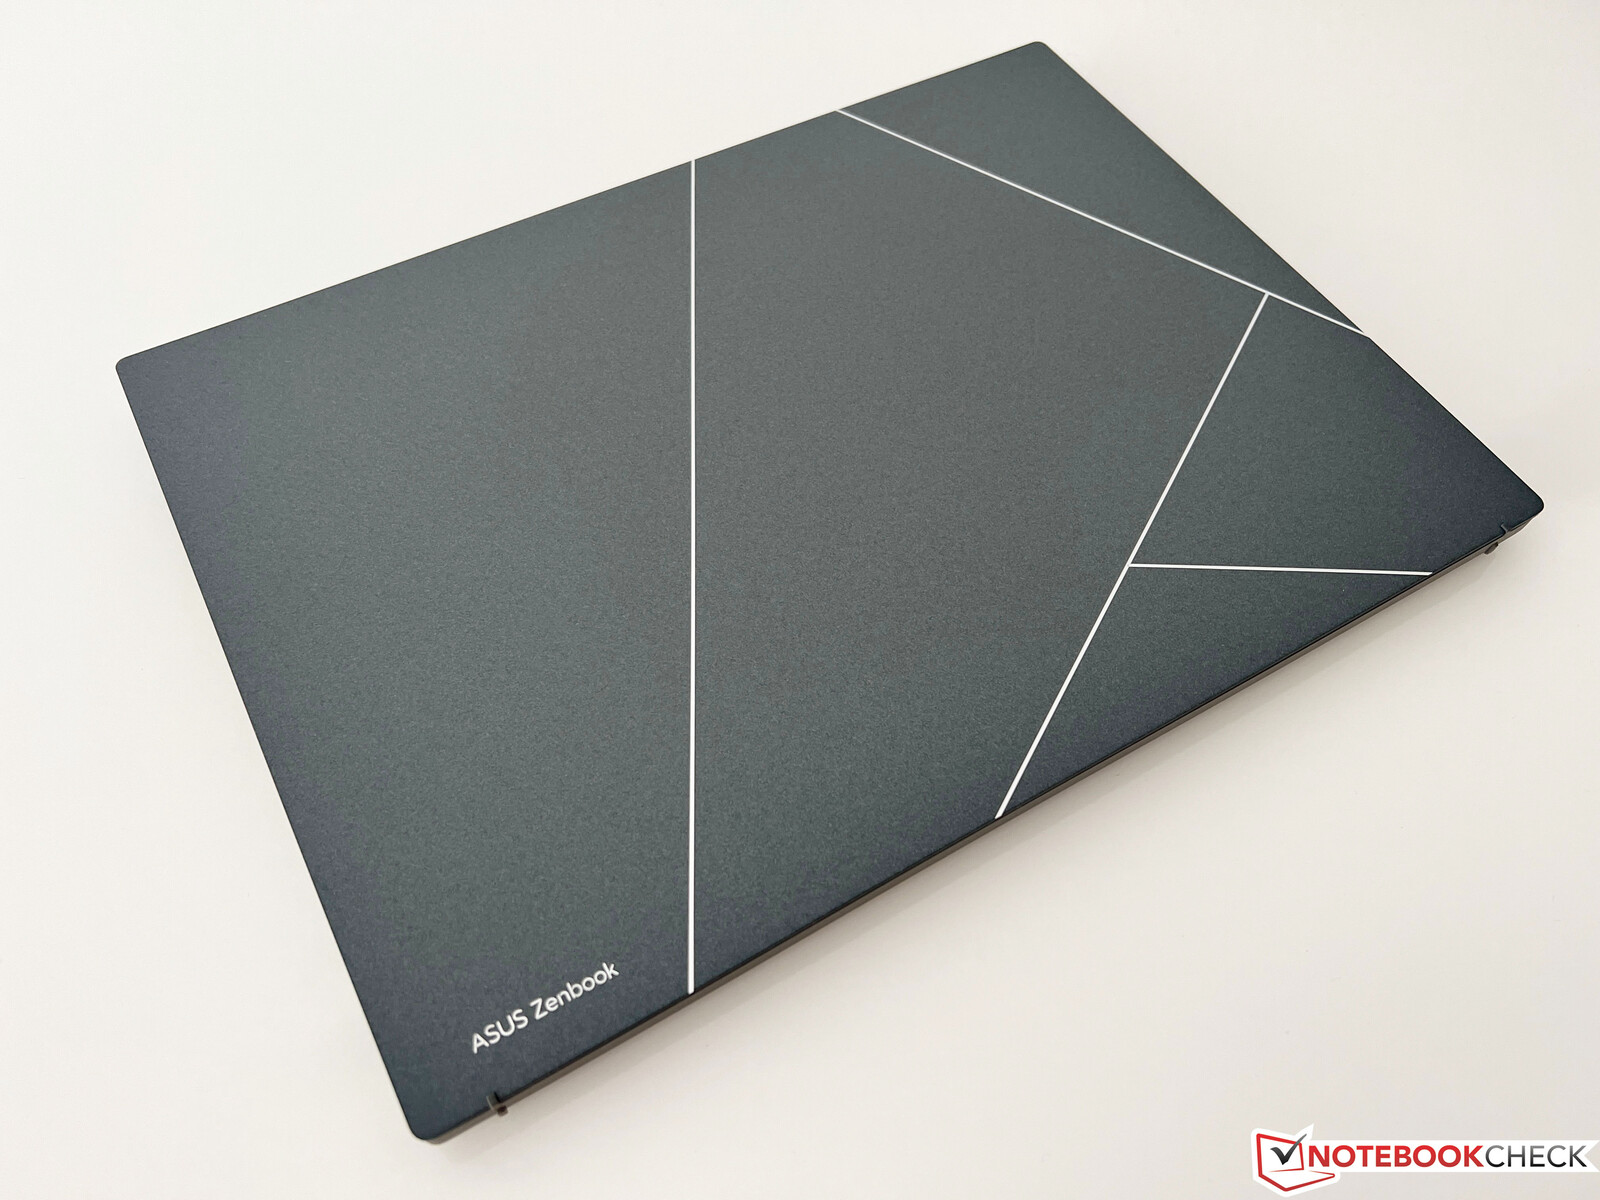
Além do novo design, um novo material também é usado para a tampa. Basicamente, o gabinete é feito de alumínio, que foi então coberto por uma camada de revestimento de cerâmica de plasma. Essa nova tecnologia de superfície oferece várias vantagens, como maior resistência ao desgaste e à corrosão. Na operação diária, a superfície levemente áspera também tem a vantagem de não permitir a visualização de impressões digitais. Depois de mais de uma semana, não precisamos nem mesmo de um pano para limpá-lo. De acordo com o fabricante, o processo de produção também é mais ecológico.
A superfície da unidade de base também é ligeiramente áspera, e as impressões digitais também não são um problema. A estabilidade de todo o laptop nos deixa uma excelente impressão e, apesar da construção fina, nem a unidade da base nem a tampa podem ser deformadas ou dobradas excessivamente. A dobradiça também é bem ajustada, embora isso não possa evitar uma leve oscilação após a alteração do ângulo de abertura. O ângulo máximo de abertura é de 180 graus.
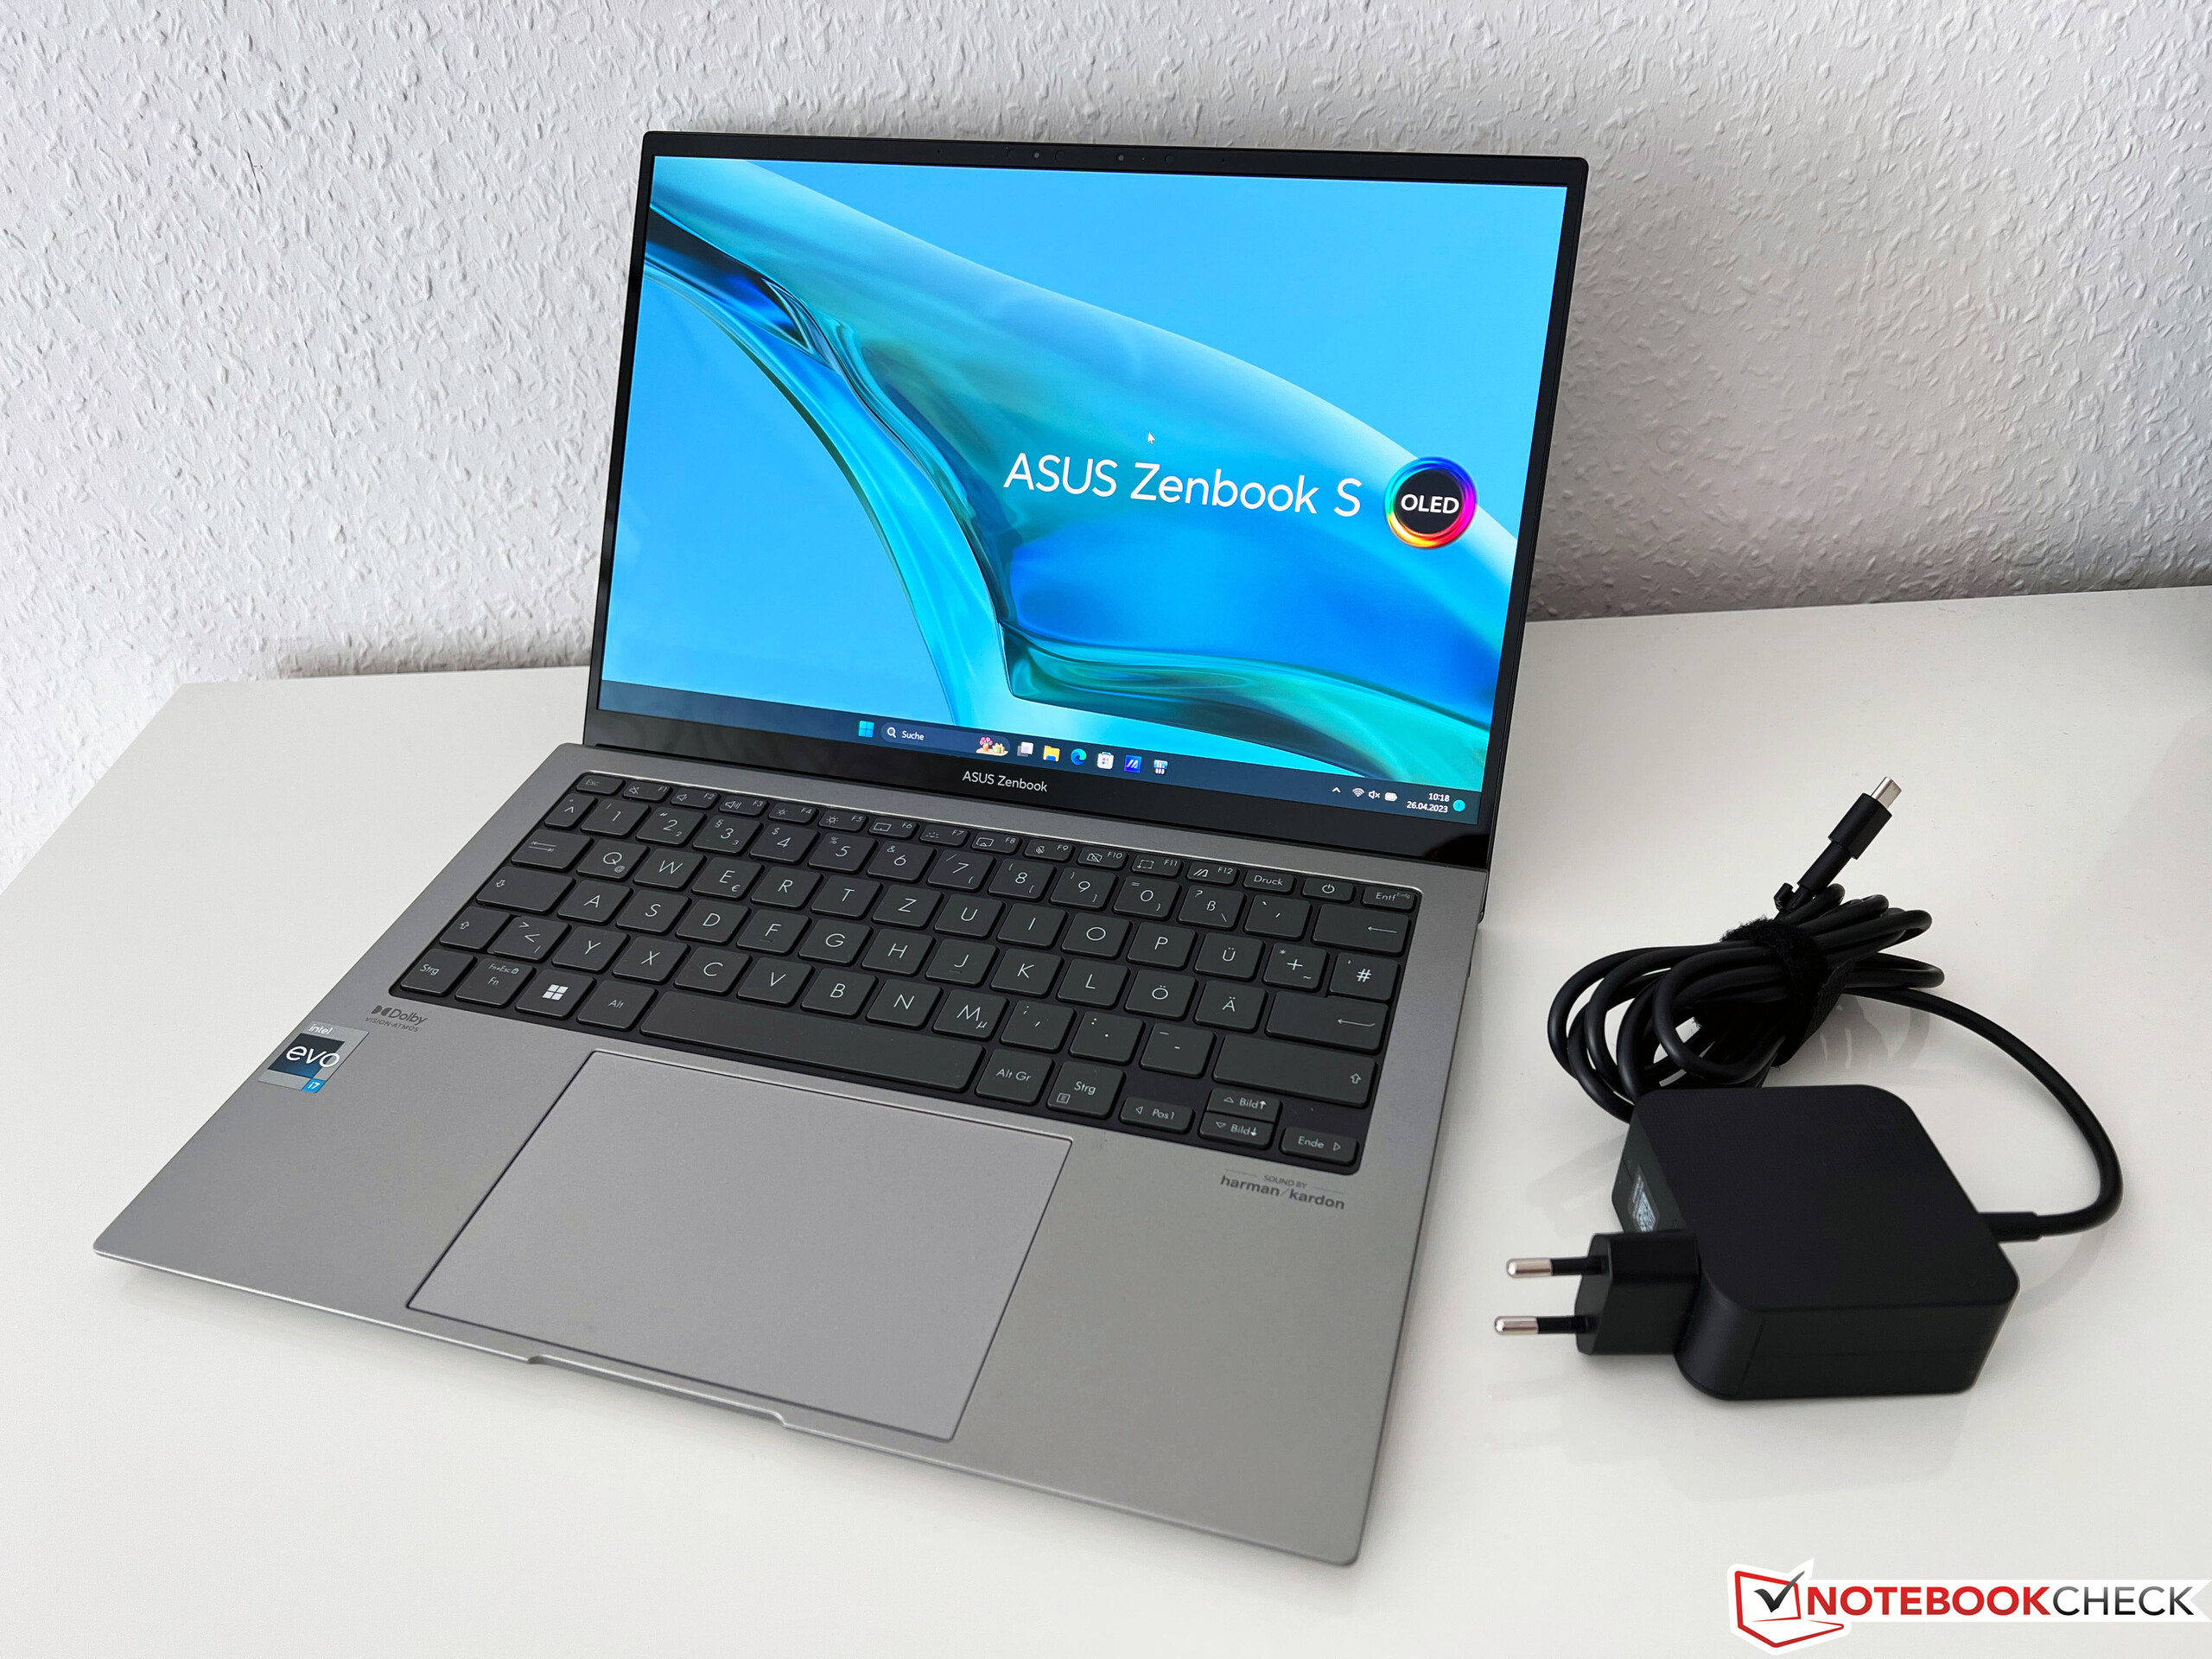
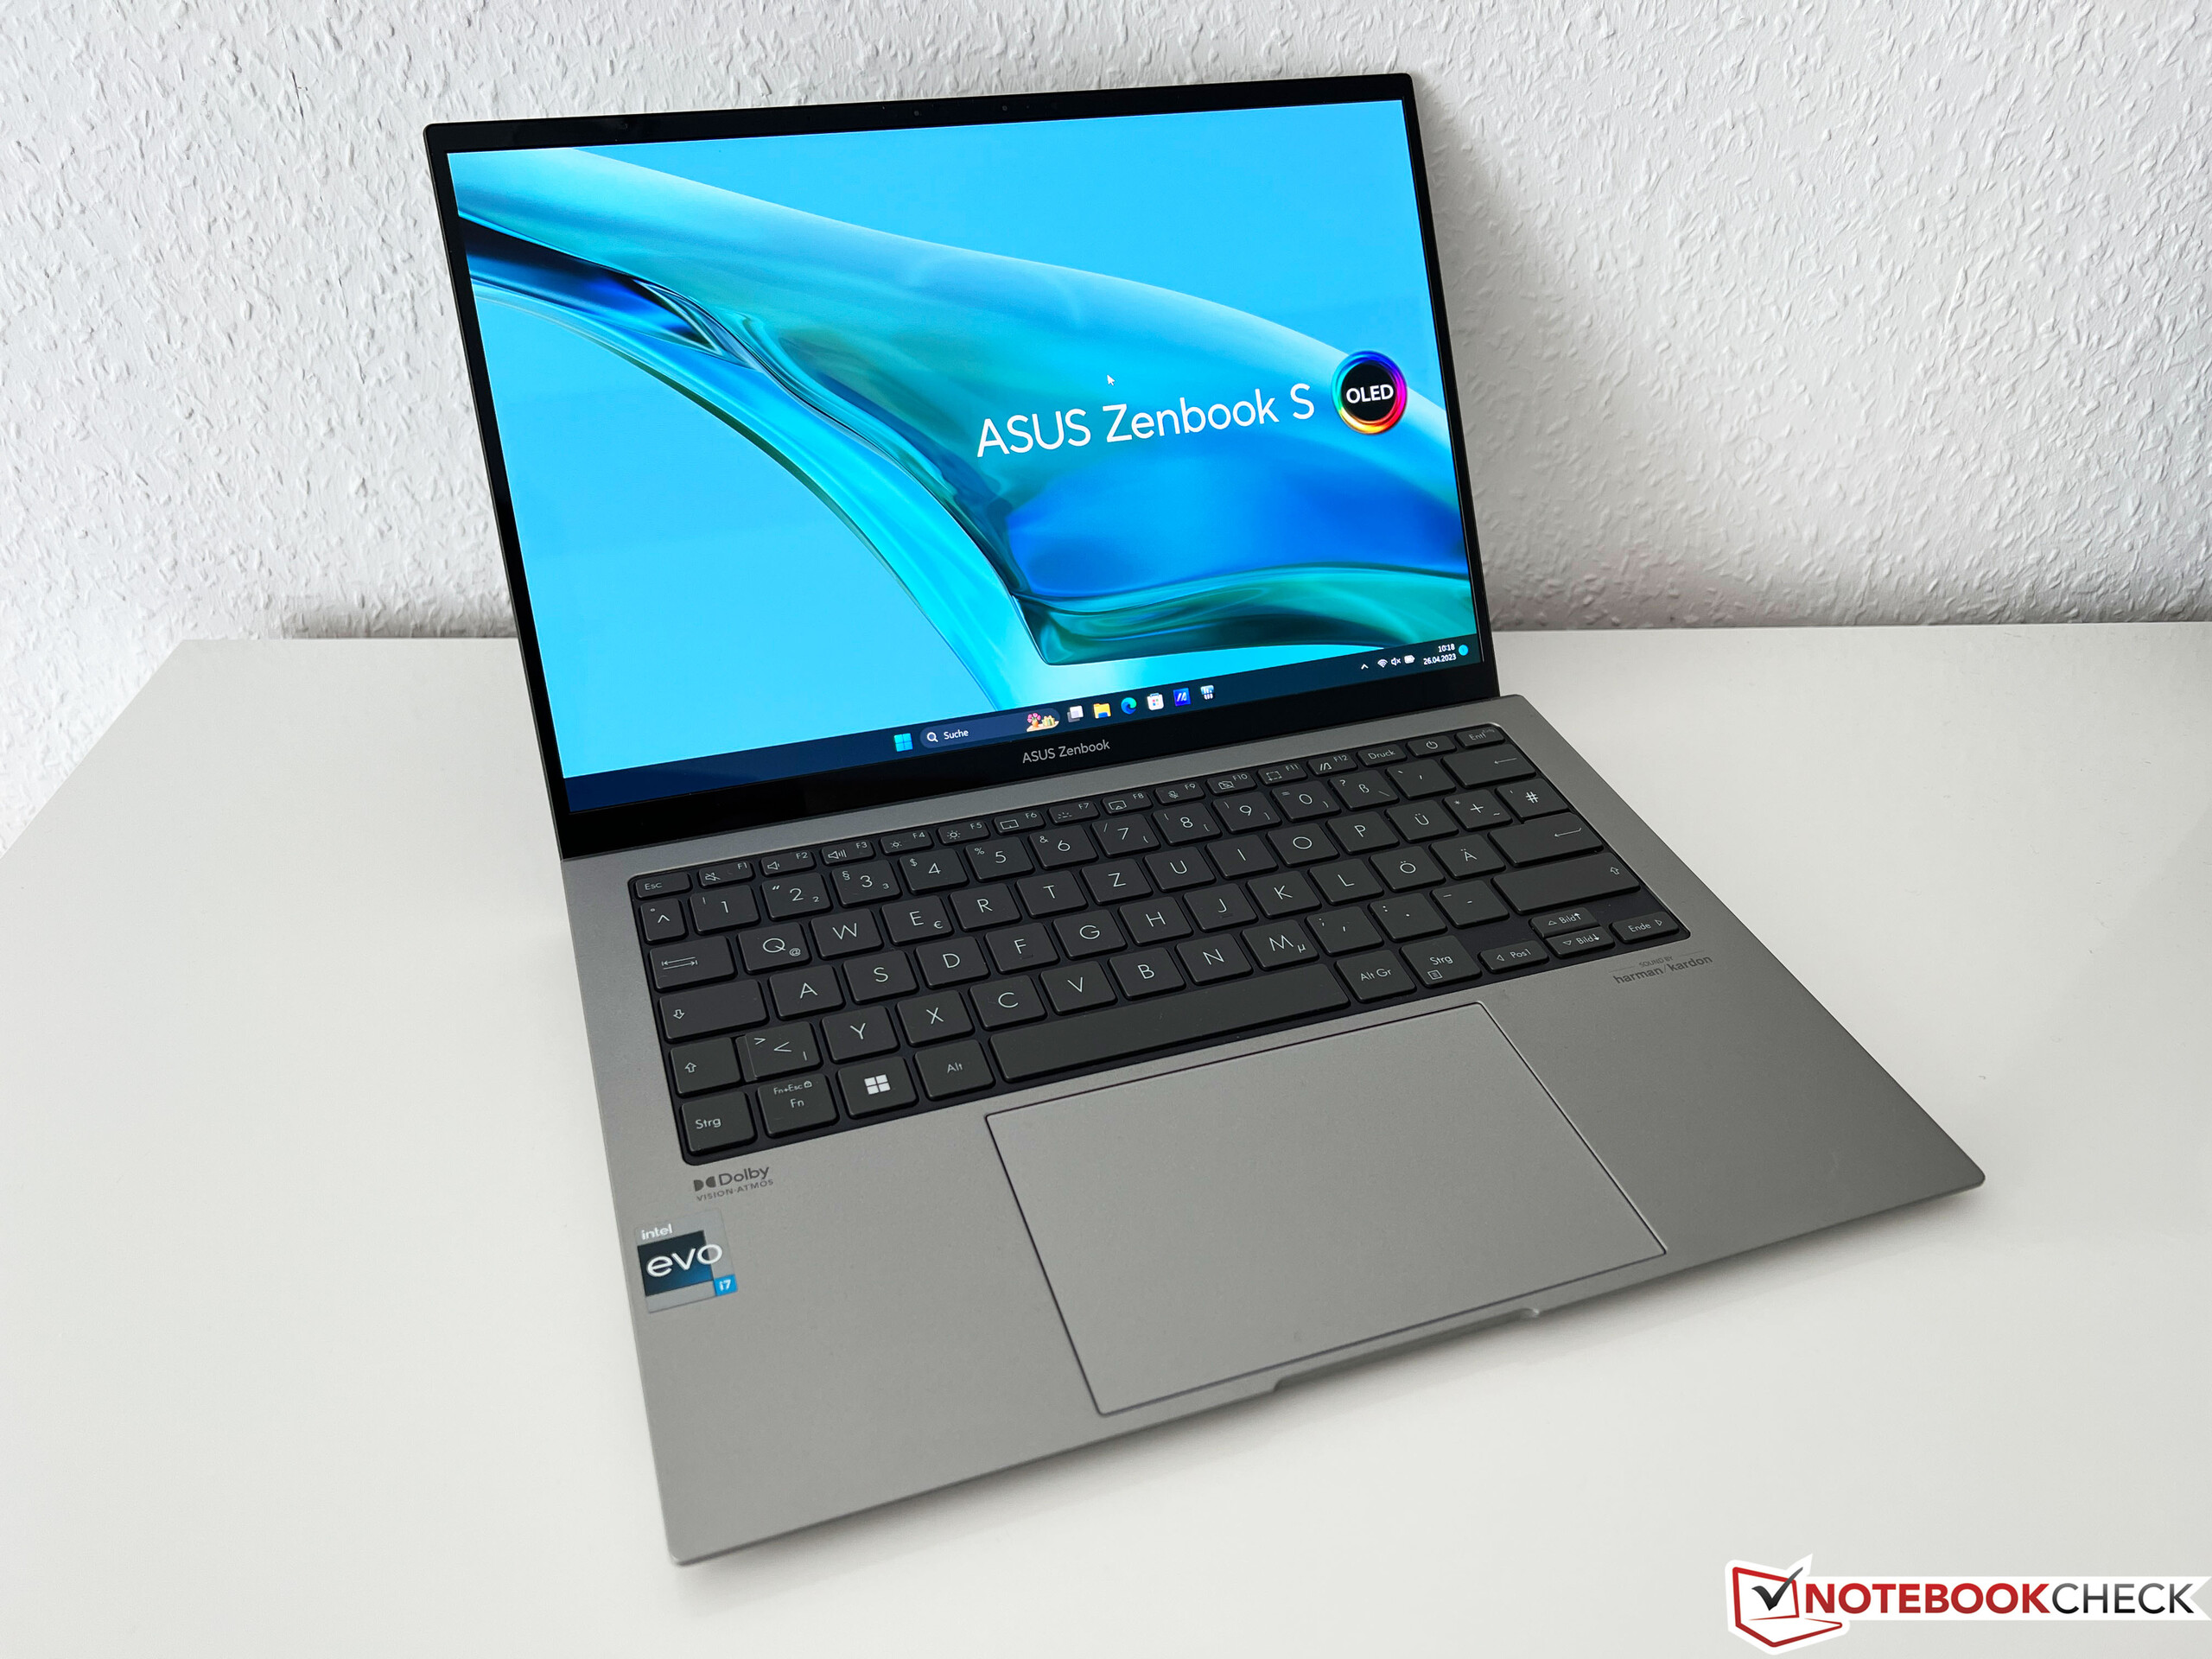
A comparação de tamanho mostra que o novo Zenbook S 13 ficou particularmente mais fino. Embora ele também seja menos espesso do que os concorrentes do Windows, o atual MacBook Air M2 de Apple é minimamente mais fino. Por outro lado, a folha de especificações é um pouco otimista no que diz respeito ao peso, uma vez que nossa unidade de teste traz 1.048 gramas (~3,263 lb) para a balança, ficando apenas no meio do campo com isso. Em comparação com o antecessor, isso representa apenas uma economia de peso de 47 gramas (~1,7 oz). Na espessura, a economia é de pelo menos 3 mm, o que é definitivamente perceptível. De acordo com a Asus, ele é o laptop OLED de 13,3 polegadas mais leve, mas alguns dos concorrentes com painéis IPS são ainda mais leves. Mas, de modo geral, a mobilidade do Zenbook S 13 é excelente. O carregador compacto acrescenta mais 228 gramas (~8 oz) ao peso.
Equipamento - Zenbook com Thunderbolt 4
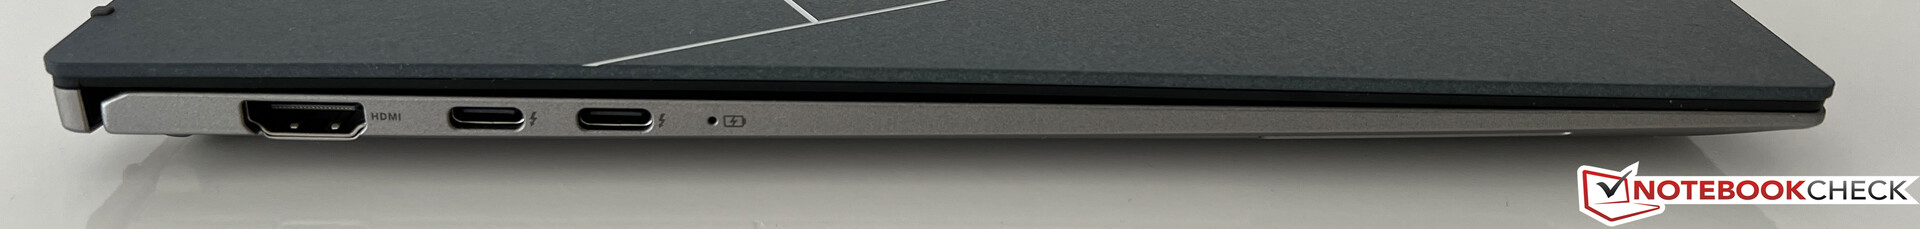
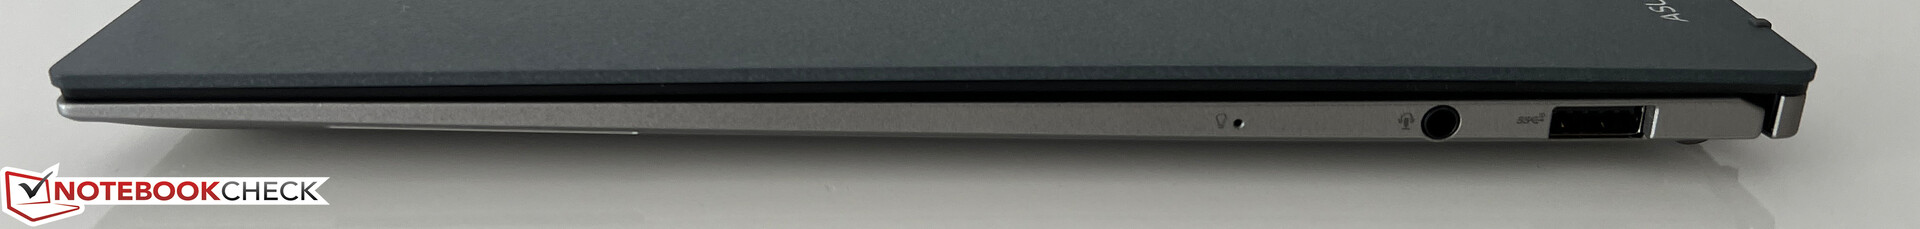
Depois do Zenbook S 13 do ano passadousava três portas USB-C exclusivamente, a Asus agora oferece 2x USB-C, adicionando também uma porta USB-A (apesar do case fino) e também uma porta HDMI de tamanho normal. Isso é simplesmente muito mais prático na operação cotidiana e, como é um laptop Intel, as duas portas USB-C também suportam Thunderbolt 4.
Comunicação
A Asus usa o moderno módulo WLAN AZ211 da Intel, que já suporta o padrão WLAN Wi-Fi 6E mais atual, bem como o Bluetooth 5.2. No entanto, em nosso teste, não conseguimos nos conectar à rede de 6 GHz correspondente do nosso roteador de referência da Asus e, portanto, usamos a rede de 5 GHz. As taxas de transferência são muito altas em geral e também estáveis em grande parte. Também não observamos nenhum problema de conexão na prática.
| Networking | |
| Asus ZenBook S13 OLED UX5304 | |
| iperf3 transmit AXE11000 | |
| iperf3 receive AXE11000 | |
| Asus Zenbook S 13 OLED | |
| iperf3 transmit AXE11000 | |
| iperf3 receive AXE11000 | |
| Apple MacBook Air M2 Entry | |
| iperf3 transmit AXE11000 | |
| iperf3 receive AXE11000 | |
| Lenovo Yoga Slim 7 Carbon 13IAP7-82U9005FGE | |
| iperf3 transmit AXE11000 6GHz | |
| iperf3 receive AXE11000 6GHz | |
| Samsung Galaxy Book2 Pro 13 NP930XED-KA1DE | |
| iperf3 transmit AXE11000 6GHz | |
| iperf3 receive AXE11000 6GHz | |
Webcam
A Asus atualizou a webcam e agora está usando uma webcam Full-HD junto com um sensor IR para reconhecimento facial em combinação com o Windows Hello. A qualidade é um pouco melhor do que a do ano passado e decente em boas condições de iluminação.


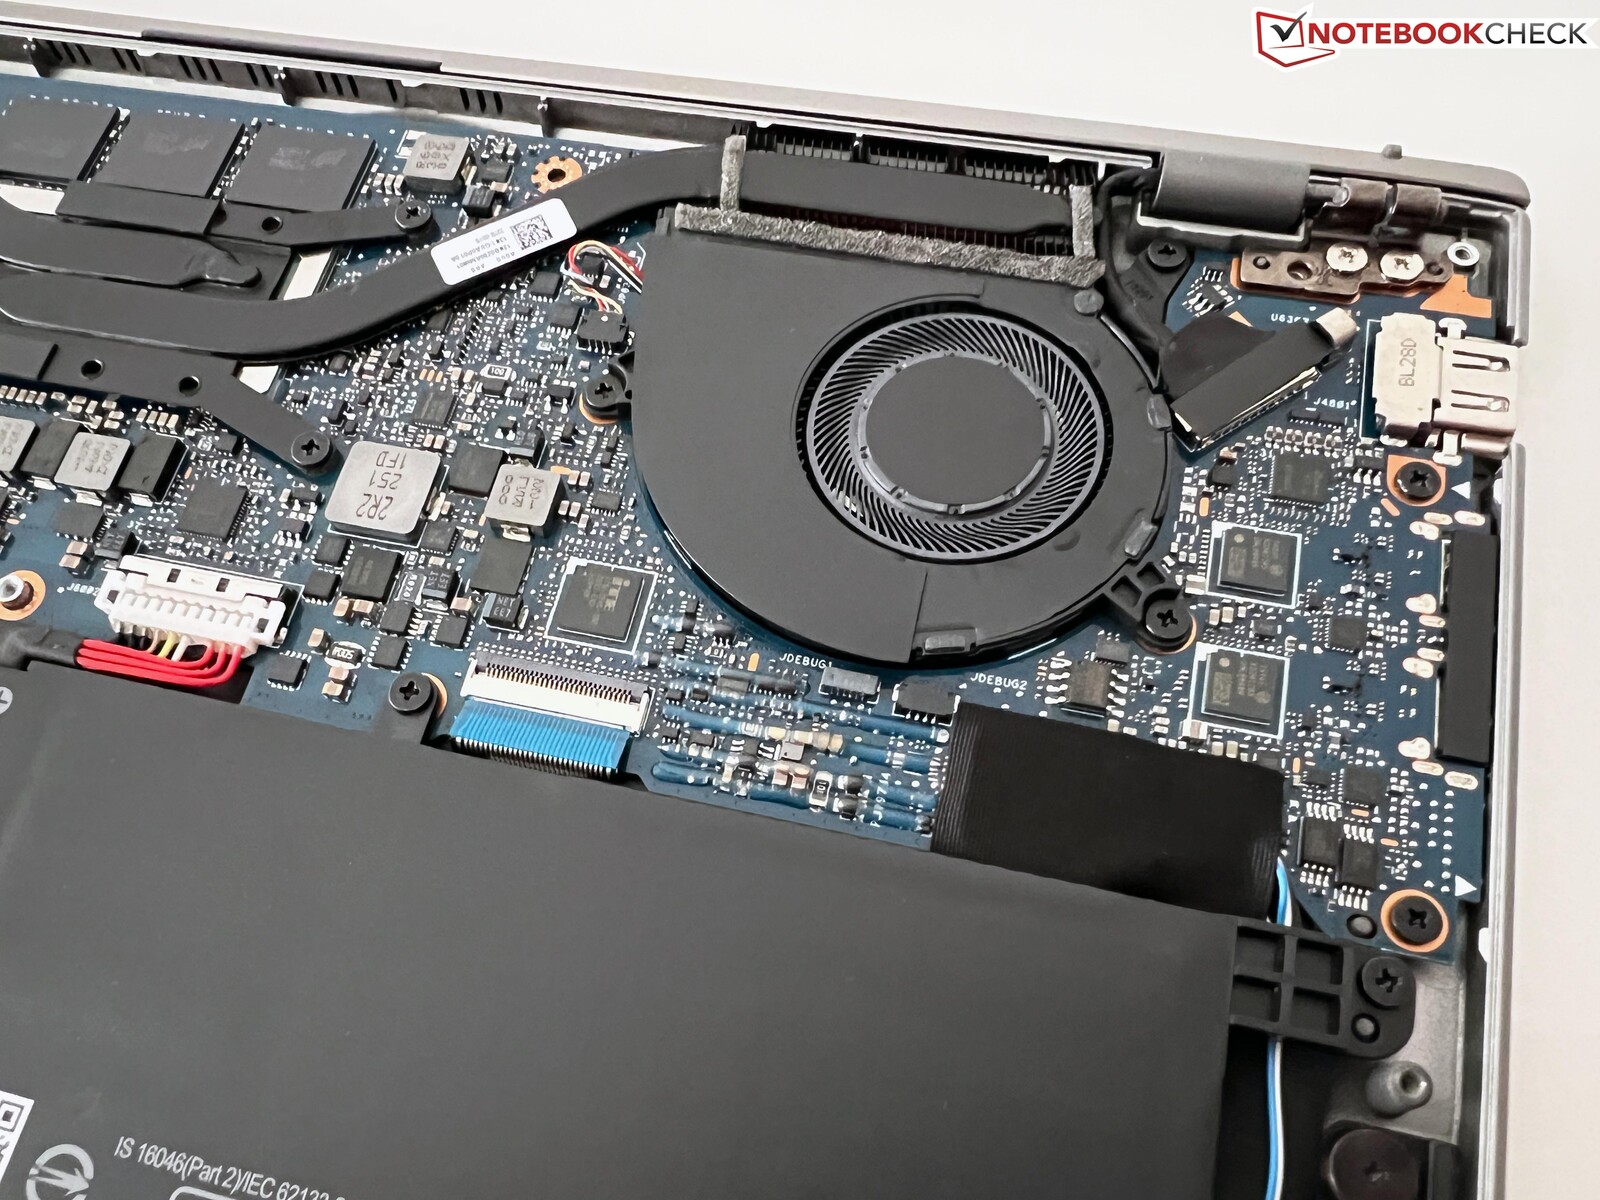
Manutenção
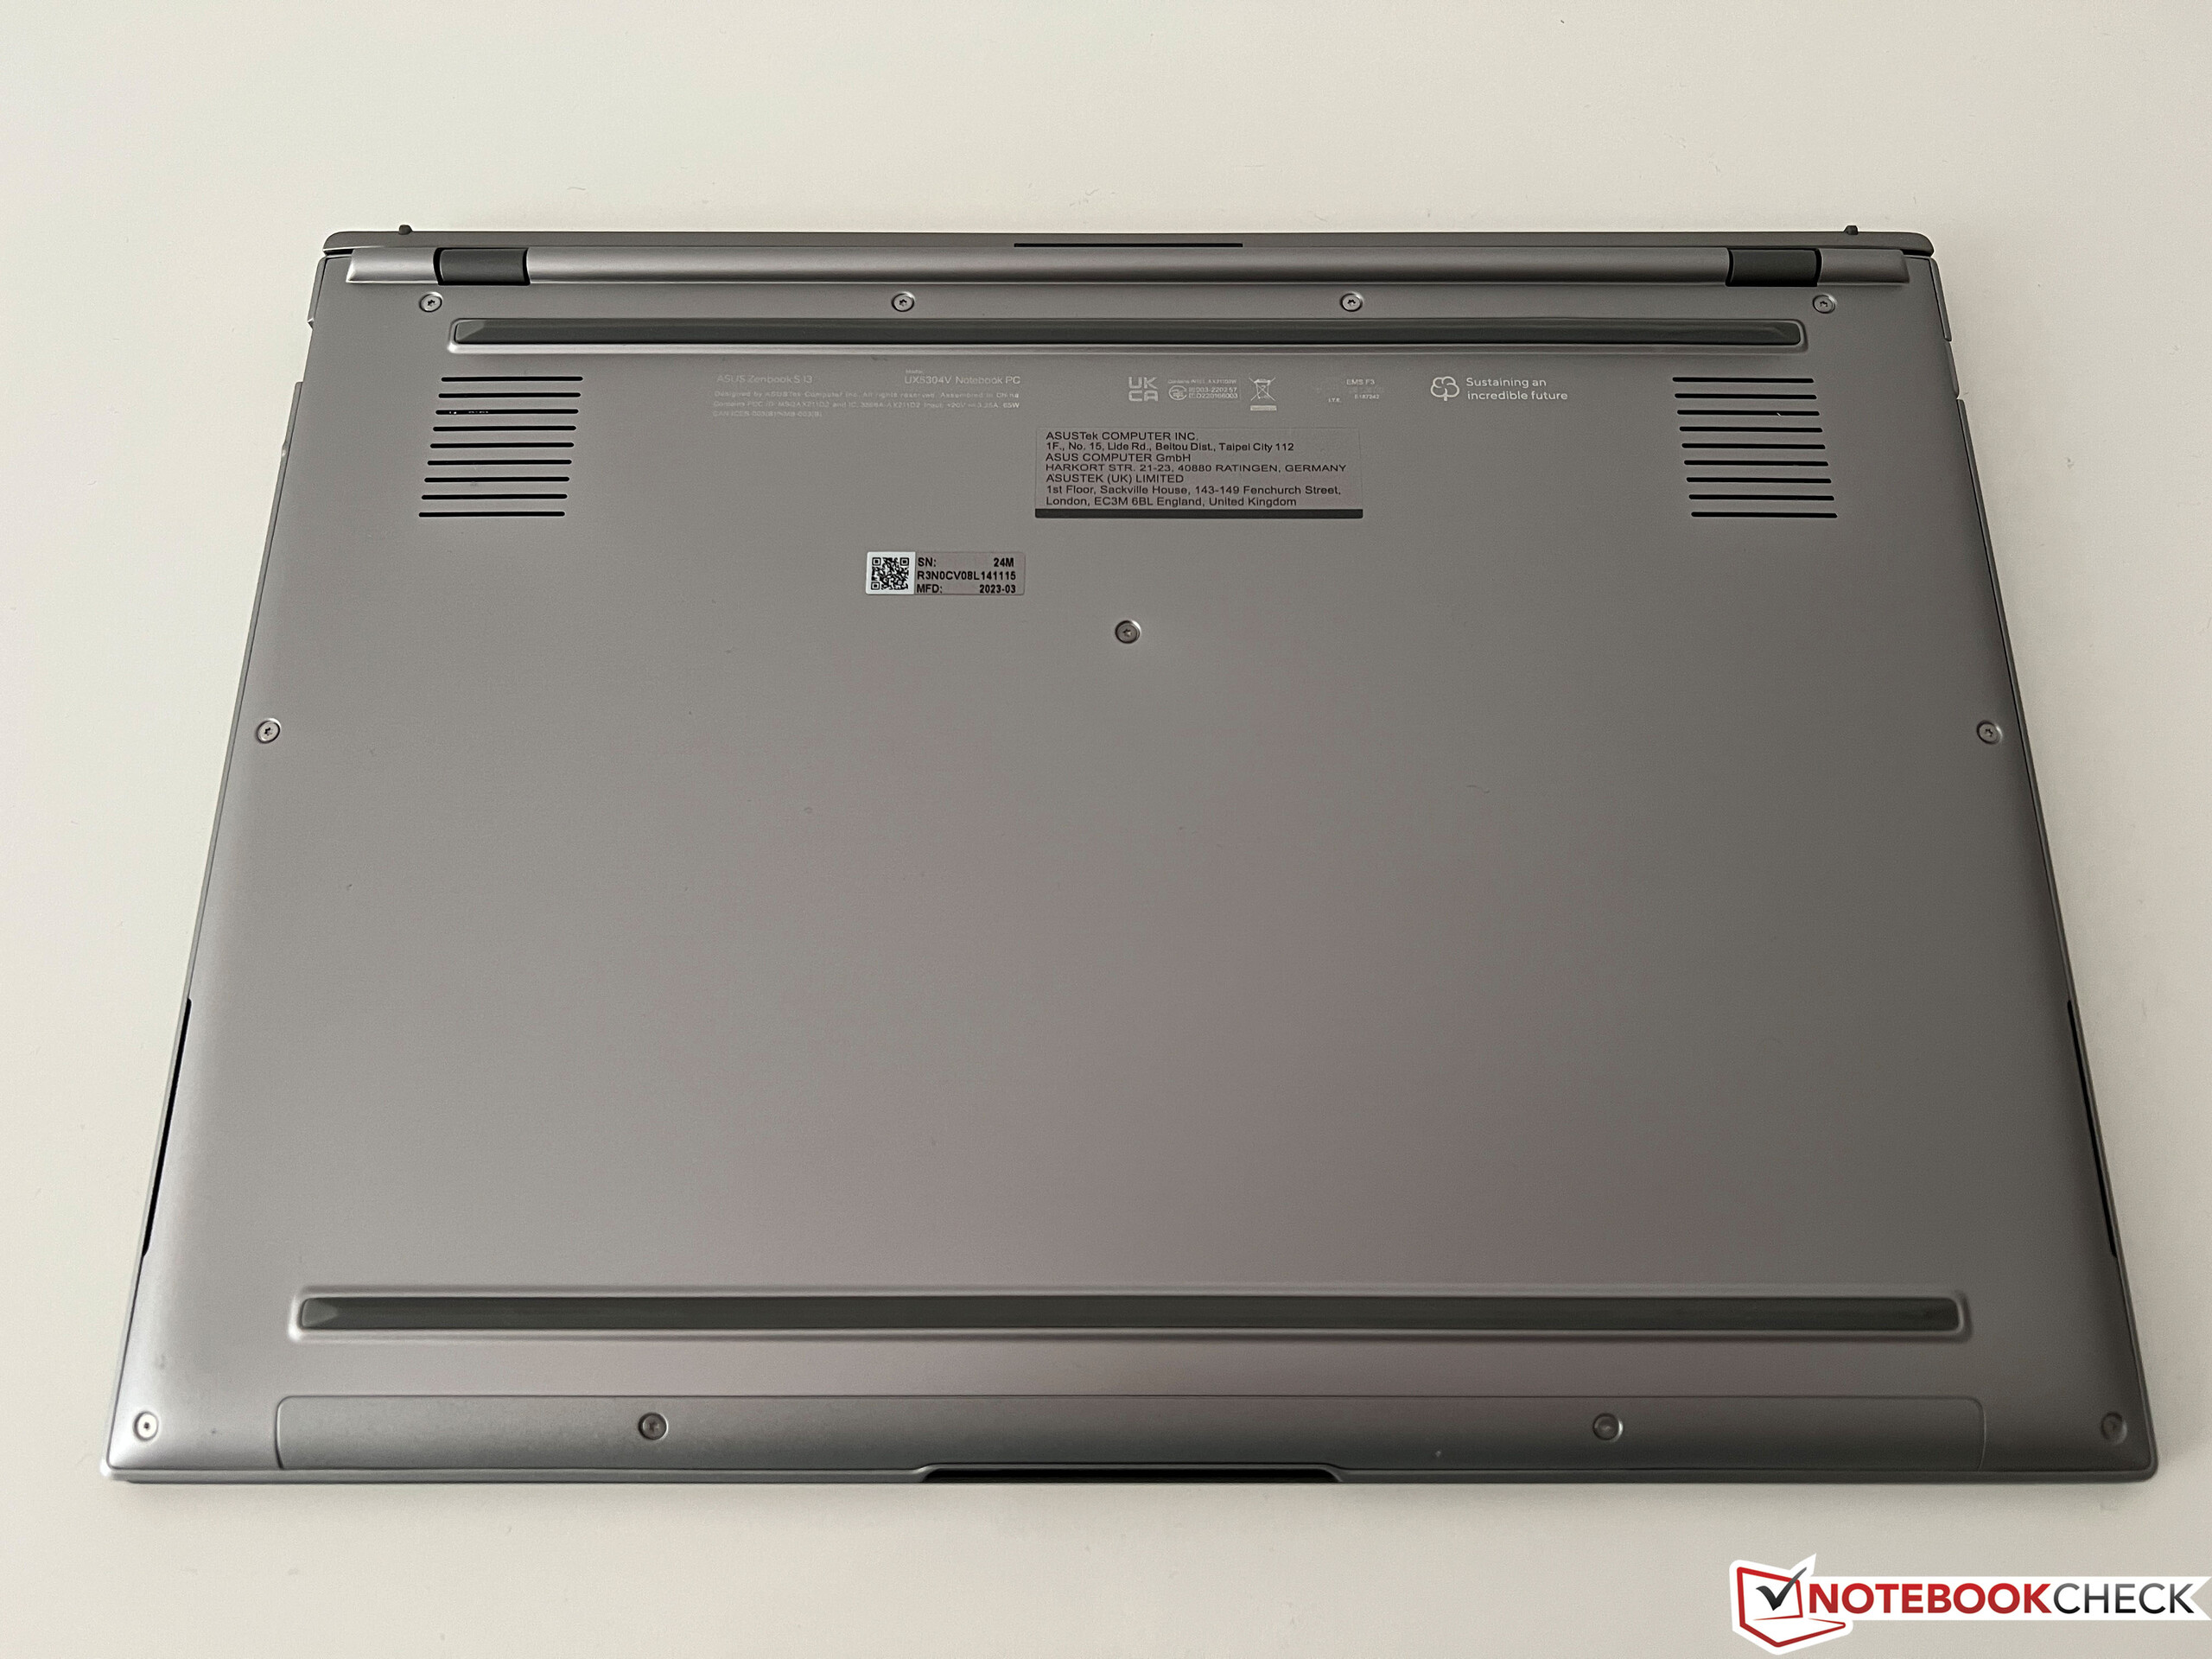
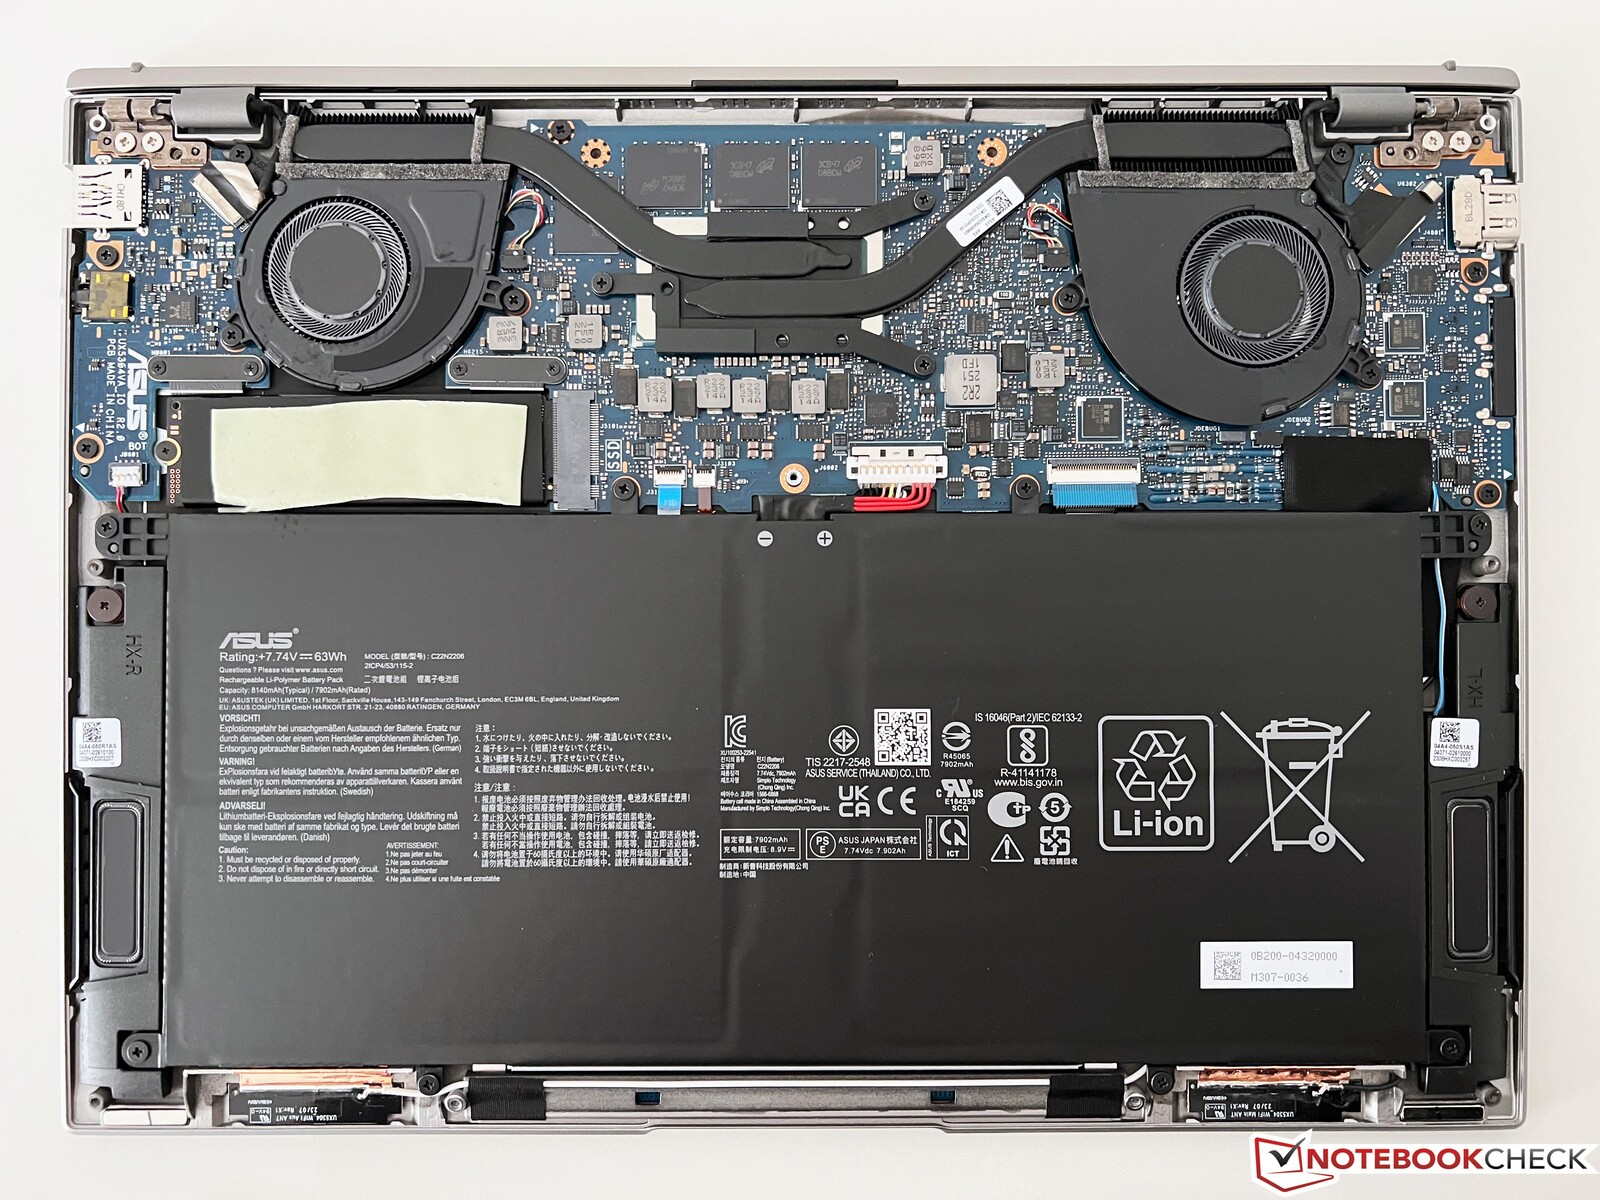
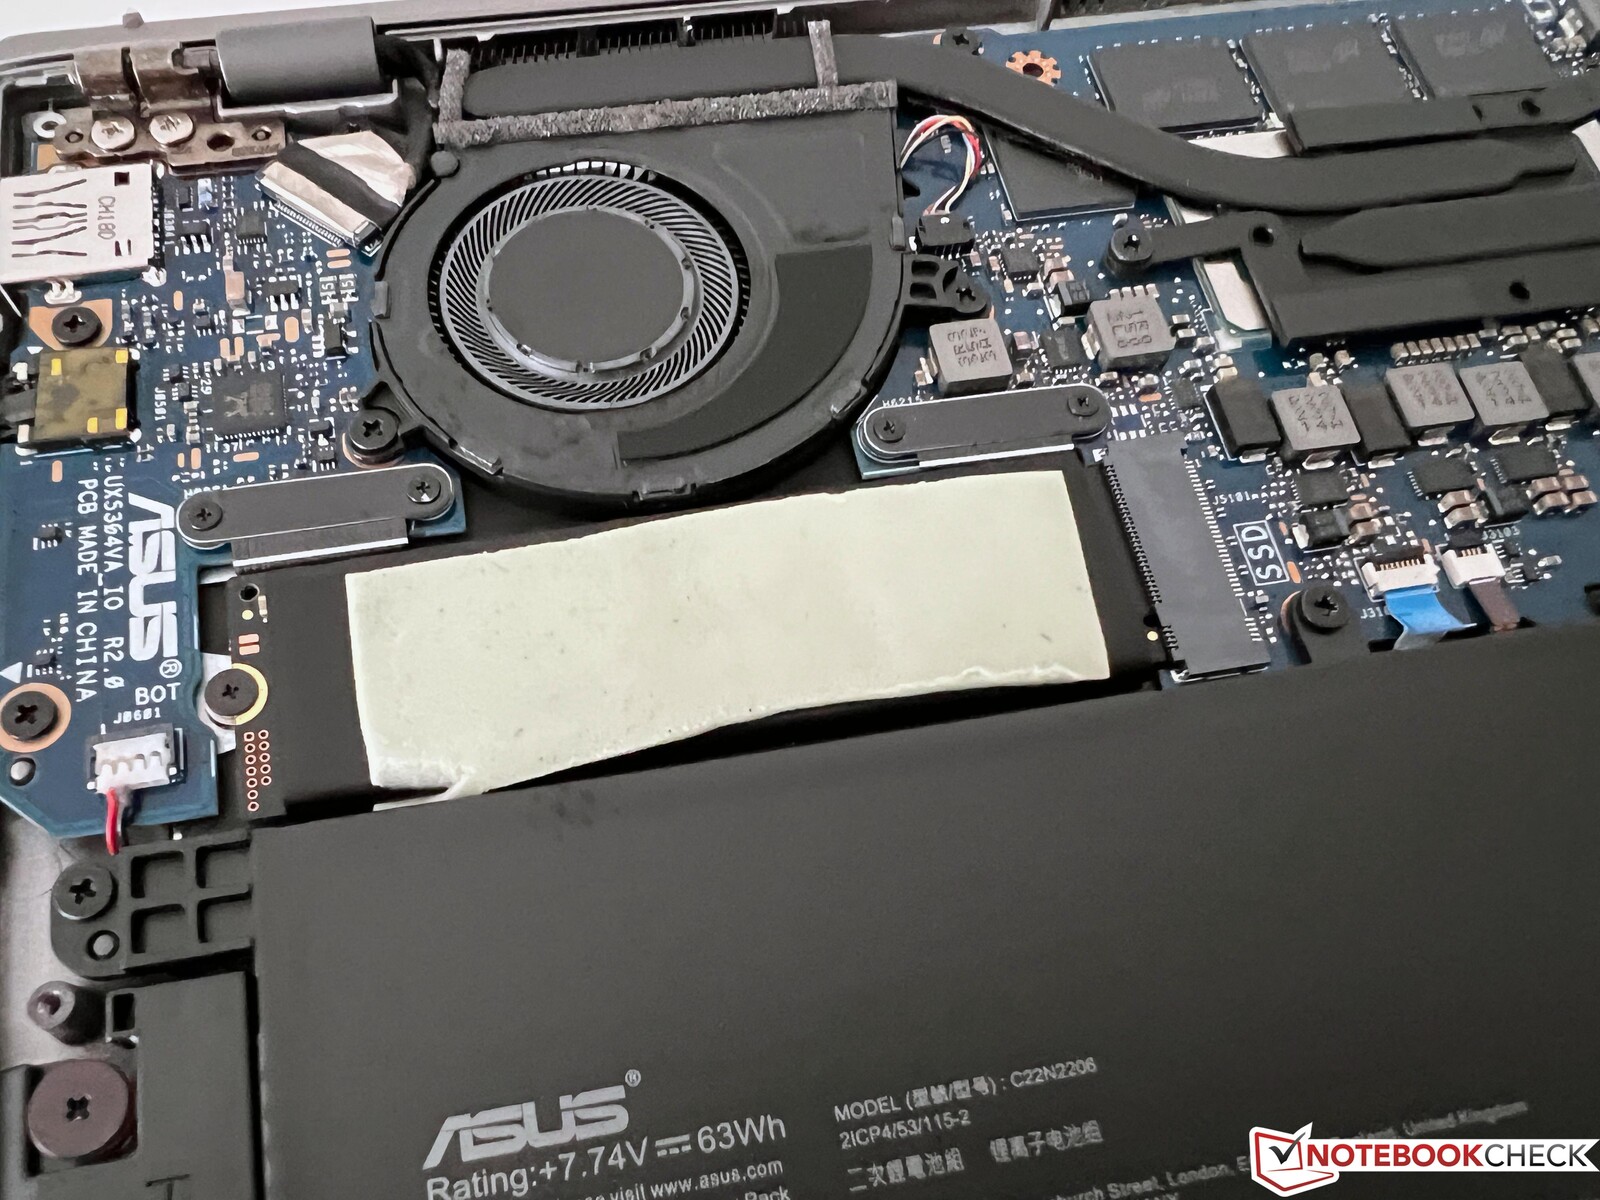
A tampa inferior é fixada com parafusos Torx (T5) e pode ser removida facilmente. A construção interna é dominada pela bateria grande, e você também pode ver as duas ventoinhas que podem ser limpas. Embora o SSD M.2 2280 possa ser substituído, todos os outros componentes são soldados.
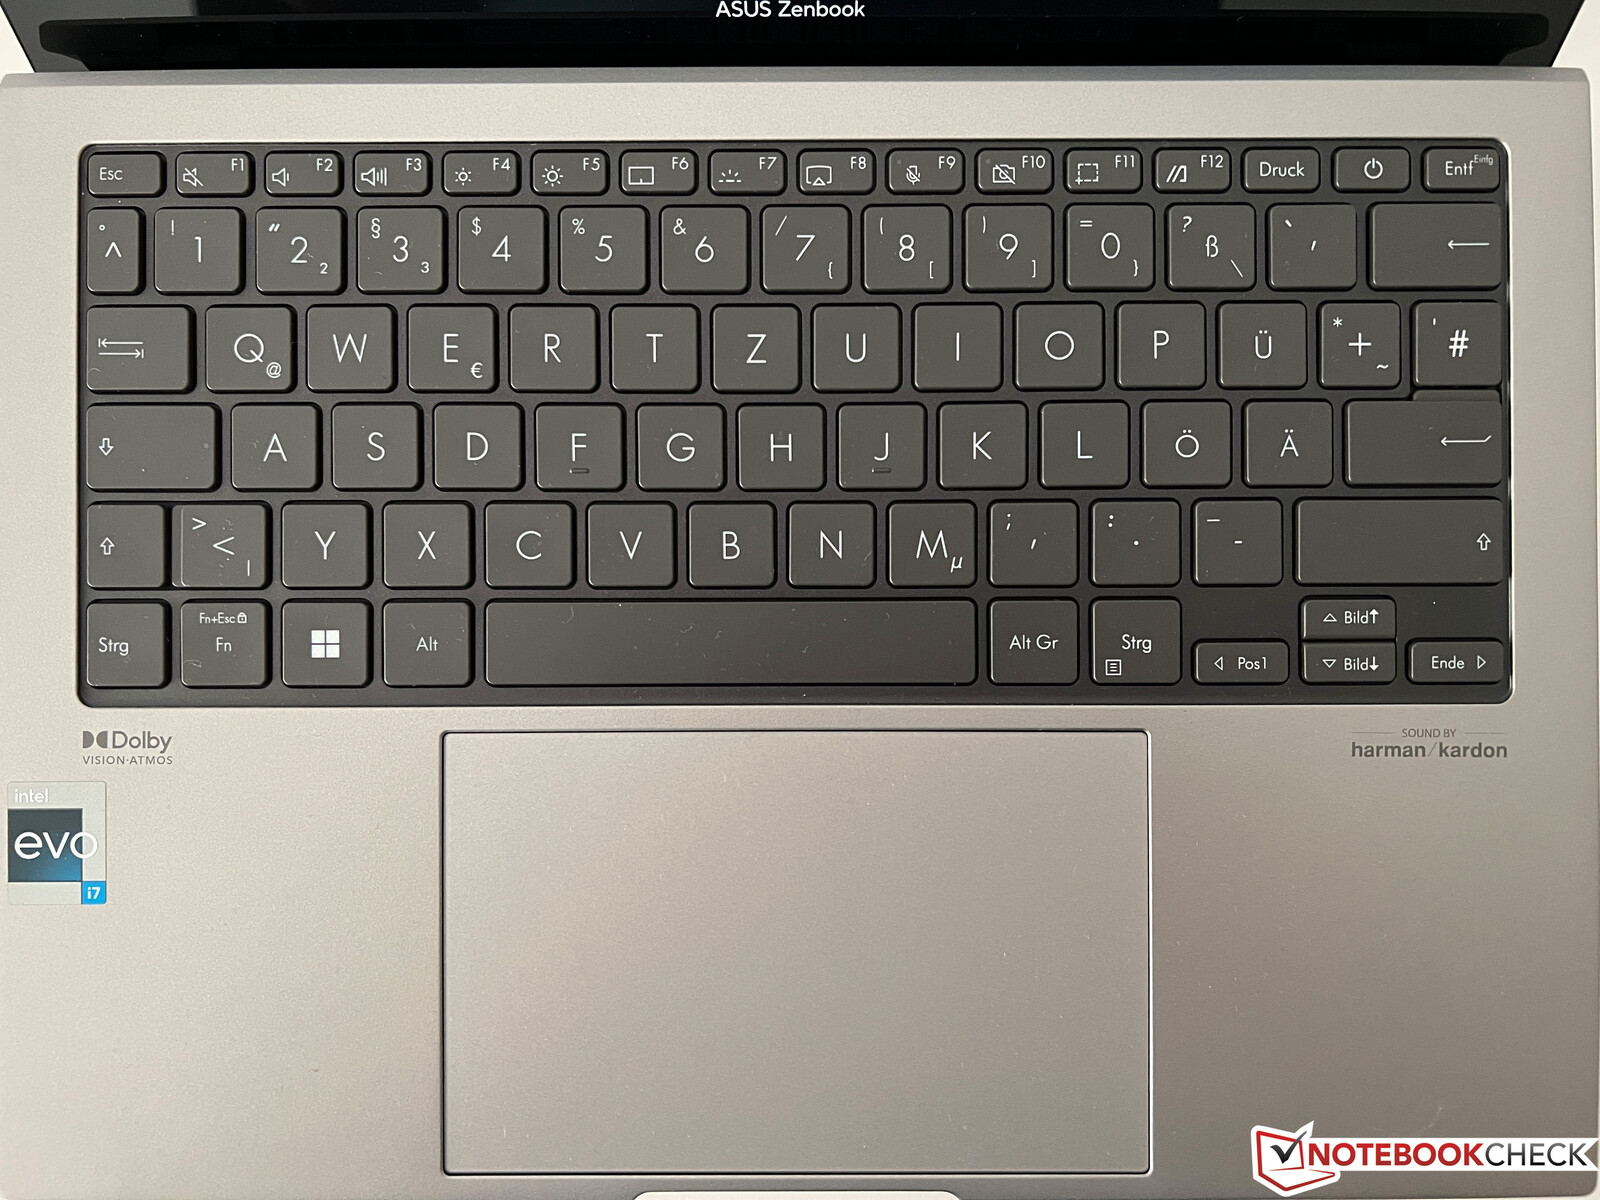
Dispositivo de entrada - Zenbook agora com um pressionamento de tecla mais curto
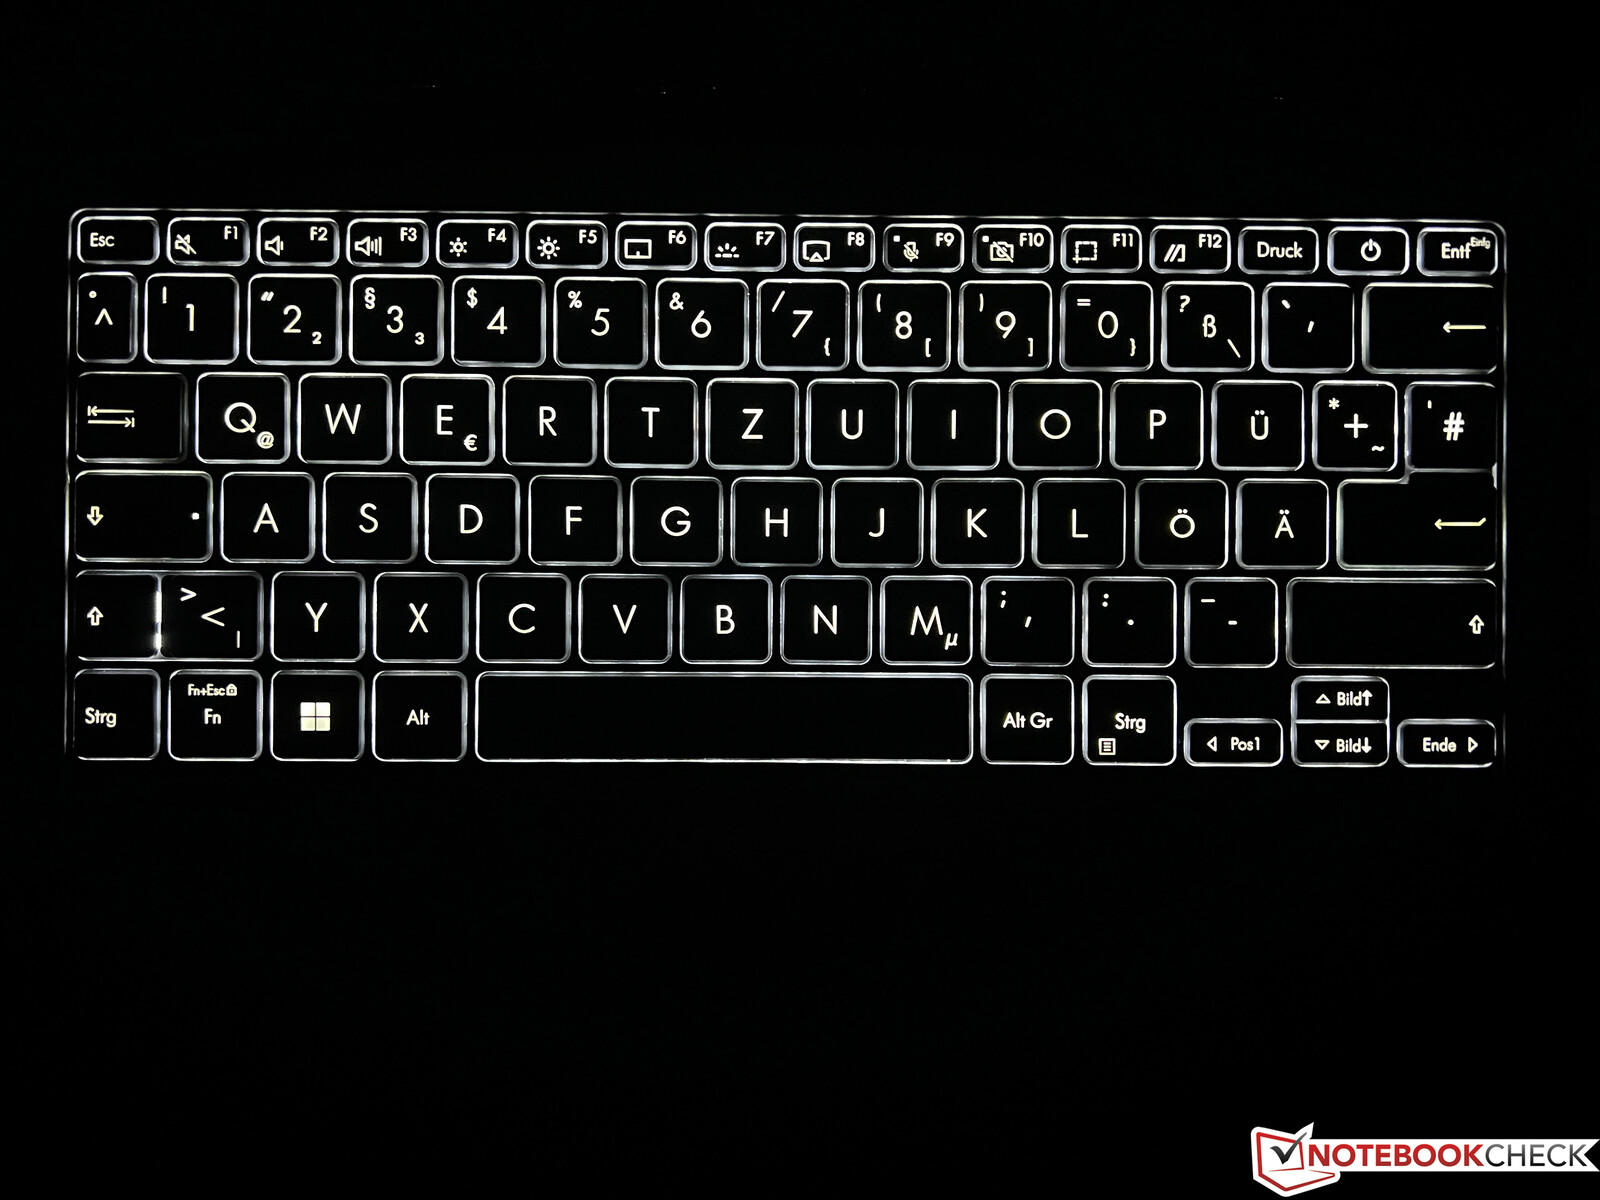
Para um gabinete mais fino, o pressionamento de teclas geralmente precisa ser reduzido, e esse também é o caso do Zenbook S 13. Embora ainda tivesse 1,4 mm (~0,055 pol.) no antecessor, agora tem apenas 1,1 mm (~0,043), o que também é perceptível. O feedback continua sendo muito nítido e não é de forma alguma um teclado ruim, mas a experiência de digitação foi simplesmente um pouco mais confortável com o antecessor. O sensor de impressão digital no botão liga/desliga foi simplesmente removido sem qualquer substituição. A iluminação branca de três etapas do teclado não pode ser ativada automaticamente por meio do sensor de brilho.
O grande ClickPad (13 x 8,1 cm, ~5,1 x 3,2 pol.) oferece espaço suficiente para movimentos do cursor e gestos de até quatro dedos. As características de deslizamento são muito boas e o controle regular do cursor funciona sem problemas. A área inferior do ClickPad pode ser pressionada para baixo, o que é acompanhado por alguns ruídos altos de cliques. No modelo anterior, o touchpad também podia ser usado como um bloco numérico, mas esse recurso foi removido da versão atual.
Tela - OLED com escurecimento DC
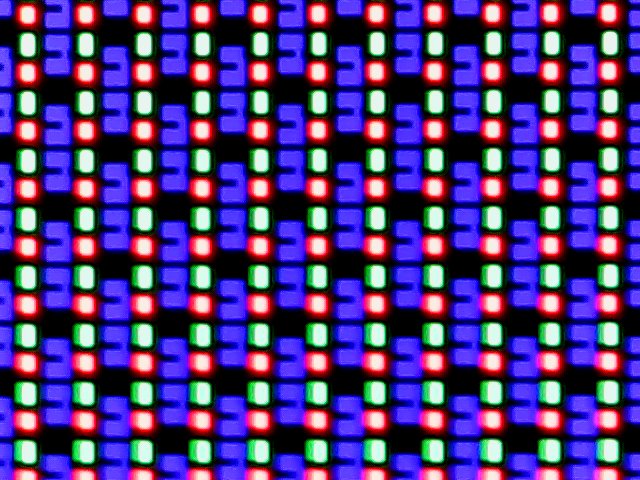
A Asus mantém as especificações da tela do Zenbook S 13 sem nenhuma alteração, pois continua a usar uma tela sensível ao toque OLED de 13,3 polegadas com uma taxa de atualização de 60 Hz. A resolução é de 2.880 x 1.800 pixels, e a qualidade subjetiva da imagem continua sendo excelente. Além disso, não há efeito de brilho (efeito Moiré) como nos painéis OLED de 2,8K de alguns modelos da Lenovo. A ID do painel é nova e, de acordo com a Asus, esse é um painel um pouco mais fino.
No que diz respeito ao brilho, continuamos a ter que distinguir entre conteúdo SDR regular e HDR. Na operação SDR, o brilho máximo é de ~360 cd/m² com a excelente distribuição de brilho típica do OLED. Ao mesmo tempo, o valor de preto é 0, causando uma taxa de contraste extremamente alta. Na operação HDR, medimos um máximo de 589 cd/m², que é um pouco maior do que a especificação de 550 cd/m². Desde o ano passado, nada mudou na implementação ruim do HDR do Windows. O HDR precisa ser ativado manualmente, e nenhum perfil de cor estará mais disponível. Não há sangramento de tela em telas OLED, e uma imagem preta é simplesmente completamente preta.
| |||||||||||||||||||||||||
iluminação: 98 %
iluminação com acumulador: 361 cd/m²
Contraste: ∞:1 (Preto: 0 cd/m²)
ΔE ColorChecker Calman: 1.2 | ∀{0.5-29.43 Ø4.71}
ΔE Greyscale Calman: 1.2 | ∀{0.09-98 Ø4.96}
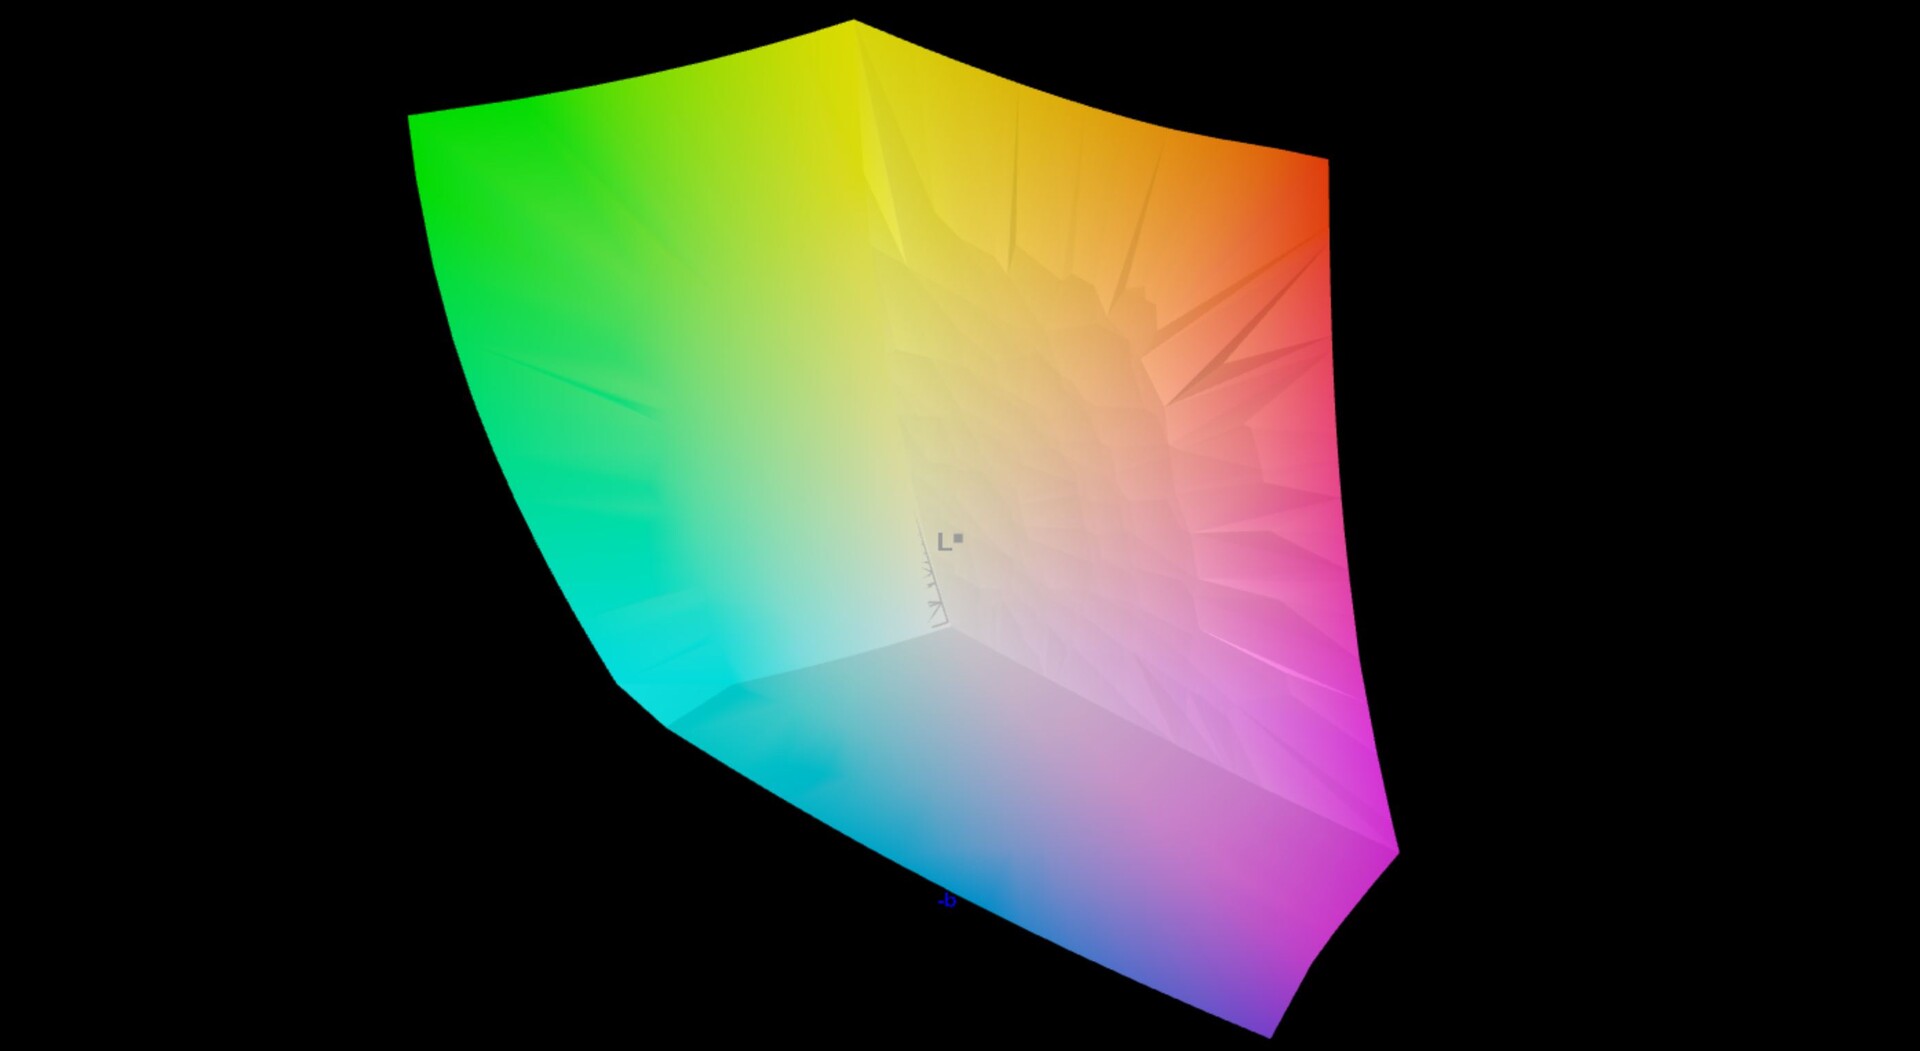
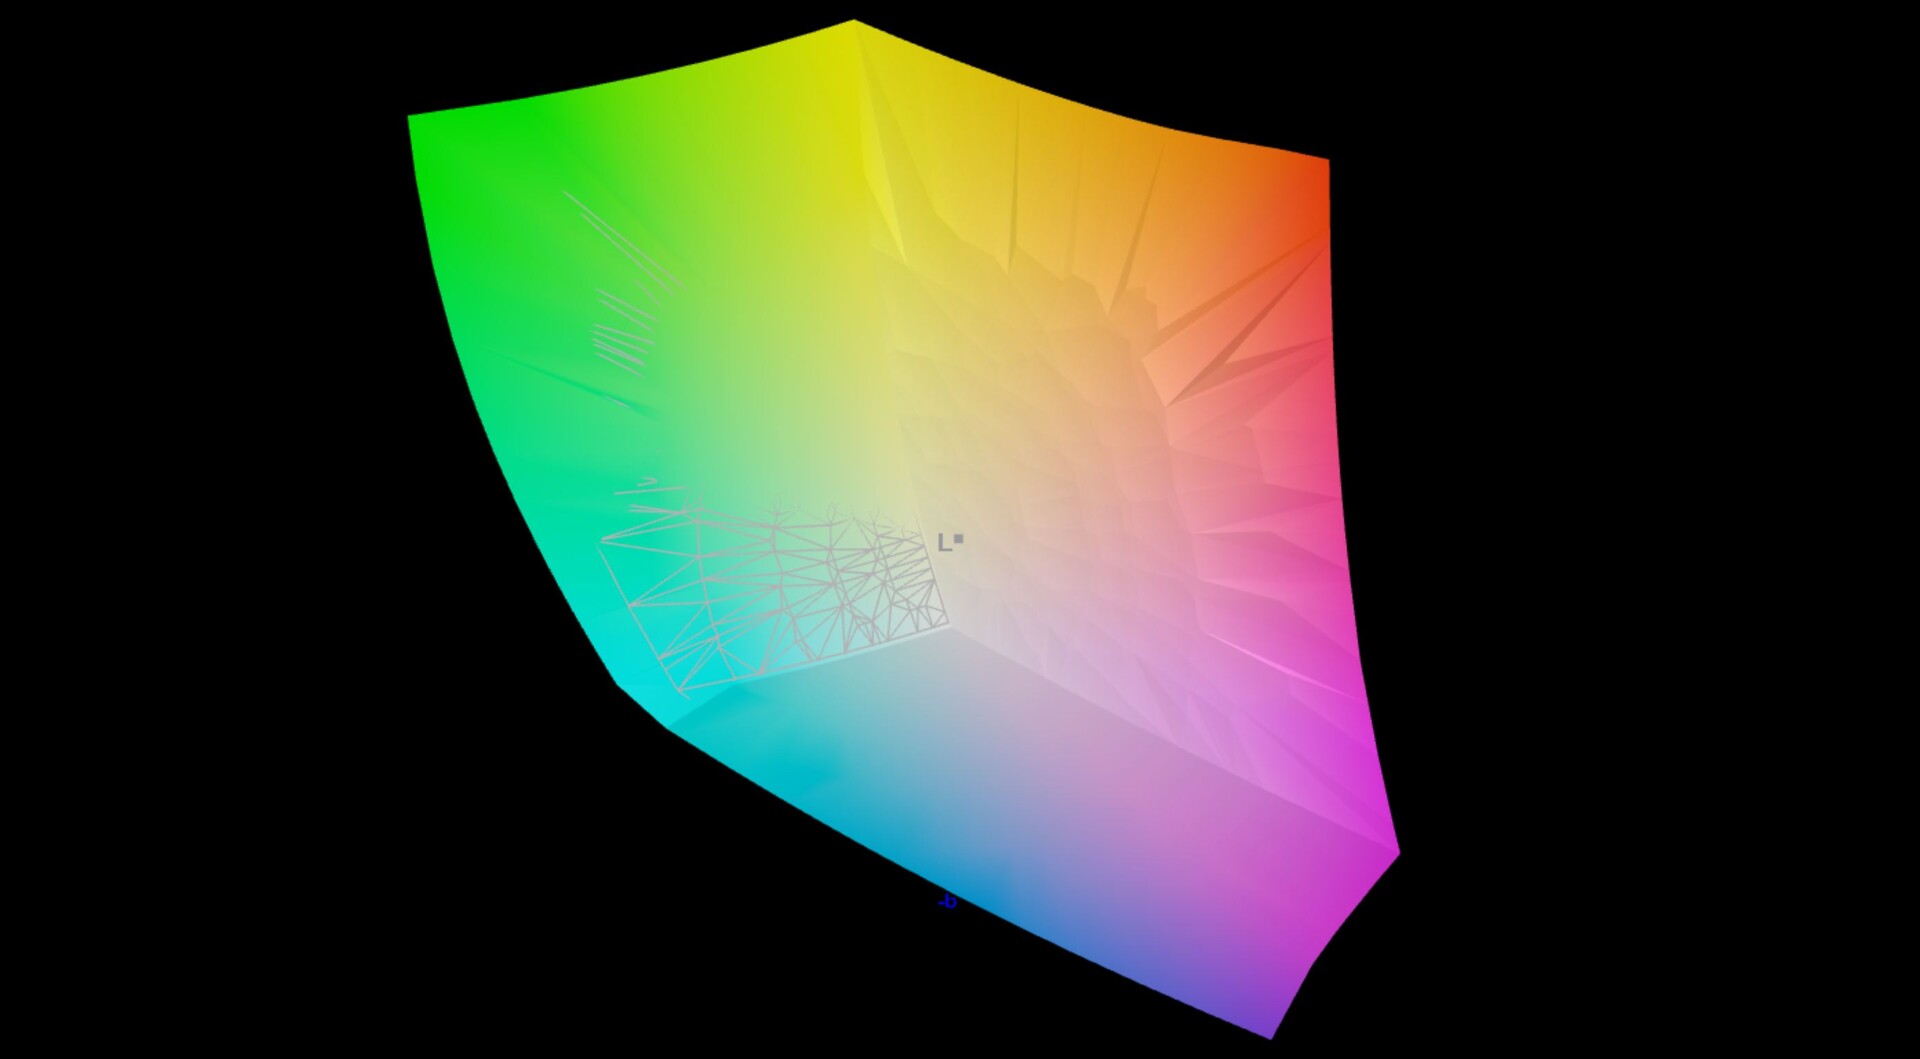
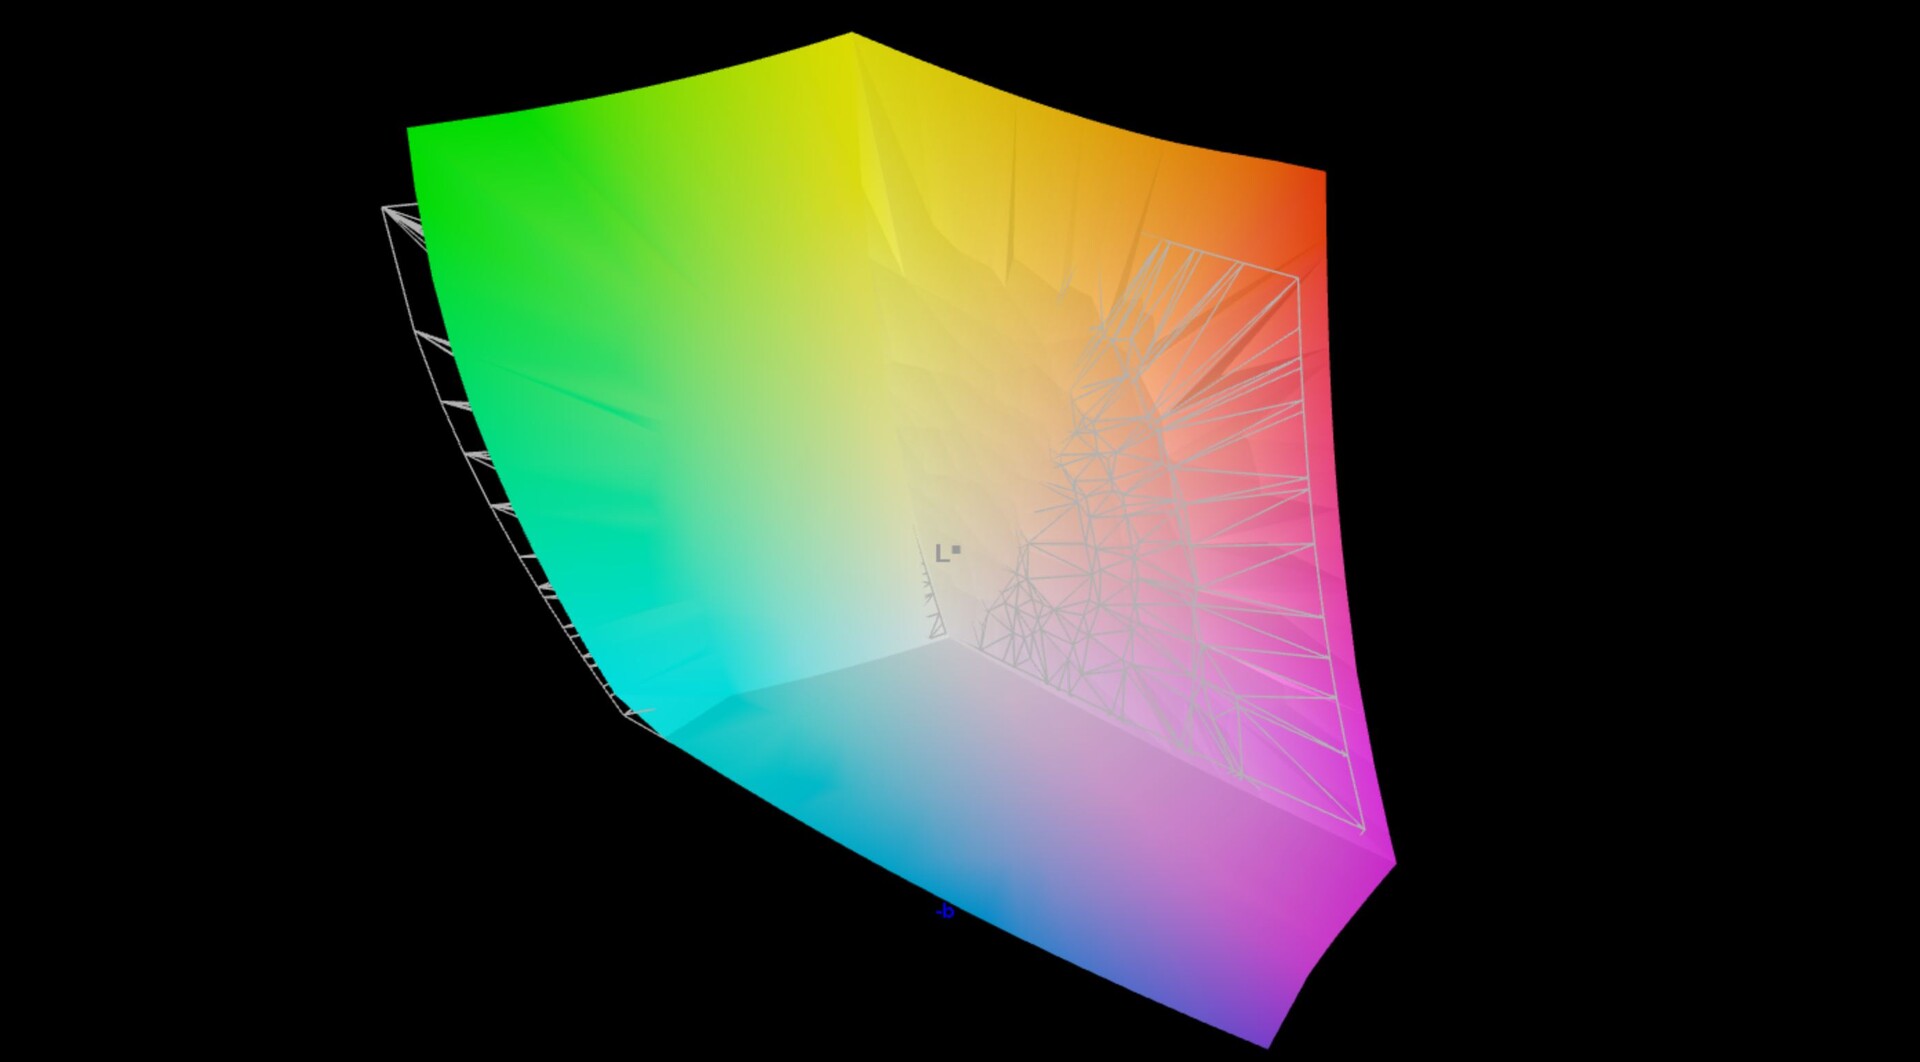
96.9% AdobeRGB 1998 (Argyll 3D)
100% sRGB (Argyll 3D)
99.7% Display P3 (Argyll 3D)
Gamma: 2.27
CCT: 6486 K
| Asus ZenBook S13 OLED UX5304 SDC417B, OLED, 2880x1800, 13.3" | Asus Zenbook S 13 OLED SDC4172, OLED, 2880x1800, 13.3" | Apple MacBook Air M2 Entry IPS, 2560x1664, 13.6" | Lenovo Yoga Slim 7 Carbon 13IAP7-82U9005FGE MND307DA1-9, IPS, 2560x1600, 13.3" | Dell XPS 13 Plus 9320 i7-1280P OLED Samsung 134XK04, OLED, 3456x2160, 13.4" | Samsung Galaxy Book2 Pro 13 NP930XED-KA1DE ATNA33XC10-0, OLED, 1920x1080, 13.3" | |
|---|---|---|---|---|---|---|
| Display | 0% | -4% | -21% | 1% | -0% | |
| Display P3 Coverage (%) | 99.7 | 99.8 0% | 98.4 -1% | 67.3 -32% | 99.5 0% | 99.81 0% |
| sRGB Coverage (%) | 100 | 100 0% | 99.9 0% | 98.9 -1% | 100 0% | 100 0% |
| AdobeRGB 1998 Coverage (%) | 96.9 | 97.8 1% | 87.6 -10% | 69.1 -29% | 98.4 2% | 95.55 -1% |
| Response Times | -5% | -1501% | -1310% | -31% | -63% | |
| Response Time Grey 50% / Grey 80% * (ms) | 2 ? | 2.1 ? -5% | 32.9 ? -1545% | 34 ? -1600% | 2.6 ? -30% | 4 ? -100% |
| Response Time Black / White * (ms) | 1.6 ? | 1.68 ? -5% | 24.9 ? -1456% | 17.9 ? -1019% | 2.1 ? -31% | 2 ? -25% |
| PWM Frequency (Hz) | 240 ? | 240.4 ? | 59.5 | 61 ? | ||
| Screen | -23% | -8% | -9% | -64% | -22% | |
| Brightness middle (cd/m²) | 361 | 336 -7% | 526 46% | 391 8% | 371.8 3% | 399 11% |
| Brightness (cd/m²) | 365 | 338 -7% | 486 33% | 362 -1% | 374 2% | 403 10% |
| Brightness Distribution (%) | 98 | 99 1% | 87 -11% | 87 -11% | 98 0% | 98 0% |
| Black Level * (cd/m²) | 0.02 | 0.38 | 0.26 | 0.07 | ||
| Colorchecker dE 2000 * | 1.2 | 1.8 -50% | 1.3 -8% | 1 17% | 2.37 -98% | 1.35 -13% |
| Colorchecker dE 2000 max. * | 1.9 | 3.8 -100% | 2.7 -42% | 2.4 -26% | 6.1 -221% | 2.77 -46% |
| Greyscale dE 2000 * | 1.2 | 0.9 25% | 2 -67% | 1.7 -42% | 2 -67% | 2.35 -96% |
| Gamma | 2.27 97% | 2.22 99% | 2.25 98% | 2.22 99% | 2.29 96% | 2.21 100% |
| CCT | 6486 100% | 6580 99% | 6858 95% | 6808 95% | 6261 104% | 6824 95% |
| Contrast (:1) | 16800 | 1384 | 1504 | 5700 | ||
| Colorchecker dE 2000 calibrated * | 1.8 | 0.7 | 1.35 | |||
| Média Total (Programa/Configurações) | -9% /
-13% | -504% /
-278% | -447% /
-249% | -31% /
-40% | -28% /
-24% |
* ... menor é melhor
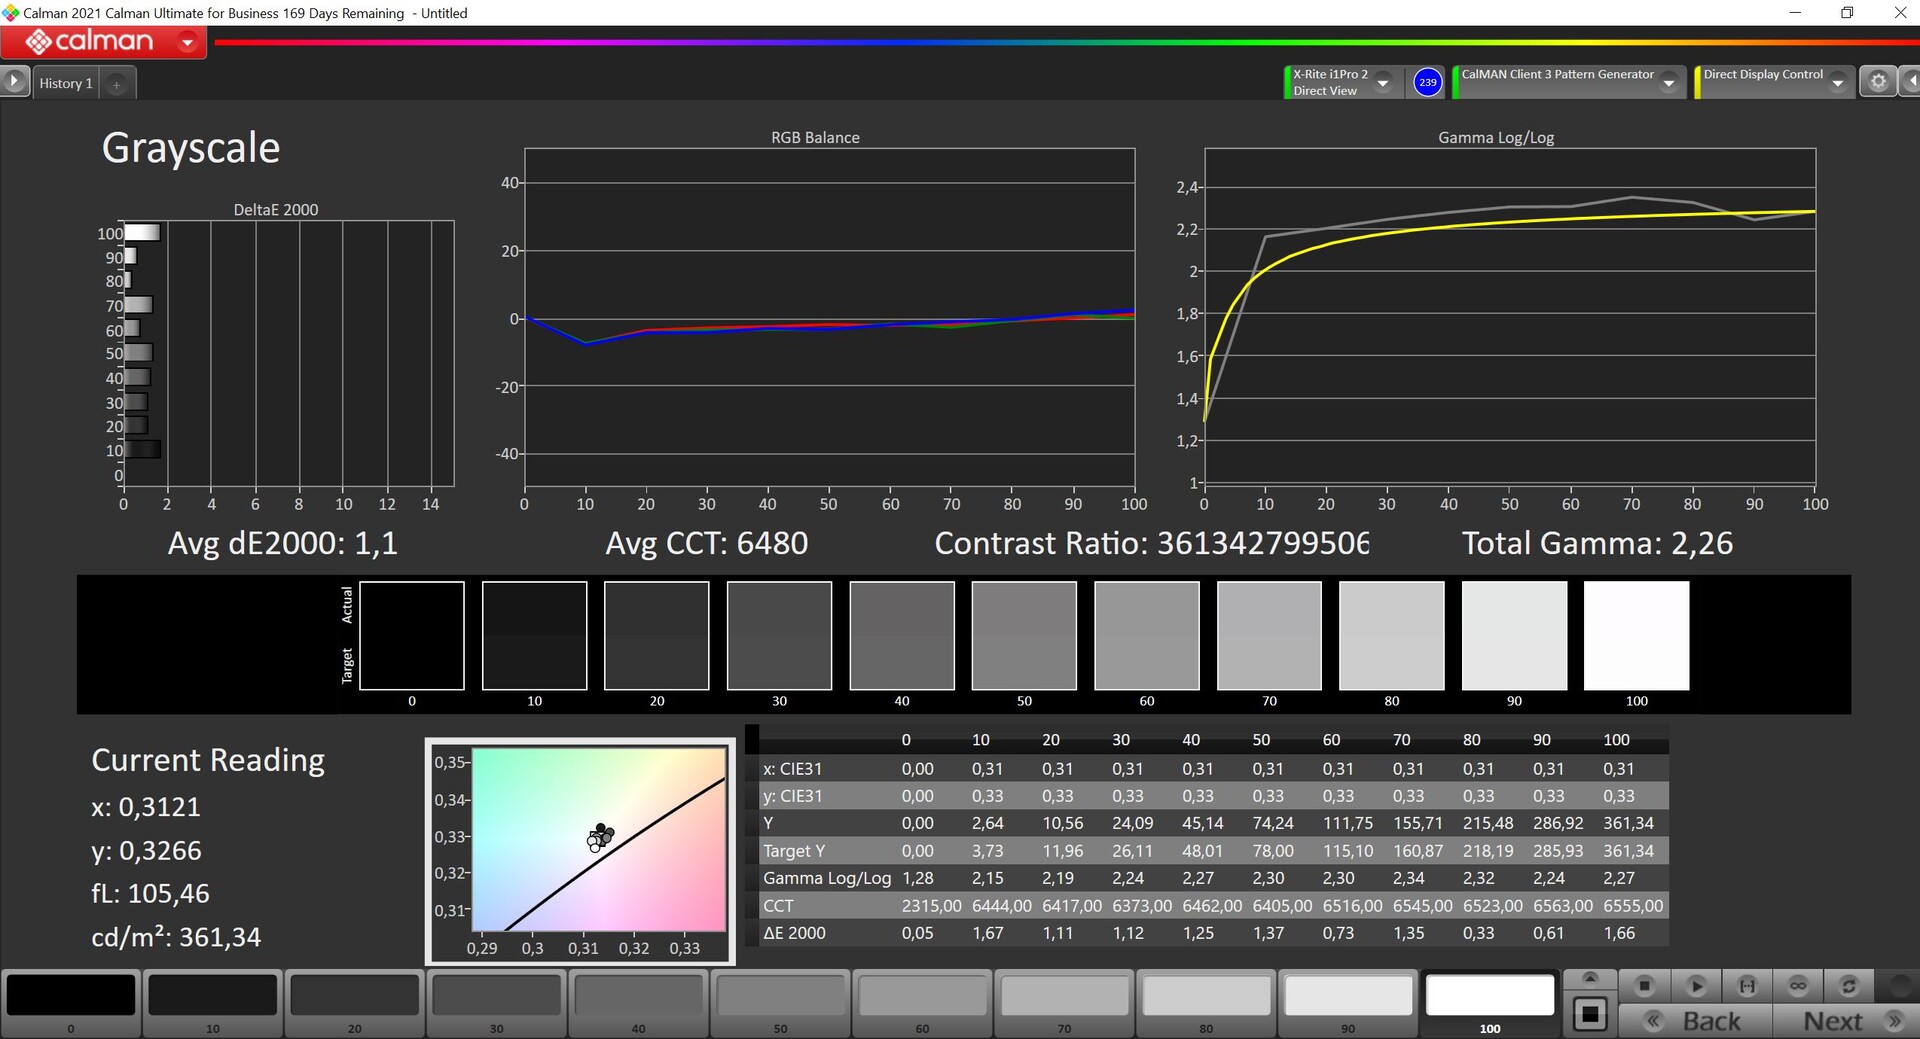
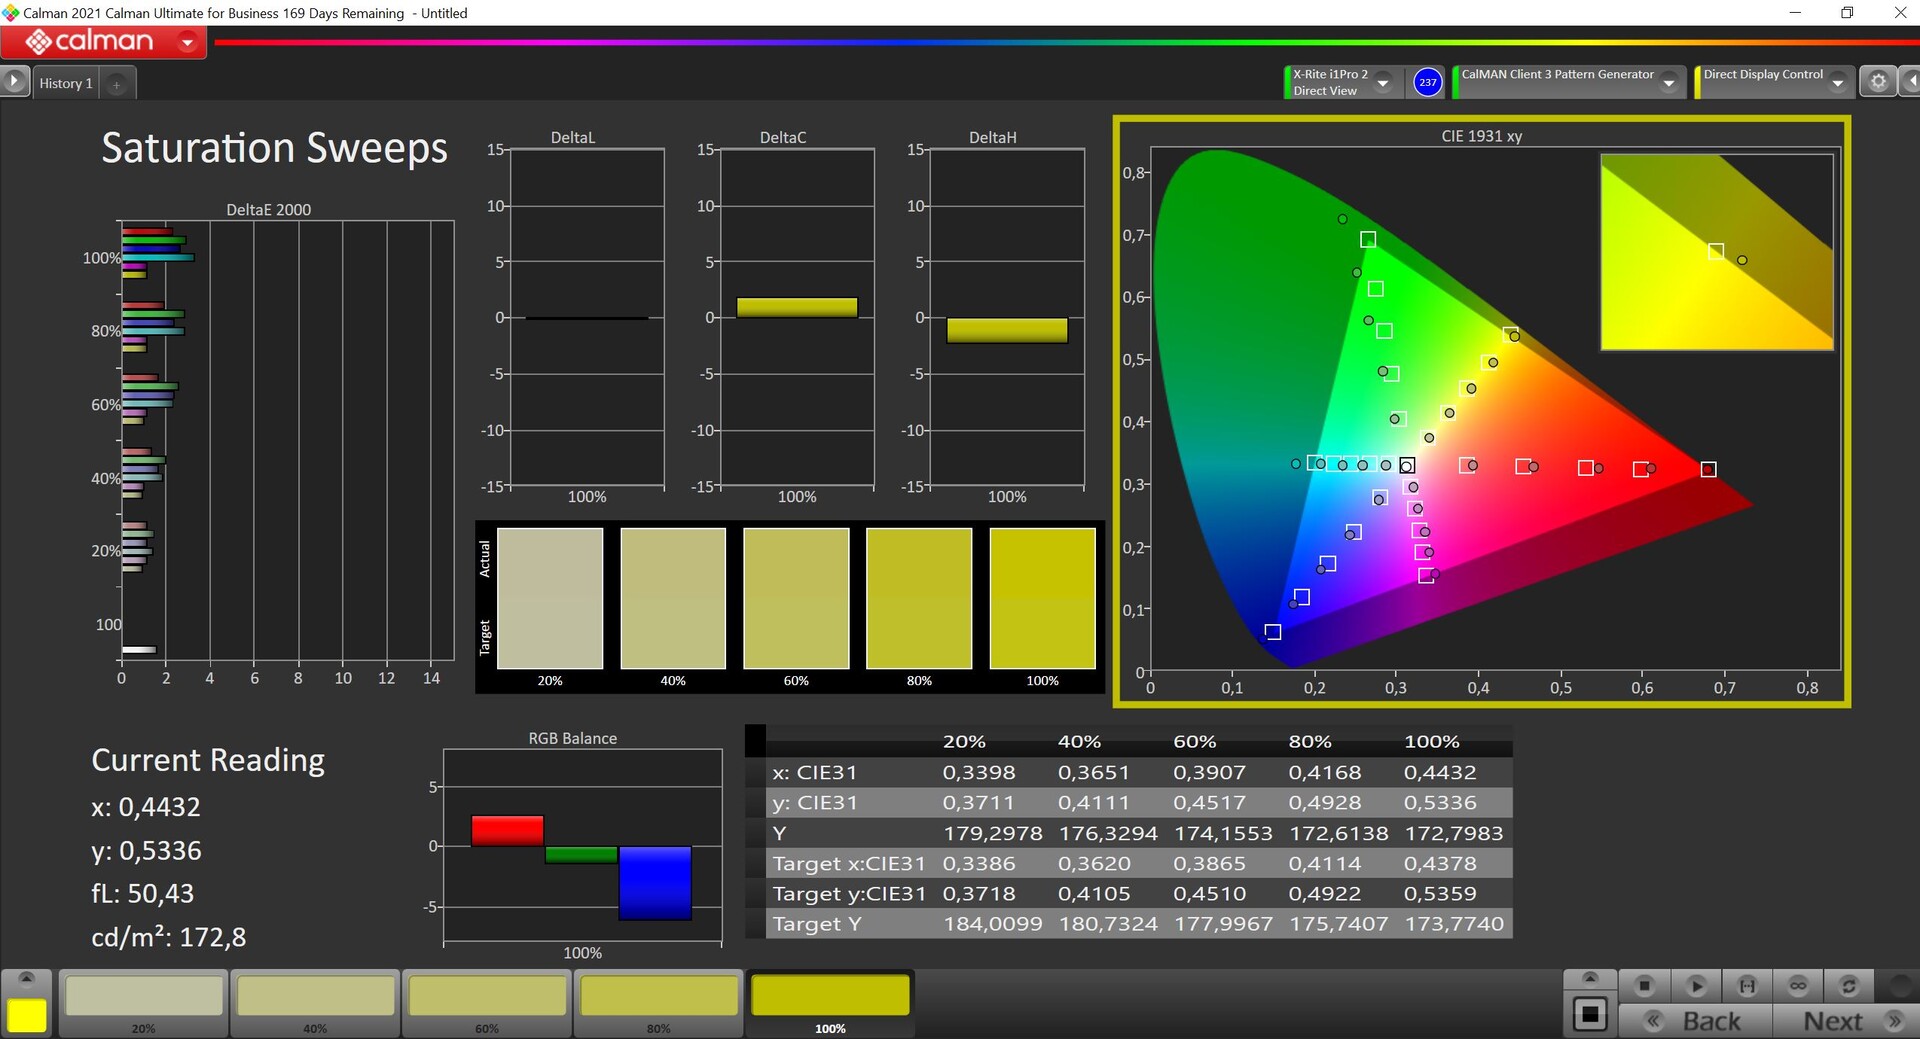
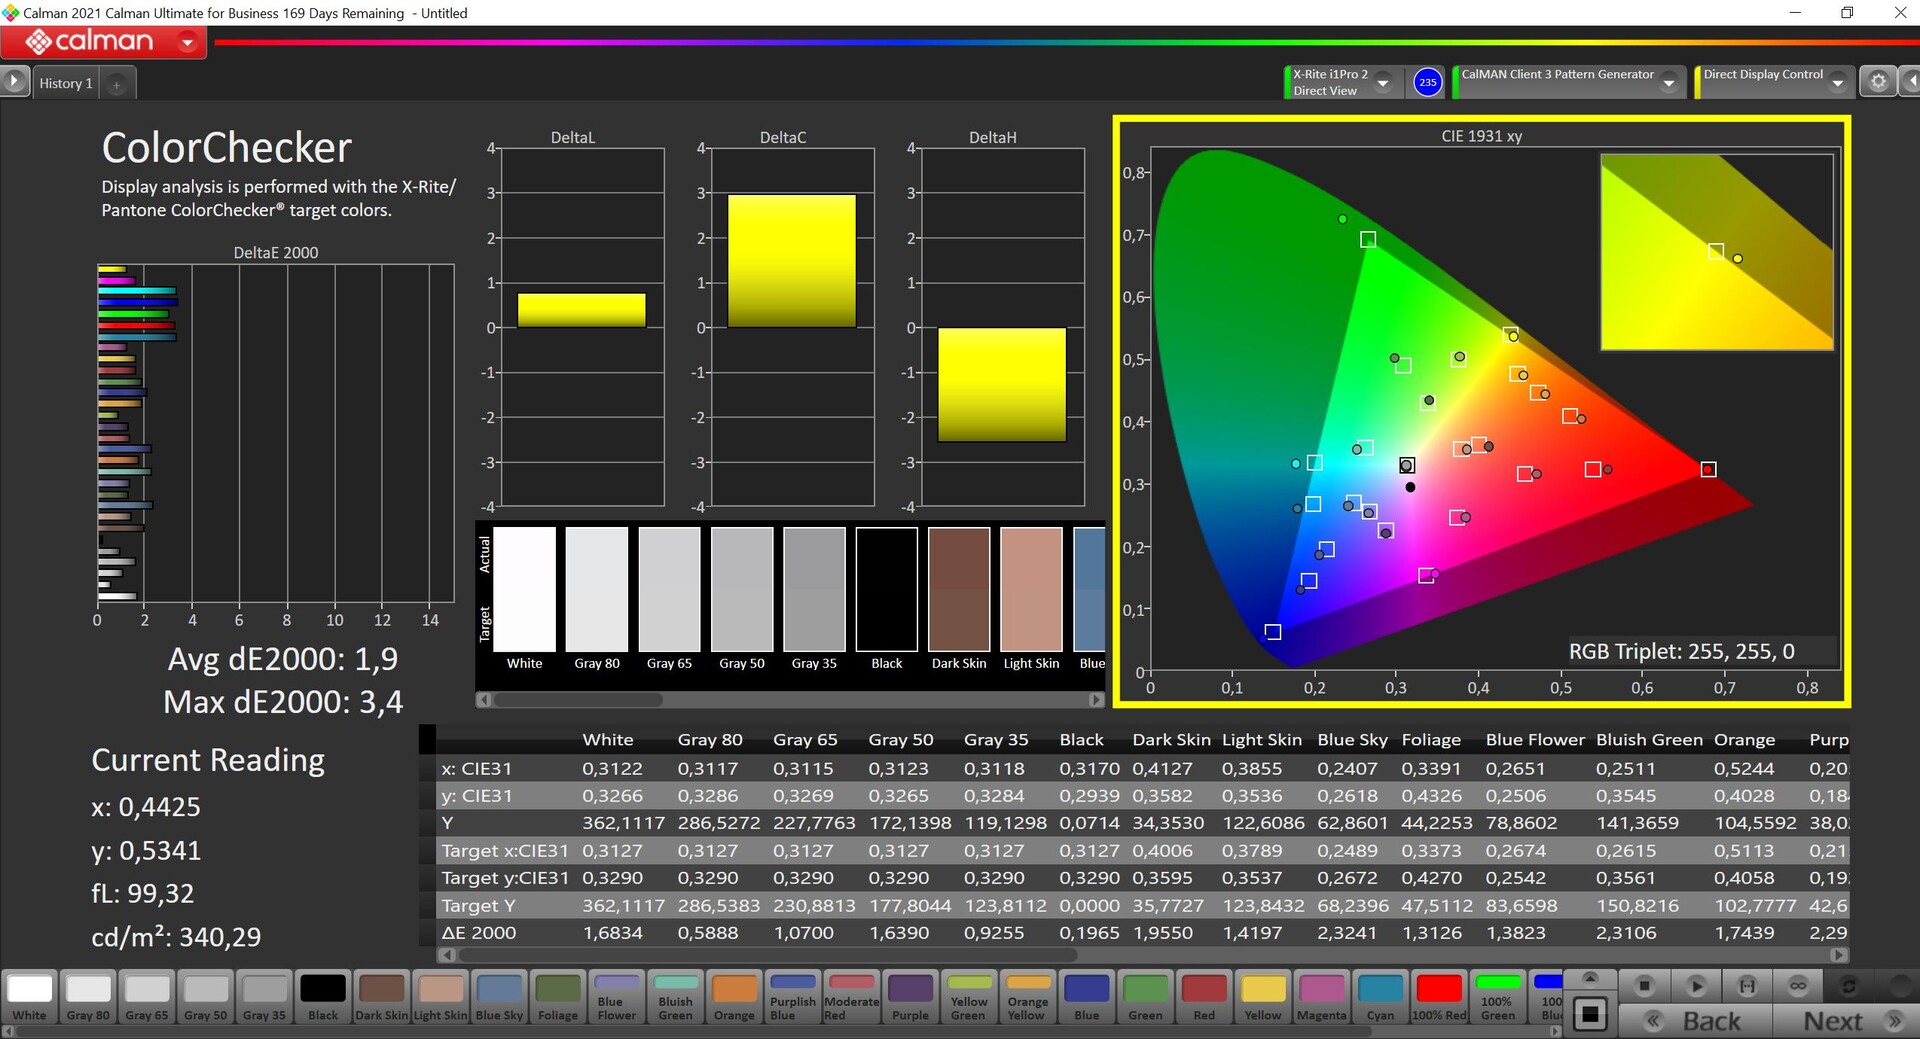

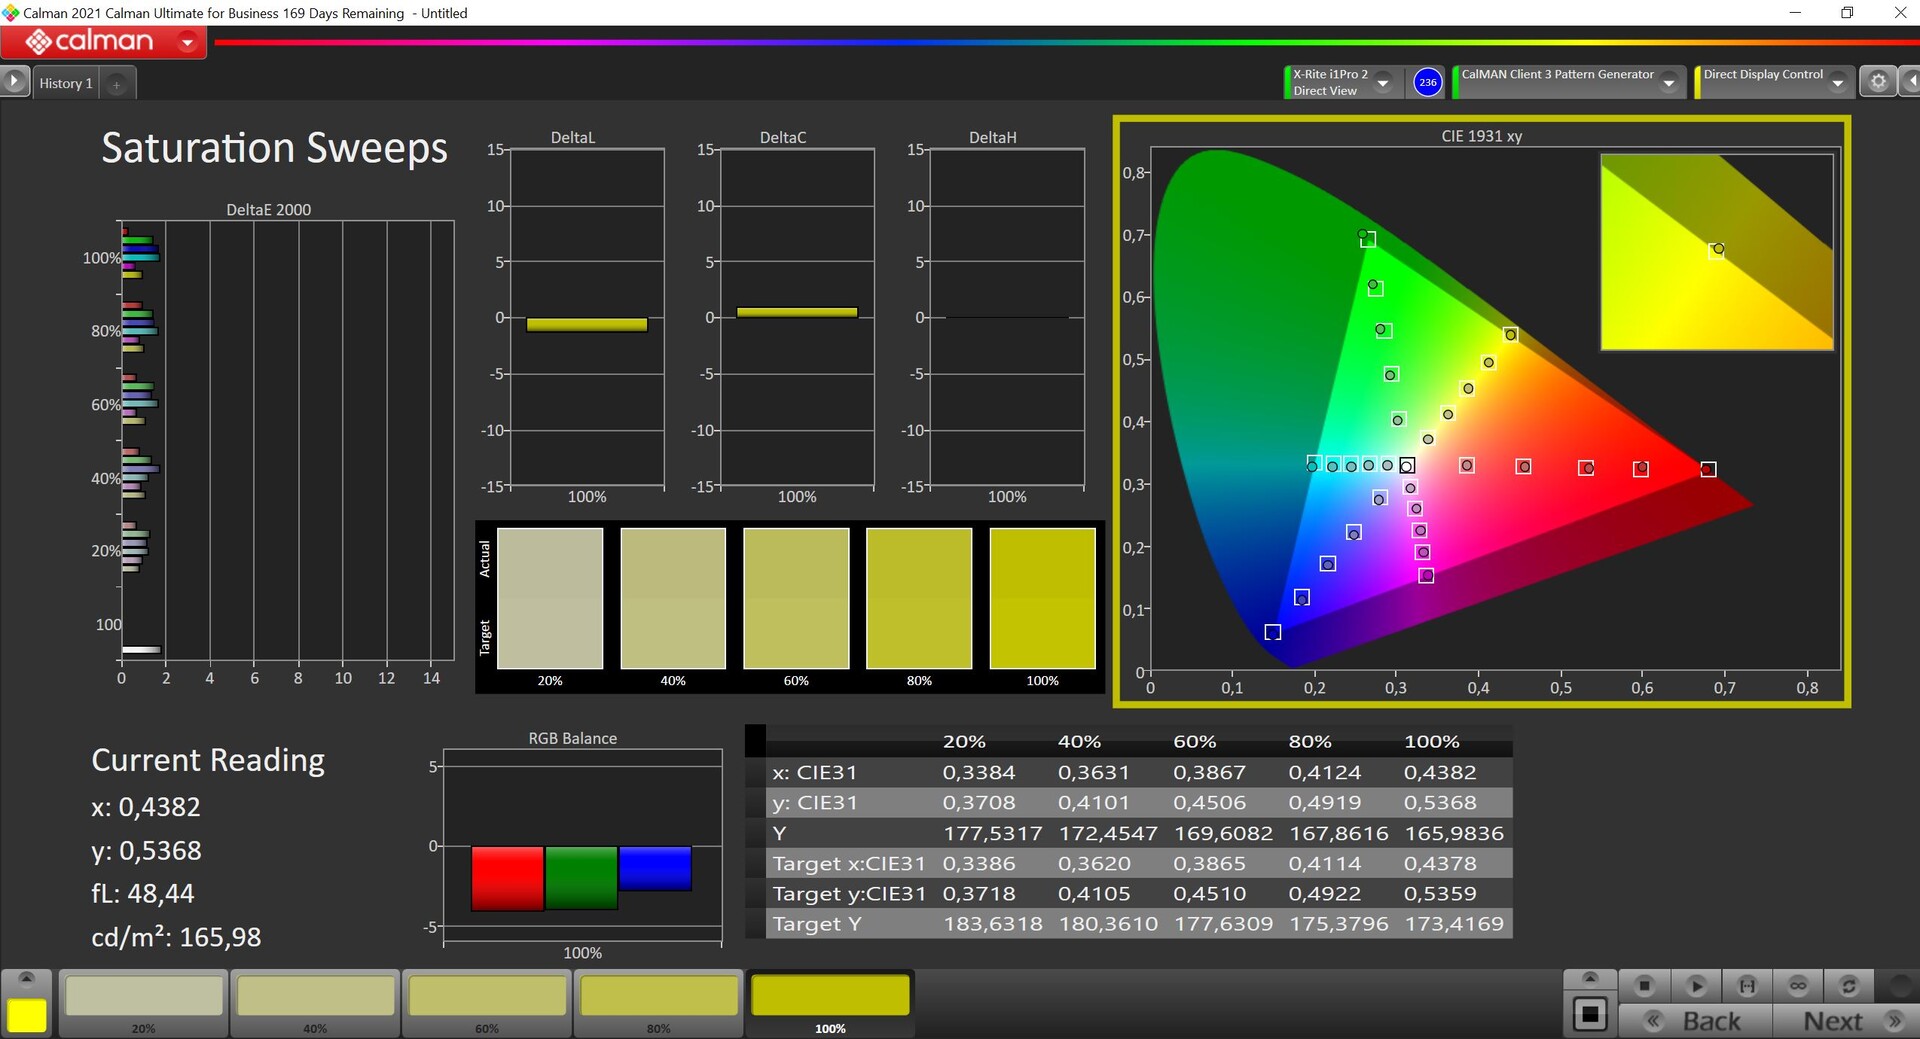
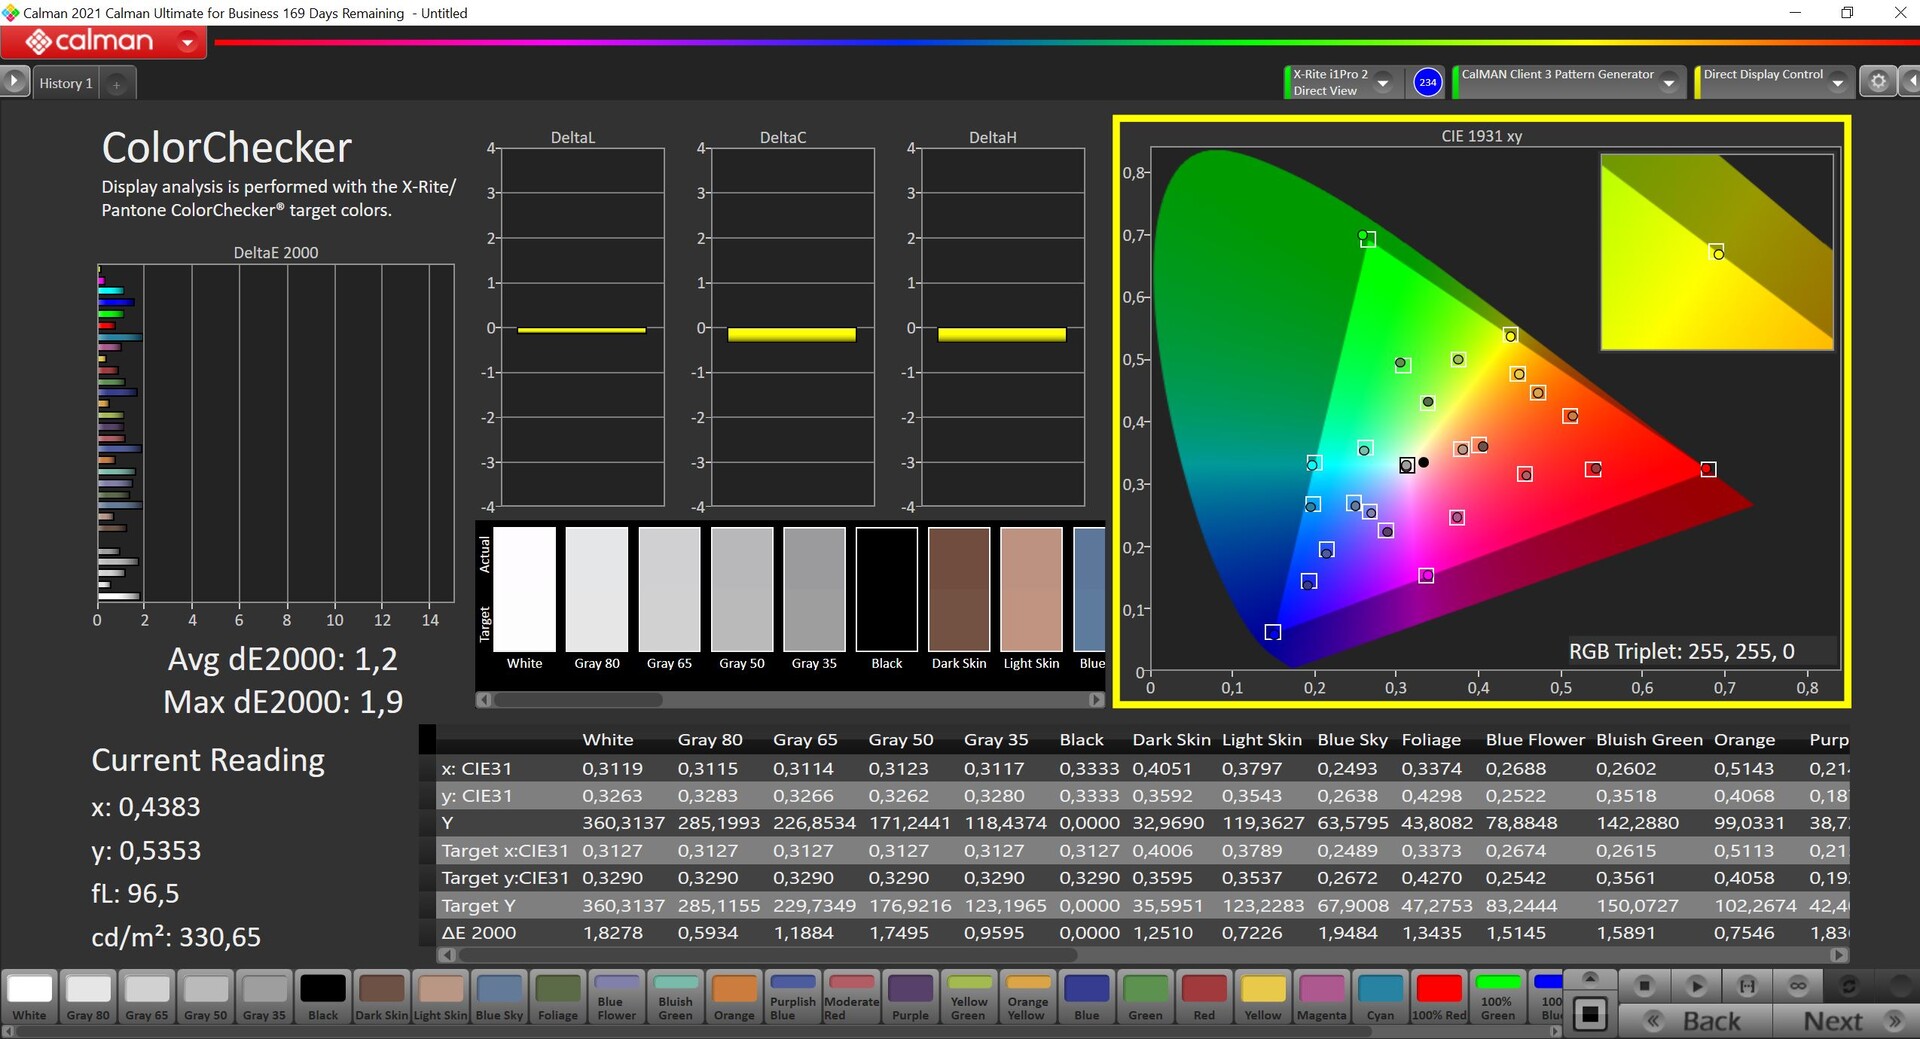

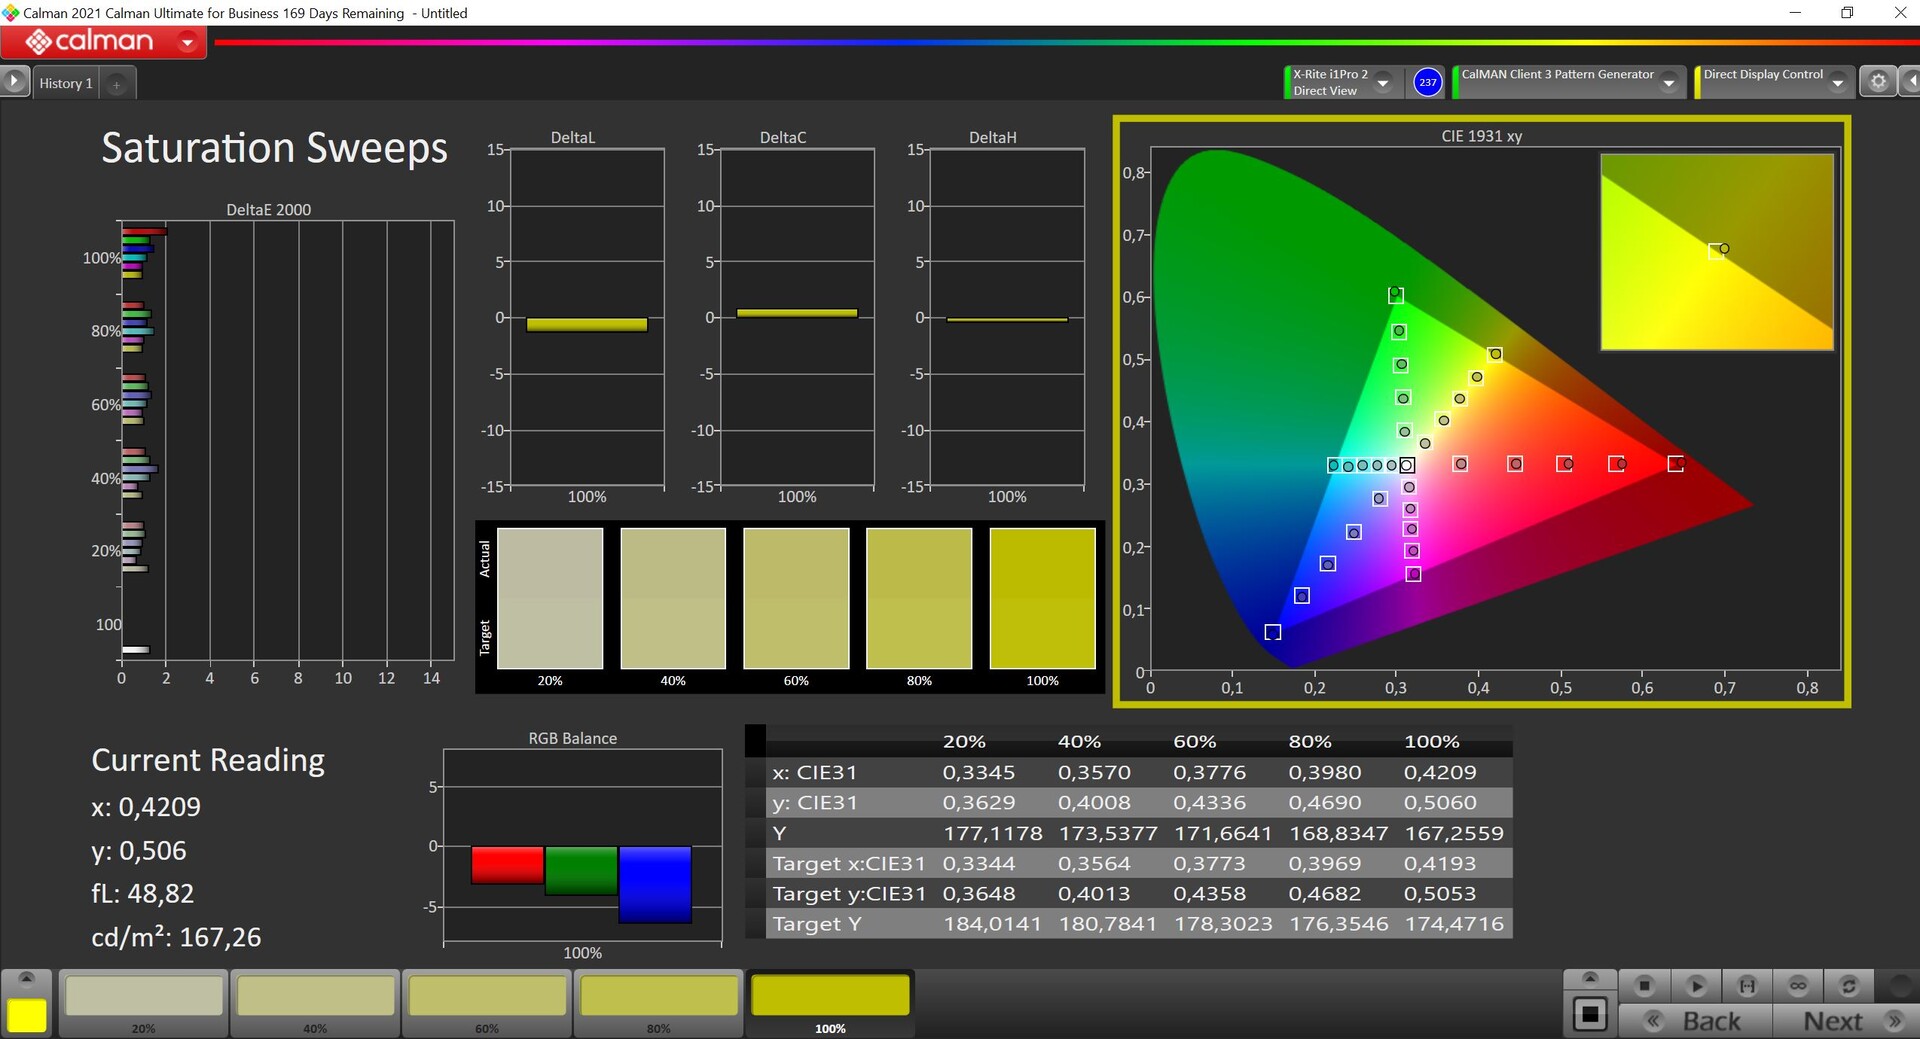
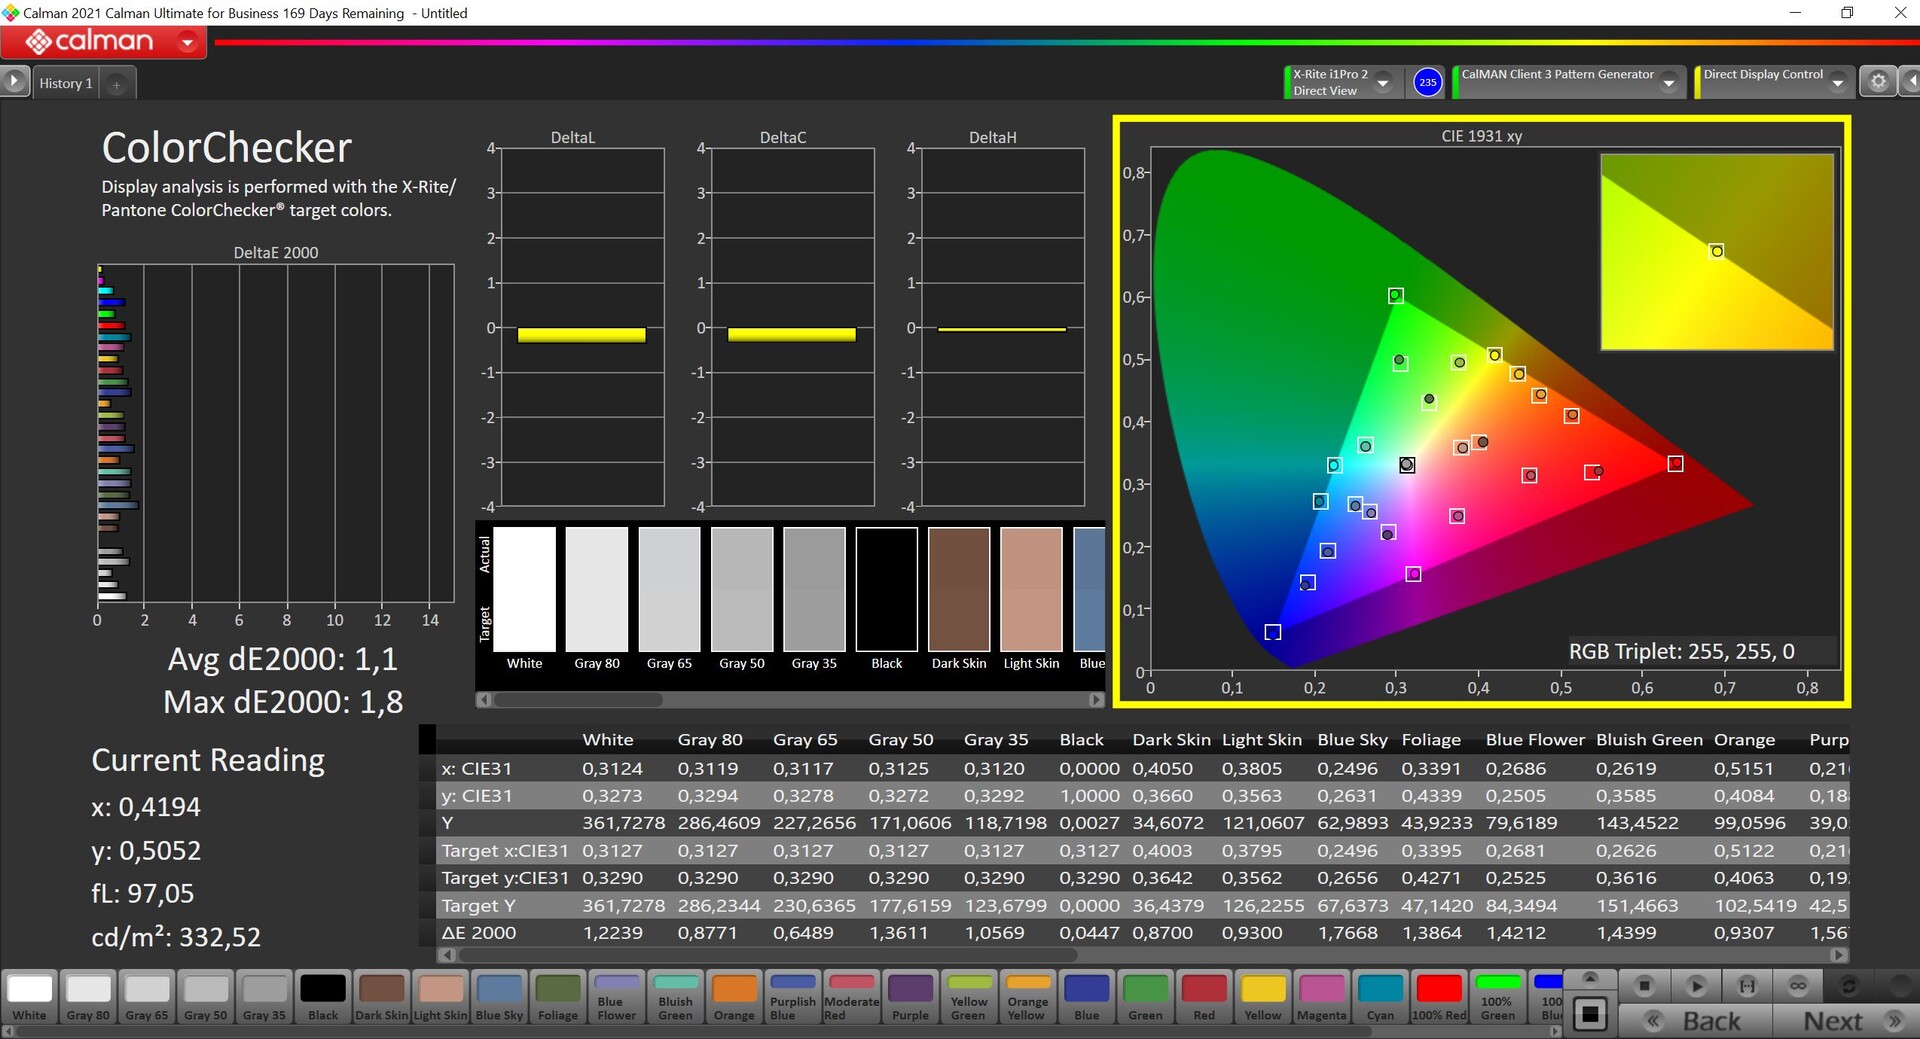
O aplicativo MyAsus pré-instalado oferece vários perfis de cores, que medimos com o software profissional CalMAN. Por padrão, o perfil "Nativo" está ativado, o que reproduz as cores um pouco saturadas demais, fazendo com que a imagem pareça subjetivamente um pouco mais vibrante. Além disso, com o Display-P3 e o sRGB, há também dois perfis extremamente precisos se você quiser trabalhar com imagens nos espaços de cores correspondentes. Esses dois perfis já estão extremamente bem calibrados no estado de entrega, de modo que não foi possível melhorar ainda mais a tela com nossa própria calibração. Juntamente com a cobertura quase completa do espaço de cores P3, esse é um excelente desempenho geral.
Exibir tempos de resposta
| ↔ Tempo de resposta preto para branco | ||
|---|---|---|
| 1.6 ms ... ascensão ↗ e queda ↘ combinadas | ↗ 0.8 ms ascensão | 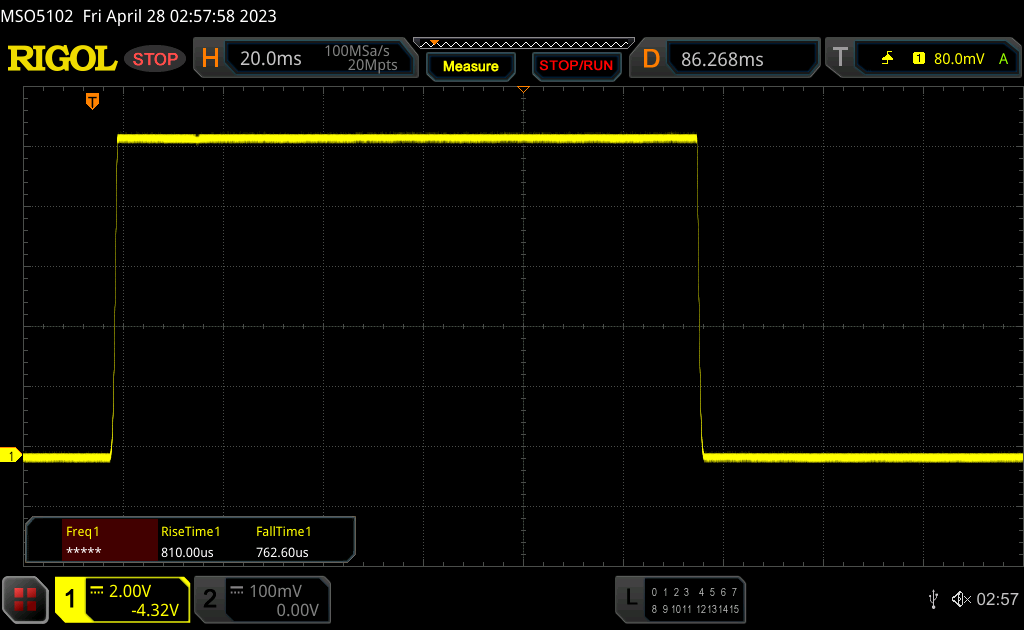 |
| ↘ 0.8 ms queda | ||
| A tela mostra taxas de resposta muito rápidas em nossos testes e deve ser muito adequada para jogos em ritmo acelerado. Em comparação, todos os dispositivos testados variam de 0.1 (mínimo) a 240 (máximo) ms. » 10 % de todos os dispositivos são melhores. Isso significa que o tempo de resposta medido é melhor que a média de todos os dispositivos testados (19.8 ms). | ||
| ↔ Tempo de resposta 50% cinza a 80% cinza | ||
| 2 ms ... ascensão ↗ e queda ↘ combinadas | ↗ 1.1 ms ascensão | 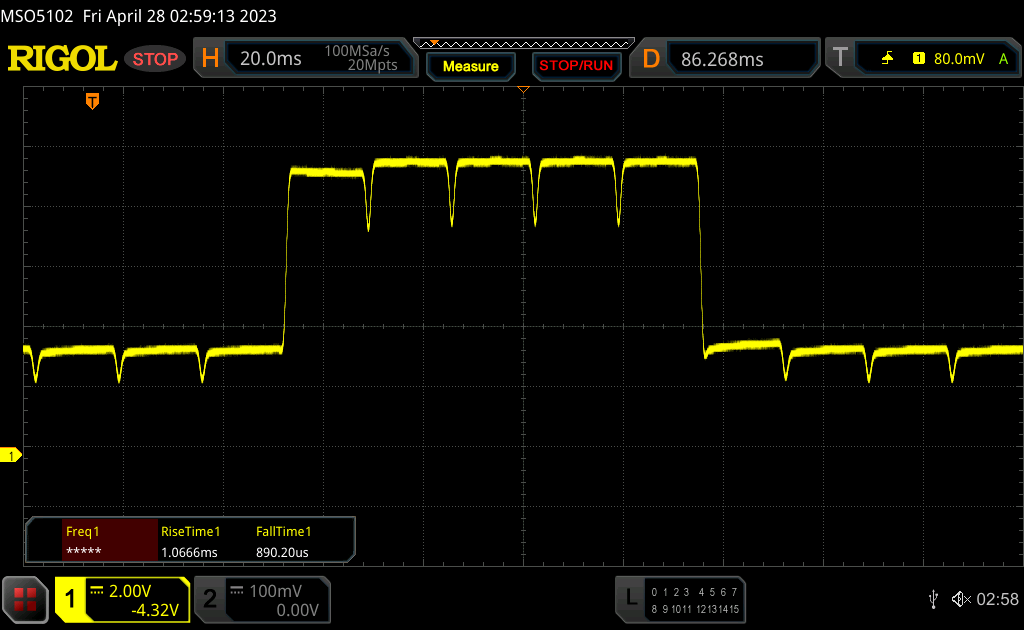 |
| ↘ 0.9 ms queda | ||
| A tela mostra taxas de resposta muito rápidas em nossos testes e deve ser muito adequada para jogos em ritmo acelerado. Em comparação, todos os dispositivos testados variam de 0.165 (mínimo) a 636 (máximo) ms. » 10 % de todos os dispositivos são melhores. Isso significa que o tempo de resposta medido é melhor que a média de todos os dispositivos testados (31 ms). | ||
Cintilação da tela / PWM (modulação por largura de pulso)
| Tela tremeluzindo/PWM detectado | 240 Hz | ≤ 57 % configuração de brilho | 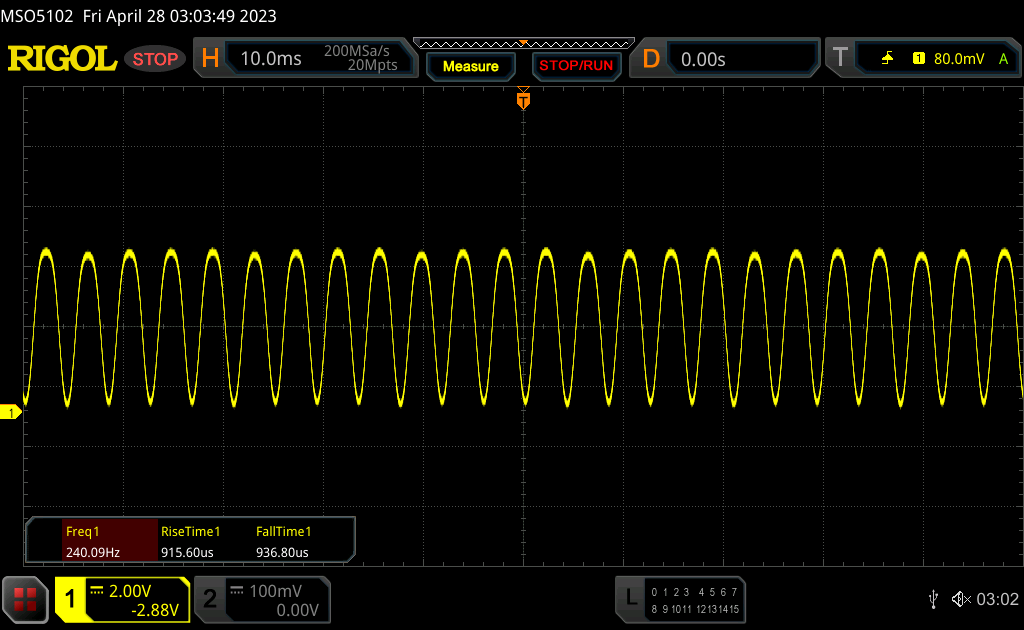 |
| ≤ 88 brilho cd/m² | |||
A luz de fundo da tela pisca em 240 Hz (pior caso, por exemplo, utilizando PWM) Cintilação detectada em uma configuração de brilho de 57 % (88 cd/m²) e abaixo. Não deve haver cintilação ou PWM acima desta configuração de brilho. A frequência de 240 Hz é relativamente baixa, portanto, usuários sensíveis provavelmente notarão cintilação e sentirão fadiga ocular na configuração de brilho indicada e abaixo. A cintilação ocorre em configurações de brilho relativamente baixas, portanto, o uso prolongado nesta configuração de brilho ou inferior pode causar fadiga ocular. [pwm_comparison] Em comparação: 52 % de todos os dispositivos testados não usam PWM para escurecer a tela. Se PWM foi detectado, uma média de 7754 (mínimo: 5 - máximo: 343500) Hz foi medida. | |||
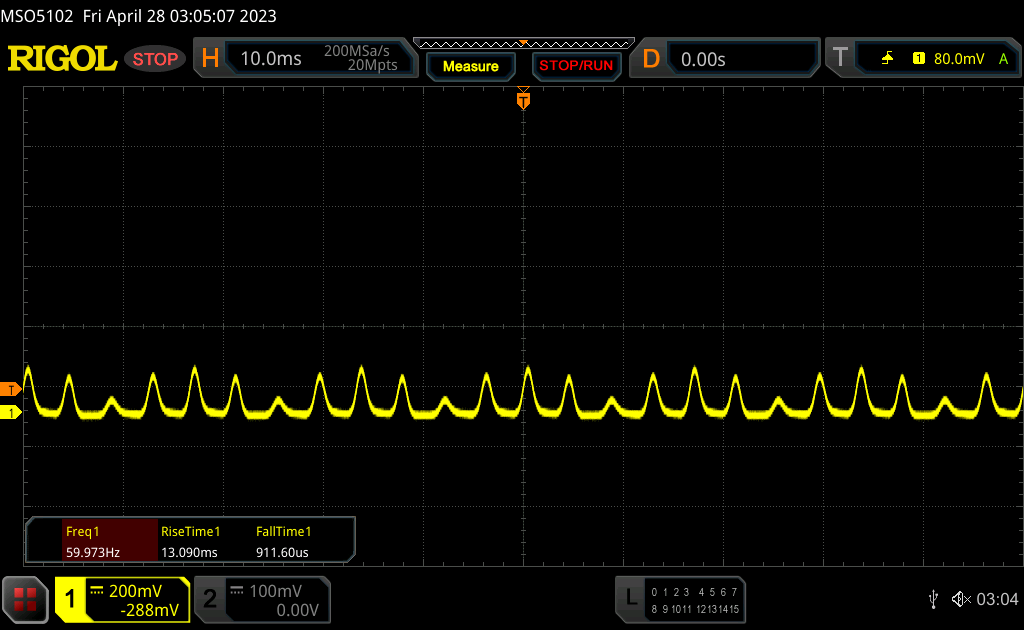
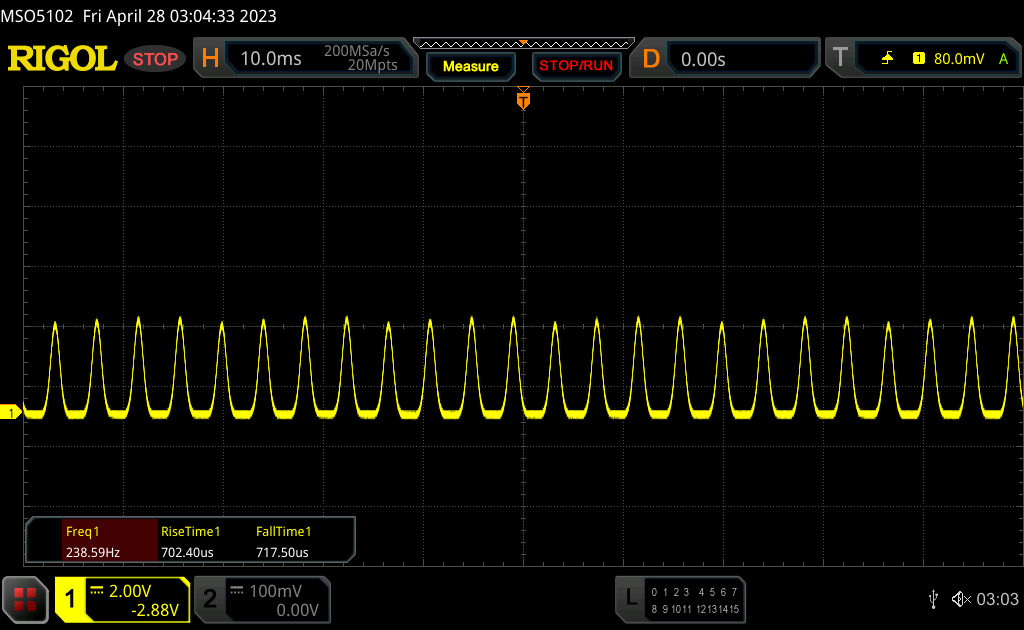
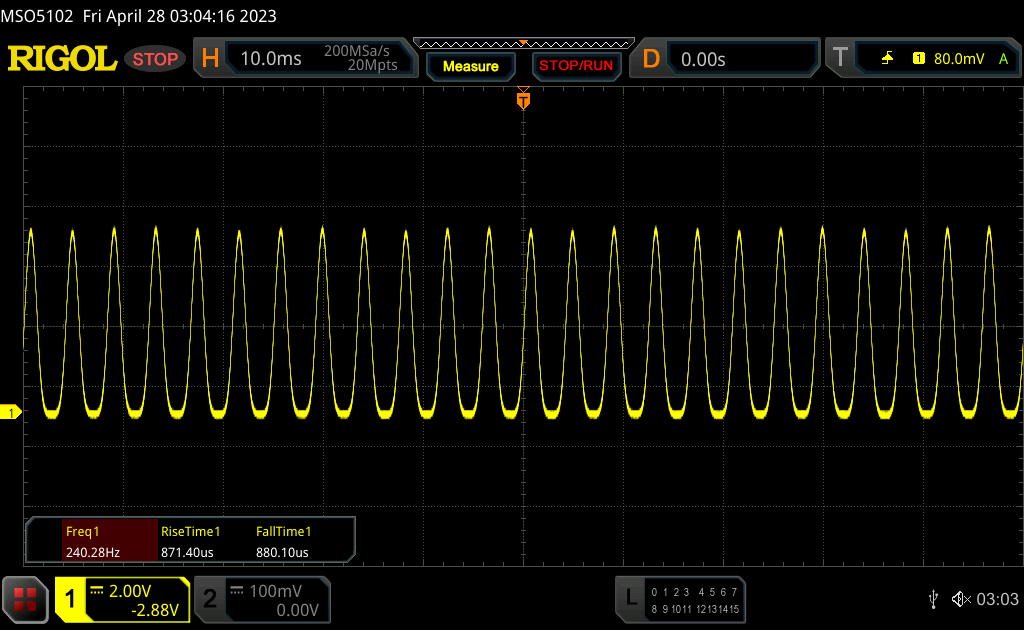
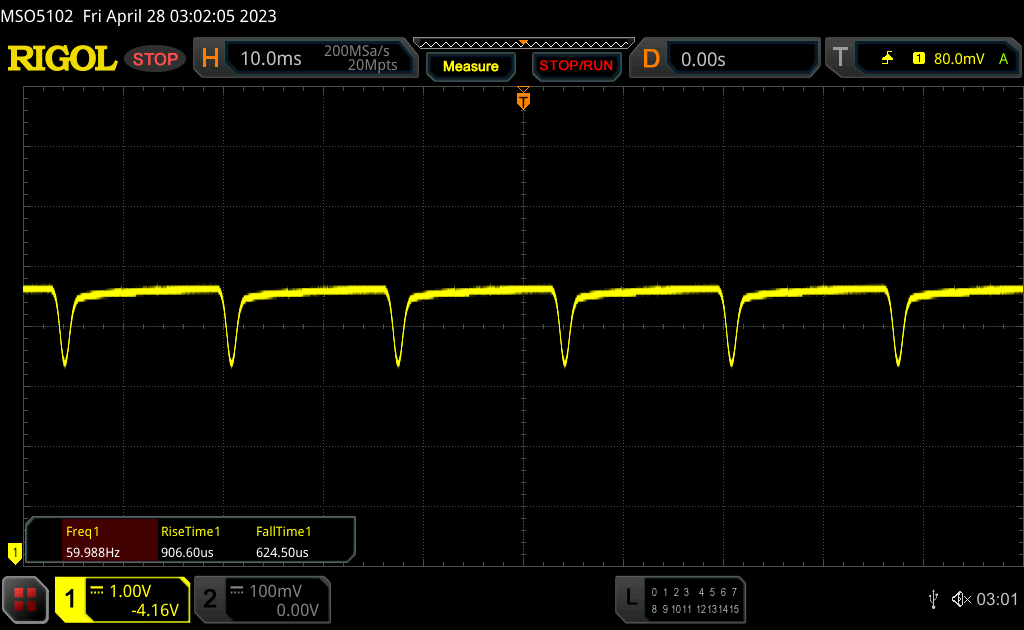
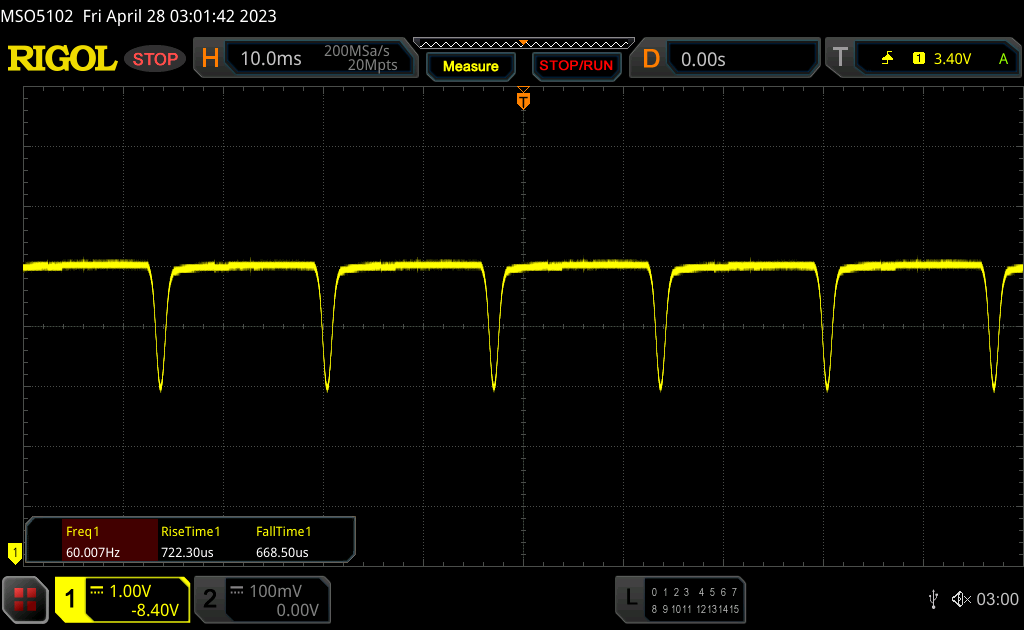
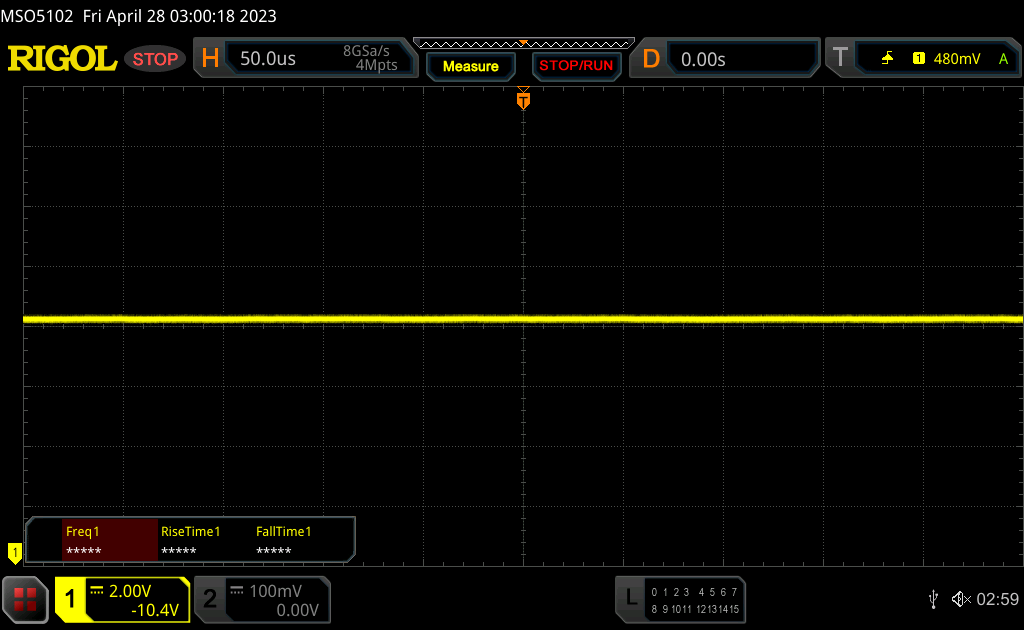
Temos que abordar o assunto PWM com mais detalhes, pois há vários fatores que devem ser considerados, como no antecessor. Em um brilho de 100%, não há PWM; na faixa de 58-99%, é usado o escurecimento de CC a 60 Hz; e a partir de 57% (88 cd/m²) e menos, é o clássico e potencialmente mais prejudicial PWM piscando a 240 Hz. Inicialmente, a frequência de escurecimento CC de 60 Hz parece pior do que é, mas devido à sua amplitude significativamente menor, não é possível compará-la com o PWM clássico e ela não deve causar nenhum problema.
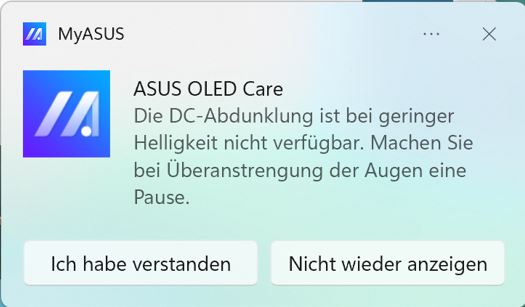
A Asus continua a oferecer uma solução de software para reduzir o brilho sem entrar na área prejudicial de PWM. A Asus chama essa função de "flicker free OLED darkening", permitindo que você continue a reduzir o brilho em etapas. Na prática, você não deve ir abaixo do brilho do Windows de 60% e, para uma redução adicional, use o software. Embora a Asus forneça uma notificação de aviso aqui, é claro que teríamos preferido uma solução mais confortável, em que o método do software fosse diretamente integrado às configurações do Windows e o usuário não pudesse entrar na área clássica do PWM.
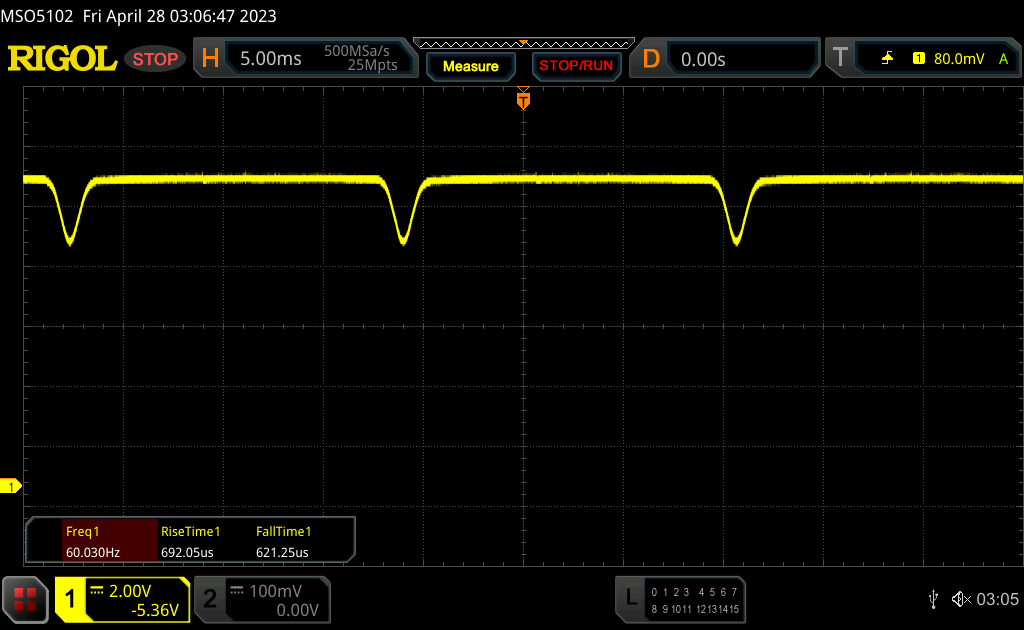
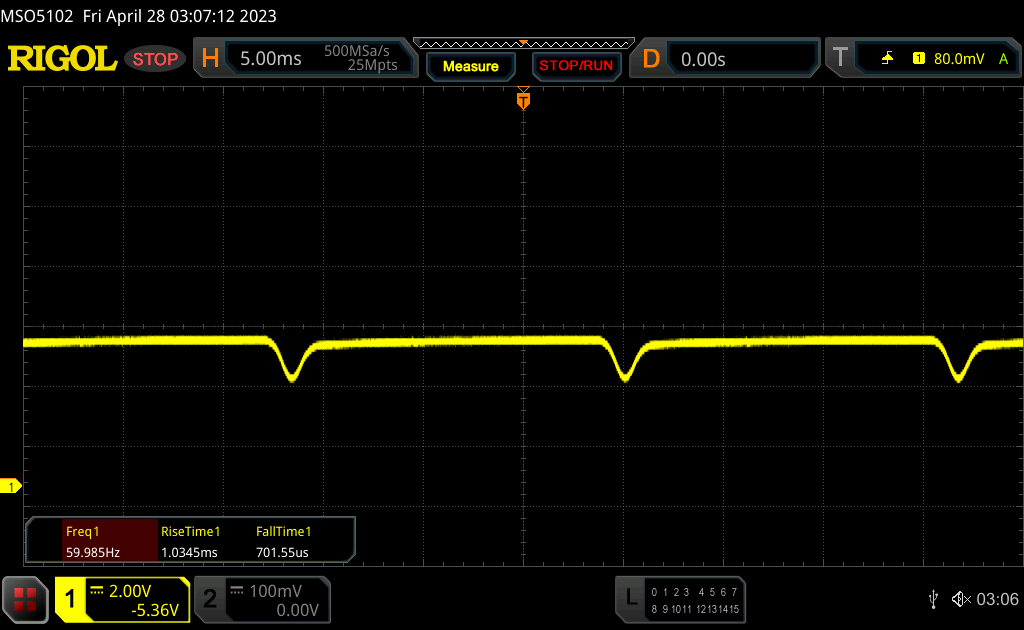
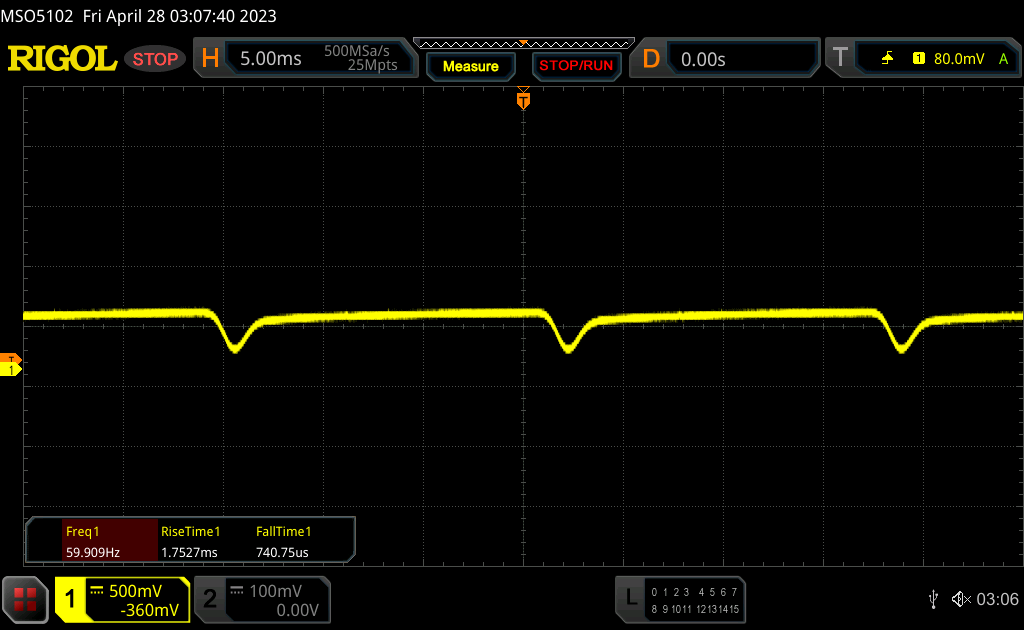
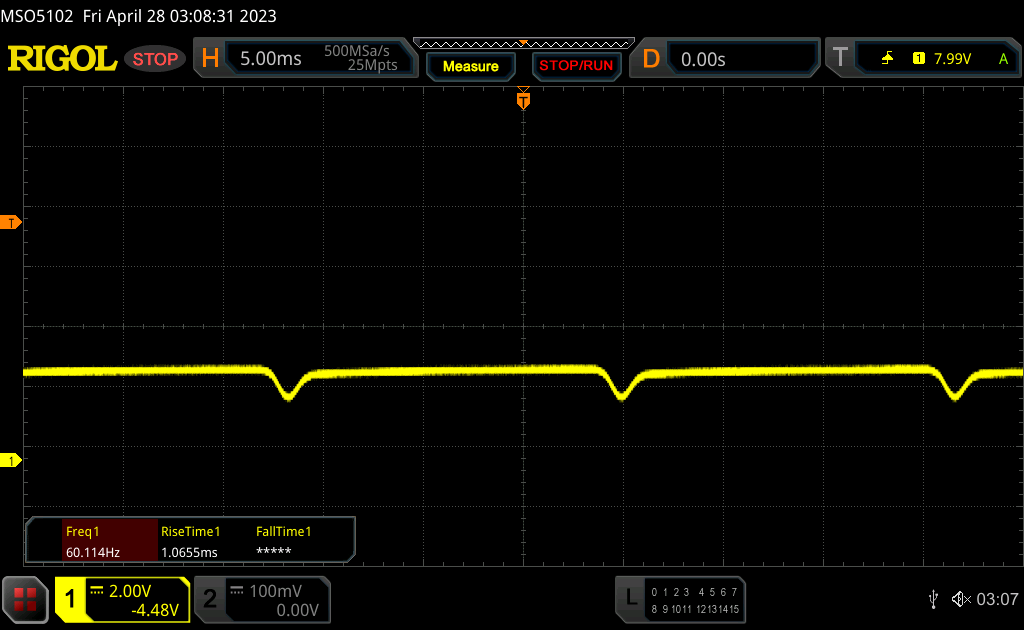
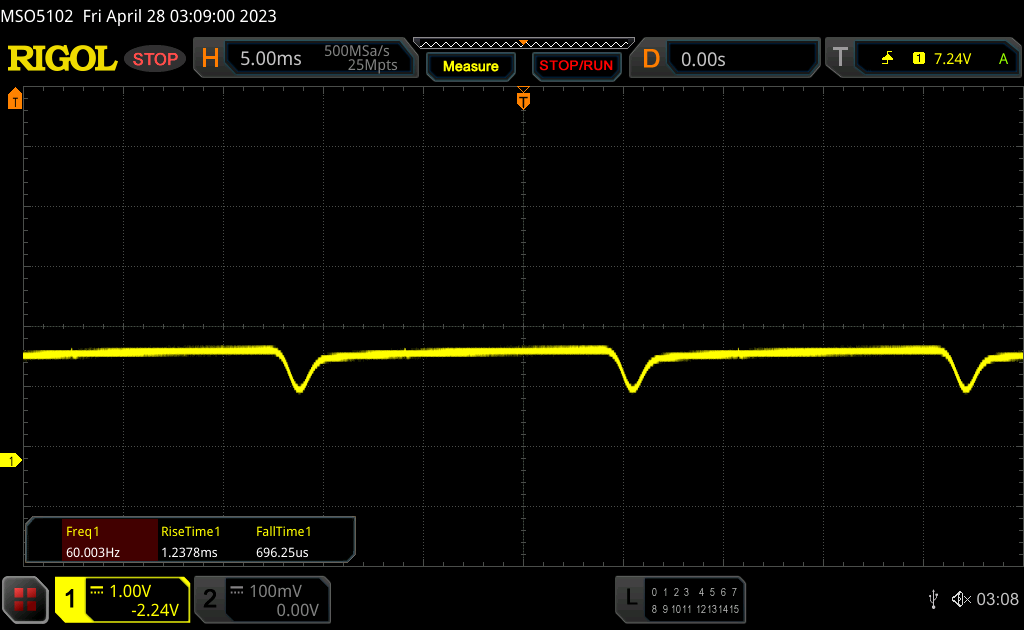
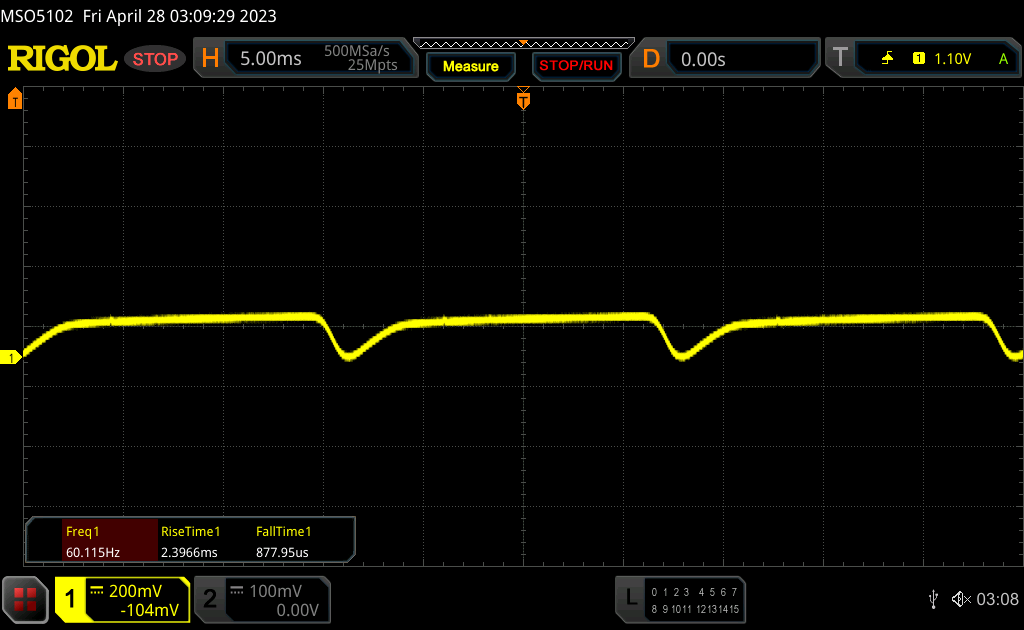
Como exemplos, medimos várias configurações com as duas configurações básicas de brilho e vários níveis de escurecimento. Você pode ver claramente que também é possível implementar níveis de brilho mais baixos com o escurecimento DC usando o escurecimento do software.
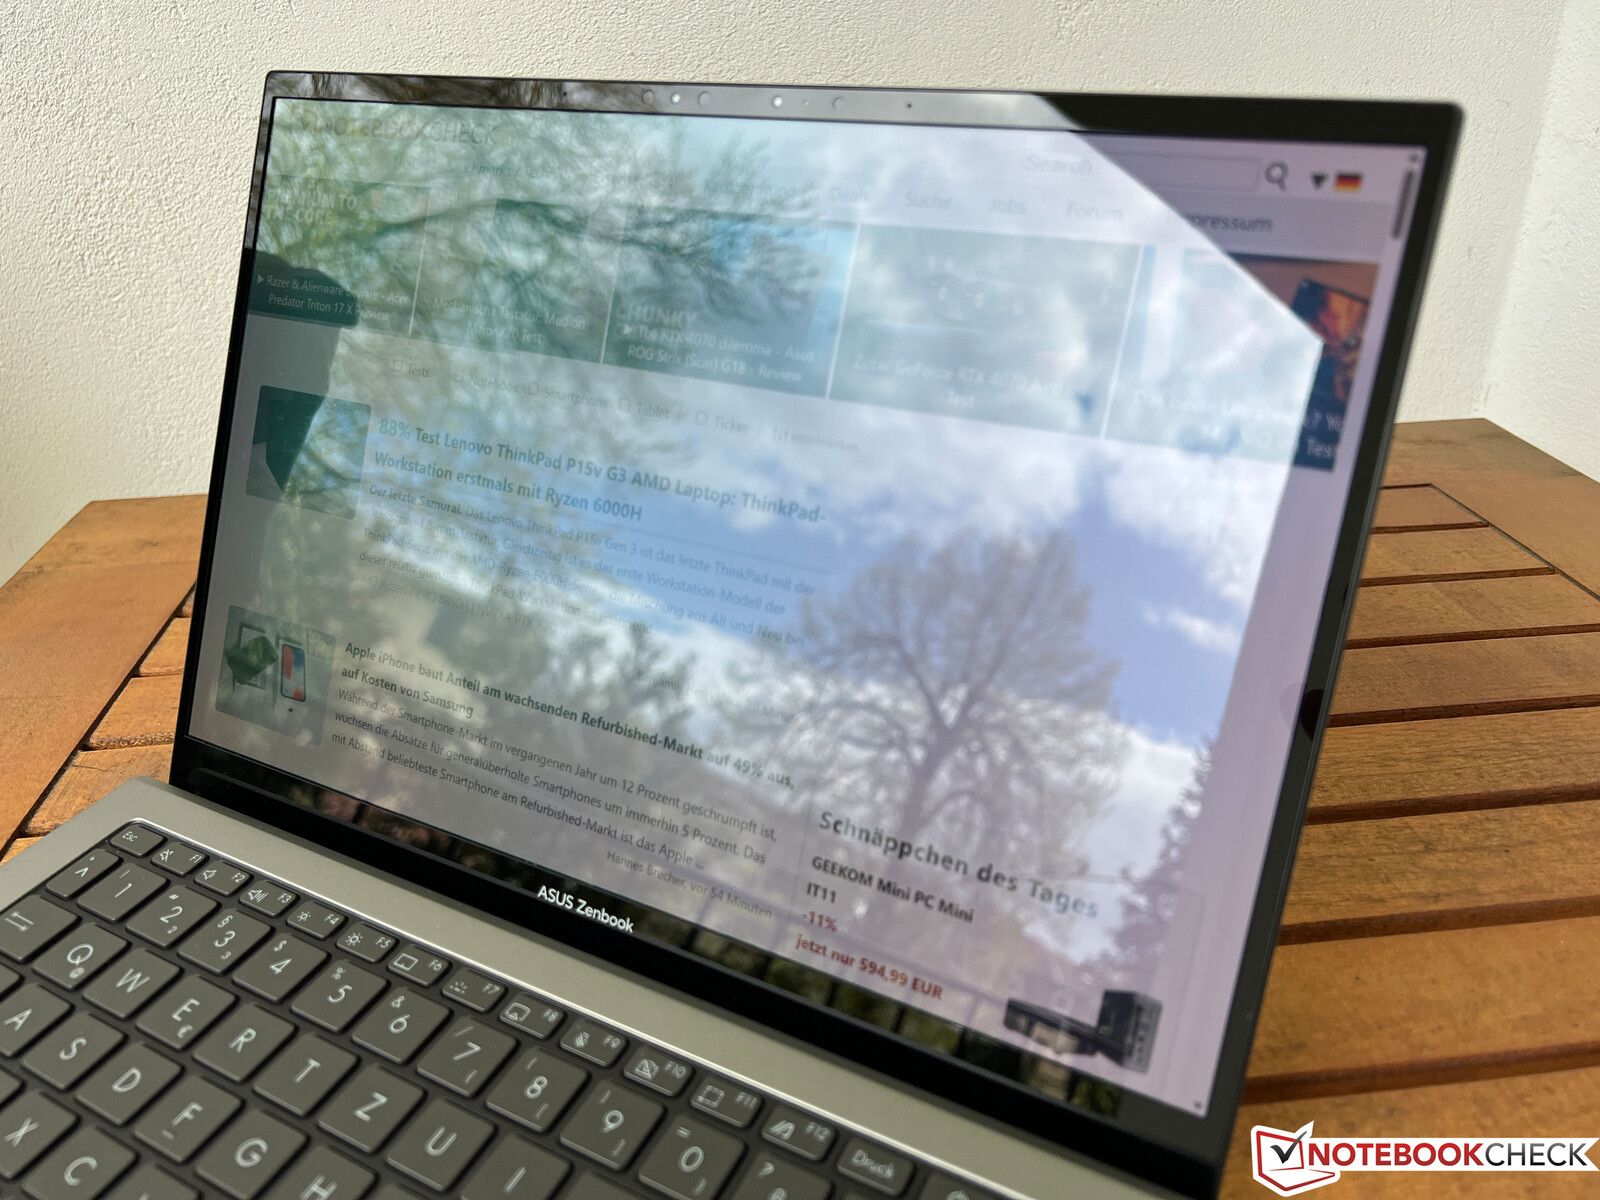
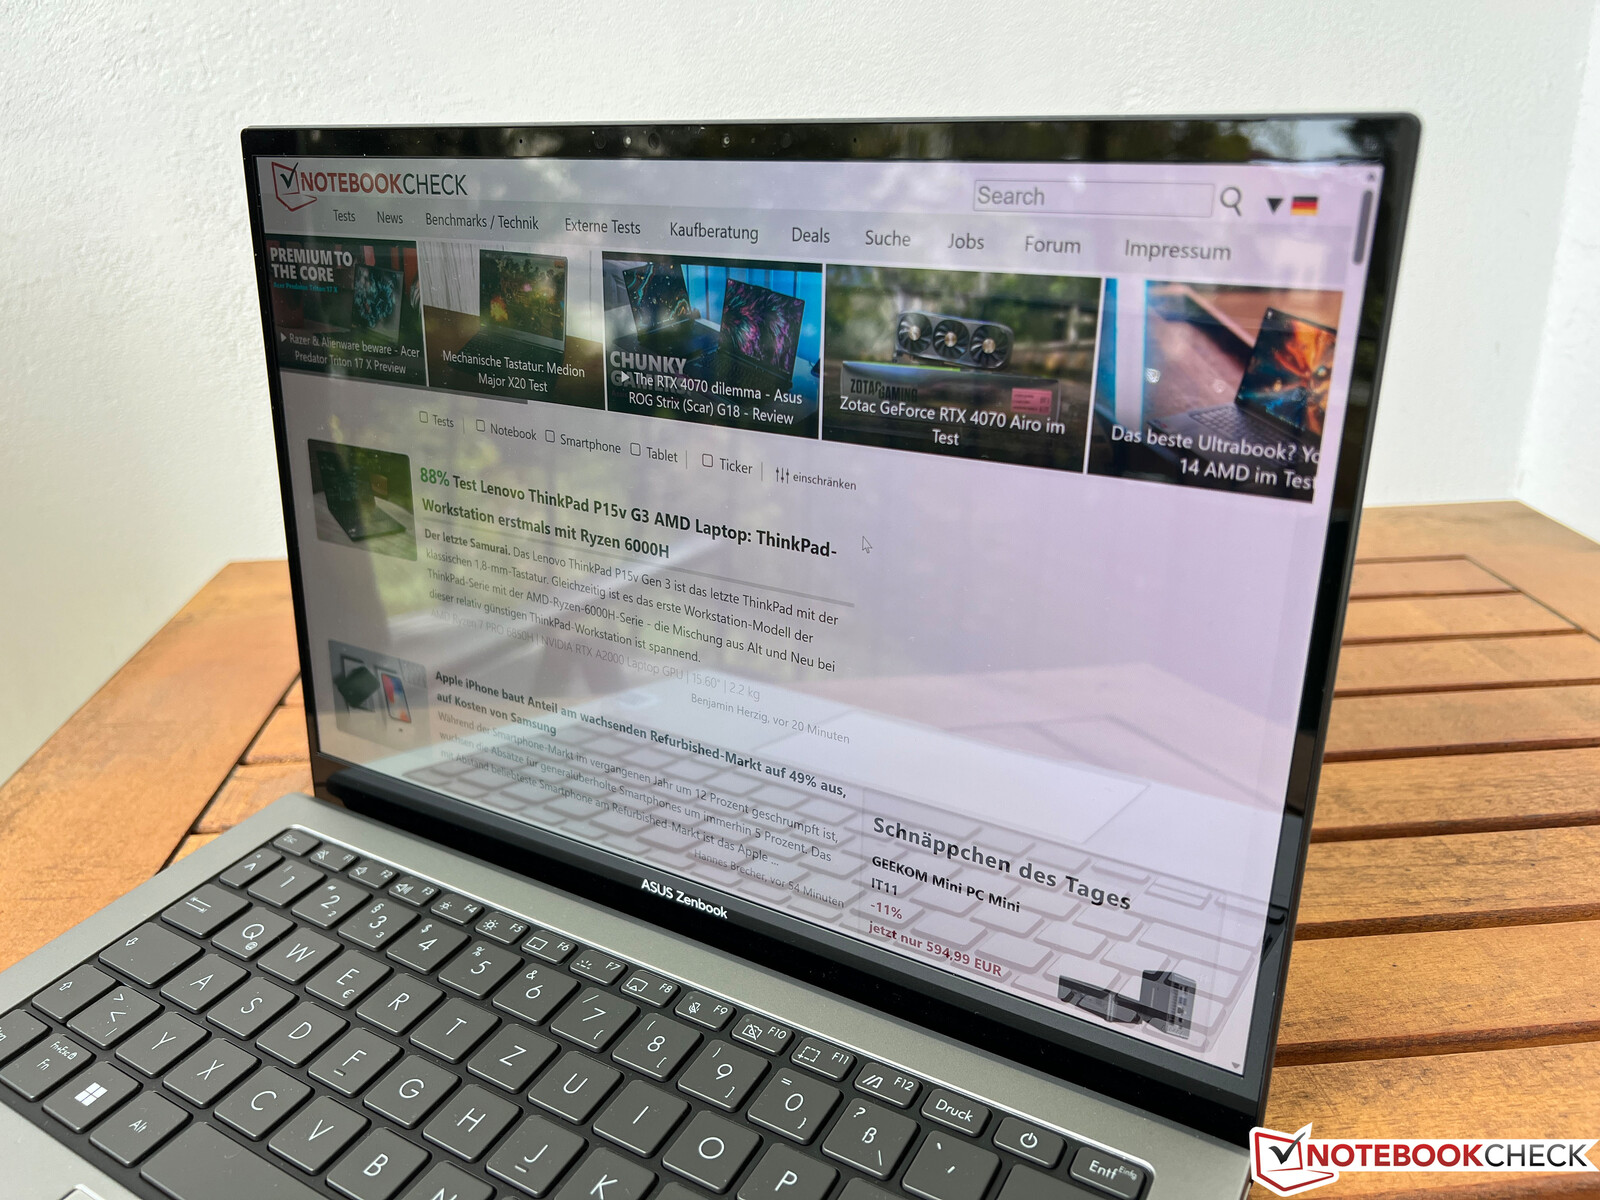
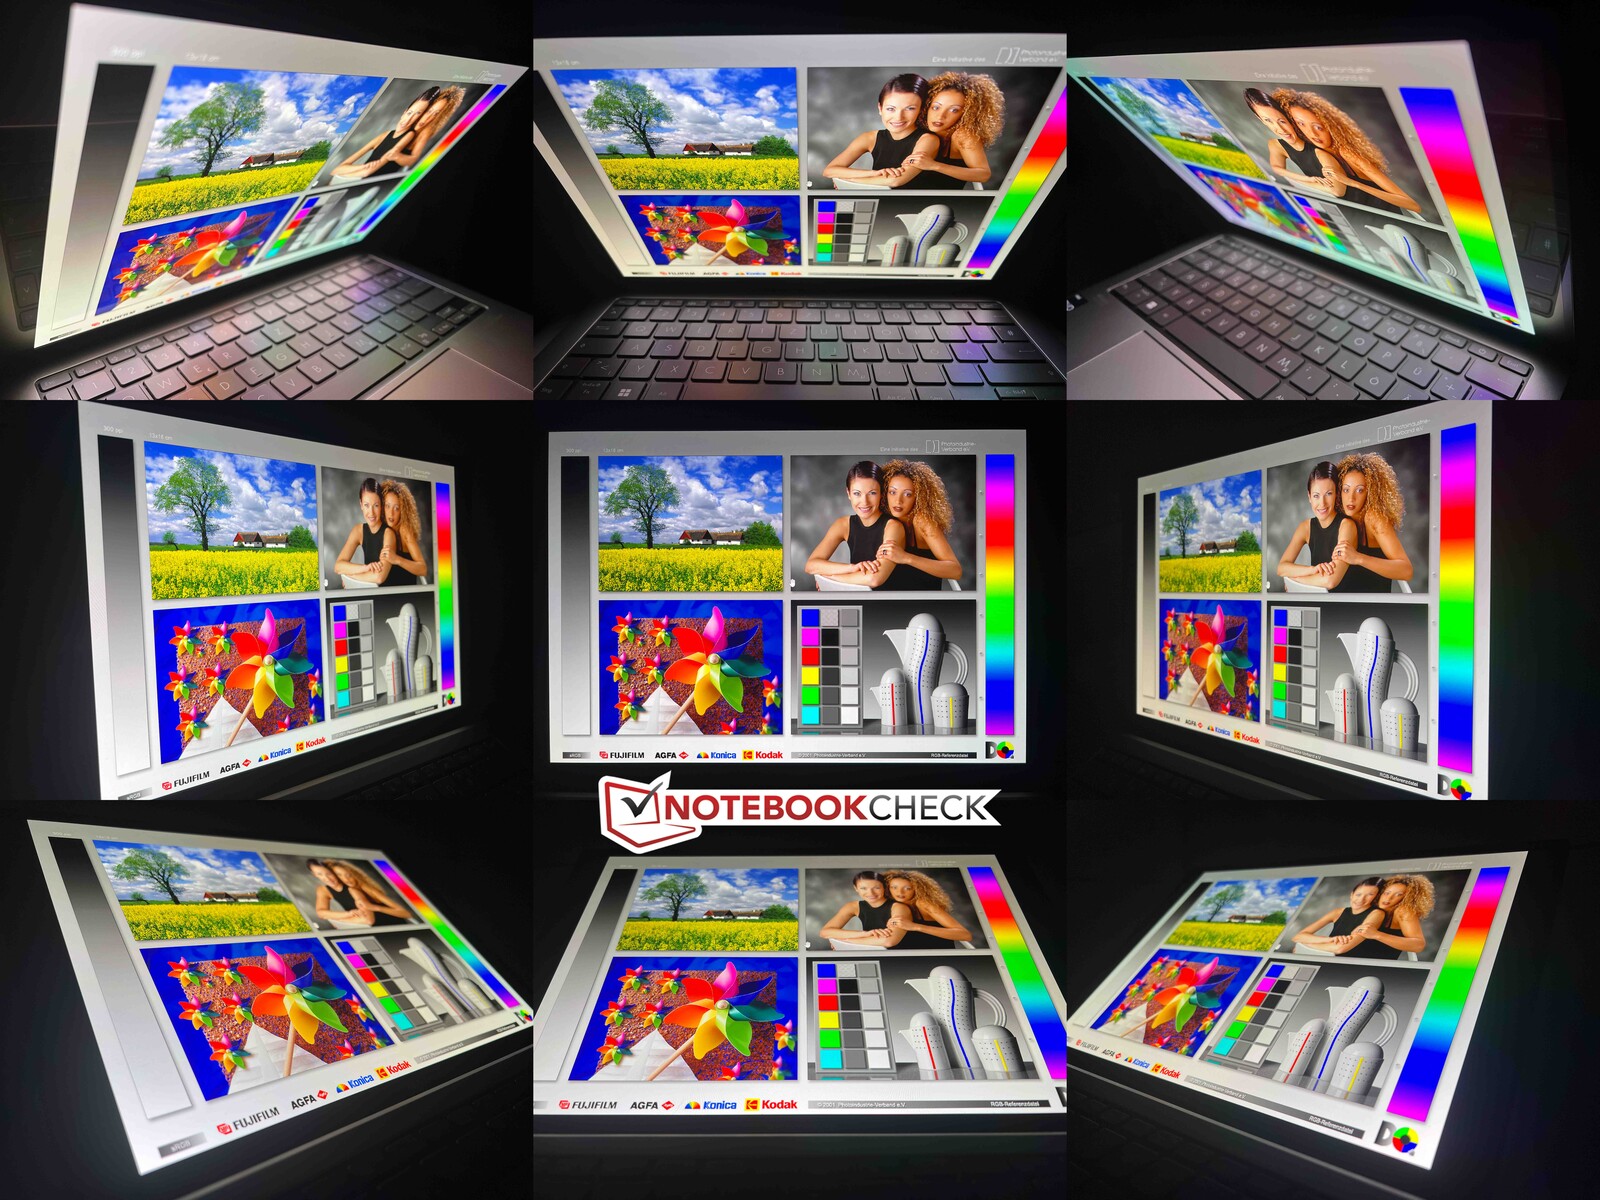
Em ambientes externos, o Zenbook se beneficia do contraste extremamente alto, mas ainda usa uma tela reflexiva, o que necessariamente levará a alguns reflexos. Um brilho SDR mais alto certamente também seria benéfico aqui. A estabilidade do ângulo de visão é muito boa no geral, e você só pode ver a leve tonalidade azul que é típica dos painéis OLED em alguns ângulos de visão (muito acentuados).
Desempenho - A Asus agora usa o Raptor Lake U
Condições de teste
A Asus oferece três perfis de desempenho diferentes: Modo Sussurro, Modo Padrão e Modo Desempenho. Devido a seus ventiladores barulhentos (sem trazer um aumento de desempenho perceptível), o último não pode ser usado. Executamos nossos benchmarks e medições abaixo no modo Padrão. Ao usar o modo Whisper, as ventoinhas são significativamente mais silenciosas, mas isso não é necessariamente uma vantagem com o ruído de alta frequência das ventoinhas. Mas falaremos mais sobre isso mais tarde.
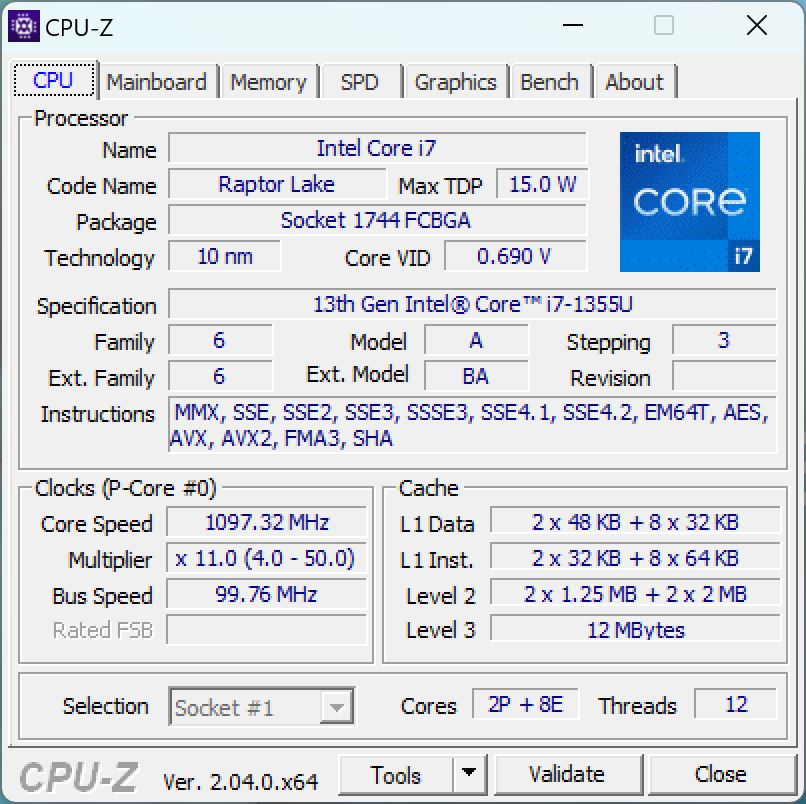
Processador - Core i7-1355U
OIntel Core i7-1355Uda atual geração Raptor Lake oferece dois núcleos de desempenho rápido e oito núcleos de eficiência. Basicamente, esse é oAlder Lake Core i7-1255Udo ano passado com velocidades de clock ligeiramente mais altas. O processador pode consumir até 44 watts por curtos períodos de tempo, mas sob carga constante, o consumo cai rapidamente para cerca de 17 watts.
Portanto, nos testes de vários núcleos, o desempenho só é competitivo por um curto período de tempo, e o MacBook Air M2com resfriamento passivo, por exemplo, já é mais rápido na segunda execução (mesmo que o Cinebench R15 tenha que ser emulado aqui). Em comparação com o Zenbook S 13 do ano passado com o Ryzen 7 6800Usomente nos testes de núcleo único vemos uma pequena vantagem de 20%, no máximo, em comparação com o Ryzen 7 6800U. Mas em todos os benchmarks de CPU, o novo modelo ainda fica 10% atrás do Zenbook S 13 do ano passado.
Em operação com bateria, o consumo de energia é reduzido um pouco mais, e o desempenho multicore cai cerca de 17%. Por outro lado, a redução de 3% no desempenho de núcleo único é insignificante. Você pode encontrar outros benchmarks de CPU aqui.
Cinebench R15 Multi Constant Load Test
Cinebench R23: Multi Core | Single Core
Cinebench R20: CPU (Multi Core) | CPU (Single Core)
Cinebench R15: CPU Multi 64Bit | CPU Single 64Bit
Blender: v2.79 BMW27 CPU
7-Zip 18.03: 7z b 4 | 7z b 4 -mmt1
Geekbench 5.5: Multi-Core | Single-Core
HWBOT x265 Benchmark v2.2: 4k Preset
LibreOffice : 20 Documents To PDF
R Benchmark 2.5: Overall mean
| CPU Performance rating | |
| Média da turma Subnotebook | |
| Dell XPS 13 Plus 9320 i7-1280P OLED | |
| Lenovo Yoga Slim 7 Carbon 13IAP7-82U9005FGE | |
| Asus Zenbook S 13 OLED | |
| Média Intel Core i7-1355U | |
| Asus ZenBook S13 OLED UX5304 | |
| Apple MacBook Air M2 10C GPU -5! | |
| Samsung Galaxy Book2 Pro 13 NP930XED-KA1DE | |
| Cinebench R23 / Multi Core | |
| Média da turma Subnotebook (1555 - 21812, n=59, últimos 2 anos) | |
| Dell XPS 13 Plus 9320 i7-1280P OLED | |
| Asus Zenbook S 13 OLED | |
| Lenovo Yoga Slim 7 Carbon 13IAP7-82U9005FGE | |
| Média Intel Core i7-1355U (6936 - 10252, n=18) | |
| Apple MacBook Air M2 10C GPU | |
| Asus ZenBook S13 OLED UX5304 | |
| Samsung Galaxy Book2 Pro 13 NP930XED-KA1DE | |
| Cinebench R23 / Single Core | |
| Média Intel Core i7-1355U (1687 - 1889, n=18) | |
| Lenovo Yoga Slim 7 Carbon 13IAP7-82U9005FGE | |
| Média da turma Subnotebook (358 - 2213, n=60, últimos 2 anos) | |
| Asus ZenBook S13 OLED UX5304 | |
| Dell XPS 13 Plus 9320 i7-1280P OLED | |
| Apple MacBook Air M2 10C GPU | |
| Asus Zenbook S 13 OLED | |
| Samsung Galaxy Book2 Pro 13 NP930XED-KA1DE | |
| Cinebench R20 / CPU (Multi Core) | |
| Média da turma Subnotebook (579 - 8541, n=56, últimos 2 anos) | |
| Dell XPS 13 Plus 9320 i7-1280P OLED | |
| Asus Zenbook S 13 OLED | |
| Lenovo Yoga Slim 7 Carbon 13IAP7-82U9005FGE | |
| Média Intel Core i7-1355U (2849 - 3907, n=18) | |
| Asus ZenBook S13 OLED UX5304 | |
| Apple MacBook Air M2 10C GPU | |
| Samsung Galaxy Book2 Pro 13 NP930XED-KA1DE | |
| Cinebench R20 / CPU (Single Core) | |
| Média Intel Core i7-1355U (654 - 725, n=18) | |
| Asus ZenBook S13 OLED UX5304 | |
| Lenovo Yoga Slim 7 Carbon 13IAP7-82U9005FGE | |
| Média da turma Subnotebook (128 - 832, n=56, últimos 2 anos) | |
| Dell XPS 13 Plus 9320 i7-1280P OLED | |
| Asus Zenbook S 13 OLED | |
| Apple MacBook Air M2 10C GPU | |
| Samsung Galaxy Book2 Pro 13 NP930XED-KA1DE | |
| Cinebench R15 / CPU Multi 64Bit | |
| Média da turma Subnotebook (327 - 3345, n=56, últimos 2 anos) | |
| Dell XPS 13 Plus 9320 i7-1280P OLED | |
| Lenovo Yoga Slim 7 Carbon 13IAP7-82U9005FGE | |
| Asus Zenbook S 13 OLED | |
| Média Intel Core i7-1355U (1206 - 1735, n=18) | |
| Asus ZenBook S13 OLED UX5304 | |
| Apple MacBook Air M2 10C GPU | |
| Samsung Galaxy Book2 Pro 13 NP930XED-KA1DE | |
| Cinebench R15 / CPU Single 64Bit | |
| Média da turma Subnotebook (72.4 - 322, n=56, últimos 2 anos) | |
| Média Intel Core i7-1355U (237 - 267, n=18) | |
| Asus ZenBook S13 OLED UX5304 | |
| Lenovo Yoga Slim 7 Carbon 13IAP7-82U9005FGE | |
| Asus Zenbook S 13 OLED | |
| Dell XPS 13 Plus 9320 i7-1280P OLED | |
| Apple MacBook Air M2 10C GPU | |
| Samsung Galaxy Book2 Pro 13 NP930XED-KA1DE | |
| Blender / v2.79 BMW27 CPU | |
| Apple MacBook Air M2 10C GPU | |
| Samsung Galaxy Book2 Pro 13 NP930XED-KA1DE | |
| Asus ZenBook S13 OLED UX5304 | |
| Asus ZenBook S13 OLED UX5304 | |
| Média Intel Core i7-1355U (328 - 503, n=18) | |
| Média da turma Subnotebook (159 - 2271, n=57, últimos 2 anos) | |
| Lenovo Yoga Slim 7 Carbon 13IAP7-82U9005FGE | |
| Asus Zenbook S 13 OLED | |
| Dell XPS 13 Plus 9320 i7-1280P OLED | |
| 7-Zip 18.03 / 7z b 4 | |
| Dell XPS 13 Plus 9320 i7-1280P OLED | |
| Asus Zenbook S 13 OLED | |
| Média da turma Subnotebook (11668 - 77867, n=56, últimos 2 anos) | |
| Lenovo Yoga Slim 7 Carbon 13IAP7-82U9005FGE | |
| Média Intel Core i7-1355U (30255 - 42092, n=18) | |
| Asus ZenBook S13 OLED UX5304 | |
| Samsung Galaxy Book2 Pro 13 NP930XED-KA1DE | |
| 7-Zip 18.03 / 7z b 4 -mmt1 | |
| Asus ZenBook S13 OLED UX5304 | |
| Média Intel Core i7-1355U (5301 - 5911, n=18) | |
| Média da turma Subnotebook (2643 - 6699, n=58, últimos 2 anos) | |
| Asus Zenbook S 13 OLED | |
| Lenovo Yoga Slim 7 Carbon 13IAP7-82U9005FGE | |
| Dell XPS 13 Plus 9320 i7-1280P OLED | |
| Samsung Galaxy Book2 Pro 13 NP930XED-KA1DE | |
| Geekbench 5.5 / Multi-Core | |
| Dell XPS 13 Plus 9320 i7-1280P OLED | |
| Média da turma Subnotebook (2557 - 17218, n=48, últimos 2 anos) | |
| Lenovo Yoga Slim 7 Carbon 13IAP7-82U9005FGE | |
| Apple MacBook Air M2 10C GPU | |
| Média Intel Core i7-1355U (7507 - 9328, n=18) | |
| Asus ZenBook S13 OLED UX5304 | |
| Asus Zenbook S 13 OLED | |
| Samsung Galaxy Book2 Pro 13 NP930XED-KA1DE | |
| Geekbench 5.5 / Single-Core | |
| Apple MacBook Air M2 10C GPU | |
| Média da turma Subnotebook (726 - 2224, n=48, últimos 2 anos) | |
| Dell XPS 13 Plus 9320 i7-1280P OLED | |
| Média Intel Core i7-1355U (1678 - 1872, n=18) | |
| Asus ZenBook S13 OLED UX5304 | |
| Lenovo Yoga Slim 7 Carbon 13IAP7-82U9005FGE | |
| Asus Zenbook S 13 OLED | |
| Samsung Galaxy Book2 Pro 13 NP930XED-KA1DE | |
| HWBOT x265 Benchmark v2.2 / 4k Preset | |
| Dell XPS 13 Plus 9320 i7-1280P OLED | |
| Média da turma Subnotebook (0.97 - 25.1, n=56, últimos 2 anos) | |
| Asus Zenbook S 13 OLED | |
| Lenovo Yoga Slim 7 Carbon 13IAP7-82U9005FGE | |
| Média Intel Core i7-1355U (7.83 - 11.4, n=18) | |
| Asus ZenBook S13 OLED UX5304 | |
| Samsung Galaxy Book2 Pro 13 NP930XED-KA1DE | |
| LibreOffice / 20 Documents To PDF | |
| Samsung Galaxy Book2 Pro 13 NP930XED-KA1DE | |
| Média da turma Subnotebook (39.9 - 220, n=55, últimos 2 anos) | |
| Asus Zenbook S 13 OLED | |
| Média Intel Core i7-1355U (41.1 - 108.6, n=18) | |
| Dell XPS 13 Plus 9320 i7-1280P OLED | |
| Asus ZenBook S13 OLED UX5304 | |
| Lenovo Yoga Slim 7 Carbon 13IAP7-82U9005FGE | |
| R Benchmark 2.5 / Overall mean | |
| Samsung Galaxy Book2 Pro 13 NP930XED-KA1DE | |
| Asus Zenbook S 13 OLED | |
| Média da turma Subnotebook (0.4024 - 1.456, n=57, últimos 2 anos) | |
| Dell XPS 13 Plus 9320 i7-1280P OLED | |
| Média Intel Core i7-1355U (0.4481 - 0.832, n=18) | |
| Lenovo Yoga Slim 7 Carbon 13IAP7-82U9005FGE | |
| Asus ZenBook S13 OLED UX5304 | |
* ... menor é melhor
AIDA64: FP32 Ray-Trace | FPU Julia | CPU SHA3 | CPU Queen | FPU SinJulia | FPU Mandel | CPU AES | CPU ZLib | FP64 Ray-Trace | CPU PhotoWorxx
| Performance rating | |
| Asus Zenbook S 13 OLED | |
| Média da turma Subnotebook | |
| Dell XPS 13 Plus 9320 i7-1280P OLED | |
| Média Intel Core i7-1355U | |
| Lenovo Yoga Slim 7 Carbon 13IAP7-82U9005FGE | |
| Asus ZenBook S13 OLED UX5304 | |
| Samsung Galaxy Book2 Pro 13 NP930XED-KA1DE | |
| AIDA64 / FP32 Ray-Trace | |
| Média da turma Subnotebook (1135 - 32888, n=57, últimos 2 anos) | |
| Asus Zenbook S 13 OLED | |
| Dell XPS 13 Plus 9320 i7-1280P OLED | |
| Média Intel Core i7-1355U (5673 - 8424, n=18) | |
| Asus ZenBook S13 OLED UX5304 | |
| Lenovo Yoga Slim 7 Carbon 13IAP7-82U9005FGE | |
| Samsung Galaxy Book2 Pro 13 NP930XED-KA1DE | |
| AIDA64 / FPU Julia | |
| Asus Zenbook S 13 OLED | |
| Média da turma Subnotebook (5218 - 123315, n=57, últimos 2 anos) | |
| Dell XPS 13 Plus 9320 i7-1280P OLED | |
| Média Intel Core i7-1355U (29580 - 42706, n=18) | |
| Asus ZenBook S13 OLED UX5304 | |
| Lenovo Yoga Slim 7 Carbon 13IAP7-82U9005FGE | |
| Samsung Galaxy Book2 Pro 13 NP930XED-KA1DE | |
| AIDA64 / CPU SHA3 | |
| Média da turma Subnotebook (444 - 5287, n=57, últimos 2 anos) | |
| Dell XPS 13 Plus 9320 i7-1280P OLED | |
| Asus Zenbook S 13 OLED | |
| Média Intel Core i7-1355U (1529 - 2200, n=18) | |
| Lenovo Yoga Slim 7 Carbon 13IAP7-82U9005FGE | |
| Asus ZenBook S13 OLED UX5304 | |
| Samsung Galaxy Book2 Pro 13 NP930XED-KA1DE | |
| AIDA64 / CPU Queen | |
| Dell XPS 13 Plus 9320 i7-1280P OLED | |
| Asus Zenbook S 13 OLED | |
| Lenovo Yoga Slim 7 Carbon 13IAP7-82U9005FGE | |
| Asus ZenBook S13 OLED UX5304 | |
| Média Intel Core i7-1355U (21547 - 66907, n=18) | |
| Média da turma Subnotebook (10579 - 95002, n=48, últimos 2 anos) | |
| Samsung Galaxy Book2 Pro 13 NP930XED-KA1DE | |
| AIDA64 / FPU SinJulia | |
| Asus Zenbook S 13 OLED | |
| Dell XPS 13 Plus 9320 i7-1280P OLED | |
| Média da turma Subnotebook (744 - 18418, n=57, últimos 2 anos) | |
| Lenovo Yoga Slim 7 Carbon 13IAP7-82U9005FGE | |
| Média Intel Core i7-1355U (4045 - 5426, n=18) | |
| Asus ZenBook S13 OLED UX5304 | |
| Samsung Galaxy Book2 Pro 13 NP930XED-KA1DE | |
| AIDA64 / FPU Mandel | |
| Asus Zenbook S 13 OLED | |
| Média da turma Subnotebook (3341 - 65433, n=57, últimos 2 anos) | |
| Dell XPS 13 Plus 9320 i7-1280P OLED | |
| Média Intel Core i7-1355U (14596 - 21627, n=18) | |
| Asus ZenBook S13 OLED UX5304 | |
| Lenovo Yoga Slim 7 Carbon 13IAP7-82U9005FGE | |
| Samsung Galaxy Book2 Pro 13 NP930XED-KA1DE | |
| AIDA64 / CPU AES | |
| Asus Zenbook S 13 OLED | |
| Dell XPS 13 Plus 9320 i7-1280P OLED | |
| Média da turma Subnotebook (638 - 96917, n=57, últimos 2 anos) | |
| Média Intel Core i7-1355U (31432 - 75408, n=18) | |
| Lenovo Yoga Slim 7 Carbon 13IAP7-82U9005FGE | |
| Asus ZenBook S13 OLED UX5304 | |
| Samsung Galaxy Book2 Pro 13 NP930XED-KA1DE | |
| AIDA64 / CPU ZLib | |
| Média da turma Subnotebook (164.9 - 1379, n=57, últimos 2 anos) | |
| Dell XPS 13 Plus 9320 i7-1280P OLED | |
| Asus Zenbook S 13 OLED | |
| Lenovo Yoga Slim 7 Carbon 13IAP7-82U9005FGE | |
| Média Intel Core i7-1355U (454 - 684, n=18) | |
| Asus ZenBook S13 OLED UX5304 | |
| Samsung Galaxy Book2 Pro 13 NP930XED-KA1DE | |
| AIDA64 / FP64 Ray-Trace | |
| Média da turma Subnotebook (610 - 17495, n=57, últimos 2 anos) | |
| Dell XPS 13 Plus 9320 i7-1280P OLED | |
| Asus Zenbook S 13 OLED | |
| Média Intel Core i7-1355U (2991 - 4453, n=18) | |
| Asus ZenBook S13 OLED UX5304 | |
| Lenovo Yoga Slim 7 Carbon 13IAP7-82U9005FGE | |
| Samsung Galaxy Book2 Pro 13 NP930XED-KA1DE | |
| AIDA64 / CPU PhotoWorxx | |
| Média da turma Subnotebook (6569 - 85600, n=57, últimos 2 anos) | |
| Dell XPS 13 Plus 9320 i7-1280P OLED | |
| Asus ZenBook S13 OLED UX5304 | |
| Média Intel Core i7-1355U (21800 - 46154, n=18) | |
| Lenovo Yoga Slim 7 Carbon 13IAP7-82U9005FGE | |
| Samsung Galaxy Book2 Pro 13 NP930XED-KA1DE | |
| Asus Zenbook S 13 OLED | |
Desempenho do sistema
A impressão subjetiva de desempenho do novo Zenbook S 13 é muito boa, e todas as entradas são implementadas sem nenhum atraso perceptível. Os resultados nos benchmarks sintéticos são medianos e, em algumas partes, ficam até atrás dos do antecessor. Entretanto, nada disso é perceptível na prática.
CrossMark: Overall | Productivity | Creativity | Responsiveness
| PCMark 10 / Score | |
| Média da turma Subnotebook (4920 - 9939, n=45, últimos 2 anos) | |
| Asus Zenbook S 13 OLED | |
| Média Intel Core i7-1355U, Intel Iris Xe Graphics G7 96EUs (5455 - 5933, n=15) | |
| Dell XPS 13 Plus 9320 i7-1280P OLED | |
| Lenovo Yoga Slim 7 Carbon 13IAP7-82U9005FGE | |
| Asus ZenBook S13 OLED UX5304 | |
| Samsung Galaxy Book2 Pro 13 NP930XED-KA1DE | |
| PCMark 10 / Essentials | |
| Média Intel Core i7-1355U, Intel Iris Xe Graphics G7 96EUs (10203 - 11822, n=15) | |
| Asus Zenbook S 13 OLED | |
| Asus ZenBook S13 OLED UX5304 | |
| Lenovo Yoga Slim 7 Carbon 13IAP7-82U9005FGE | |
| Dell XPS 13 Plus 9320 i7-1280P OLED | |
| Média da turma Subnotebook (8552 - 11646, n=45, últimos 2 anos) | |
| Samsung Galaxy Book2 Pro 13 NP930XED-KA1DE | |
| PCMark 10 / Productivity | |
| Média da turma Subnotebook (5435 - 16606, n=45, últimos 2 anos) | |
| Asus Zenbook S 13 OLED | |
| Média Intel Core i7-1355U, Intel Iris Xe Graphics G7 96EUs (6763 - 7536, n=15) | |
| Asus ZenBook S13 OLED UX5304 | |
| Dell XPS 13 Plus 9320 i7-1280P OLED | |
| Lenovo Yoga Slim 7 Carbon 13IAP7-82U9005FGE | |
| Samsung Galaxy Book2 Pro 13 NP930XED-KA1DE | |
| PCMark 10 / Digital Content Creation | |
| Média da turma Subnotebook (5722 - 13779, n=45, últimos 2 anos) | |
| Asus Zenbook S 13 OLED | |
| Dell XPS 13 Plus 9320 i7-1280P OLED | |
| Lenovo Yoga Slim 7 Carbon 13IAP7-82U9005FGE | |
| Média Intel Core i7-1355U, Intel Iris Xe Graphics G7 96EUs (5723 - 6712, n=15) | |
| Asus ZenBook S13 OLED UX5304 | |
| Samsung Galaxy Book2 Pro 13 NP930XED-KA1DE | |
| CrossMark / Overall | |
| Dell XPS 13 Plus 9320 i7-1280P OLED | |
| Média da turma Subnotebook (365 - 2356, n=59, últimos 2 anos) | |
| Lenovo Yoga Slim 7 Carbon 13IAP7-82U9005FGE | |
| Asus ZenBook S13 OLED UX5304 | |
| Média Intel Core i7-1355U, Intel Iris Xe Graphics G7 96EUs (1478 - 1643, n=15) | |
| Apple MacBook Air M2 10C GPU | |
| Asus Zenbook S 13 OLED | |
| CrossMark / Productivity | |
| Dell XPS 13 Plus 9320 i7-1280P OLED | |
| Média da turma Subnotebook (364 - 2277, n=59, últimos 2 anos) | |
| Asus ZenBook S13 OLED UX5304 | |
| Média Intel Core i7-1355U, Intel Iris Xe Graphics G7 96EUs (1444 - 1665, n=15) | |
| Lenovo Yoga Slim 7 Carbon 13IAP7-82U9005FGE | |
| Asus Zenbook S 13 OLED | |
| Apple MacBook Air M2 10C GPU | |
| CrossMark / Creativity | |
| Dell XPS 13 Plus 9320 i7-1280P OLED | |
| Média da turma Subnotebook (372 - 2743, n=59, últimos 2 anos) | |
| Apple MacBook Air M2 10C GPU | |
| Lenovo Yoga Slim 7 Carbon 13IAP7-82U9005FGE | |
| Asus ZenBook S13 OLED UX5304 | |
| Média Intel Core i7-1355U, Intel Iris Xe Graphics G7 96EUs (1563 - 1732, n=15) | |
| Asus Zenbook S 13 OLED | |
| CrossMark / Responsiveness | |
| Dell XPS 13 Plus 9320 i7-1280P OLED | |
| Asus ZenBook S13 OLED UX5304 | |
| Média da turma Subnotebook (312 - 1854, n=59, últimos 2 anos) | |
| Média Intel Core i7-1355U, Intel Iris Xe Graphics G7 96EUs (1217 - 1681, n=15) | |
| Lenovo Yoga Slim 7 Carbon 13IAP7-82U9005FGE | |
| Asus Zenbook S 13 OLED | |
| Apple MacBook Air M2 10C GPU | |
| PCMark 10 Score | 5576 pontos | |
Ajuda | ||
| AIDA64 / Memory Copy | |
| Média da turma Subnotebook (14554 - 131023, n=57, últimos 2 anos) | |
| Dell XPS 13 Plus 9320 i7-1280P OLED | |
| Asus ZenBook S13 OLED UX5304 | |
| Lenovo Yoga Slim 7 Carbon 13IAP7-82U9005FGE | |
| Média Intel Core i7-1355U (35017 - 71600, n=18) | |
| Samsung Galaxy Book2 Pro 13 NP930XED-KA1DE | |
| Asus Zenbook S 13 OLED | |
| AIDA64 / Memory Read | |
| Média da turma Subnotebook (15948 - 127174, n=57, últimos 2 anos) | |
| Dell XPS 13 Plus 9320 i7-1280P OLED | |
| Lenovo Yoga Slim 7 Carbon 13IAP7-82U9005FGE | |
| Samsung Galaxy Book2 Pro 13 NP930XED-KA1DE | |
| Média Intel Core i7-1355U (38551 - 73377, n=18) | |
| Asus ZenBook S13 OLED UX5304 | |
| Asus Zenbook S 13 OLED | |
| AIDA64 / Memory Write | |
| Média da turma Subnotebook (15709 - 135141, n=57, últimos 2 anos) | |
| Asus ZenBook S13 OLED UX5304 | |
| Média Intel Core i7-1355U (35910 - 93342, n=18) | |
| Dell XPS 13 Plus 9320 i7-1280P OLED | |
| Lenovo Yoga Slim 7 Carbon 13IAP7-82U9005FGE | |
| Samsung Galaxy Book2 Pro 13 NP930XED-KA1DE | |
| Asus Zenbook S 13 OLED | |
| AIDA64 / Memory Latency | |
| Asus Zenbook S 13 OLED | |
| Lenovo Yoga Slim 7 Carbon 13IAP7-82U9005FGE | |
| Média Intel Core i7-1355U (72.2 - 346, n=18) | |
| Dell XPS 13 Plus 9320 i7-1280P OLED | |
| Média da turma Subnotebook (6.1 - 159.9, n=55, últimos 2 anos) | |
| Asus ZenBook S13 OLED UX5304 | |
* ... menor é melhor
Latências DPC
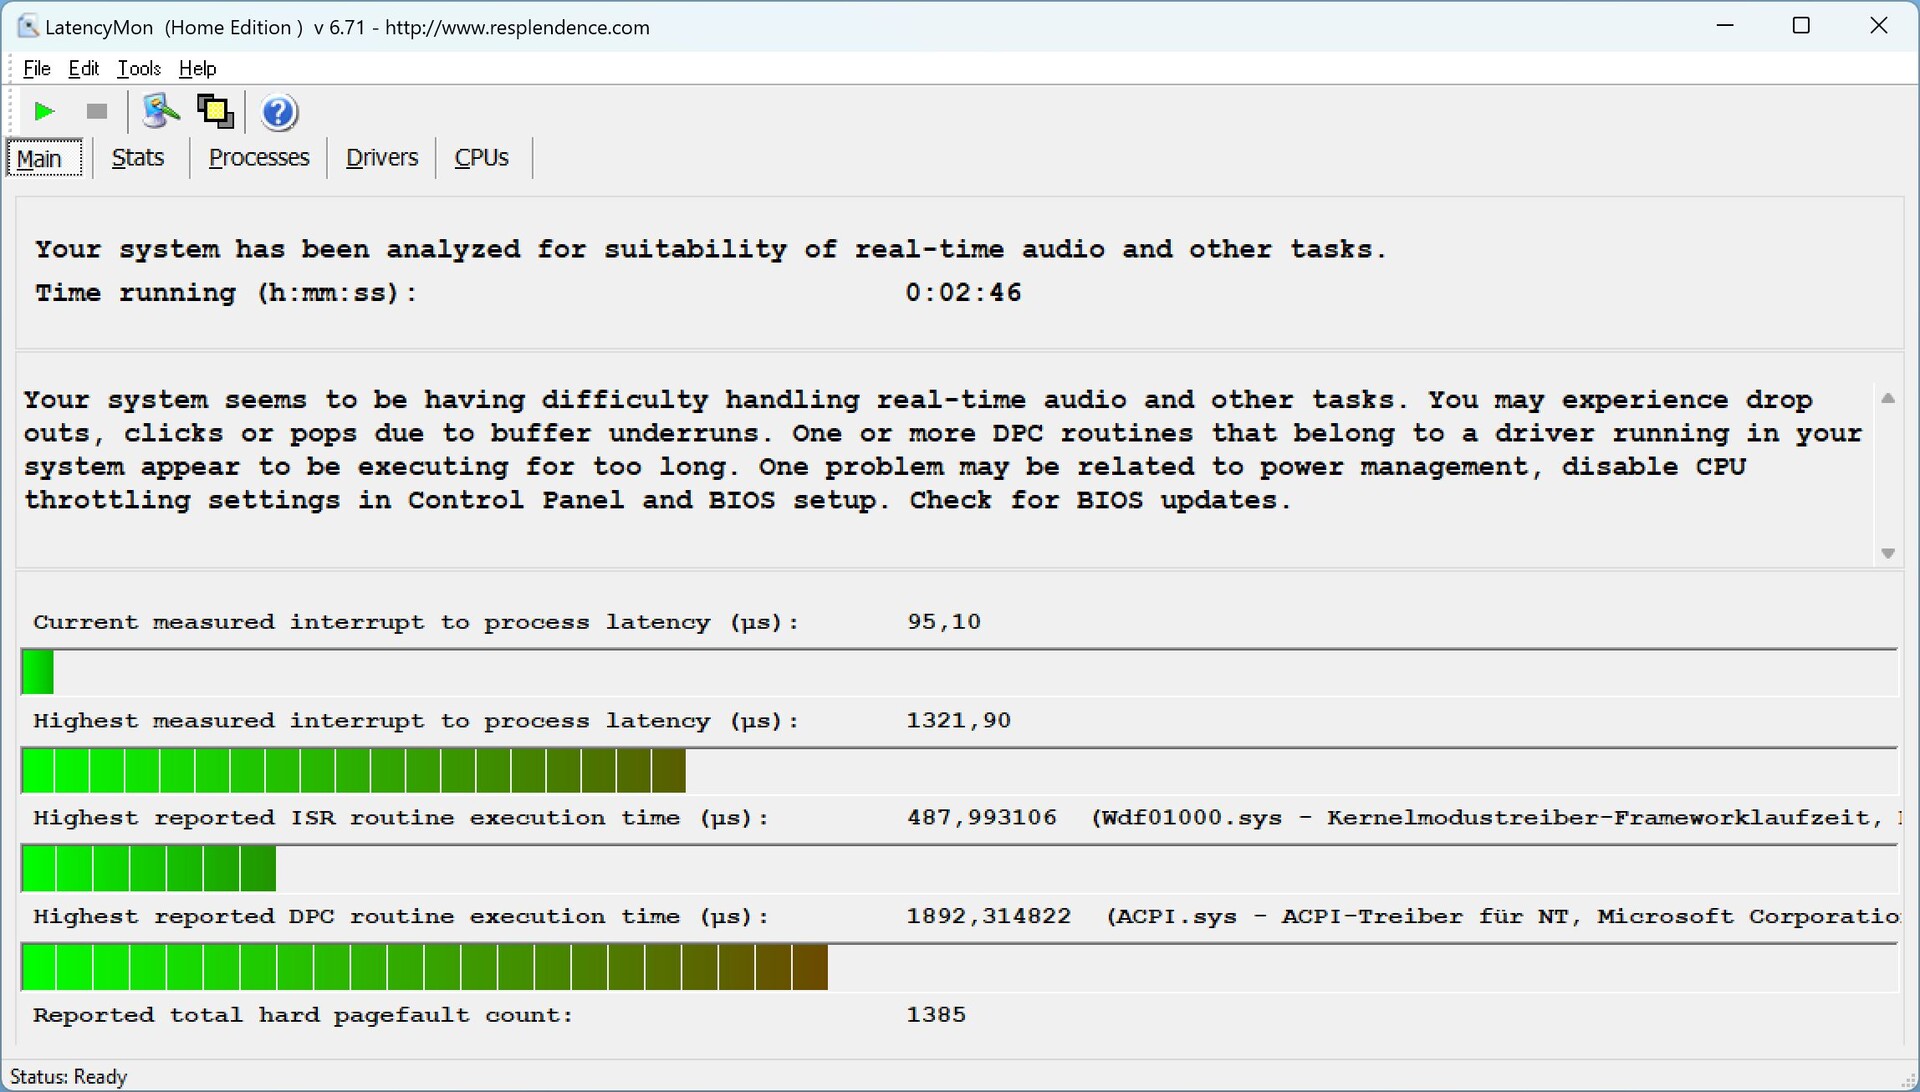
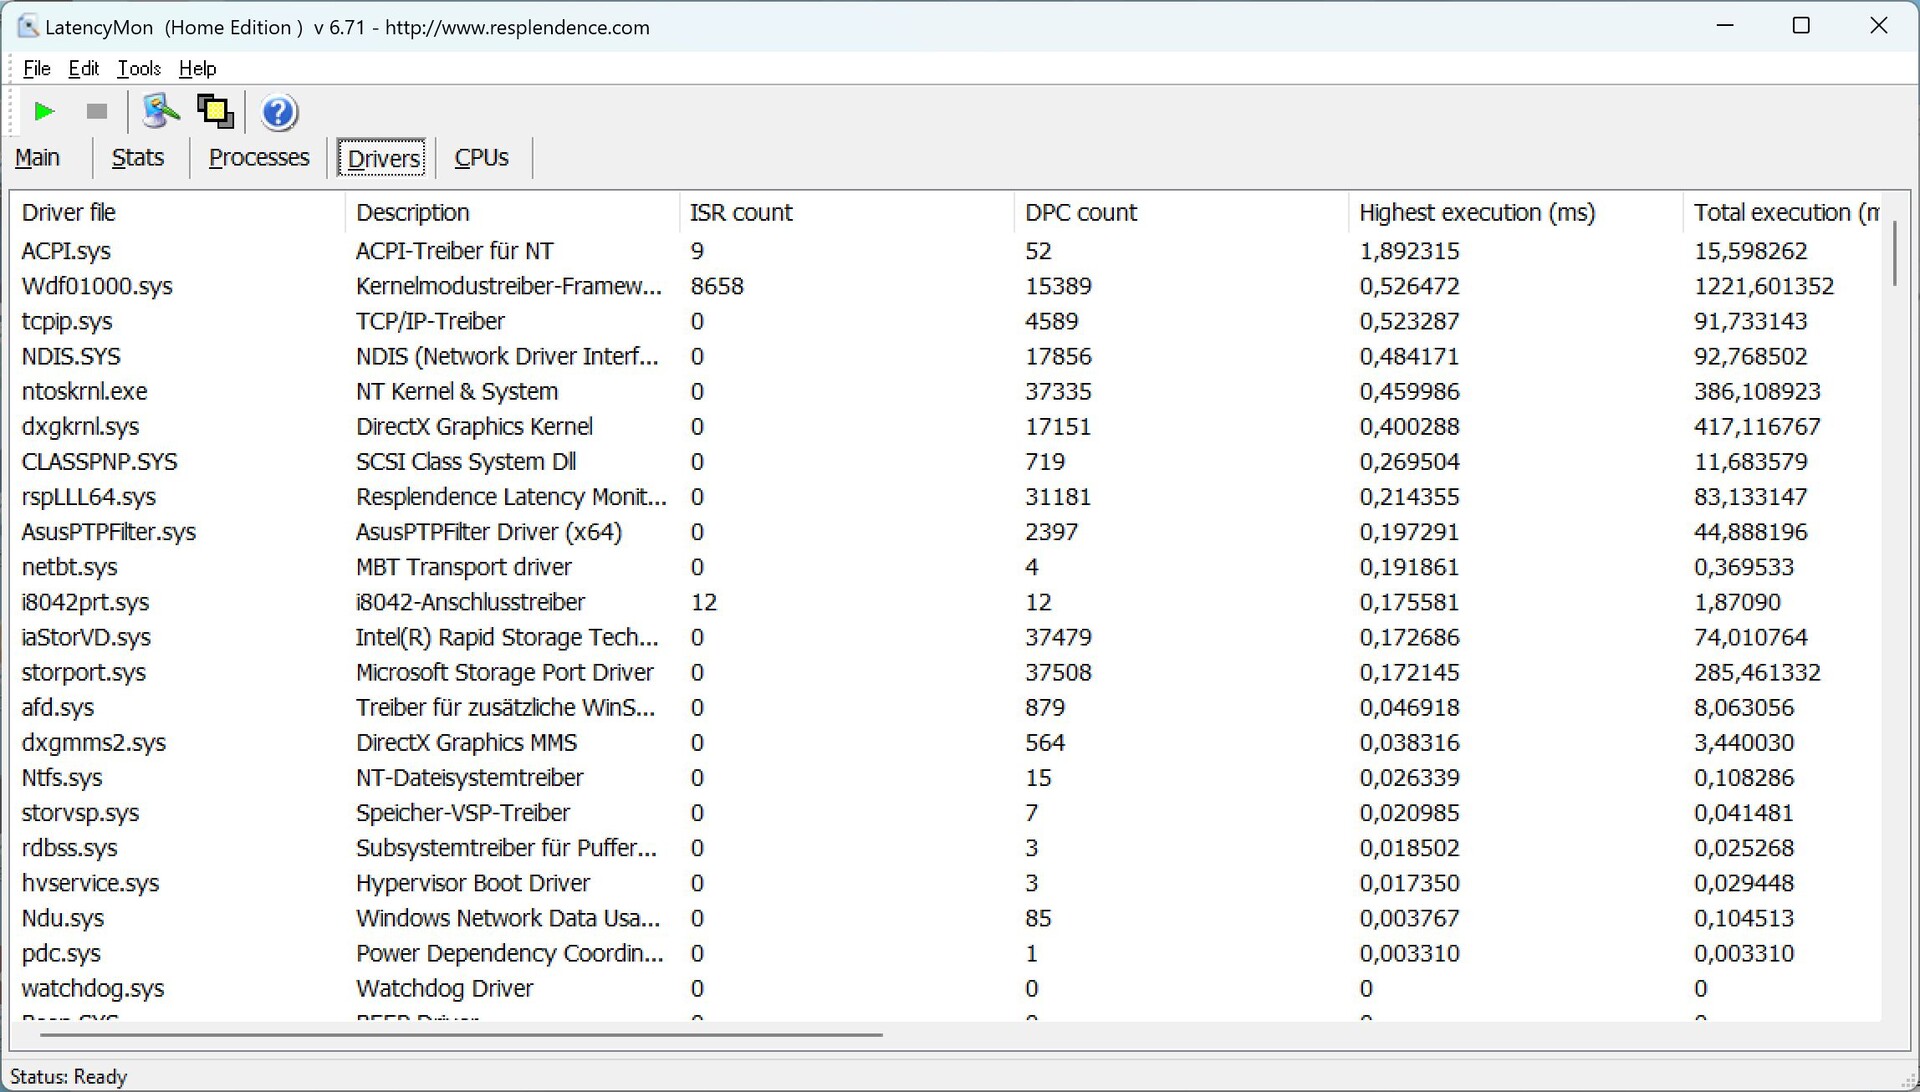
Em nosso teste de latência padronizado (com navegação na Internet, reprodução de vídeo 4K do YouTube e carga da CPU), nossa unidade de teste com a versão correspondente do BIOS mostra algumas pequenas limitações e, portanto, não é incondicionalmente adequada para o uso de aplicativos em tempo real.
| DPC Latencies / LatencyMon - interrupt to process latency (max), Web, Youtube, Prime95 | |
| Samsung Galaxy Book2 Pro 13 NP930XED-KA1DE | |
| Asus ZenBook S13 OLED UX5304 | |
| Lenovo Yoga Slim 7 Carbon 13IAP7-82U9005FGE | |
| Asus Zenbook S 13 OLED | |
| Dell XPS 13 Plus 9320 i7-1280P OLED | |
* ... menor é melhor
Solução de armazenamento
A Asus equipou o Zenbook S 13 com um SSD PCIe 4.0 rápido da Samsung que oferece uma capacidade de armazenamento de 1 TB. Após a primeira inicialização, 903 GB permanecem disponíveis ao usuário para armazenamento. O PM9A1 atinge taxas de transferência acima de 7 GB/s, e o desempenho constante também permanece estável por um longo período, com apenas uma queda mínima no desempenho no final de nosso teste de desempenho constante. Considerando o gabinete fino, esse desempenho é muito bom. Você pode encontrar outros benchmarks de SSD aqui.

* ... menor é melhor
Disk Throttling: DiskSpd Read Loop, Queue Depth 8
Placa gráfica
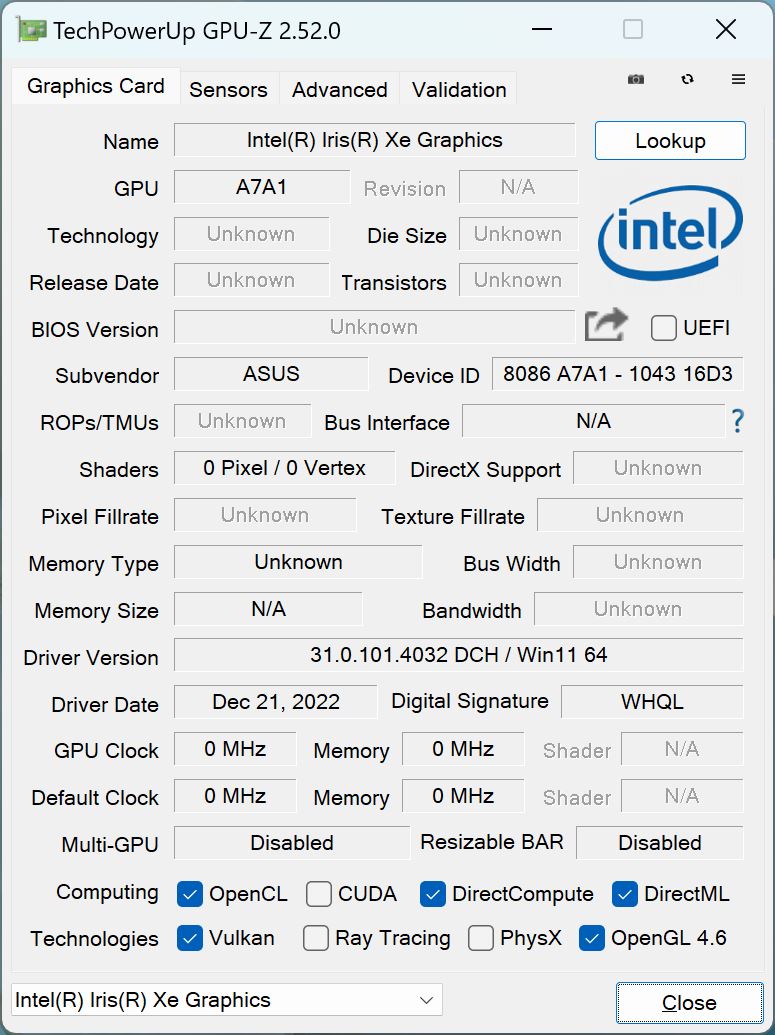
Já conhecemos a placa de vídeo integrada Iris Xe Graphics G7da Intel há algum tempo, e o Zenbook usa a versão mais rápida com 96 EUs e uma velocidade de clock máxima de 1.300 MHz. Para tarefas cotidianas, incluindo a reprodução de vídeos de alta resolução, a iGPU também é suficiente, mas o problema é revelado na comparação com aRadeon 680M do antecessor, que funciona em média 36% mais rápido em nossos testes sintéticos de GPU.
Em nossos benchmarks de jogos, a diferença na resolução de 1080p e em detalhes altos é ainda mais acentuada, e a antiga Radeon 680M é até mesmo 56% mais rápida. Isso significa que o desempenho em jogos do novo Zenbook S 13 é significativamente menor e, se você gosta de jogos, terá que reduzir consideravelmente os detalhes gráficos. Mas, pelo menos, o desempenho gráfico permanece estável mesmo durante sessões de jogos mais longas. No entanto, o desempenho é 12% menor em operação com bateria. Você pode encontrar outros benchmarks de GPU aqui.
| 3DMark 06 Standard Score | 25303 pontos | |
| 3DMark 11 Performance | 6644 pontos | |
| 3DMark Fire Strike Score | 4613 pontos | |
| 3DMark Time Spy Score | 1683 pontos | |
Ajuda | ||
* ... menor é melhor
| The Witcher 3 - 1920x1080 Ultra Graphics & Postprocessing (HBAO+) | |
| Média da turma Subnotebook (13.9 - 34.6, n=12, últimos 2 anos) | |
| Asus Zenbook S 13 OLED | |
| Dell XPS 13 Plus 9320 i7-1280P OLED | |
| Lenovo Yoga Slim 7 Carbon 13IAP7-82U9005FGE | |
| Asus ZenBook S13 OLED UX5304 | |
| Samsung Galaxy Book2 Pro 13 NP930XED-KA1DE | |
| Final Fantasy XV Benchmark - 1920x1080 High Quality | |
| Média da turma Subnotebook (11.6 - 54.5, n=53, últimos 2 anos) | |
| Lenovo Yoga Slim 7 Carbon 13IAP7-82U9005FGE | |
| Asus Zenbook S 13 OLED | |
| Dell XPS 13 Plus 9320 i7-1280P OLED | |
| Asus ZenBook S13 OLED UX5304 | |
| Strange Brigade - 1920x1080 ultra AA:ultra AF:16 | |
| Média da turma Subnotebook (19 - 101.3, n=49, últimos 2 anos) | |
| Asus Zenbook S 13 OLED | |
| Dell XPS 13 Plus 9320 i7-1280P OLED | |
| Asus ZenBook S13 OLED UX5304 | |
| Lenovo Yoga Slim 7 Carbon 13IAP7-82U9005FGE | |
The Witcher 3 FPS Chart
| baixo | média | alto | ultra | |
|---|---|---|---|---|
| GTA V (2015) | 94.8 | 81 | 22.5 | 9.42 |
| The Witcher 3 (2015) | 79 | 51 | 28 | 12.3 |
| Dota 2 Reborn (2015) | 84.8 | 66.7 | 54.9 | 51.1 |
| Final Fantasy XV Benchmark (2018) | 37.4 | 20.5 | 14.9 | |
| X-Plane 11.11 (2018) | 34.6 | 32.1 | 27.3 | |
| Far Cry 5 (2018) | 42 | 25 | 24 | 22 |
| Strange Brigade (2018) | 88.4 | 37.8 | 29.1 | 23.6 |
| F1 2021 (2021) | 94.8 | 45.6 | 35.2 | 24.9 |
| F1 22 (2022) | 41.6 | 36.6 | 27.6 | 20.7 |
Emissões - O Zenbook sofre com o ruído de alta frequência do ventilador
Níveis de ruído
As duas pequenas ventoinhas representam claramente o maior problema do Zenbook S 13. Embora o nível de ruído permaneça basicamente dentro dos limites - desde que você desconsidere o modo Desempenho, que produz um máximo de 47,8 dB(A) - o problema é um ruído de frequência muito alta. Observando o gráfico abaixo, você poderia pensar que o modo Sussurro seria a melhor opção, mas já é possível ouvir claramente o ruído de alta frequência, mesmo com uma velocidade baixa da ventoinha, e ele se torna muito irritante. No modo Standard, parte desse ruído é coberto pelo zumbido. Além disso, os ventiladores também aceleram rapidamente, por exemplo, ao reproduzir um vídeo do YouTube, o que torna as coisas ainda piores. Esse problema definitivamente representaria um ponto de desqualificação para nós.
| Modo silencioso | Modo padrão | Modo de desempenho | |
|---|---|---|---|
| 3DMark 06 | 26 dB(A) | 37,7 dB(A) | 47,8 dB(A) |
| Witcher 3 | 26 dB(A) | 40,1 dB(A) | 47,8 dB(A) |
| Teste de estresse | 26 dB(A) | 40,1 dB(A) | 47,8 dB(A) |
Barulho
| Ocioso |
| 23.3 / 23.3 / 23.3 dB |
| Carga |
| 37.7 / 40.1 dB |
 | ||
30 dB silencioso 40 dB(A) audível 50 dB(A) ruidosamente alto |
||
min: | ||
| Asus ZenBook S13 OLED UX5304 Iris Xe G7 96EUs, i7-1355U, Samsung PM9A1 MZVL21T0HCLR | Asus Zenbook S 13 OLED Radeon 680M, R7 6800U, Samsung PM9A1 MZVL21T0HCLR | Lenovo Yoga Slim 7 Carbon 13IAP7-82U9005FGE Iris Xe G7 96EUs, i7-1260P, Samsung PM9A1 MZVL21T0HCLR | Dell XPS 13 Plus 9320 i7-1280P OLED Iris Xe G7 96EUs, i7-1280P, WDC PC SN810 512GB | Samsung Galaxy Book2 Pro 13 NP930XED-KA1DE Iris Xe G7 80EUs, i5-1240P, Samsung PM991a MZVLQ256HBJD | |
|---|---|---|---|---|---|
| Noise | -1% | -6% | 0% | -5% | |
| desligado / ambiente * (dB) | 23.3 | 24 -3% | 24.2 -4% | 23.4 -0% | 24.6 -6% |
| Idle Minimum * (dB) | 23.3 | 24 -3% | 24.2 -4% | 23.4 -0% | 24.6 -6% |
| Idle Average * (dB) | 23.3 | 24 -3% | 24.2 -4% | 23.4 -0% | 24.6 -6% |
| Idle Maximum * (dB) | 23.3 | 24 -3% | 25.1 -8% | 23.4 -0% | 26.3 -13% |
| Load Average * (dB) | 37.7 | 33.1 12% | 41.9 -11% | 35 7% | 38.4 -2% |
| Witcher 3 ultra * (dB) | 40.1 | 40.2 -0% | 41.9 -4% | 41.6 -4% | |
| Load Maximum * (dB) | 40.1 | 41.7 -4% | 41.9 -4% | 39.9 -0% | 38.7 3% |
* ... menor é melhor
Temperaturas
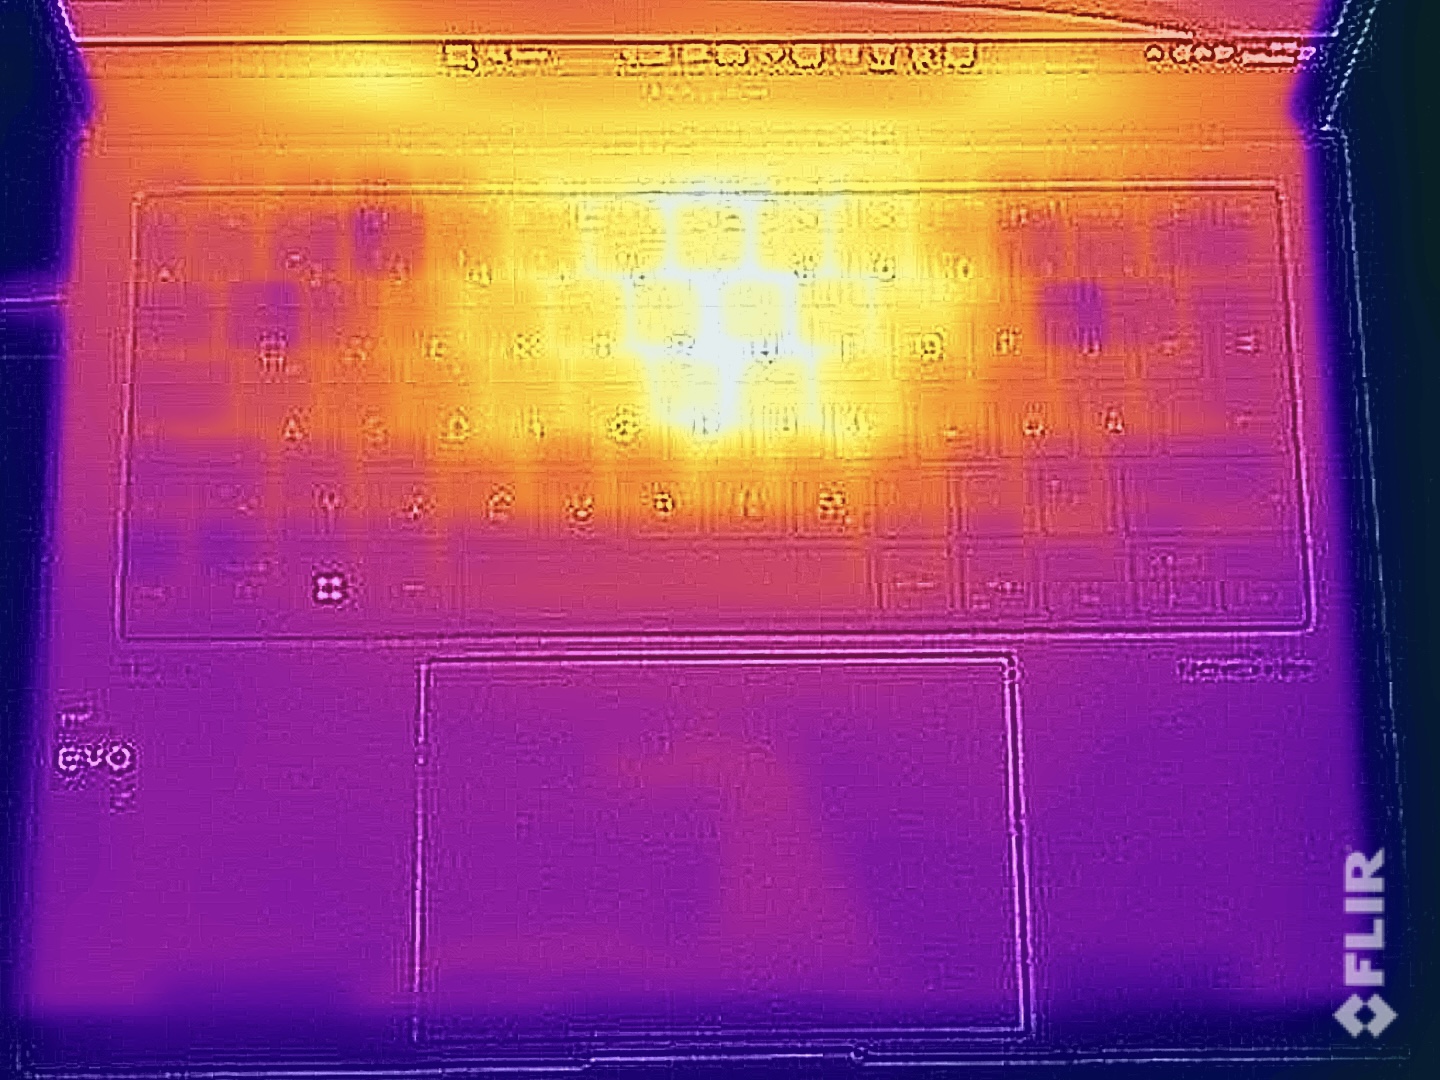
Na operação cotidiana, o Zenbook permanece muito frio. Sob carga, principalmente a área central na parte superior da unidade base esquenta. No entanto, você ainda pode manter o dispositivo no colo sem problemas, já que a unidade de base é levemente elevada. O calor também é perceptível durante a digitação, mas não cria nenhuma limitação.
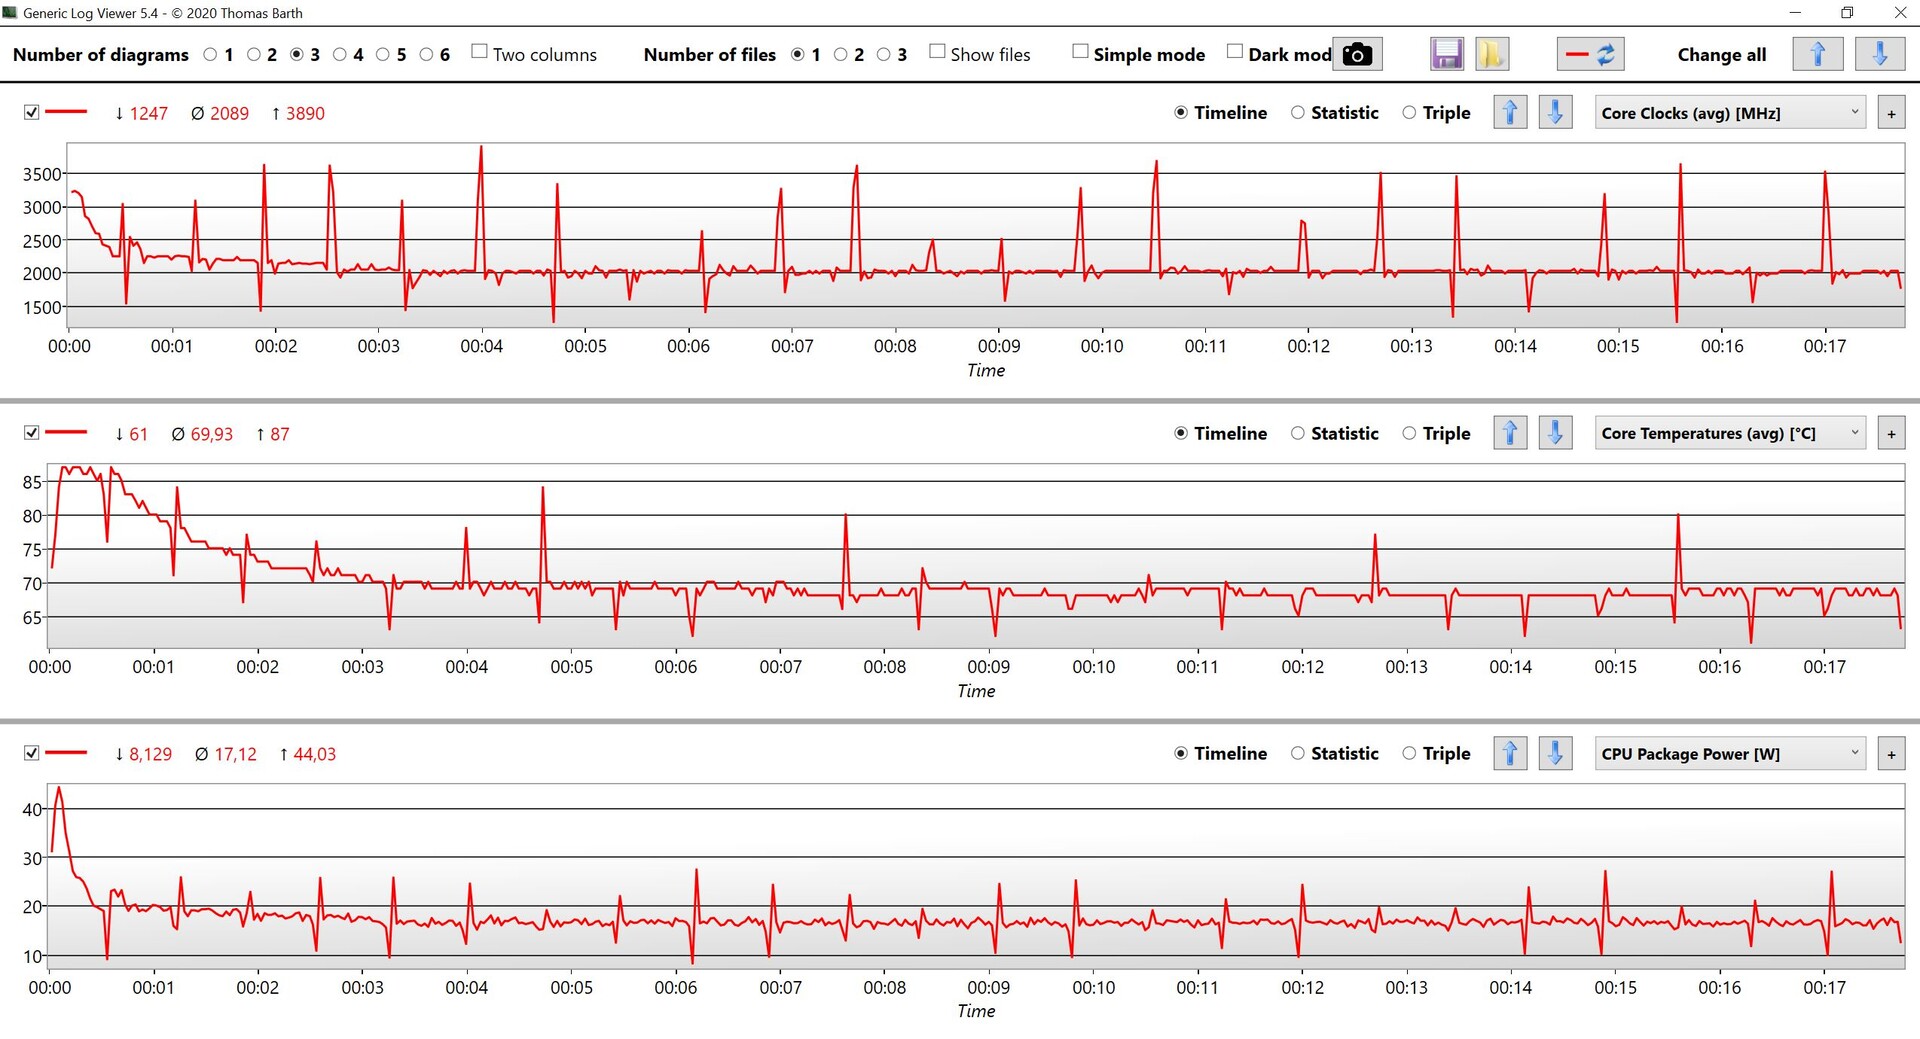
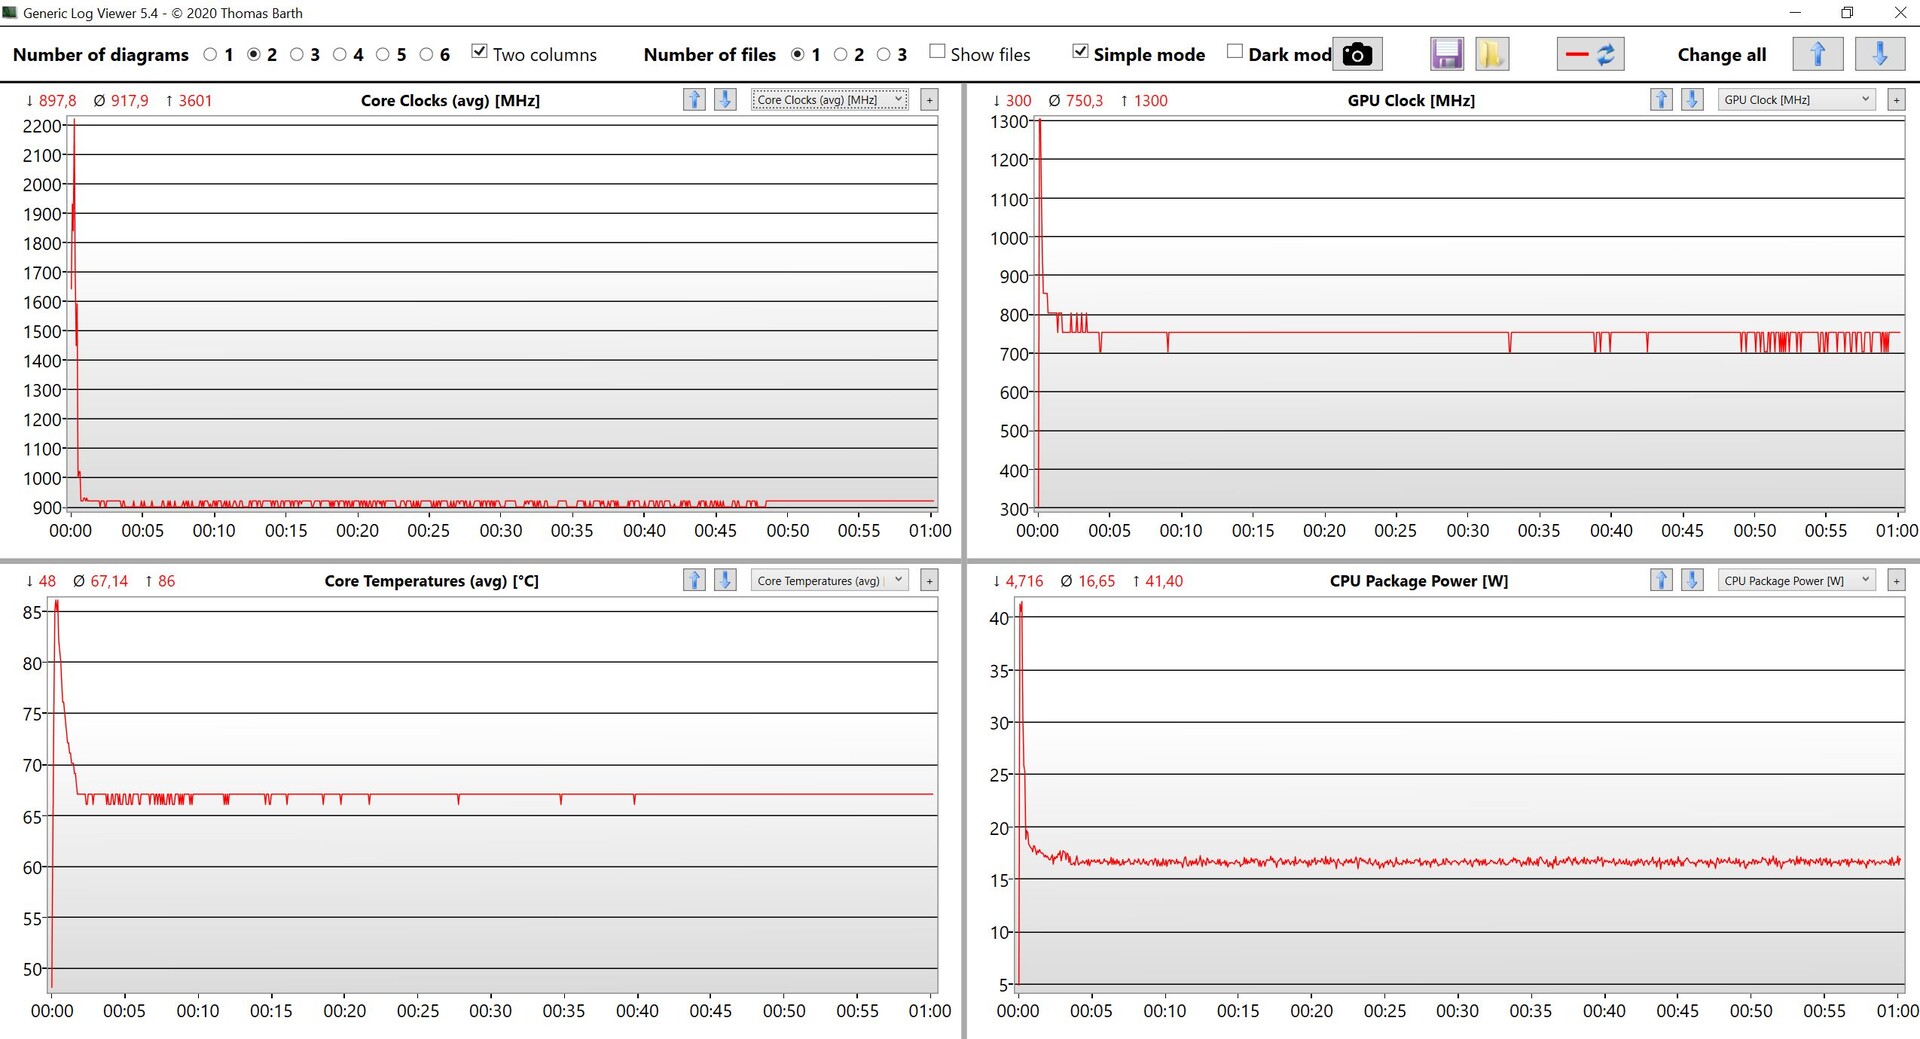
Durante o teste de estresse, observamos brevemente um consumo de mais de 40 watts, mas já depois de alguns segundos, o valor se estabiliza em um pouco menos de 17 watts, permanecendo nesse nível depois disso.
(±) A temperatura máxima no lado superior é 43.1 °C / 110 F, em comparação com a média de 35.9 °C / 97 F , variando de 21.4 a 59 °C para a classe Subnotebook.
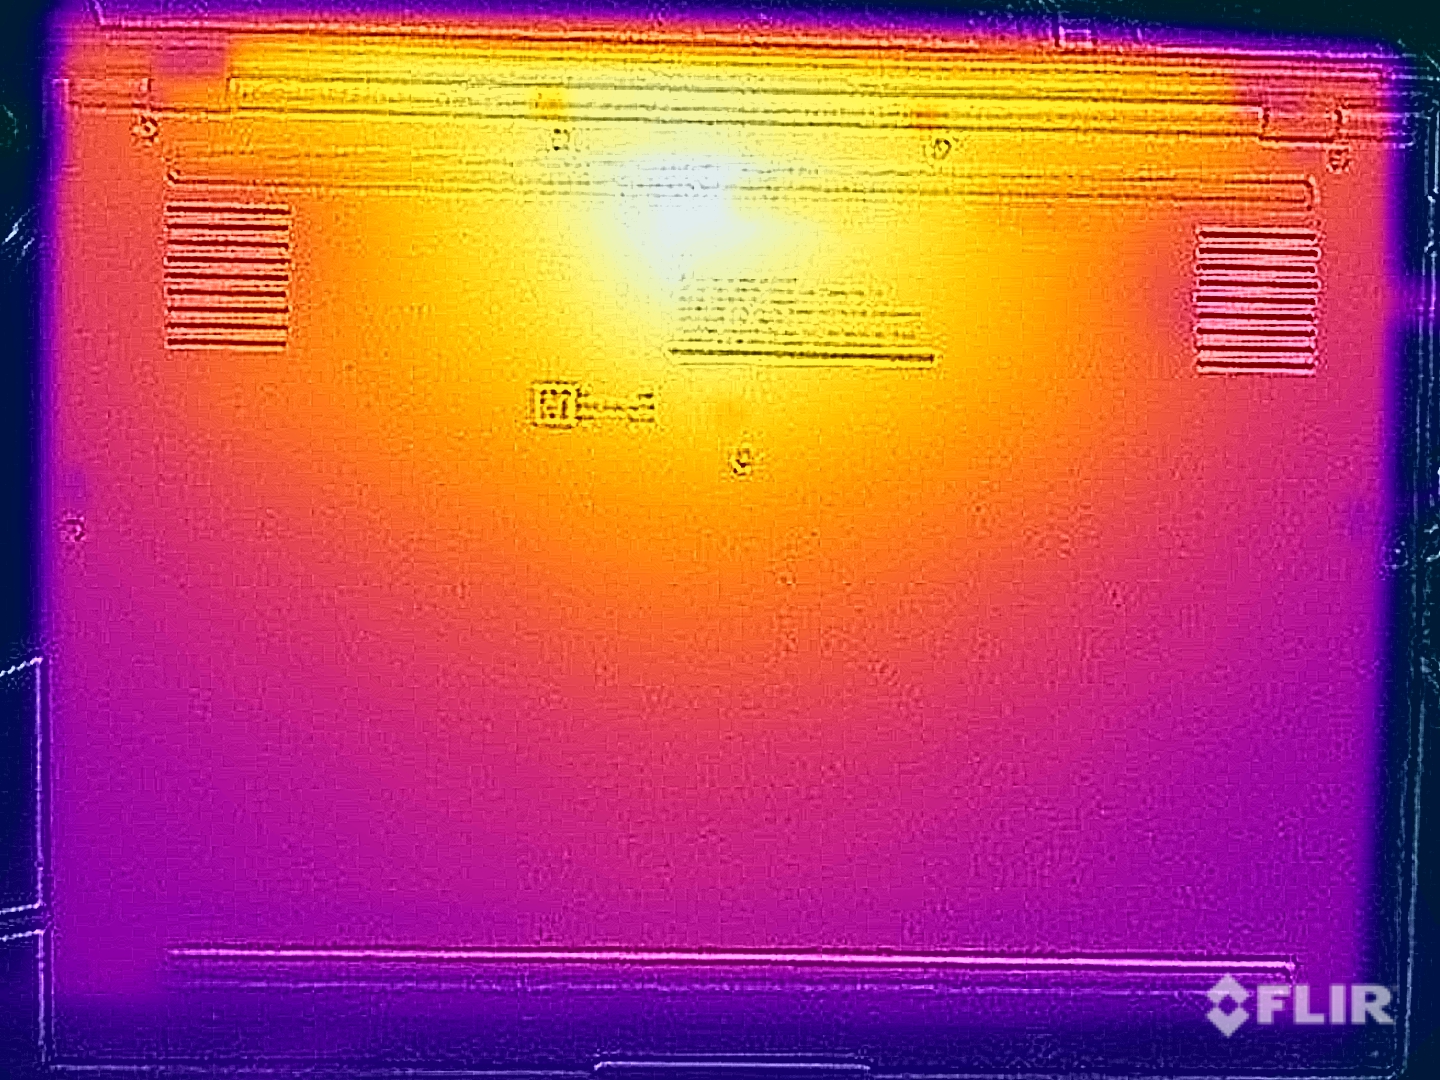
(±) A parte inferior aquece até um máximo de 45 °C / 113 F, em comparação com a média de 39.2 °C / 103 F
(+) Em uso inativo, a temperatura média para o lado superior é 24.6 °C / 76 F, em comparação com a média do dispositivo de 30.8 °C / ### class_avg_f### F.
(±) Jogando The Witcher 3, a temperatura média para o lado superior é 34.8 °C / 95 F, em comparação com a média do dispositivo de 30.8 °C / ## #class_avg_f### F.
(+) Os apoios para as mãos e o touchpad são mais frios que a temperatura da pele, com um máximo de 26.1 °C / 79 F e, portanto, são frios ao toque.
(+) A temperatura média da área do apoio para as mãos de dispositivos semelhantes foi 28.2 °C / 82.8 F (+2.1 °C / 3.8 F).
| Asus ZenBook S13 OLED UX5304 Intel Core i7-1355U, Intel Iris Xe Graphics G7 96EUs | Asus Zenbook S 13 OLED AMD Ryzen 7 6800U, AMD Radeon 680M | Apple MacBook Air M2 10C GPU Apple M2, Apple M2 10-Core GPU | Lenovo Yoga Slim 7 Carbon 13IAP7-82U9005FGE Intel Core i7-1260P, Intel Iris Xe Graphics G7 96EUs | Samsung Galaxy Book2 Pro 13 NP930XED-KA1DE Intel Core i5-1240P, Intel Iris Xe Graphics G7 80EUs | |
|---|---|---|---|---|---|
| Heat | -8% | 4% | -10% | -9% | |
| Maximum Upper Side * (°C) | 43.1 | 47.9 -11% | 44.7 -4% | 43.9 -2% | 47.9 -11% |
| Maximum Bottom * (°C) | 45 | 56.1 -25% | 44.6 1% | 53.1 -18% | 51.3 -14% |
| Idle Upper Side * (°C) | 27.3 | 26.8 2% | 25.1 8% | 28.7 -5% | 28.5 -4% |
| Idle Bottom * (°C) | 27.8 | 27.3 2% | 25.3 9% | 31.6 -14% | 29.6 -6% |
* ... menor é melhor
Alto-falantes
Os dois alto-falantes embutidos oferecem um bom desempenho e podem até ficar muito altos devido à amplificação do software. Mas há uma diferença claramente audível em relação ao atual Apple MacBook Air M2em geral. Entretanto, a qualidade ainda é totalmente suficiente para música de fundo ou vídeos.
Asus ZenBook S13 OLED UX5304 análise de áudio
(+) | os alto-falantes podem tocar relativamente alto (###valor### dB)
Graves 100 - 315Hz
(±) | graves reduzidos - em média 14.4% menor que a mediana
(+) | o baixo é linear (6.6% delta para a frequência anterior)
Médios 400 - 2.000 Hz
(+) | médios equilibrados - apenas 3.2% longe da mediana
(+) | médios são lineares (4.1% delta para frequência anterior)
Altos 2 - 16 kHz
(+) | agudos equilibrados - apenas 2.7% longe da mediana
(+) | os máximos são lineares (3.5% delta da frequência anterior)
Geral 100 - 16.000 Hz
(+) | o som geral é linear (12.8% diferença em relação à mediana)
Comparado com a mesma classe
» 19% de todos os dispositivos testados nesta classe foram melhores, 4% semelhantes, 76% piores
» O melhor teve um delta de 5%, a média foi 18%, o pior foi 53%
Comparado com todos os dispositivos testados
» 12% de todos os dispositivos testados foram melhores, 3% semelhantes, 85% piores
» O melhor teve um delta de 4%, a média foi 23%, o pior foi 134%
Apple MacBook Air M2 10C GPU análise de áudio
(+) | os alto-falantes podem tocar relativamente alto (###valor### dB)
Graves 100 - 315Hz
(±) | graves reduzidos - em média 12.2% menor que a mediana
(±) | a linearidade dos graves é média (12.6% delta para a frequência anterior)
Médios 400 - 2.000 Hz
(+) | médios equilibrados - apenas 1.1% longe da mediana
(+) | médios são lineares (3.1% delta para frequência anterior)
Altos 2 - 16 kHz
(+) | agudos equilibrados - apenas 2.4% longe da mediana
(+) | os máximos são lineares (1.9% delta da frequência anterior)
Geral 100 - 16.000 Hz
(+) | o som geral é linear (9.5% diferença em relação à mediana)
Comparado com a mesma classe
» 5% de todos os dispositivos testados nesta classe foram melhores, 2% semelhantes, 93% piores
» O melhor teve um delta de 5%, a média foi 18%, o pior foi 53%
Comparado com todos os dispositivos testados
» 4% de todos os dispositivos testados foram melhores, 1% semelhantes, 95% piores
» O melhor teve um delta de 4%, a média foi 23%, o pior foi 134%
Gerenciamento de energia - Um Zenbook de longa duração
Consumo de energia
Durante a operação ociosa, o novo modelo é um pouco mais eficiente do que seu Antecessor da AMD. Medimos os dois modelos com o mesmo papel de parede e o modo escuro do Windows. Com conteúdo de imagem brilhante, o consumo de energia do painel OLED aumenta. Esse também é o caso ao reproduzir vídeos HDR, em que os valores de pico podem chegar a mais de 20 watts com brilho total.
Durante o teste de estresse, medimos um máximo de quase 60 watts no início, mas já depois de alguns segundos, o consumo se estabiliza em torno de 30 watts. O carregador de 65 watts incluído é totalmente suficiente.
| desligado | |
| Ocioso | |
| Carga |
|
Key:
min: | |
| Asus ZenBook S13 OLED UX5304 i7-1355U, Iris Xe G7 96EUs, Samsung PM9A1 MZVL21T0HCLR, OLED, 2880x1800, 13.3" | Asus Zenbook S 13 OLED R7 6800U, Radeon 680M, Samsung PM9A1 MZVL21T0HCLR, OLED, 2880x1800, 13.3" | Apple MacBook Air M2 10C GPU M2, M2 10-Core GPU, Apple SSD AP1024Z, IPS, 2560x1664, 13.6" | Lenovo Yoga Slim 7 Carbon 13IAP7-82U9005FGE i7-1260P, Iris Xe G7 96EUs, Samsung PM9A1 MZVL21T0HCLR, IPS, 2560x1600, 13.3" | Dell XPS 13 Plus 9320 i7-1280P OLED i7-1280P, Iris Xe G7 96EUs, WDC PC SN810 512GB, OLED, 3456x2160, 13.4" | Samsung Galaxy Book2 Pro 13 NP930XED-KA1DE i5-1240P, Iris Xe G7 80EUs, Samsung PM991a MZVLQ256HBJD, OLED, 1920x1080, 13.3" | Média Intel Iris Xe Graphics G7 96EUs | Média da turma Subnotebook | |
|---|---|---|---|---|---|---|---|---|
| Power Consumption | -11% | 13% | -29% | -33% | 5% | -13% | 8% | |
| Idle Minimum * (Watt) | 5.8 | 4.8 17% | 1.9 67% | 6.9 -19% | 6.5 -12% | 4.3 26% | 5.51 ? 5% | 3.73 ? 36% |
| Idle Average * (Watt) | 8.5 | 8.7 -2% | 9.6 -13% | 10.3 -21% | 7.8 8% | 6 29% | 8.66 ? -2% | 6.51 ? 23% |
| Idle Maximum * (Watt) | 8.8 | 10.1 -15% | 9.7 -10% | 10.9 -24% | 13 -48% | 8.8 -0% | 10.9 ? -24% | 7.88 ? 10% |
| Load Average * (Watt) | 35.1 | 45.6 -30% | 32.4 8% | 49.2 -40% | 56.6 -61% | 36 -3% | 45.6 ? -30% | 42.3 ? -21% |
| Witcher 3 ultra * (Watt) | 27.6 | 42.4 -54% | 30.8 -12% | 45.3 -64% | 49.2 -78% | 32.9 -19% | ||
| Load Maximum * (Watt) | 59.5 | 49.5 17% | 35.7 40% | 62.5 -5% | 63 -6% | 60 -1% | 67.8 ? -14% | 64.8 ? -9% |
* ... menor é melhor
Power Consumption The Witcher 3 / Stress Test
Power Consumption With External Monitor
Duração da bateria
Com 63 Wh, a capacidade da bateria é um pouco menor do que a do modelo antigo. Em nosso teste de vídeo a 150 cd/m² (correspondente a 74% do brilho máximo do SDR em nossa unidade de teste), a duração da bateria de quase 14 horas ainda é um resultado muito bom. O teste de WLAN dura mais de 11 horas a 150 cd/m², e ainda um pouco mais de 8 horas com brilho total. Um vídeo HDR do YouTube dura 4,5 horas com brilho total. No geral, esses são resultados muito bons para o Zenbook fino.
| Asus ZenBook S13 OLED UX5304 i7-1355U, Iris Xe G7 96EUs, 63 Wh | Asus Zenbook S 13 OLED R7 6800U, Radeon 680M, 67 Wh | Apple MacBook Air M2 10C GPU M2, M2 10-Core GPU, 52.6 Wh | Lenovo Yoga Slim 7 Carbon 13IAP7-82U9005FGE i7-1260P, Iris Xe G7 96EUs, 50.2 Wh | Dell XPS 13 Plus 9320 i7-1280P OLED i7-1280P, Iris Xe G7 96EUs, 55 Wh | Samsung Galaxy Book2 Pro 13 NP930XED-KA1DE i5-1240P, Iris Xe G7 80EUs, 63 Wh | Média da turma Subnotebook | |
|---|---|---|---|---|---|---|---|
| Duração da bateria | -3% | 22% | -37% | -49% | -3% | 6% | |
| H.264 (h) | 13.8 | 15.2 10% | 15.8 14% | 10.5 -24% | 11.6 -16% | 15.3 ? 11% | |
| WiFi v1.3 (h) | 11.3 | 9.2 -19% | 14.7 30% | 7.5 -34% | 5.8 -49% | 11.6 3% | 14 ? 24% |
| Load (h) | 2.4 | 2.4 0% | 1.1 -54% | 2.5 4% | 1.998 ? -17% |
Pro
Contra
Veredicto - Muita luz, mas também uma sombra escura
O novo Zenbook S 13 nos deixa com sentimentos mistos, especialmente porque o modelo do ano passadoera tão bom. A Asus reformulou completamente o dispositivo, tornando o laptop visivelmente mais fino. O resultado também tem uma boa aparência e o gabinete causa uma ótima impressão, especialmente em termos de estabilidade. A nova superfície de cerâmica plasmática é ótima e não há problemas com impressões digitais. Além disso, ele agora inclui algumas das conexões conhecidas, como uma porta HDMI e uma conexão USB-A normal, o que é uma boa conquista em um dispositivo tão fino.
No entanto, o pressionamento de tecla teve de ser reduzido em 0,3 mm (~0,012 pol.) para que o design ficasse mais fino. Embora o teclado continue sendo decente, o Zenbook antigo oferecia uma experiência de digitação mais confortável. Além disso, o resfriamento agora é mais fraco, e mesmo que o novo Intel Core i7-1355U Raptor Lake ofereça um desempenho de núcleo único ligeiramente superior, ele foi claramente superado pelo processador AMD Ryzen 7 6800U do ano passado nos cenários de vários núcleos e, principalmente, em termos de iGPU.
A tela OLED continua a oferecer uma excelente qualidade de imagem, alcançando uma reprodução de cores muito precisa já no estado de entrega. Além disso, a Asus é atualmente o único fabricante que oferece uma solução de software para evitar a prejudicial cintilação PWM, permitindo o escurecimento DC mesmo em configurações de baixo brilho.
O novo Asus Zenbook S 13 ficou significativamente mais fino, mas o novo processador Intel também oferece um desempenho geral inferior ao do seu antecessor AMD. Mas o maior problema é o ruído de alta frequência da ventoinha, mesmo em baixas velocidades.
O maior problema do novo Zenbook é representado pelos ventiladores que produzem um ruído de frequência muito alta, mesmo em níveis baixos de velocidade. Isso é simplesmente irritante, mesmo durante as tarefas diárias. Portanto, também reduzimos a avaliação nessa categoria. Embora o desempenho seja bom em muitas áreas, não podemos recomendar o novo modelo por esse motivo. Aqueles que não se importam com um dispositivo 3 mm (~0,12 pol.) mais espesso devem dar uma olhada no o Zenbook S 13 do ano passadodo ano passado ou aguardar a versão atualizada de 2022 com o novo chip Ryzen Zen4.
Preço e disponibilidade
O novo Zenbook S 13 OLED está atualmente disponível na Amazon por US$ 1.529, por exemplo.
Asus ZenBook S13 OLED UX5304
- 04/29/2023 v7 (old)
Andreas Osthoff
Transparência
A seleção dos dispositivos a serem analisados é feita pela nossa equipe editorial. A amostra de teste foi fornecida ao autor como empréstimo pelo fabricante ou varejista para fins desta revisão. O credor não teve influência nesta revisão, nem o fabricante recebeu uma cópia desta revisão antes da publicação. Não houve obrigação de publicar esta revisão. Como empresa de mídia independente, a Notebookcheck não está sujeita à autoridade de fabricantes, varejistas ou editores.
É assim que o Notebookcheck está testando
Todos os anos, o Notebookcheck analisa de forma independente centenas de laptops e smartphones usando procedimentos padronizados para garantir que todos os resultados sejam comparáveis. Desenvolvemos continuamente nossos métodos de teste há cerca de 20 anos e definimos padrões da indústria no processo. Em nossos laboratórios de teste, equipamentos de medição de alta qualidade são utilizados por técnicos e editores experientes. Esses testes envolvem um processo de validação em vários estágios. Nosso complexo sistema de classificação é baseado em centenas de medições e benchmarks bem fundamentados, o que mantém a objetividade.Price comparison

