Análise do mini PC Maxtang MTN-FP750: O AMD Ryzen 7 7735HS é prejudicado por uma configuração mal concebida

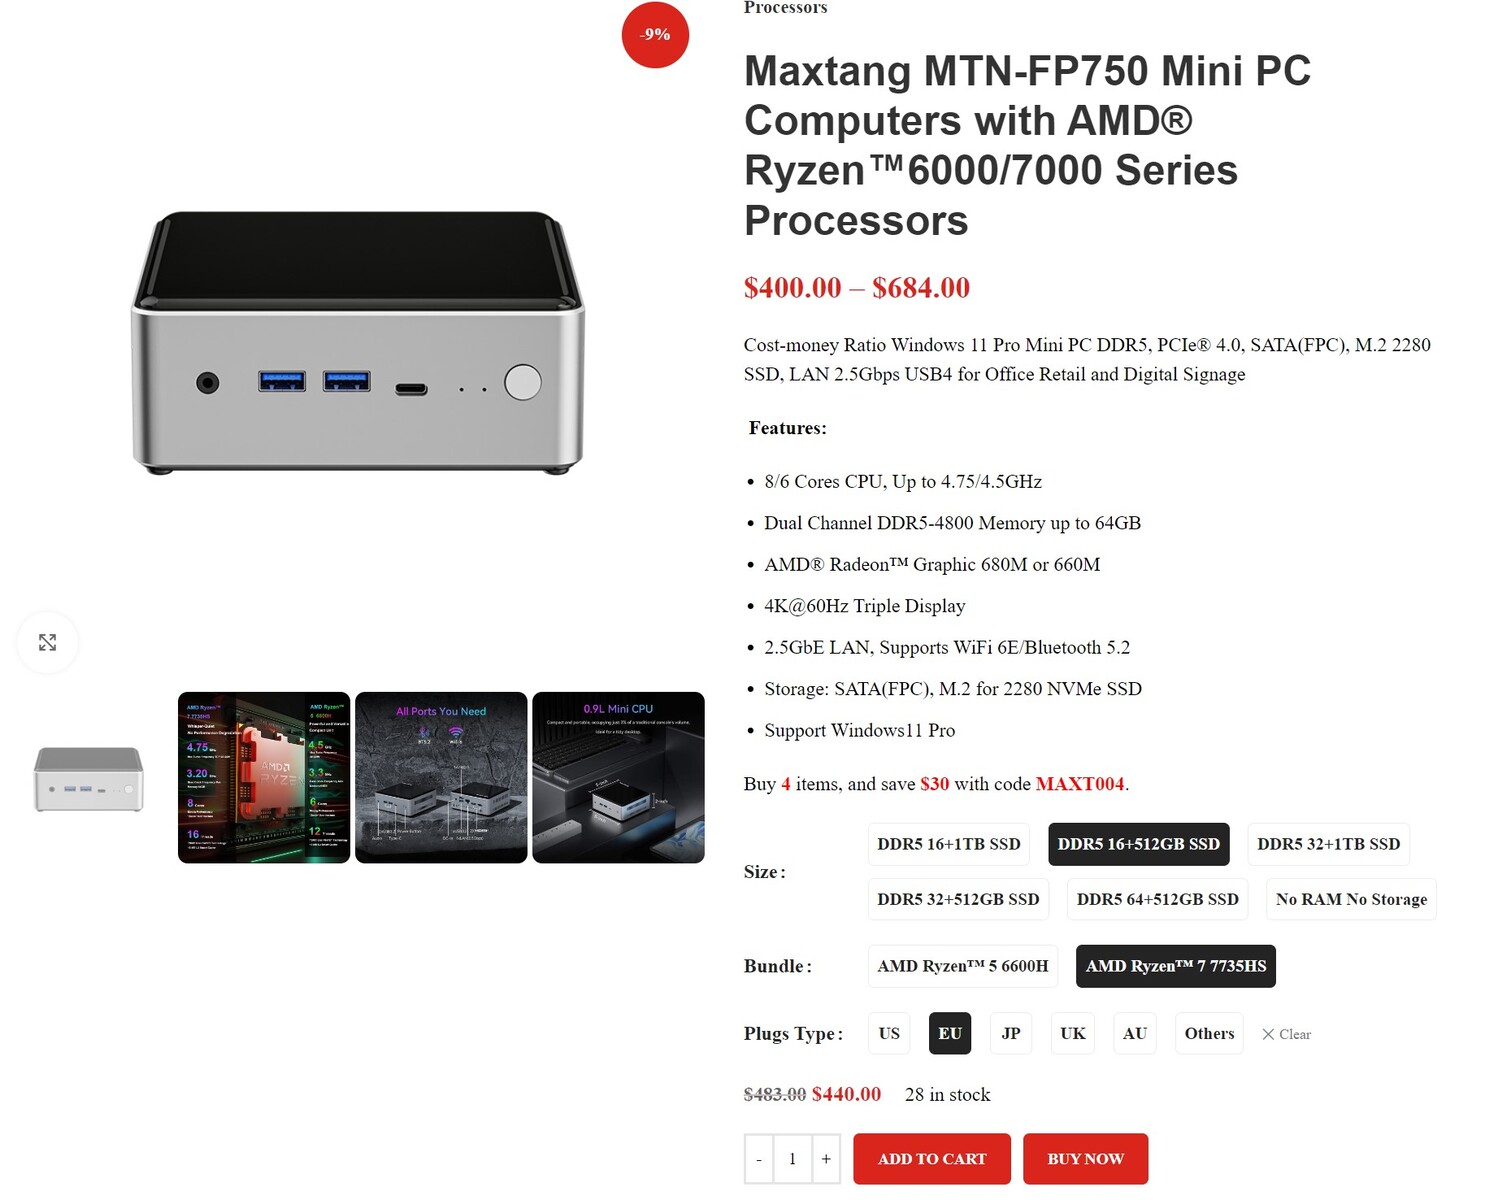
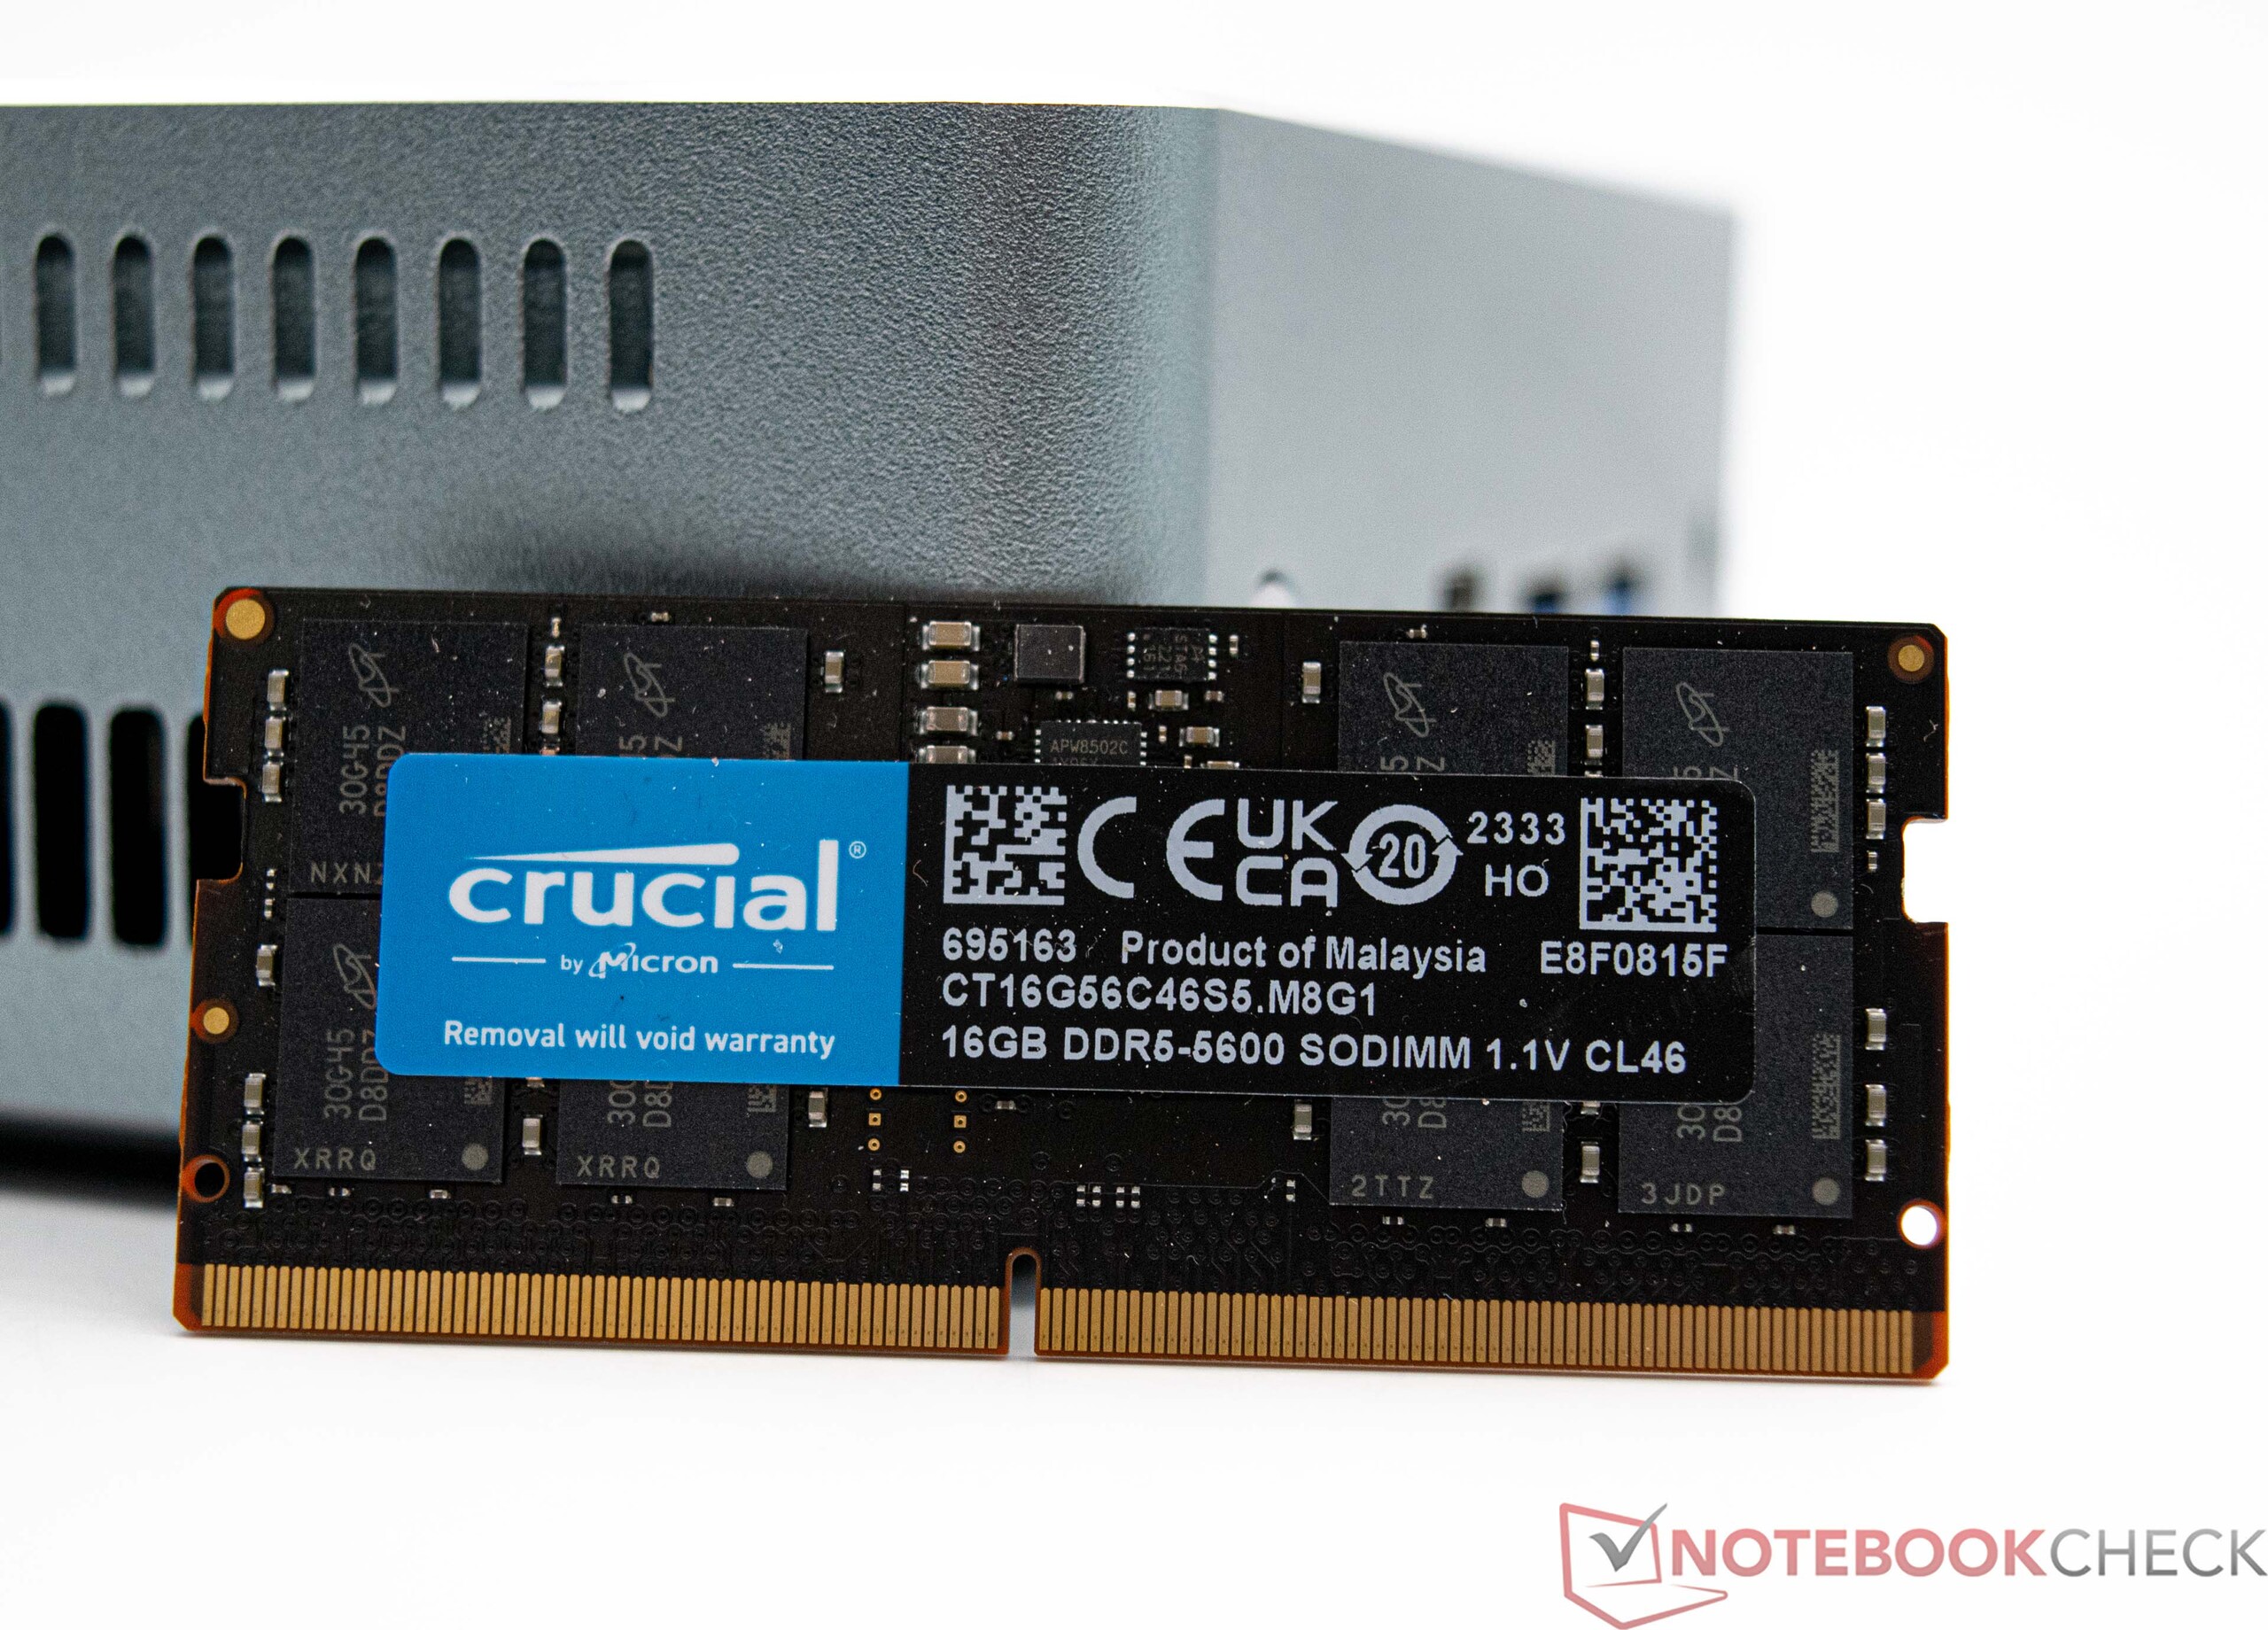
A Maxtang é uma fabricante chinesa de sistemas que vende soluções industriais especiais na forma de sistemas incorporados, bem como mini PCs projetados para uso em escritórios. Nesta análise, vamos nos concentrar no Maxtang MTN-FP750, que custa US$ 440. O sistema é composto por um processador AMD Ryzen 7 7735HS e 16 GB de RAM DDR5, além de um SSD de 512 GB. Como alternativa, um AMD Ryzen 5 6600H também está disponível. Além disso, o mini PC pode ser encomendado com RAM adicional e um SSD maior. A Maxtang também oferece uma opção barebone, porém, ela só vem com o AMD Ryzen 7 7735HS.
Nesta análise, o Maxtang MTN-FP750 se compara aos mini PCs atuais. Uma lista mais detalhada dos dispositivos de comparação encontrados nesta análise está resumida na tabela a seguir.
Possíveis concorrentes em comparação
Avaliação | Data | Modelo | Peso | Altura | Preço |
|---|---|---|---|---|---|
| 79.5 % v7 (old) | 02/2024 | Maxtang MTN-FP750 R7 7735HS, Radeon 680M | 601 g | 52 mm | |
| 85.1 % v7 (old) | 01/2023 | Minisforum Neptune Series NAD9 i9-12900H, Iris Xe G7 96EUs | 1.2 kg | 66 mm | |
| 82.8 % v7 (old) | 07/2023 | Geekom AS 6, R9 6900HX R9 6900HX, Radeon 680M | 753 g | 58 mm | |
| 82.3 % v7 (old) | 05/2023 | Geekom Mini IT12 i7-1260P, Iris Xe G7 96EUs | 572 g | 45.6 mm | |
| 81.2 % v7 (old) | 10/2023 | Geekom A5 R7 5800H, Vega 8 | 555 g | 49.2 mm | |
| 81.9 % v7 (old) | 05/2023 | Minisforum Venus Series NAB6 i7-12650H, UHD Graphics 64EUs | 616 g | 55 mm | |
| 78.4 % v7 (old) | 01/2024 | NiPoGi AD08 i7-12650H, UHD Graphics 64EUs | 878 g | 188.5 mm |
O Maxtang MTN-FP750 em detalhes
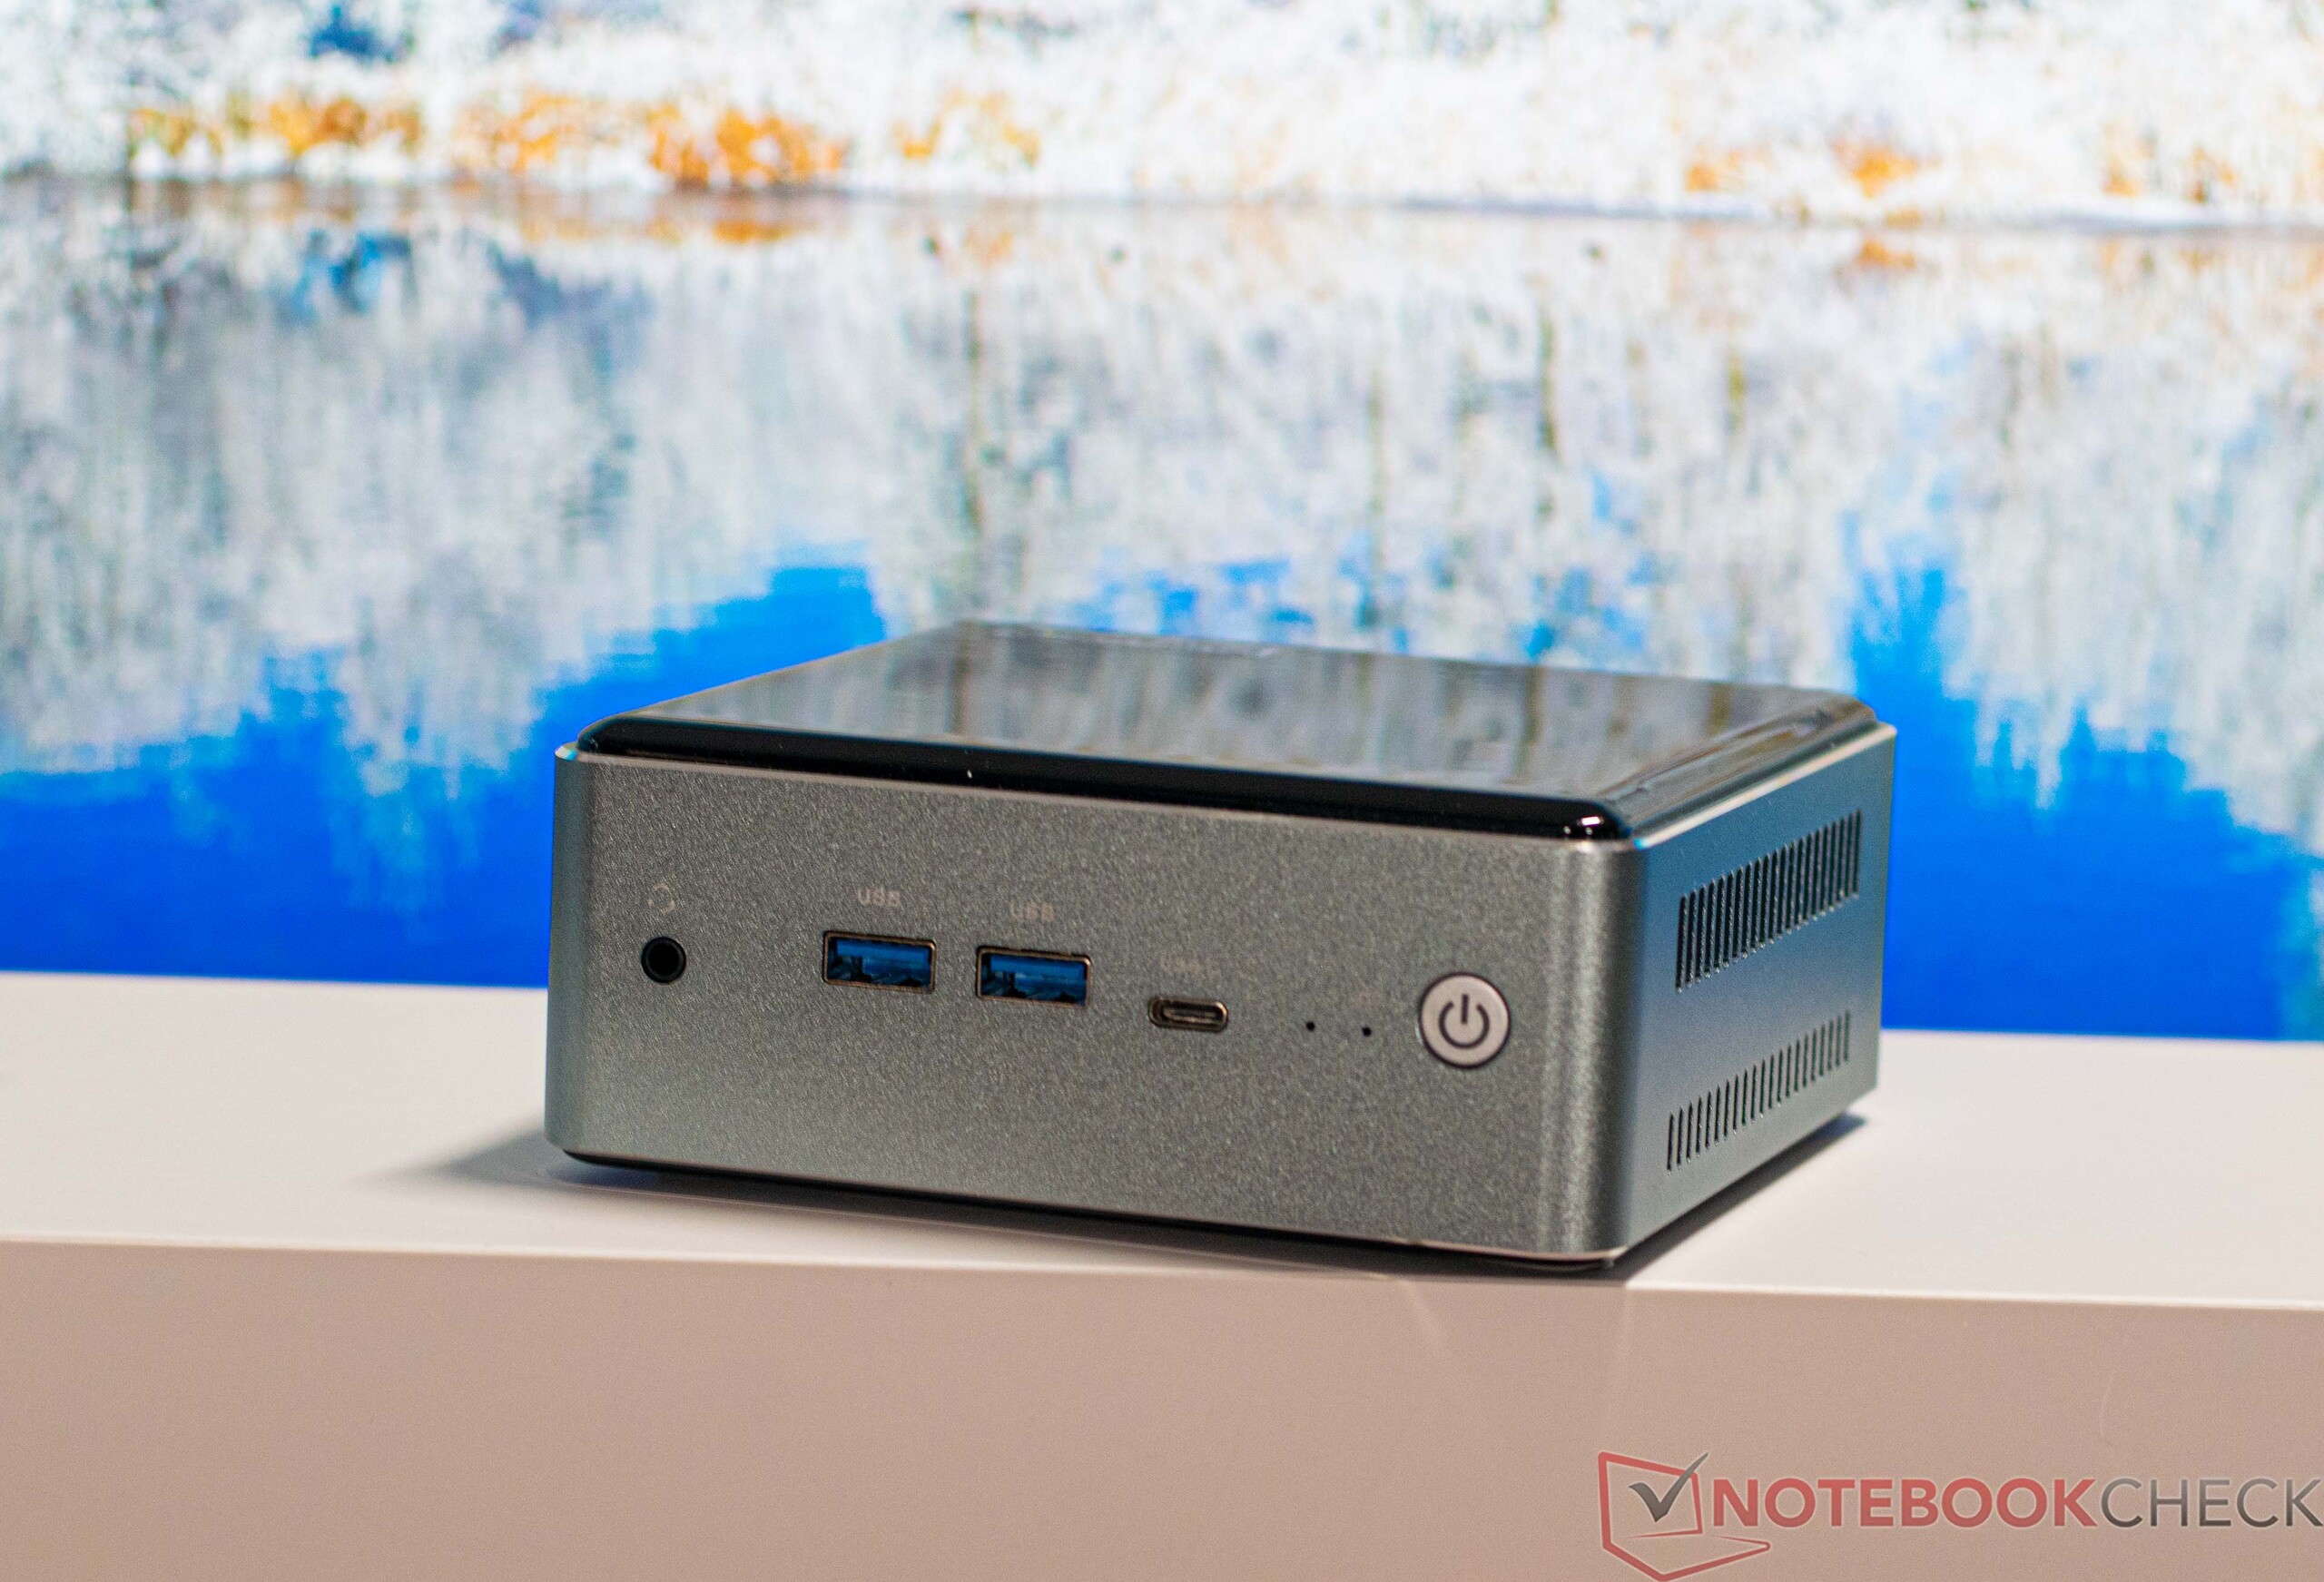
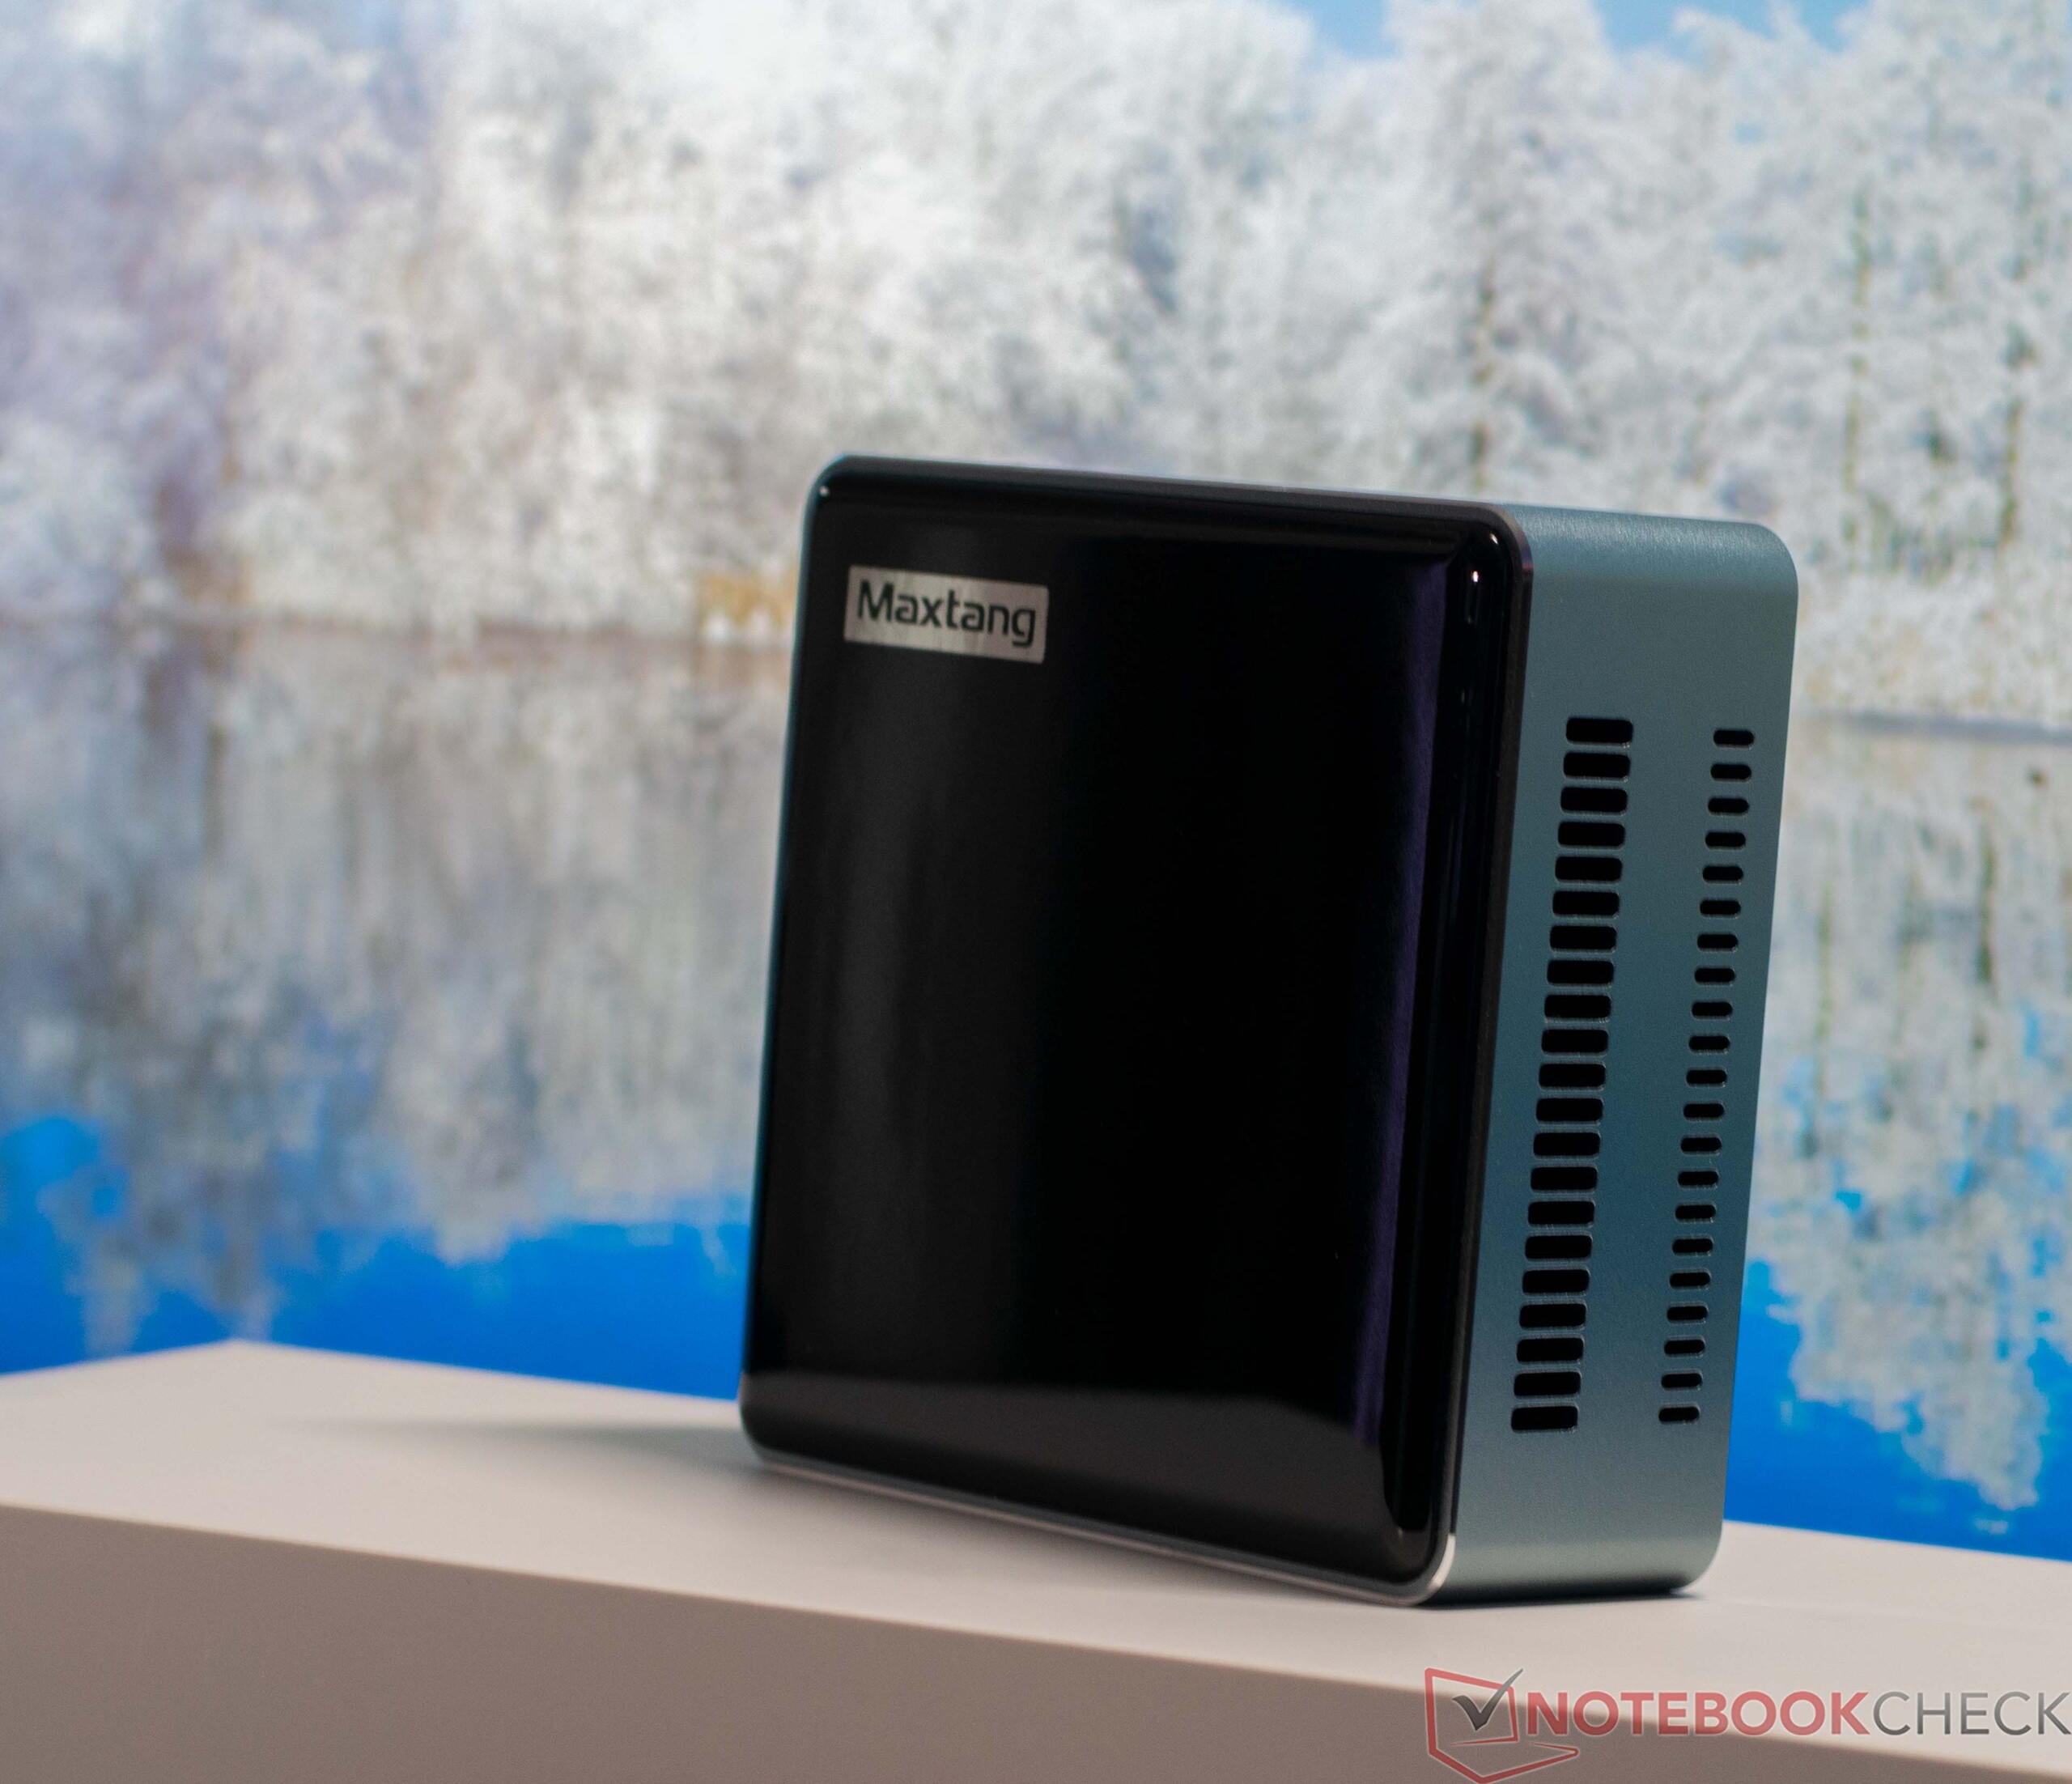
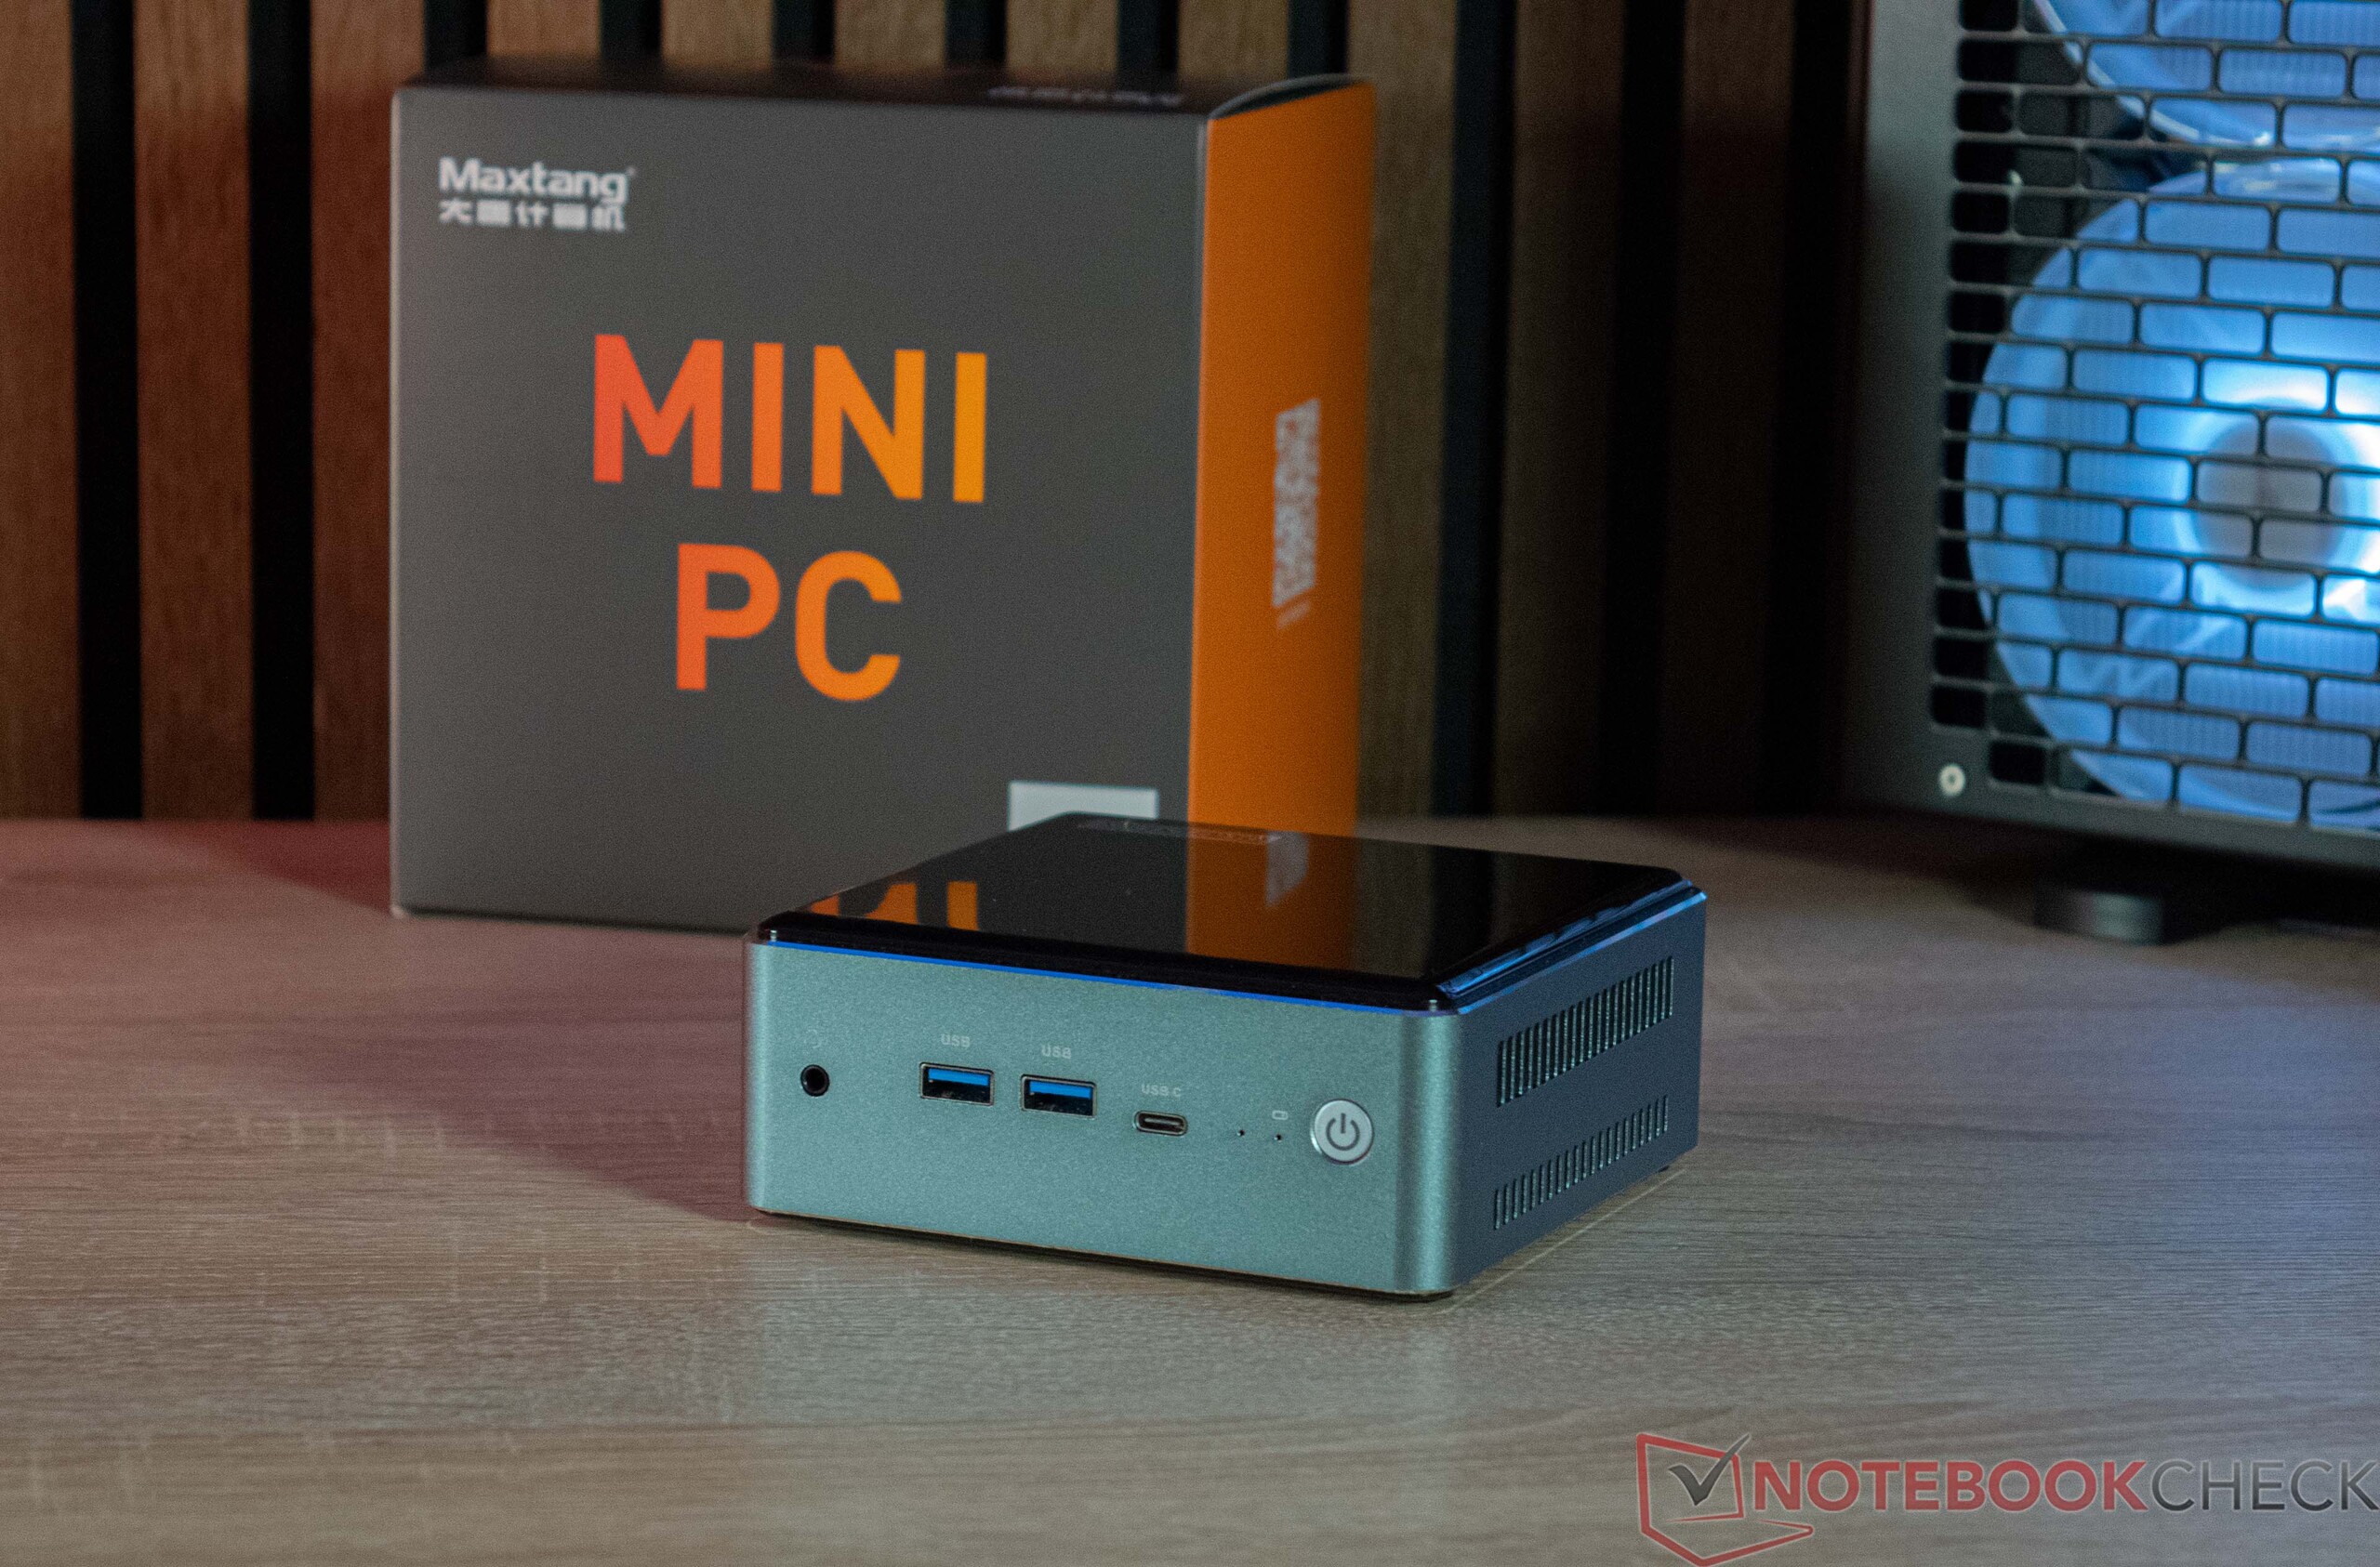

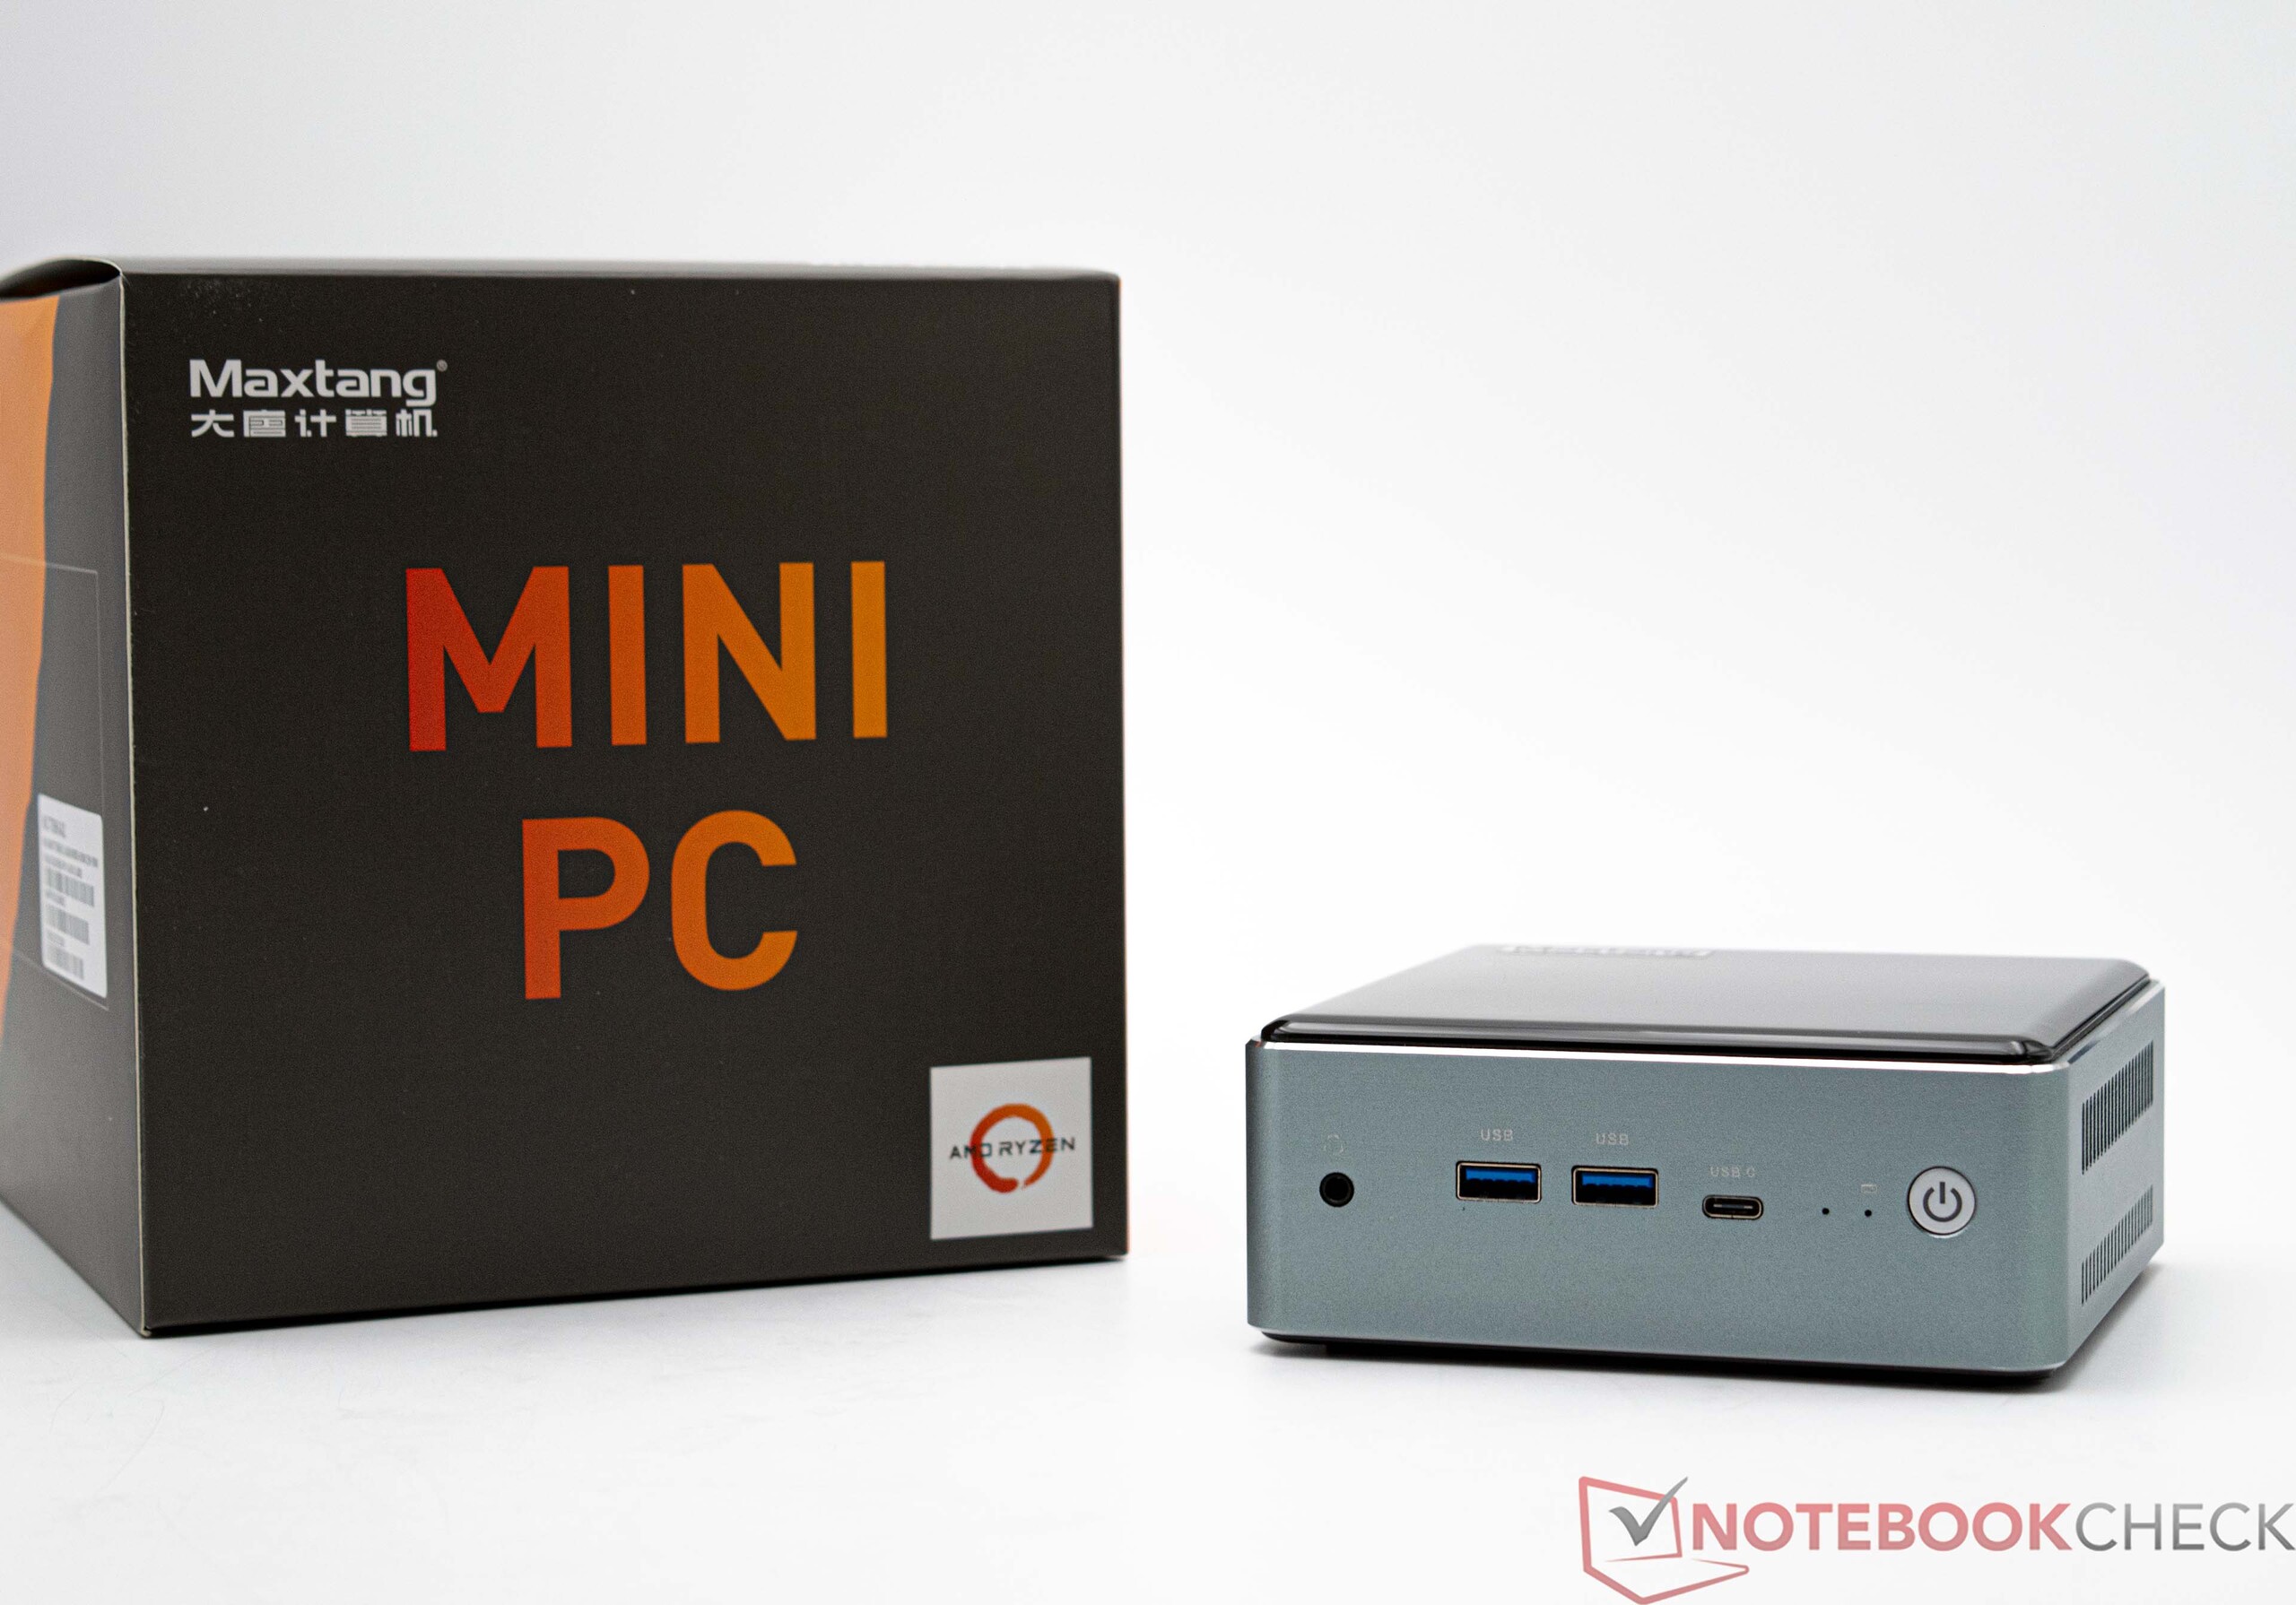
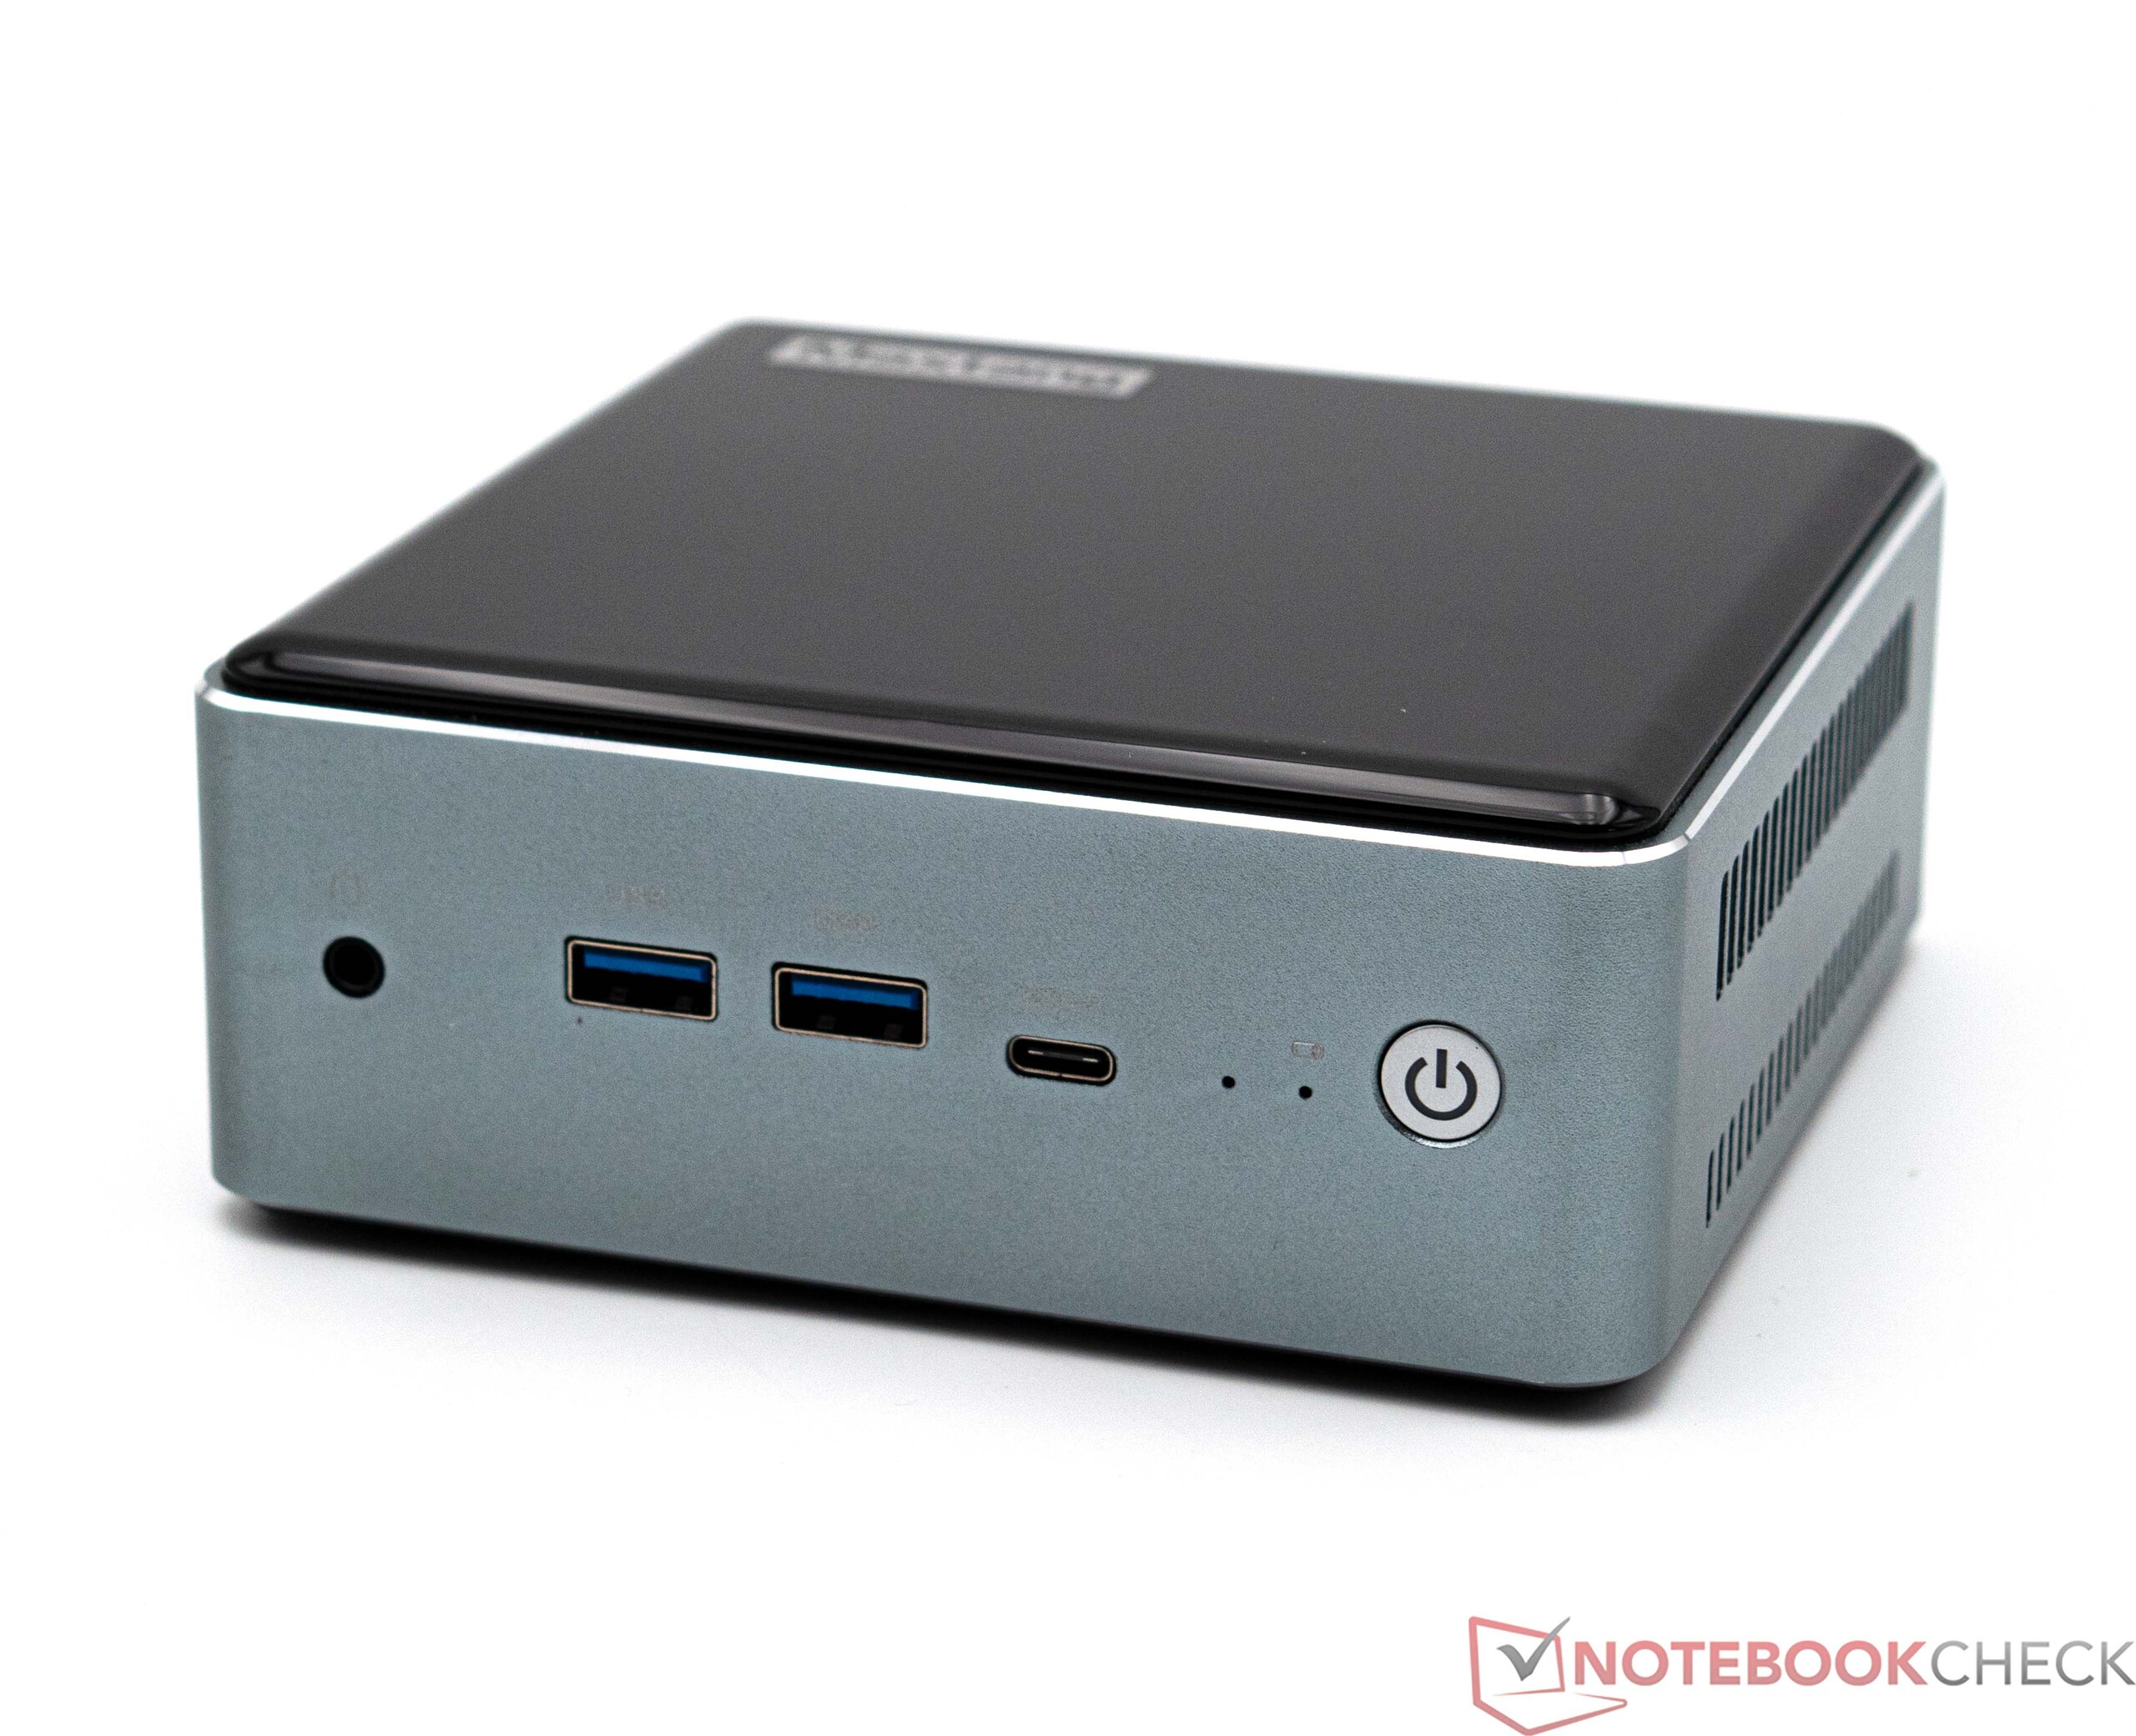
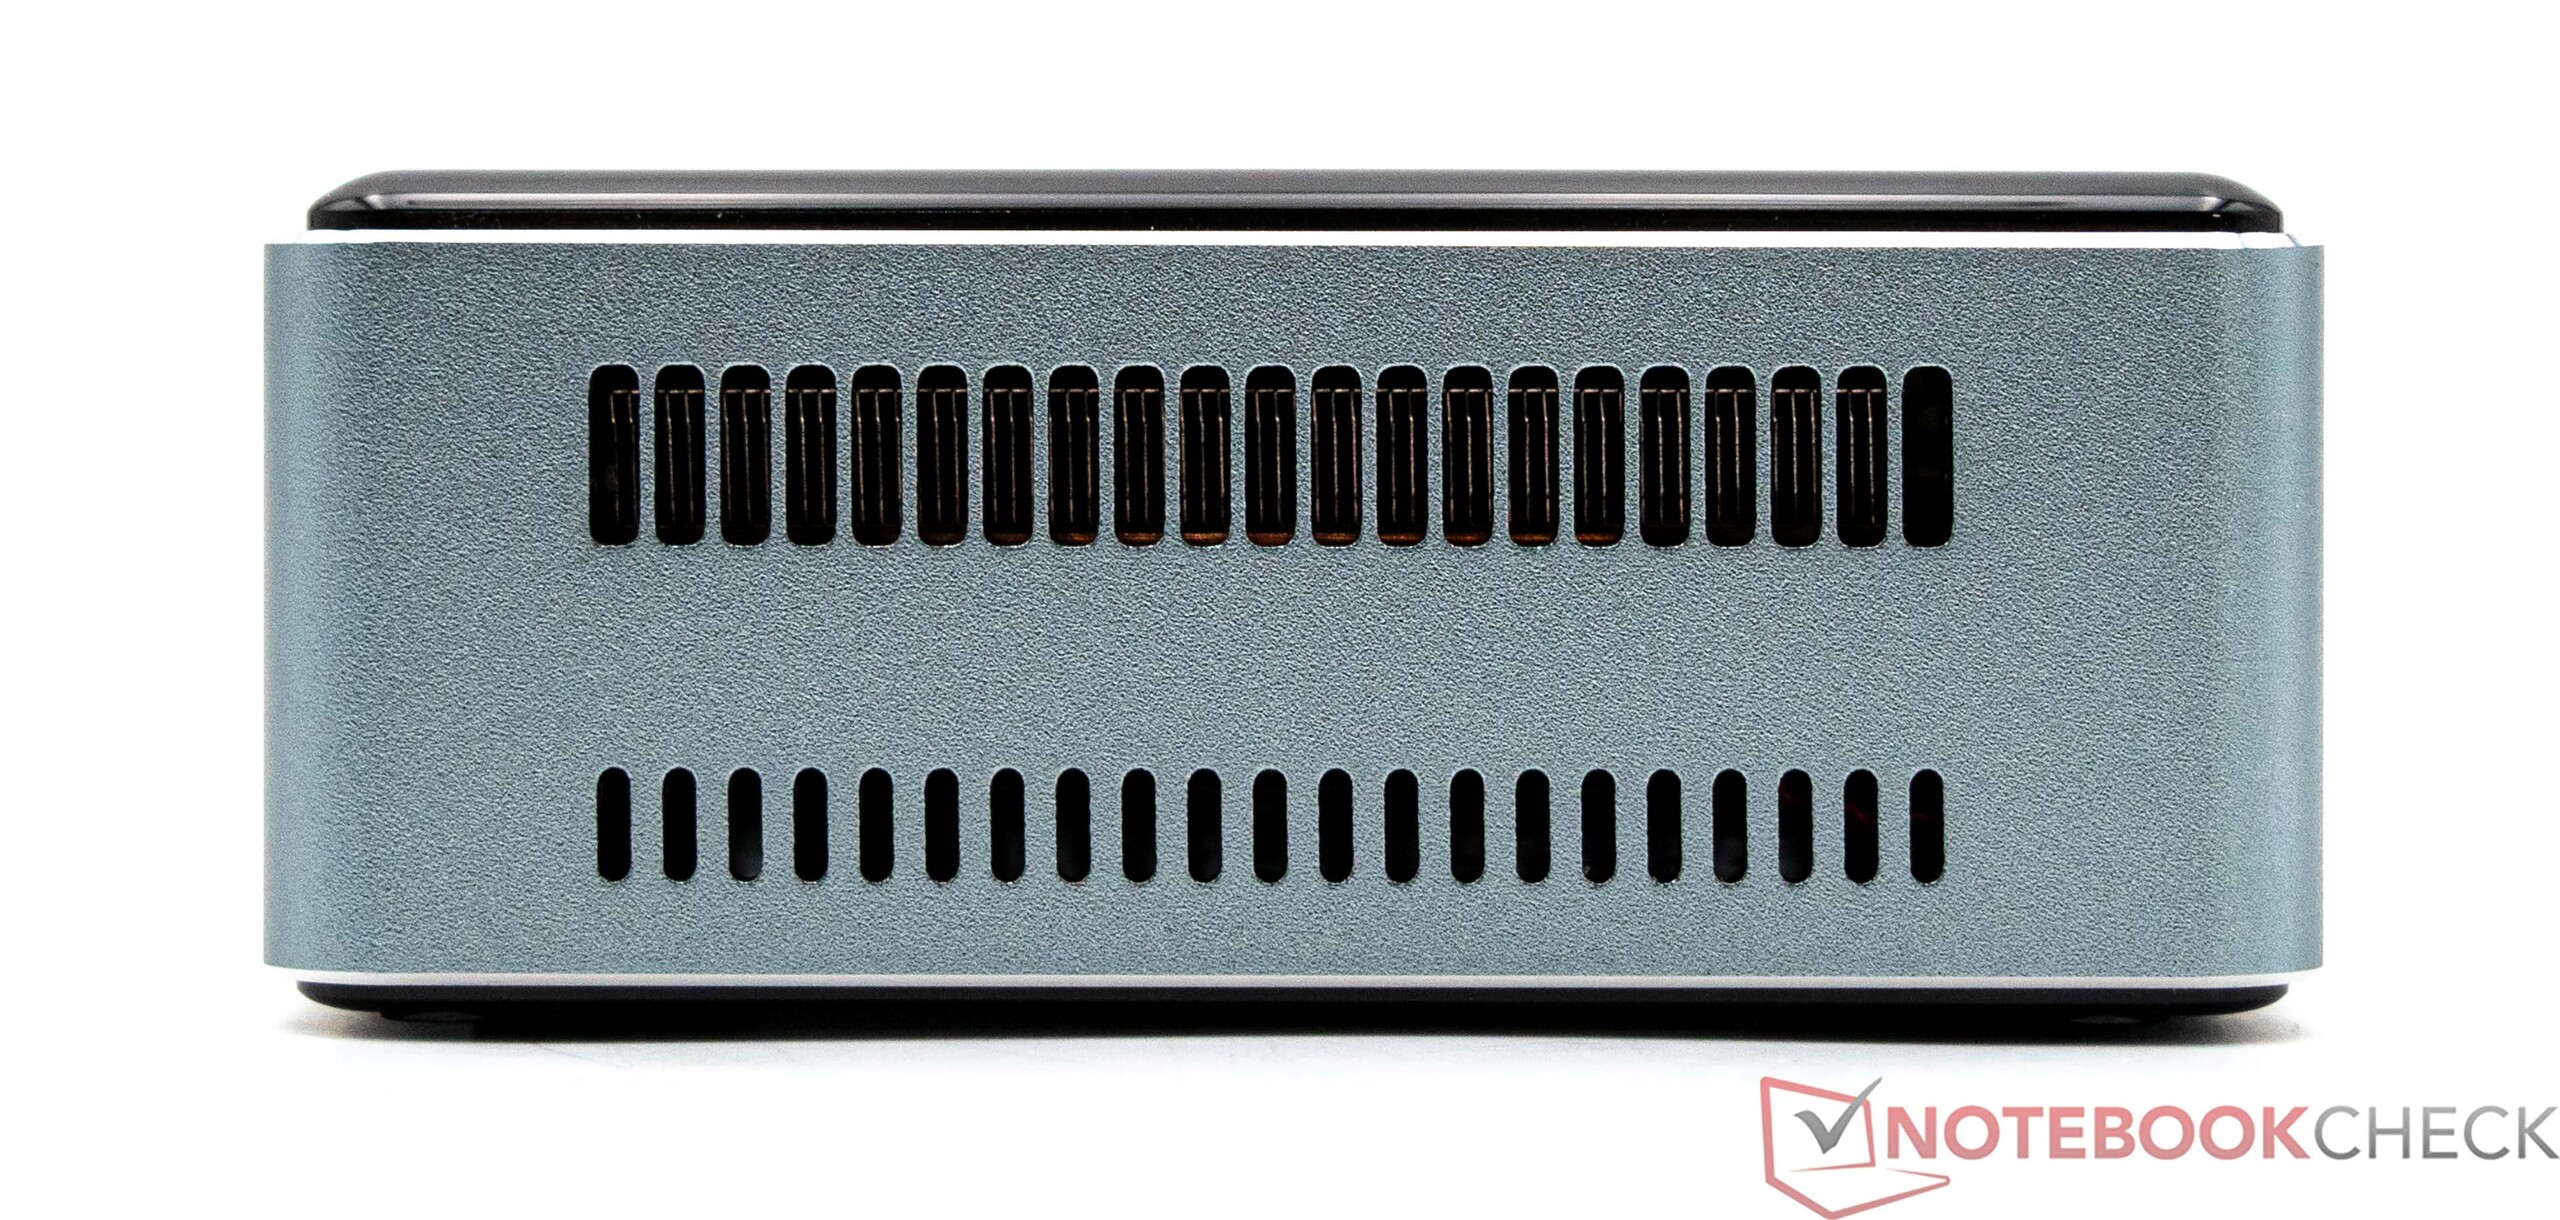
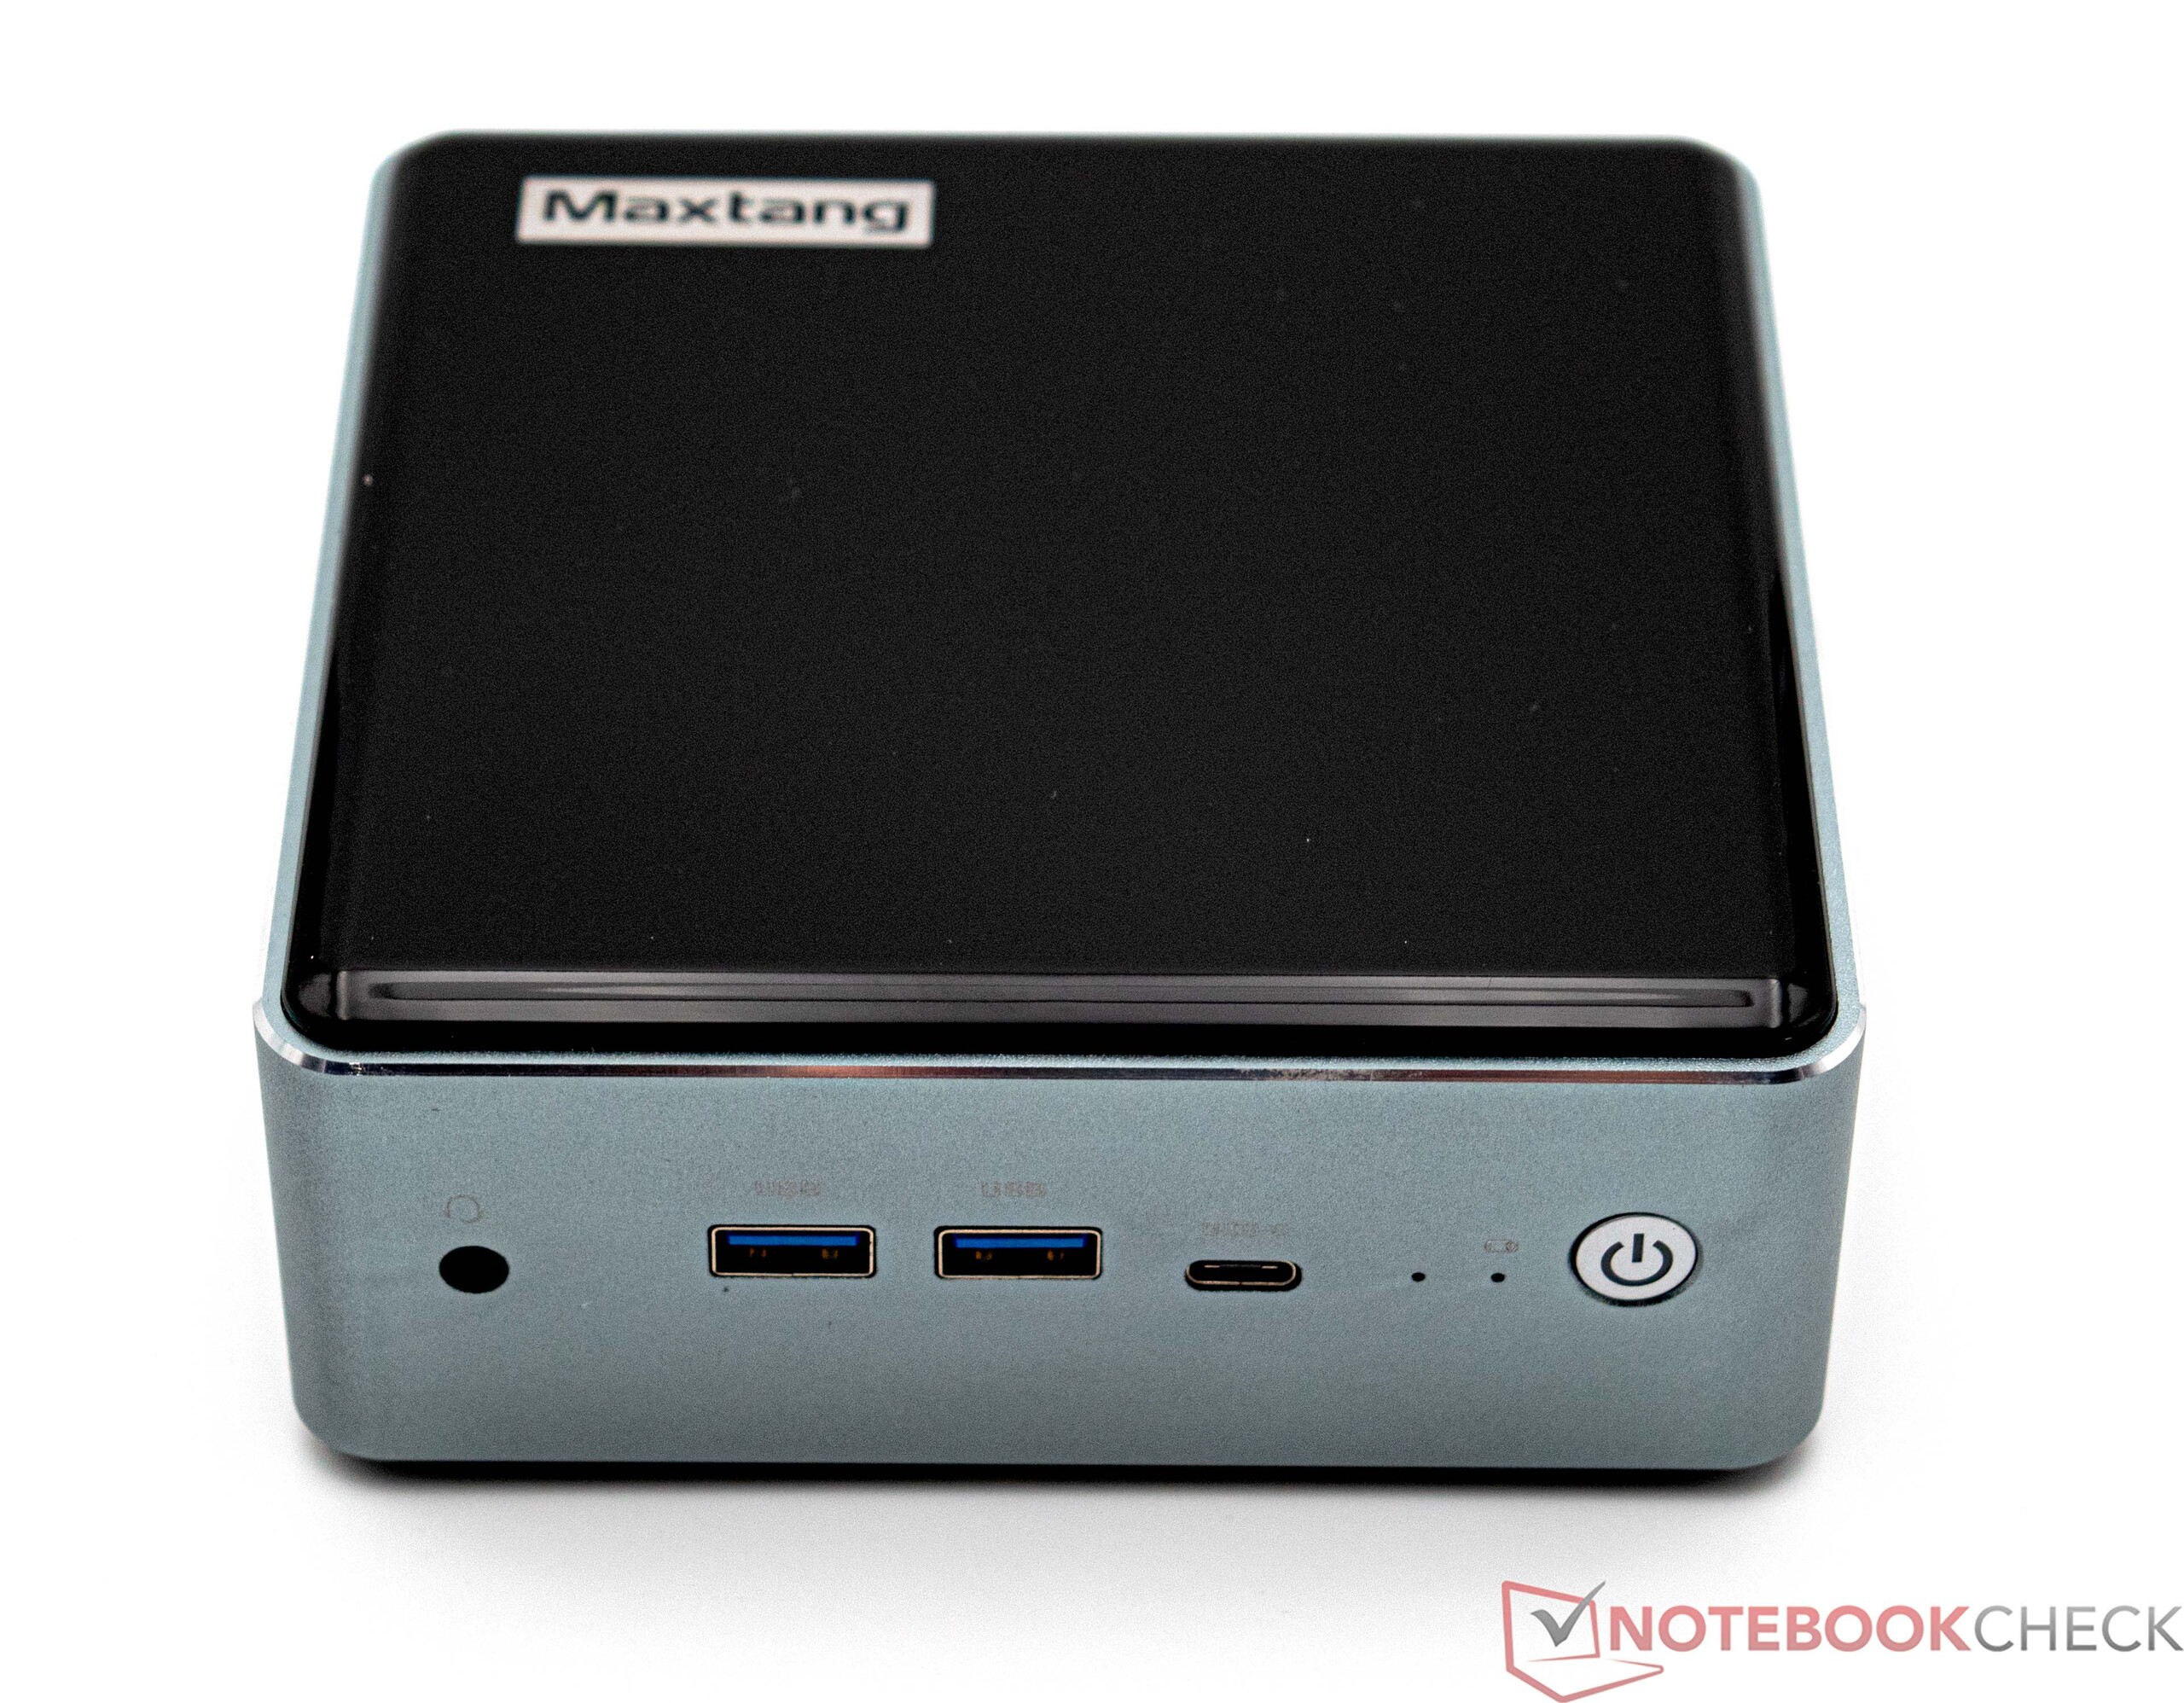
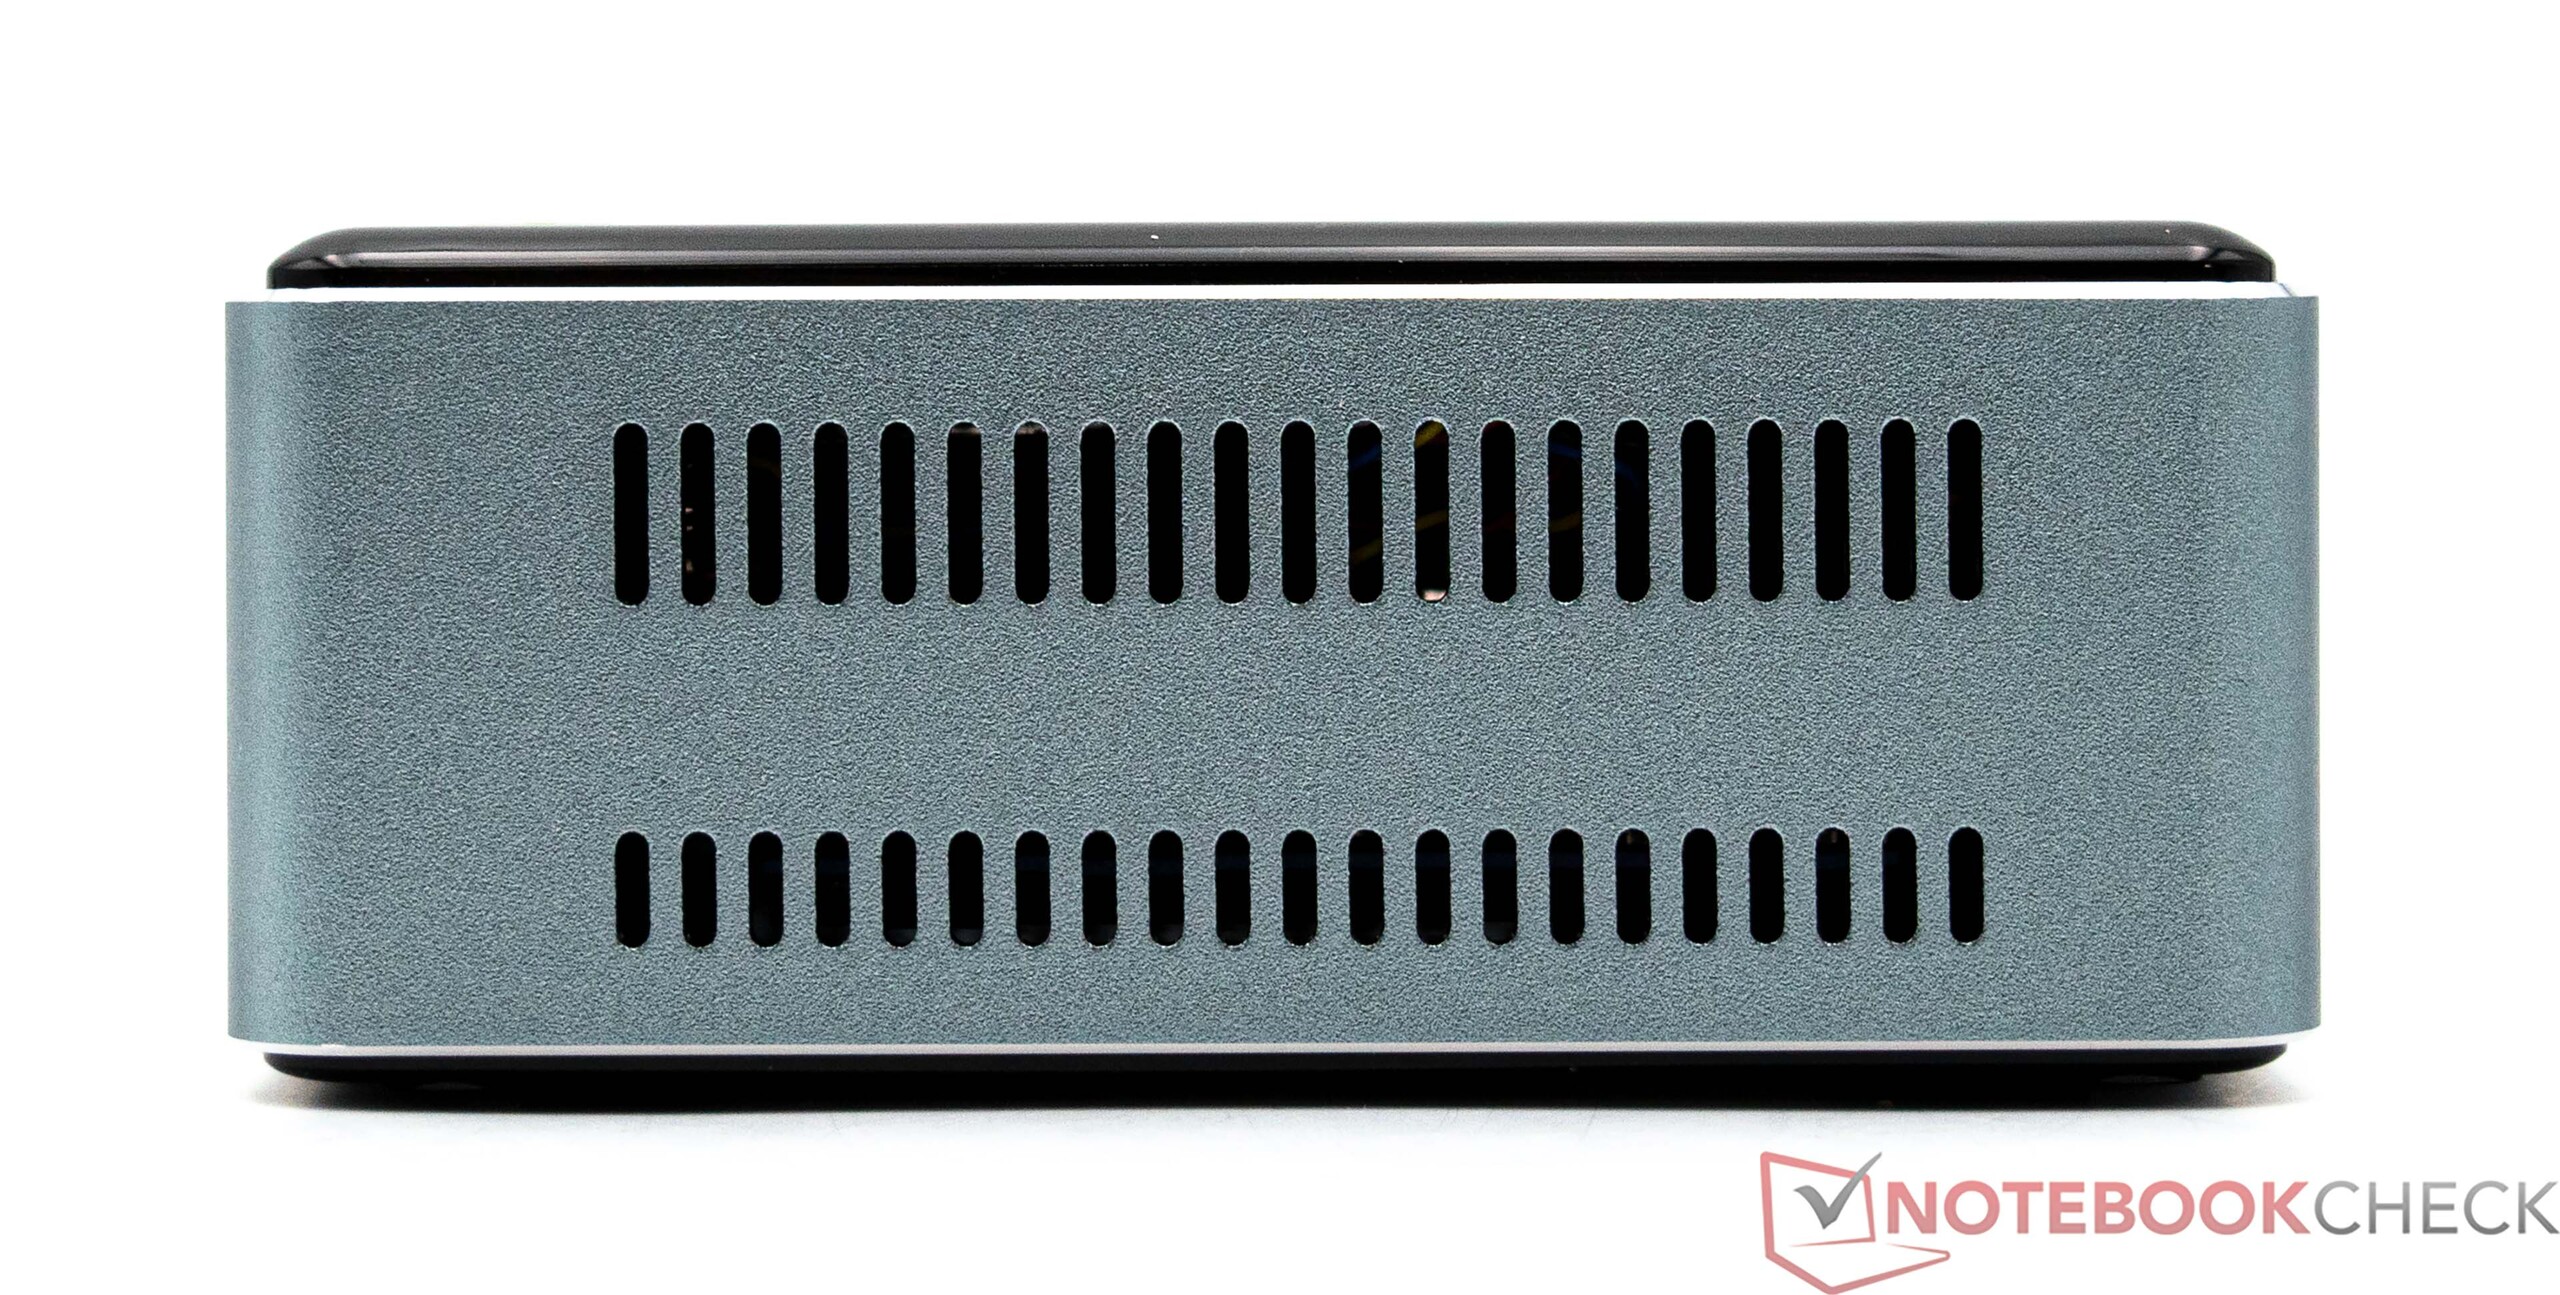

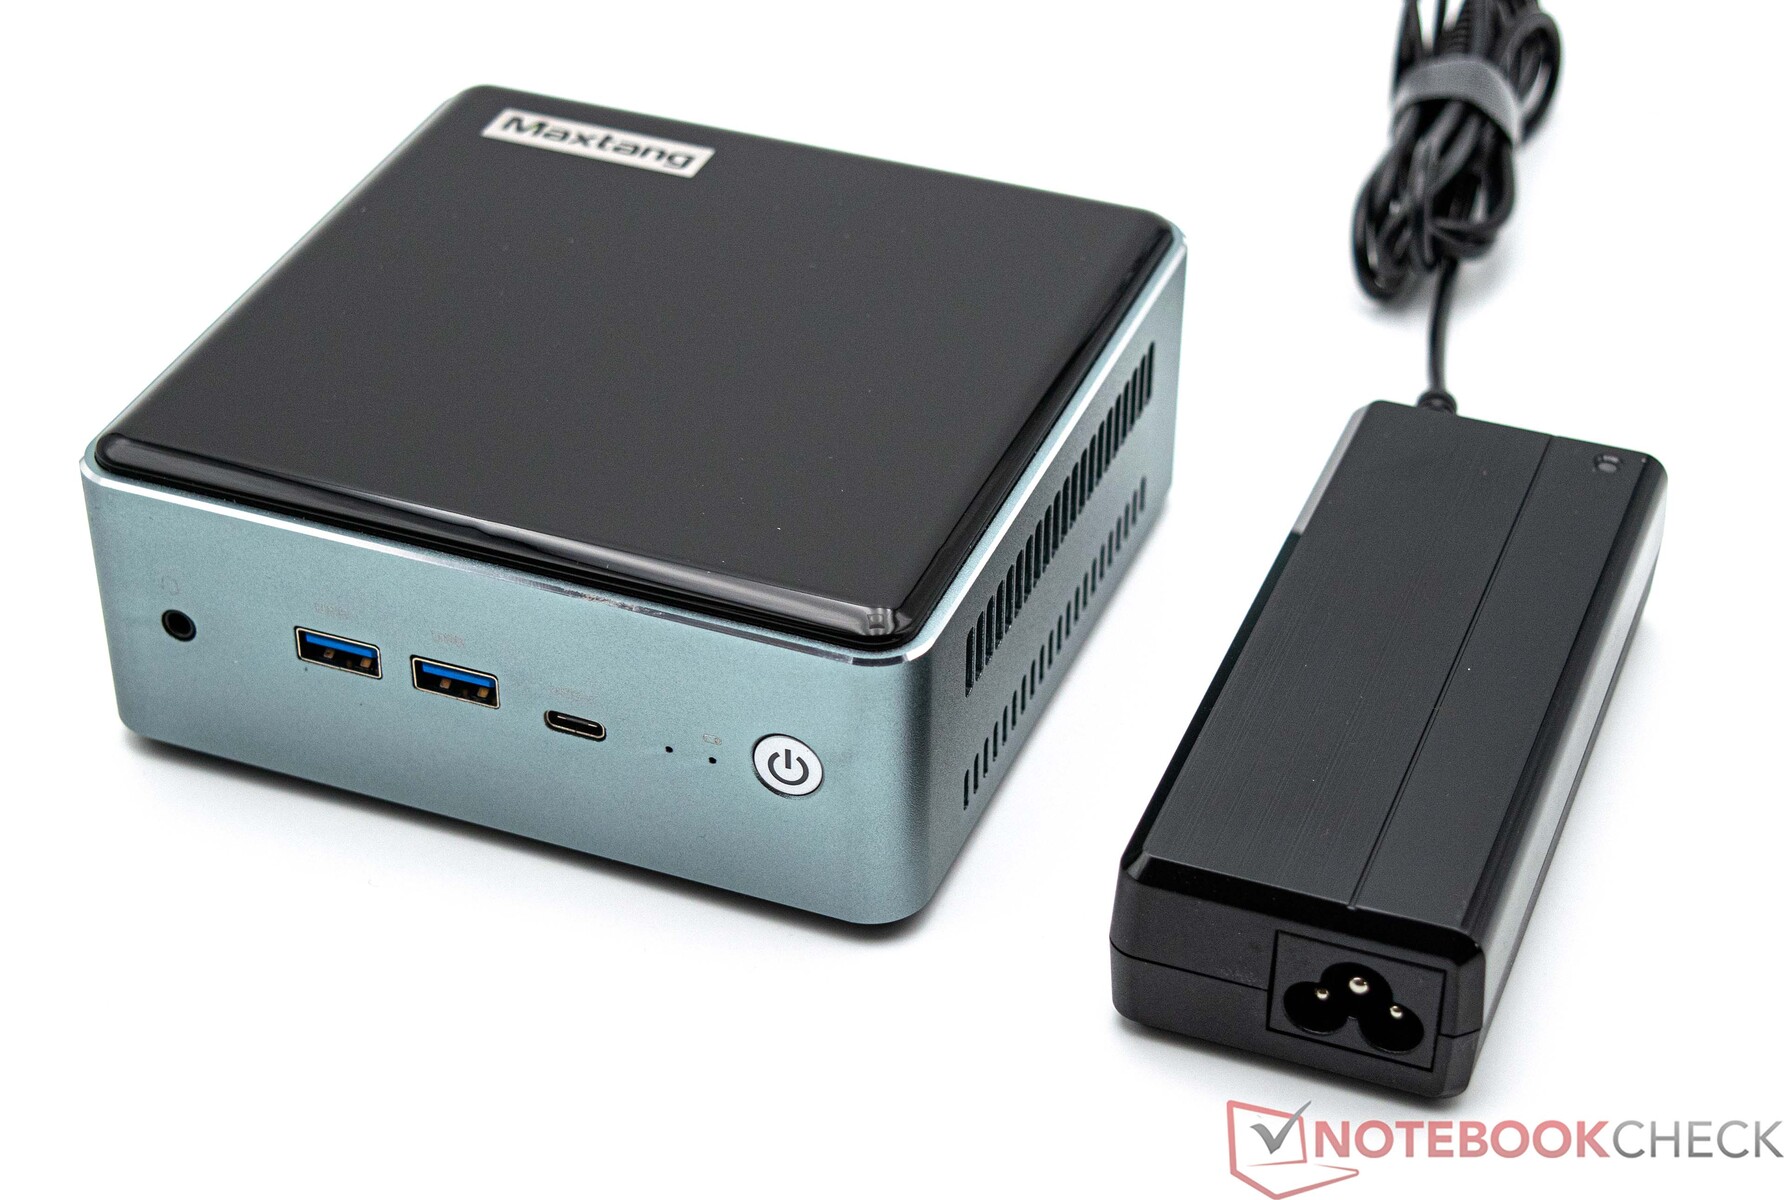
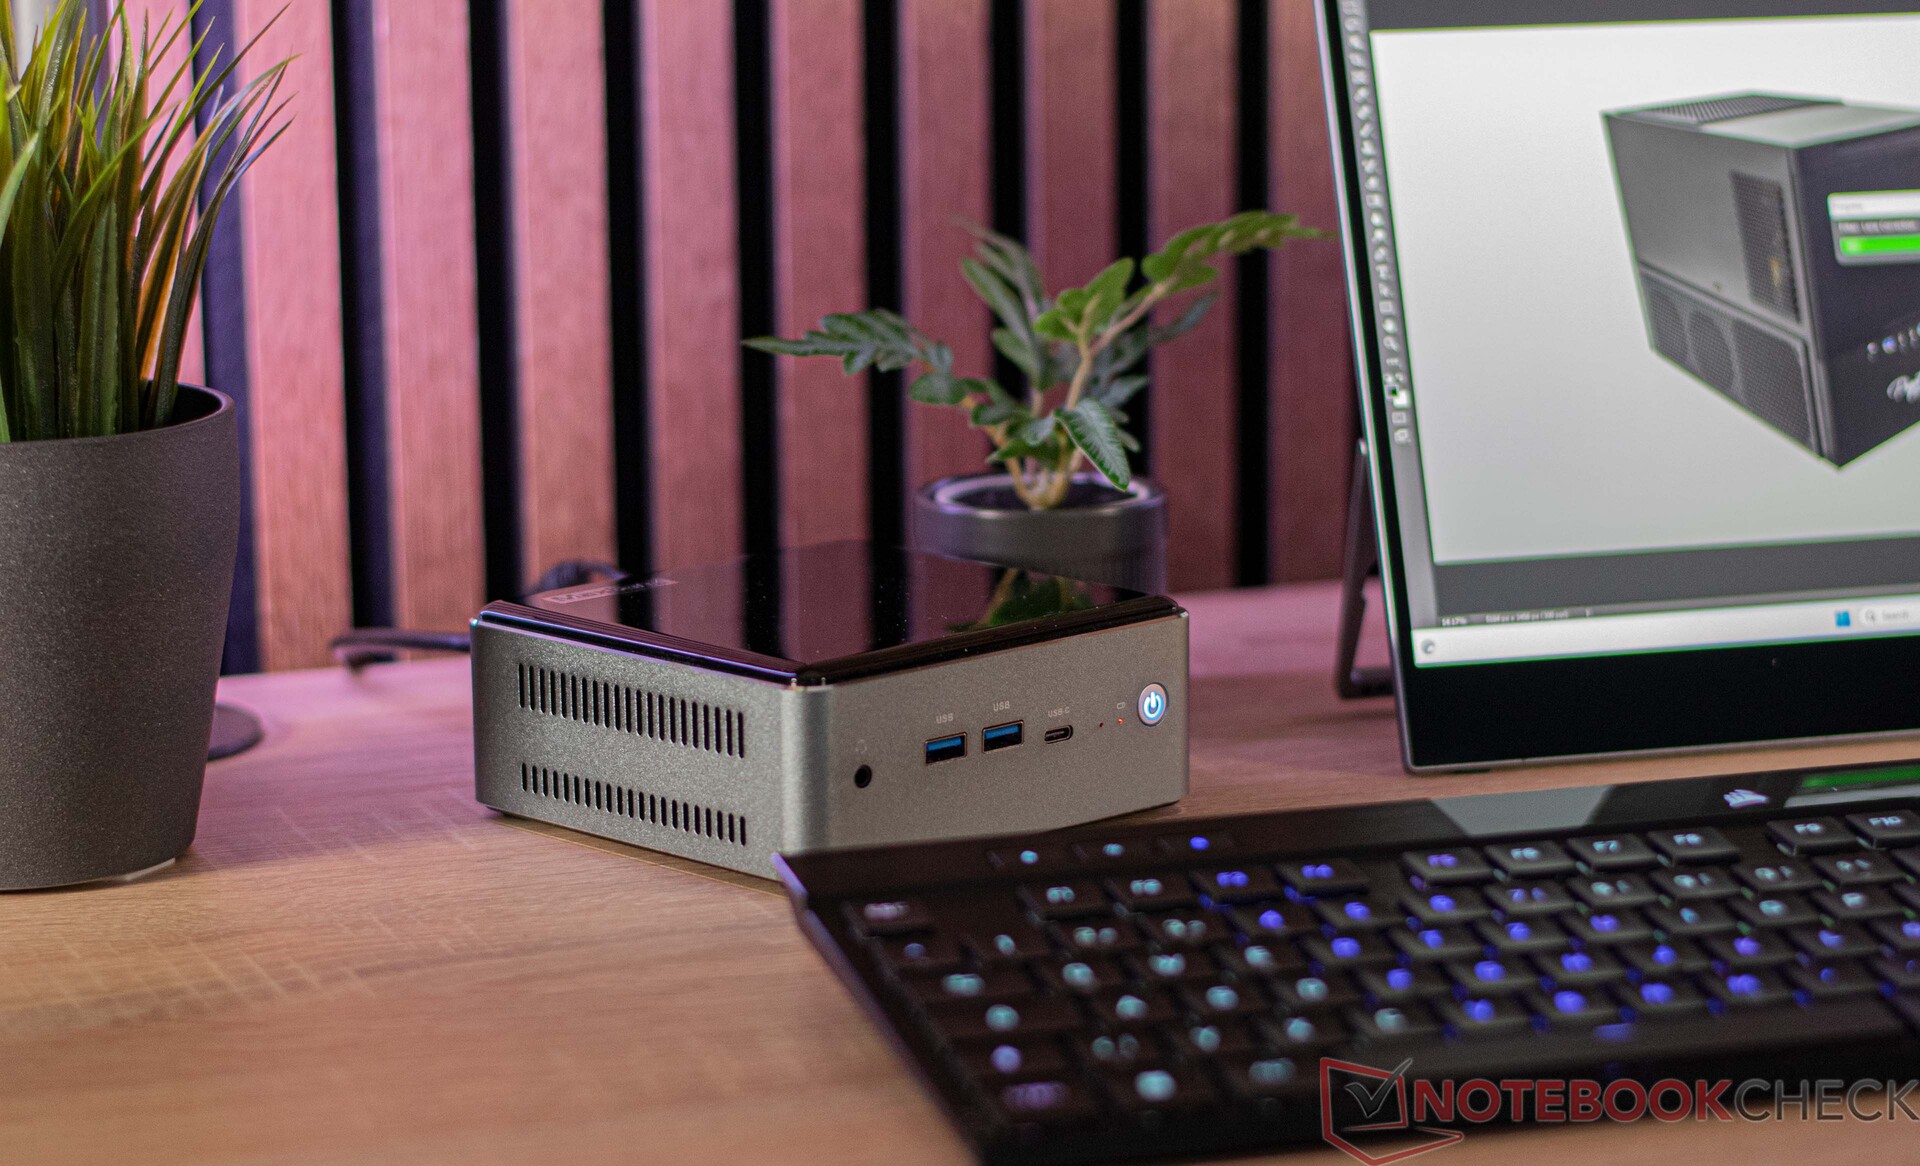
Caixa - Metal e plástico em preto piano
O Maxtang MTN-FP750 tem uma caixa de metal robusta que é complementada por superfícies de plástico preto brilhante na parte superior e inferior do dispositivo. Rapidamente, as impressões digitais se tornam visíveis e, mais cedo ou mais tarde, os arranhões são inevitáveis. Em termos de estabilidade, a máquina não parece sofrer com o fato de ter tampas de plástico. A marca Maxtang está estampada na parte superior do mini PC.
Com cerca de 13 x 13 centímetros, o dispositivo ocupa um pouco mais de espaço na mesa do que os concorrentes e, com um peso de 600 gramas, o Maxtang MTN-FP750 é relativamente leve. A PSU pesa apenas 290 gramas. O Maxtang MTN-FP750 também pode ser conectado a um monitor e um suporte VESA está incluído na caixa.
Recursos
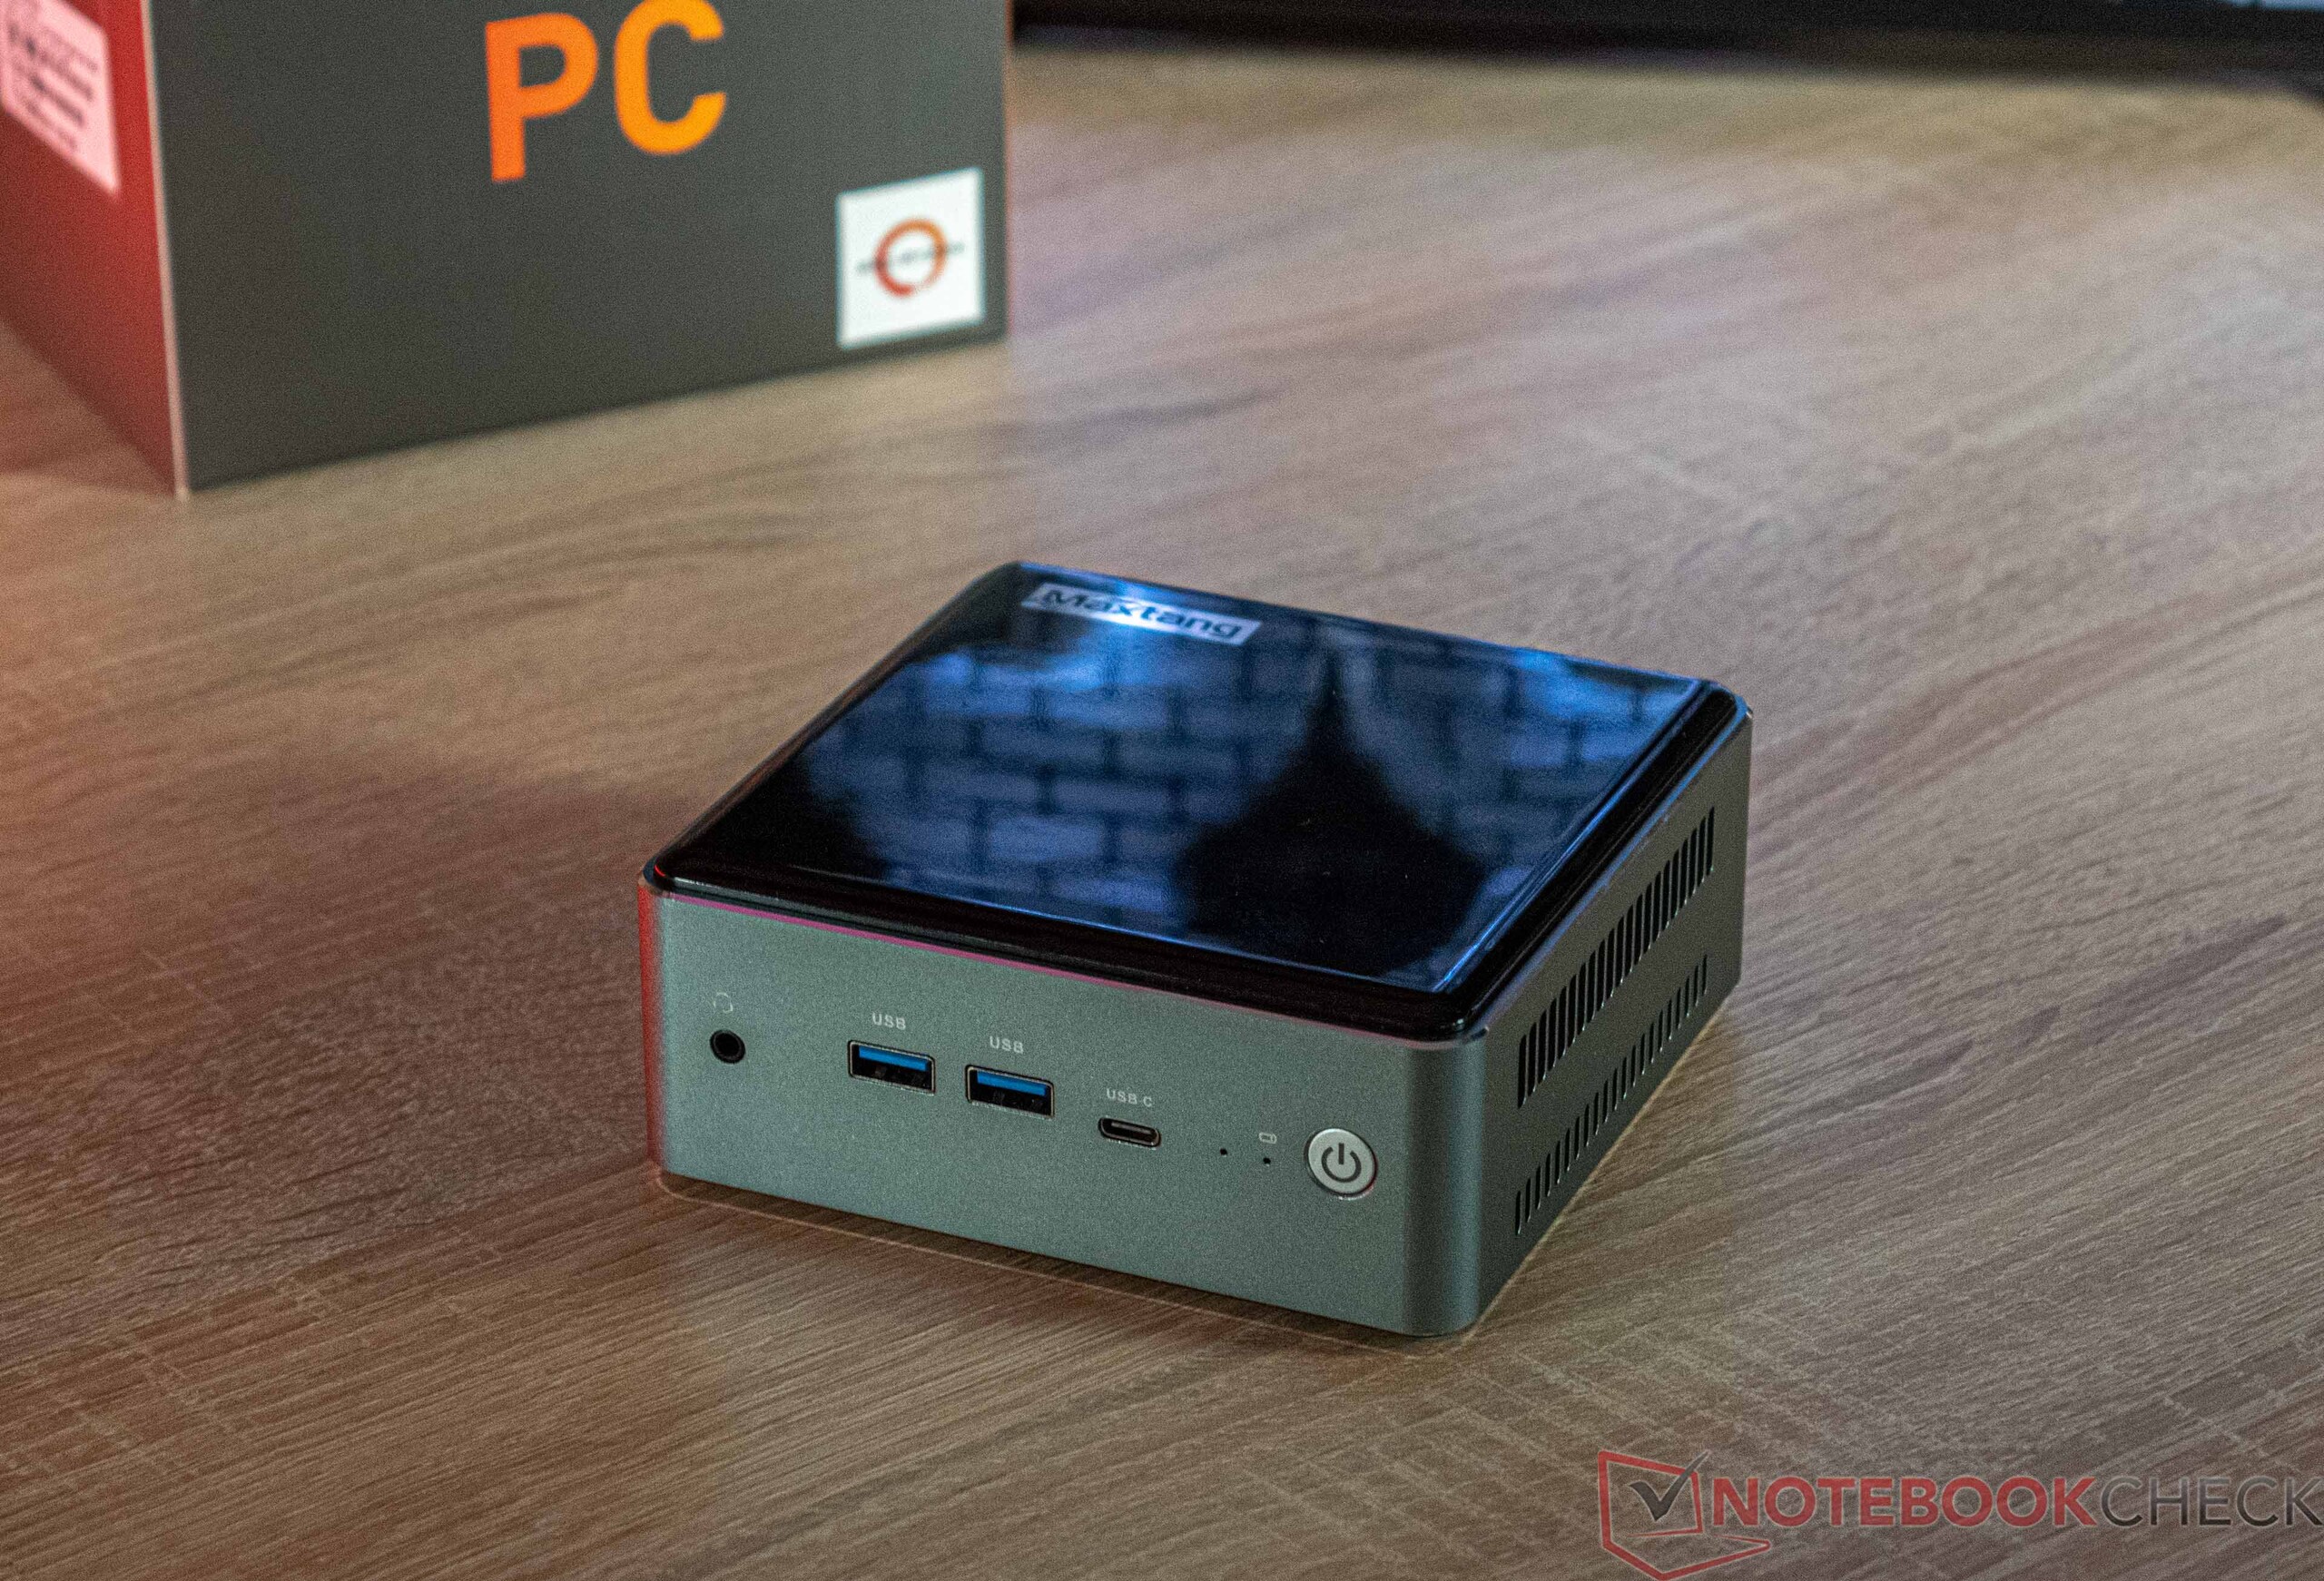
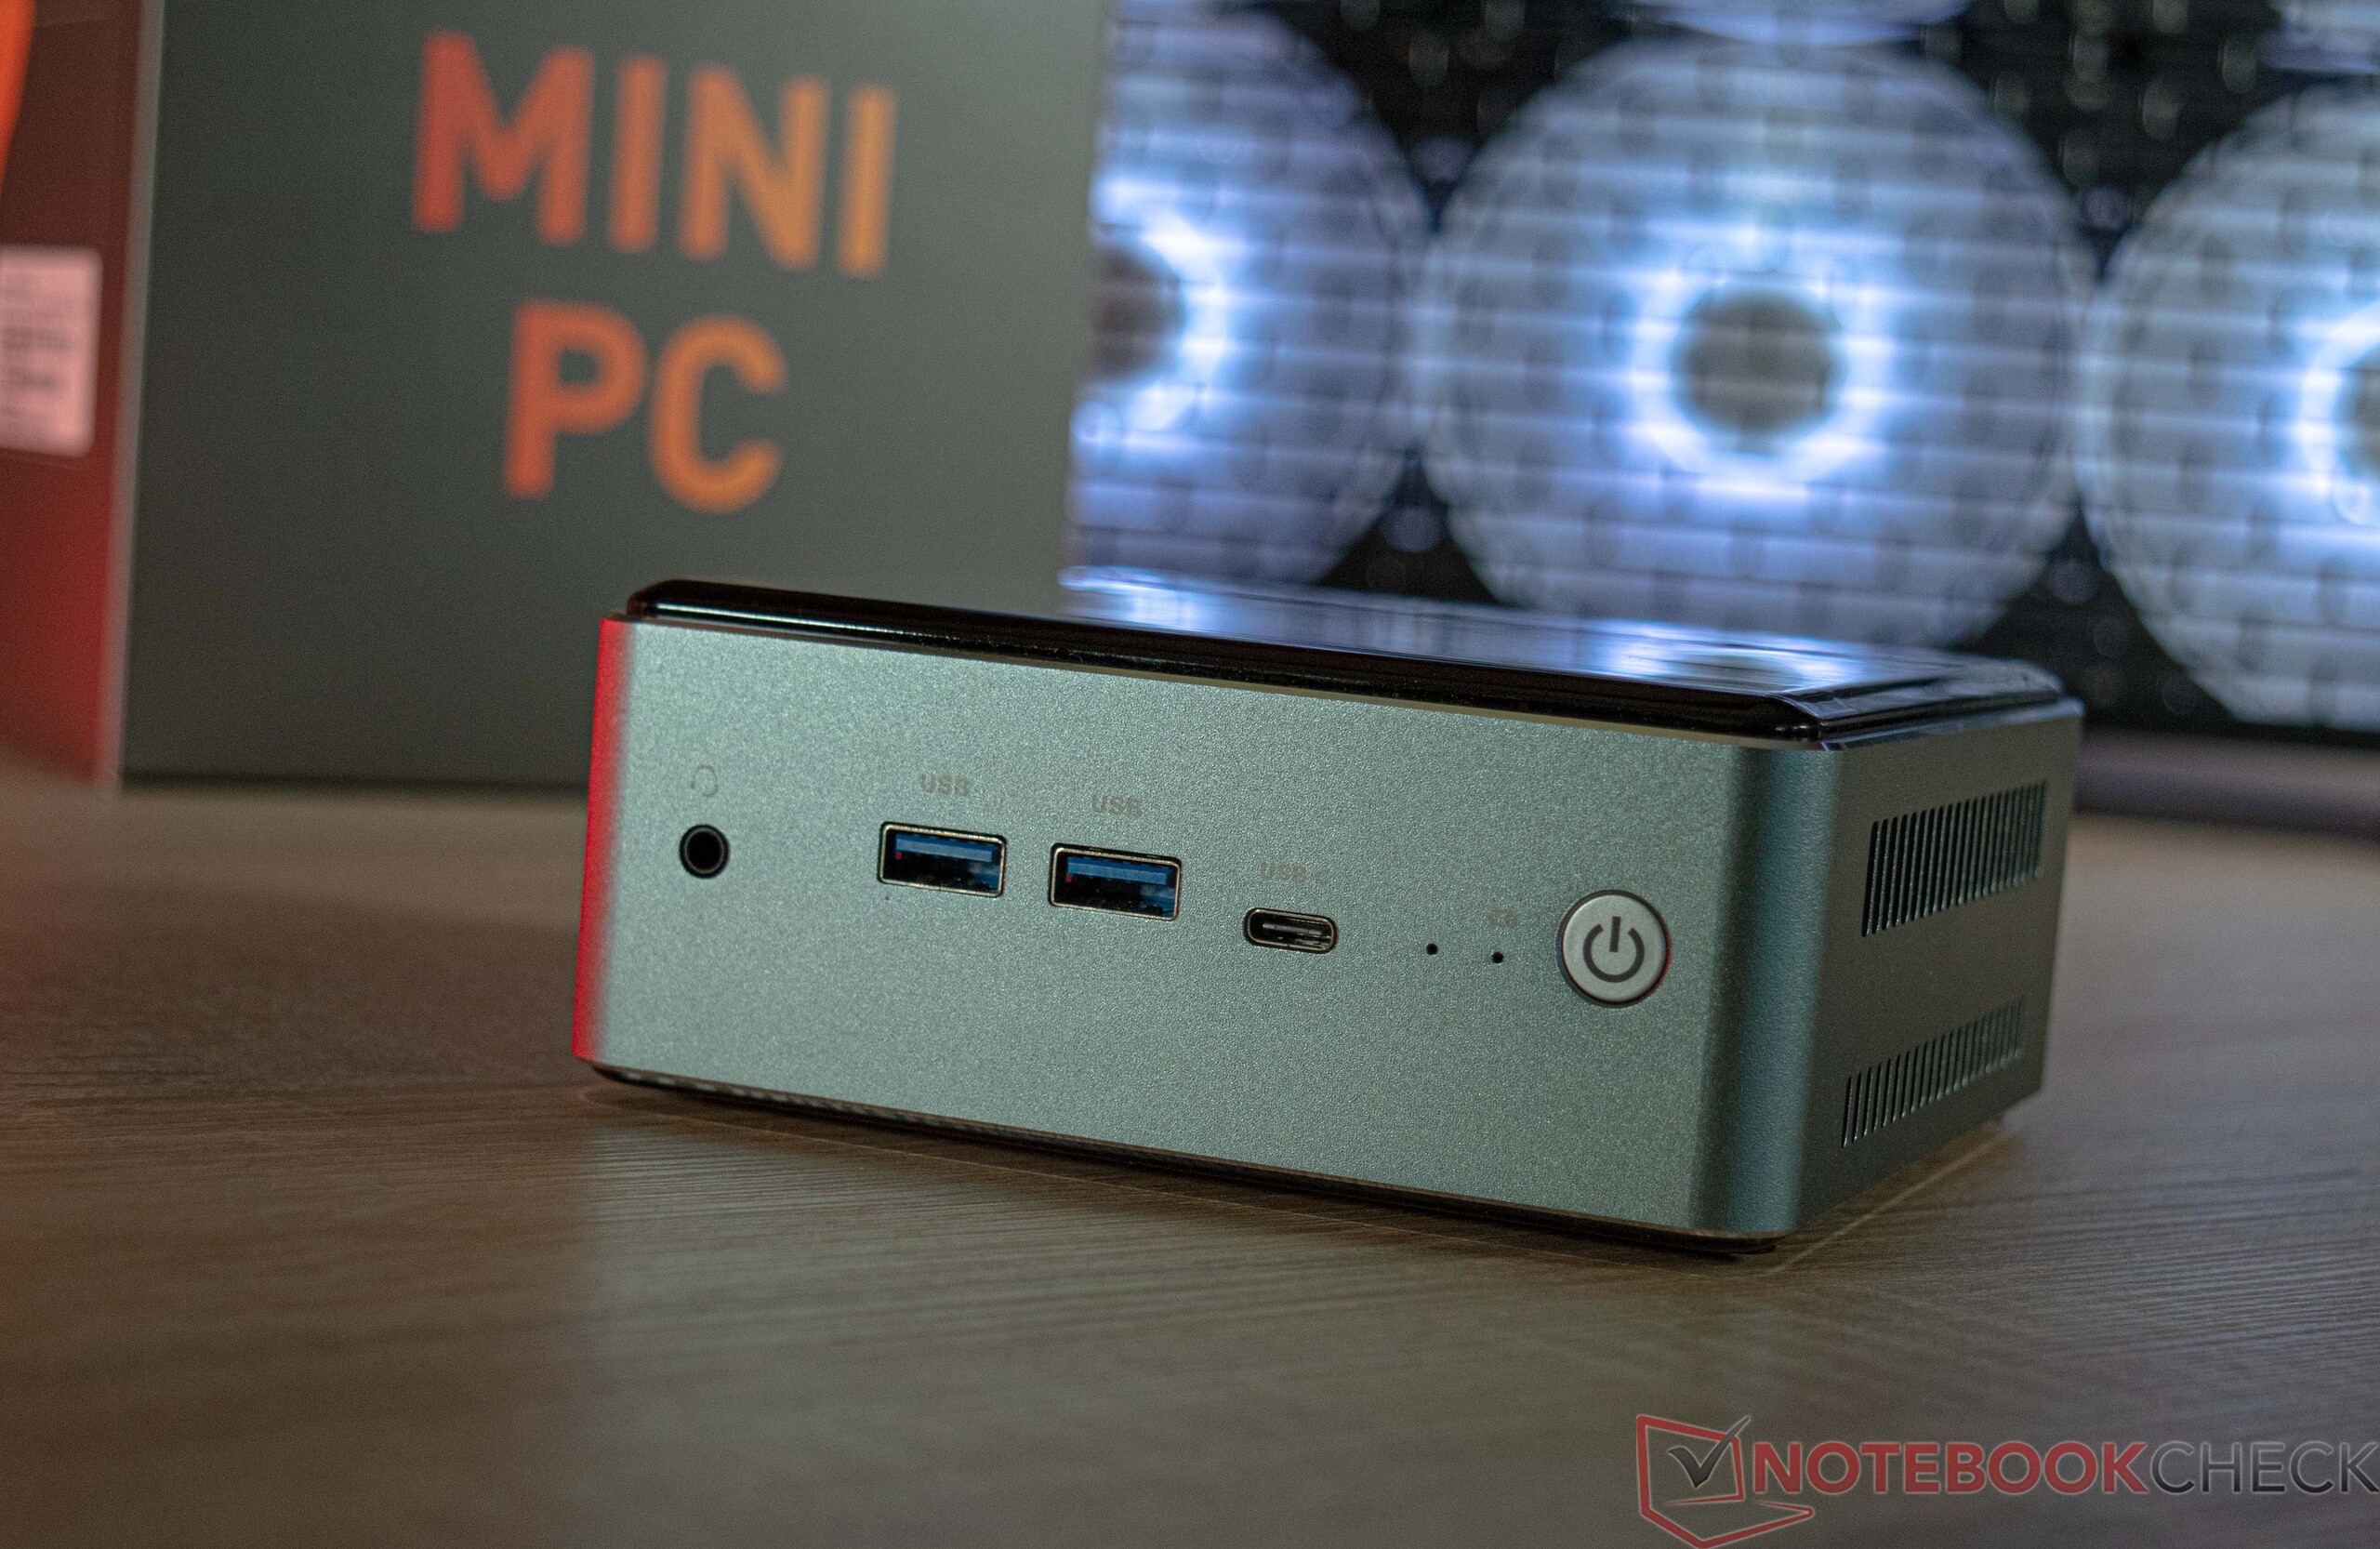
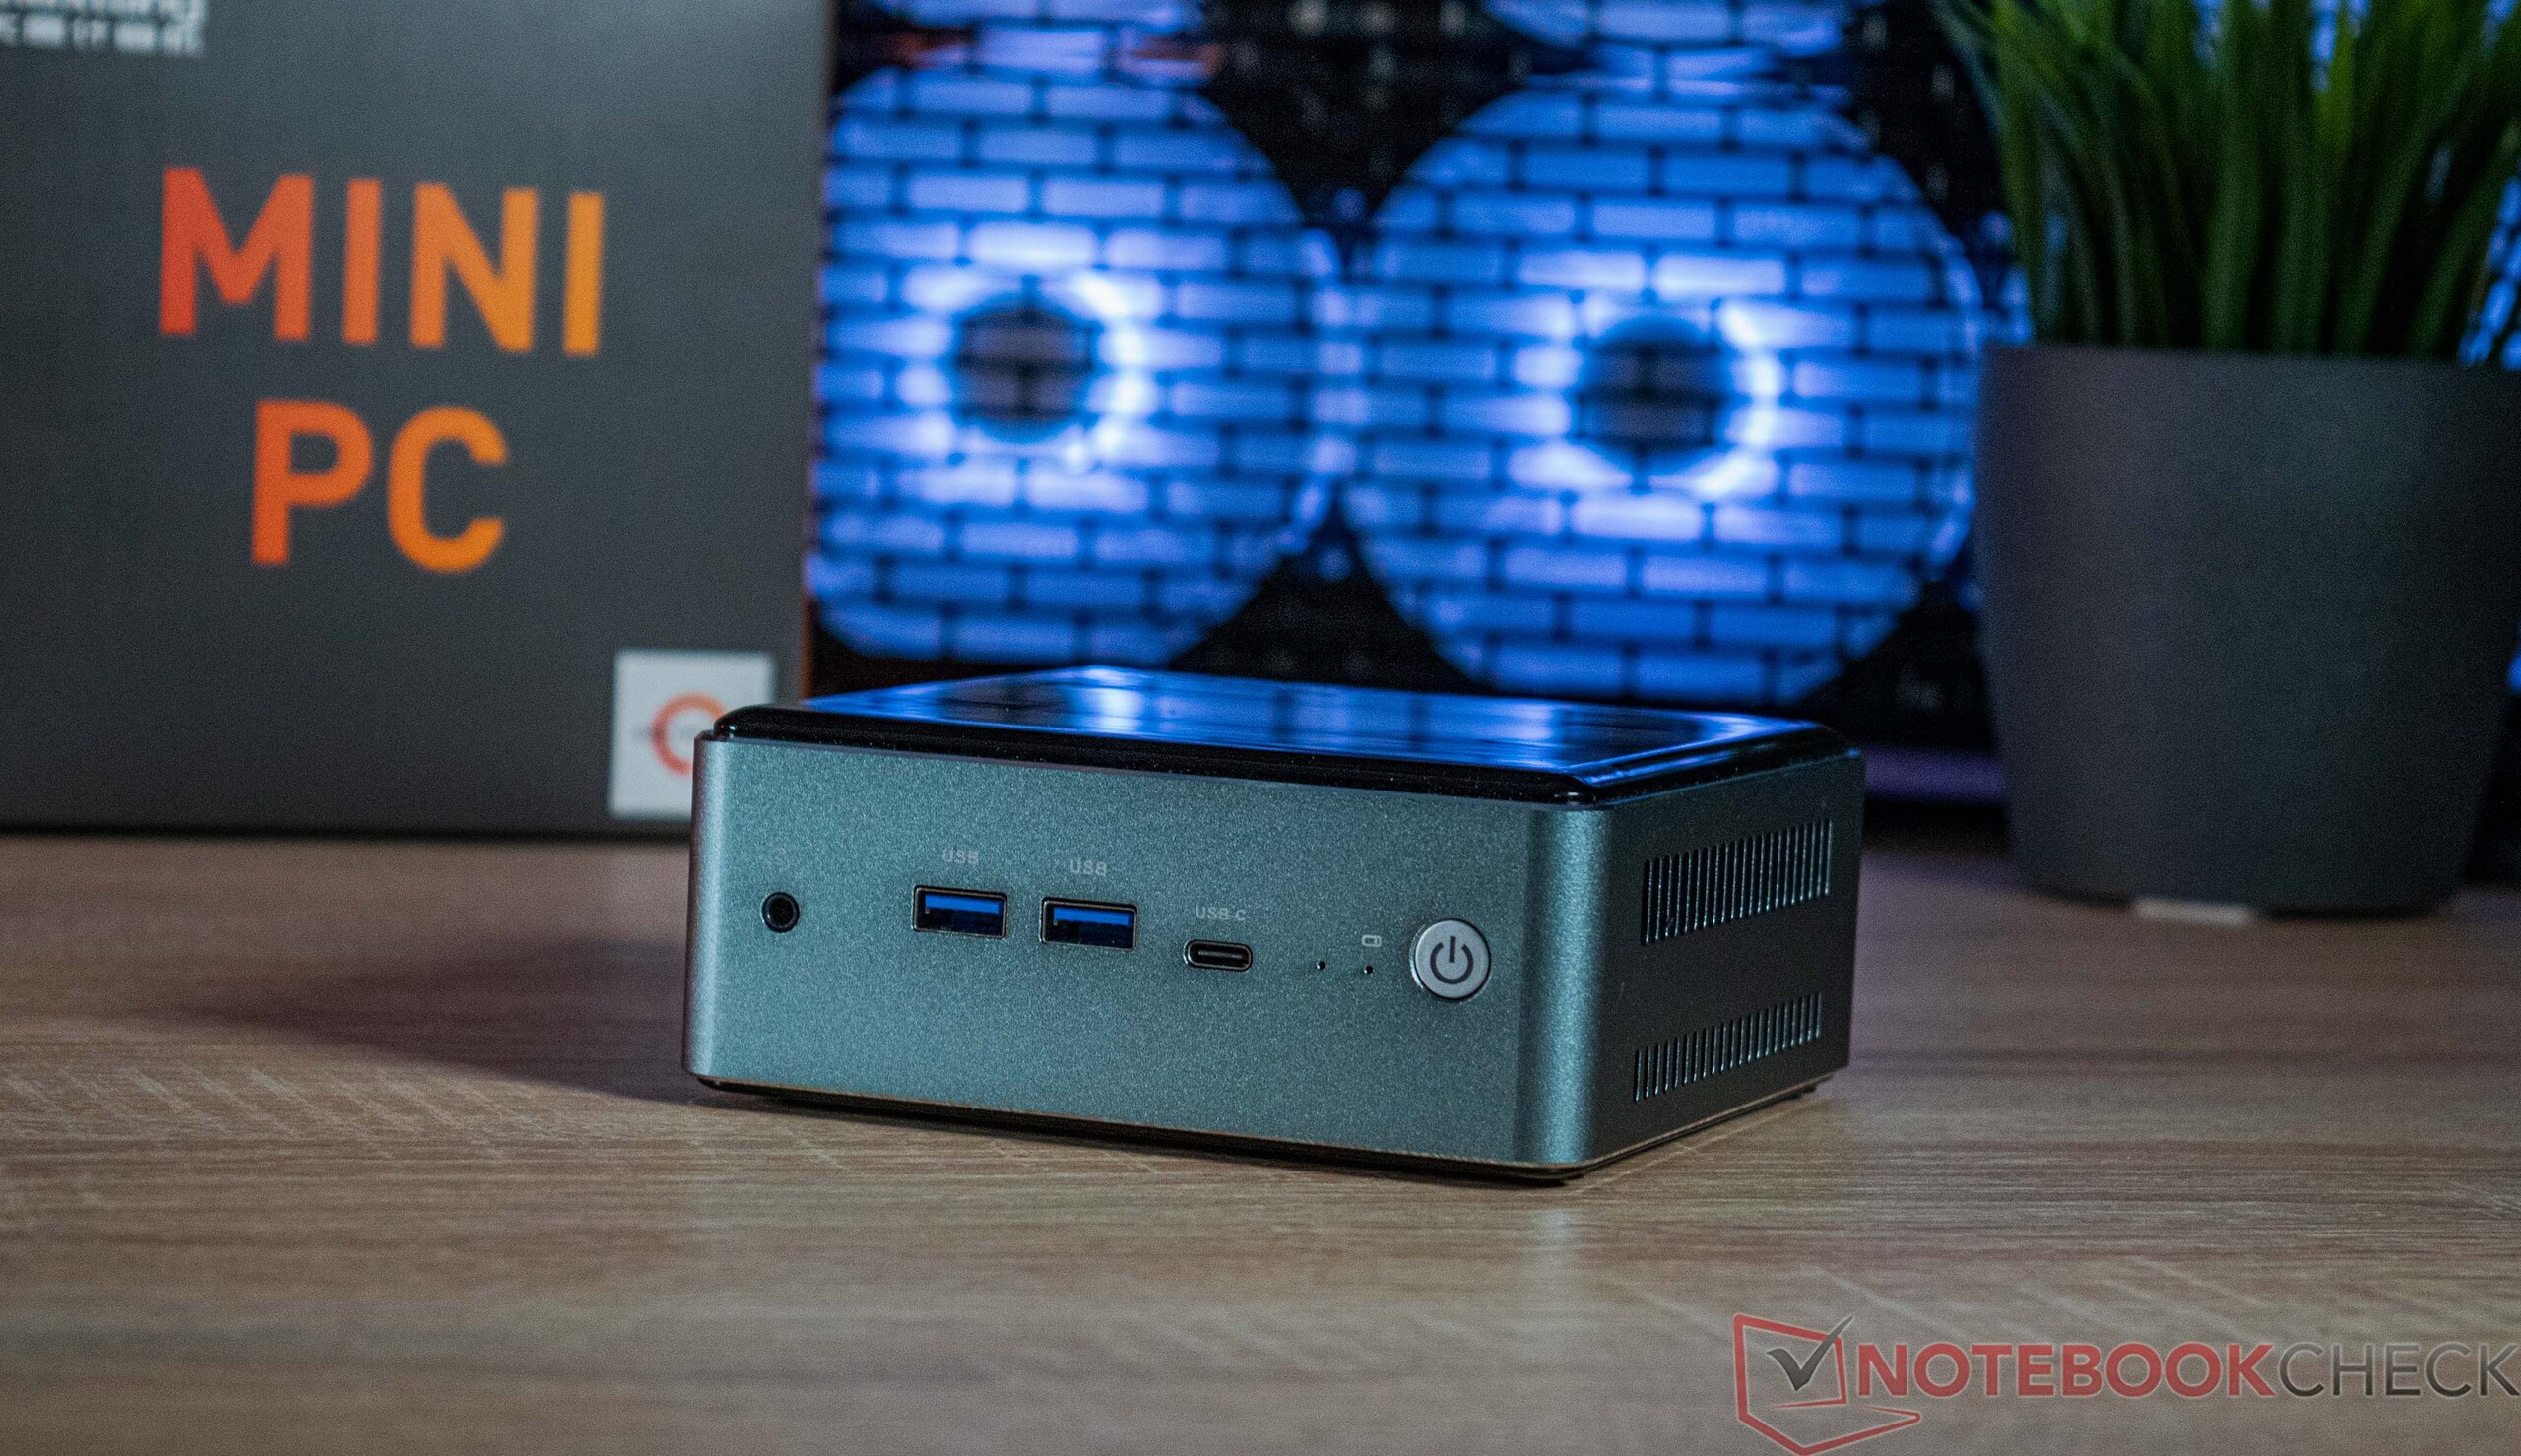
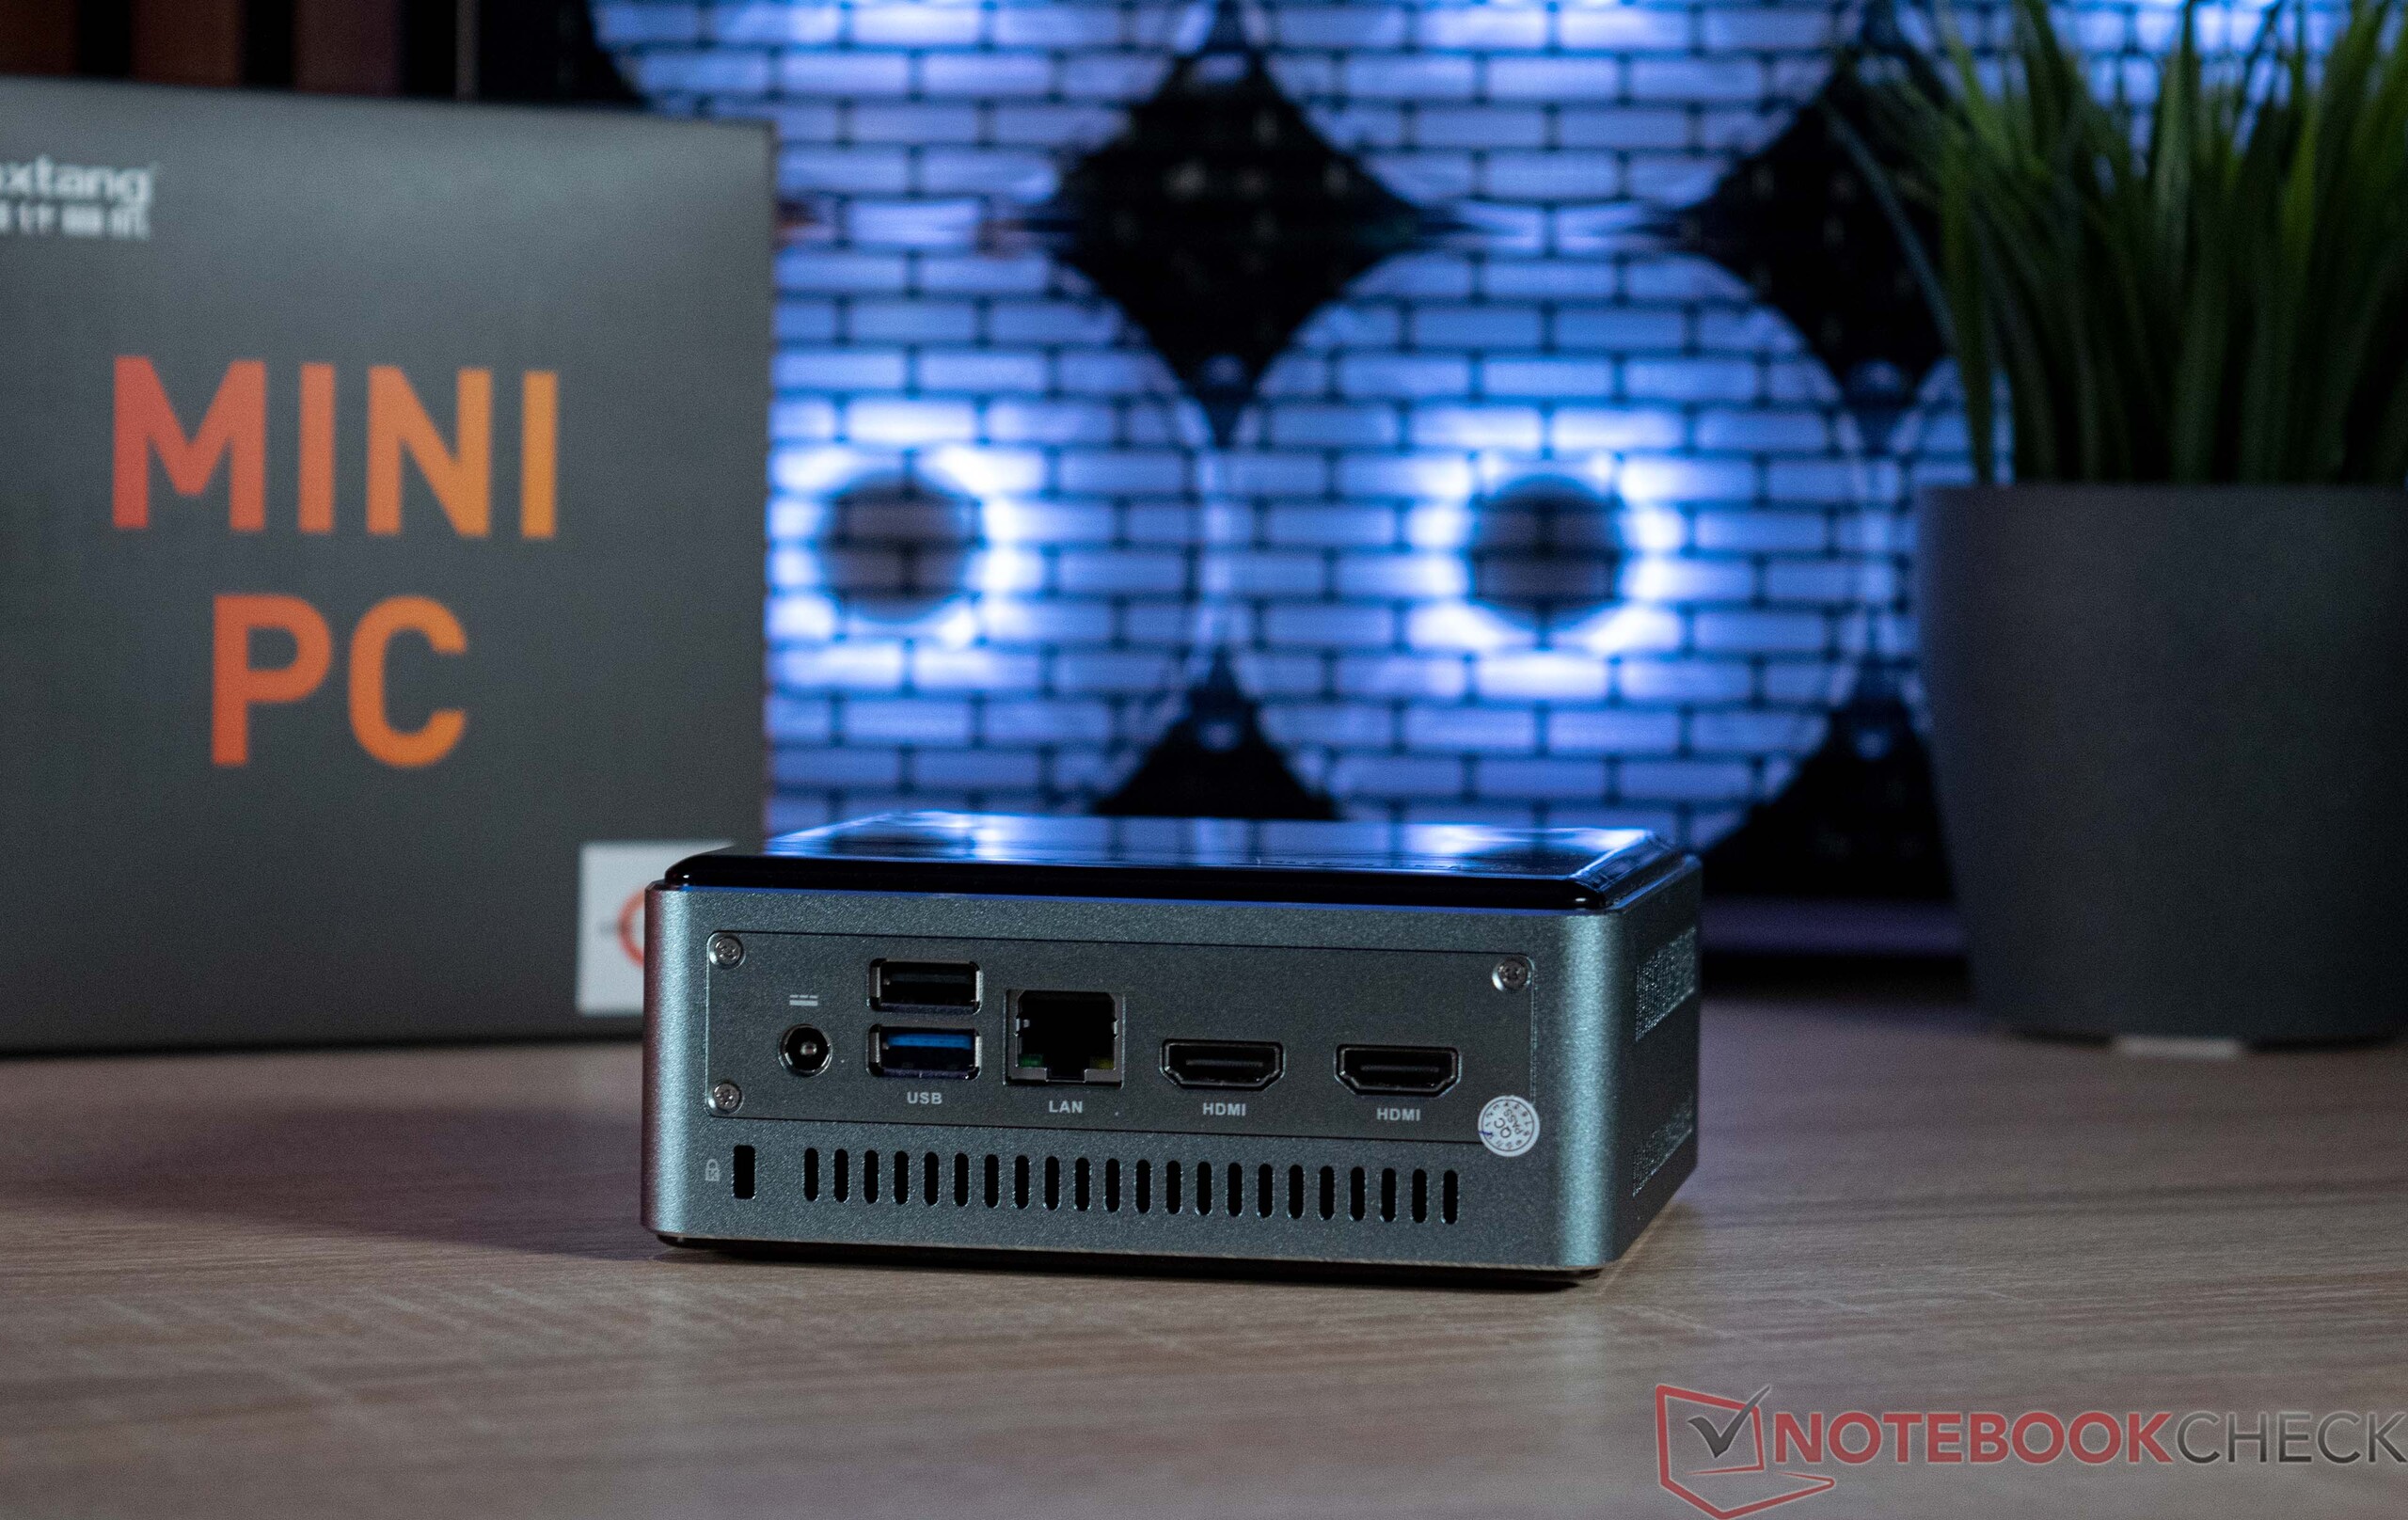
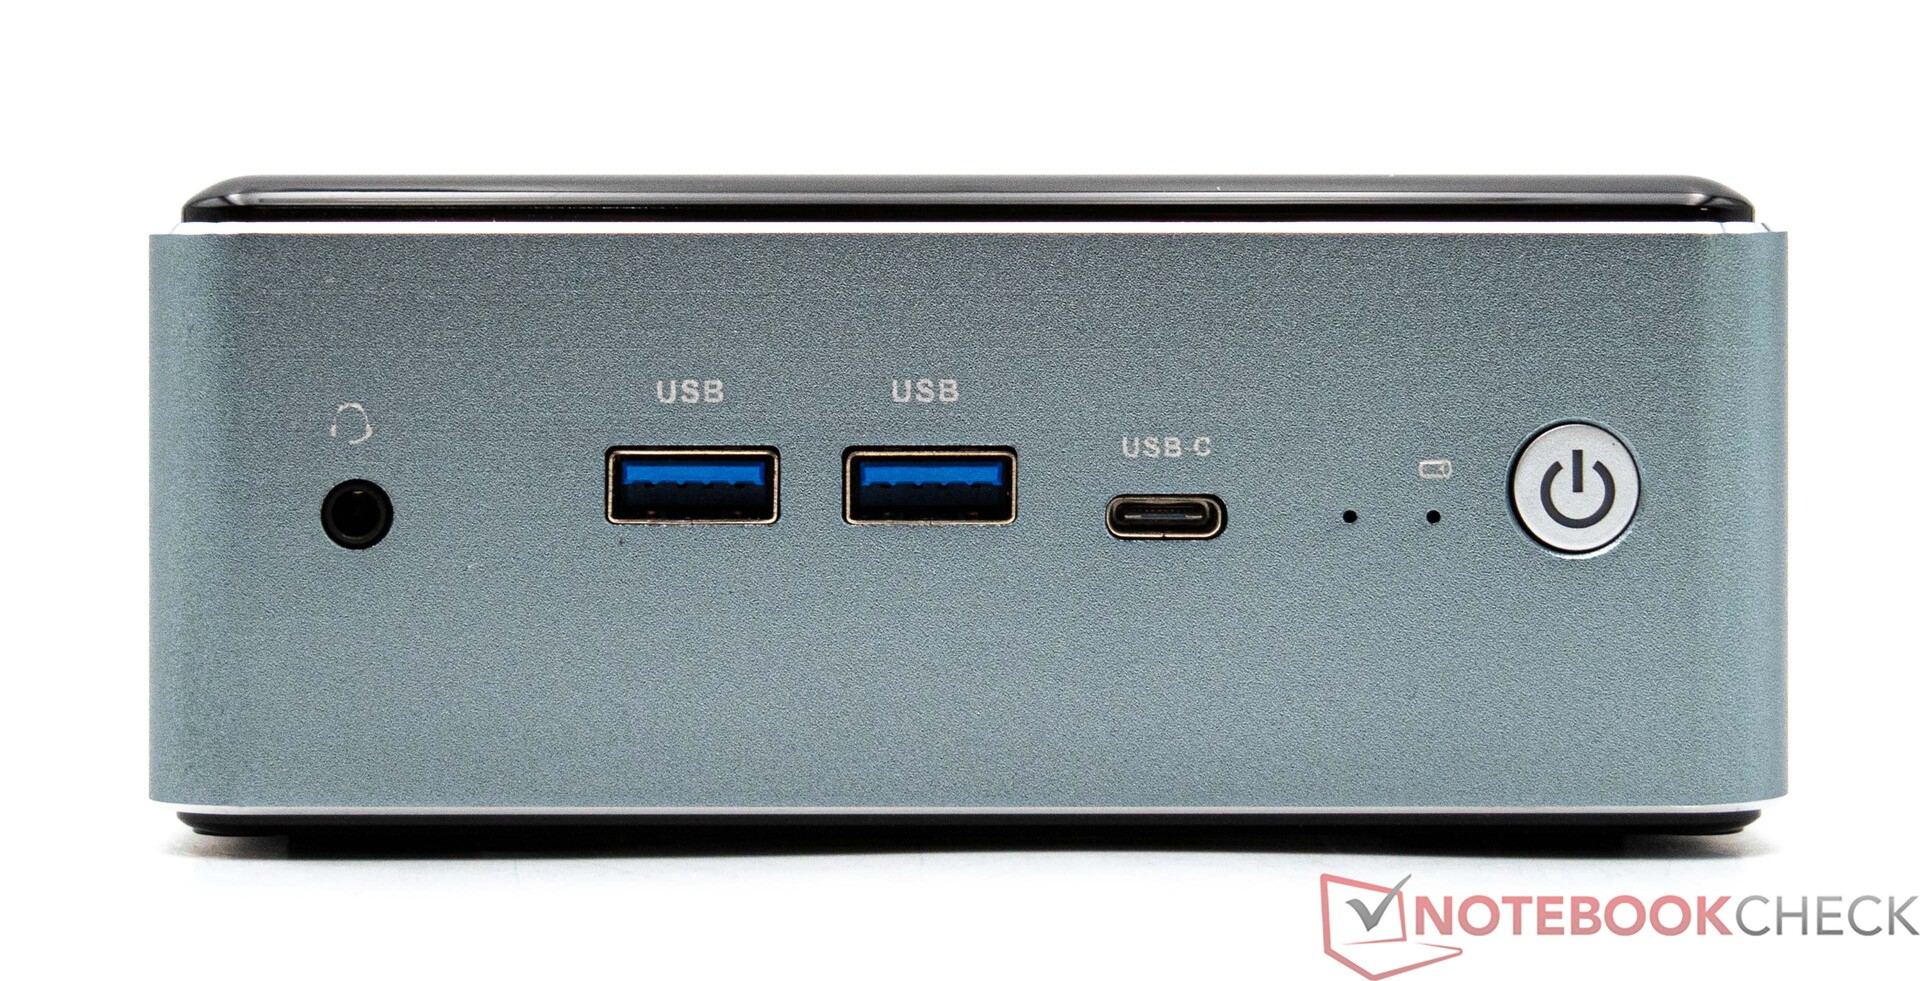
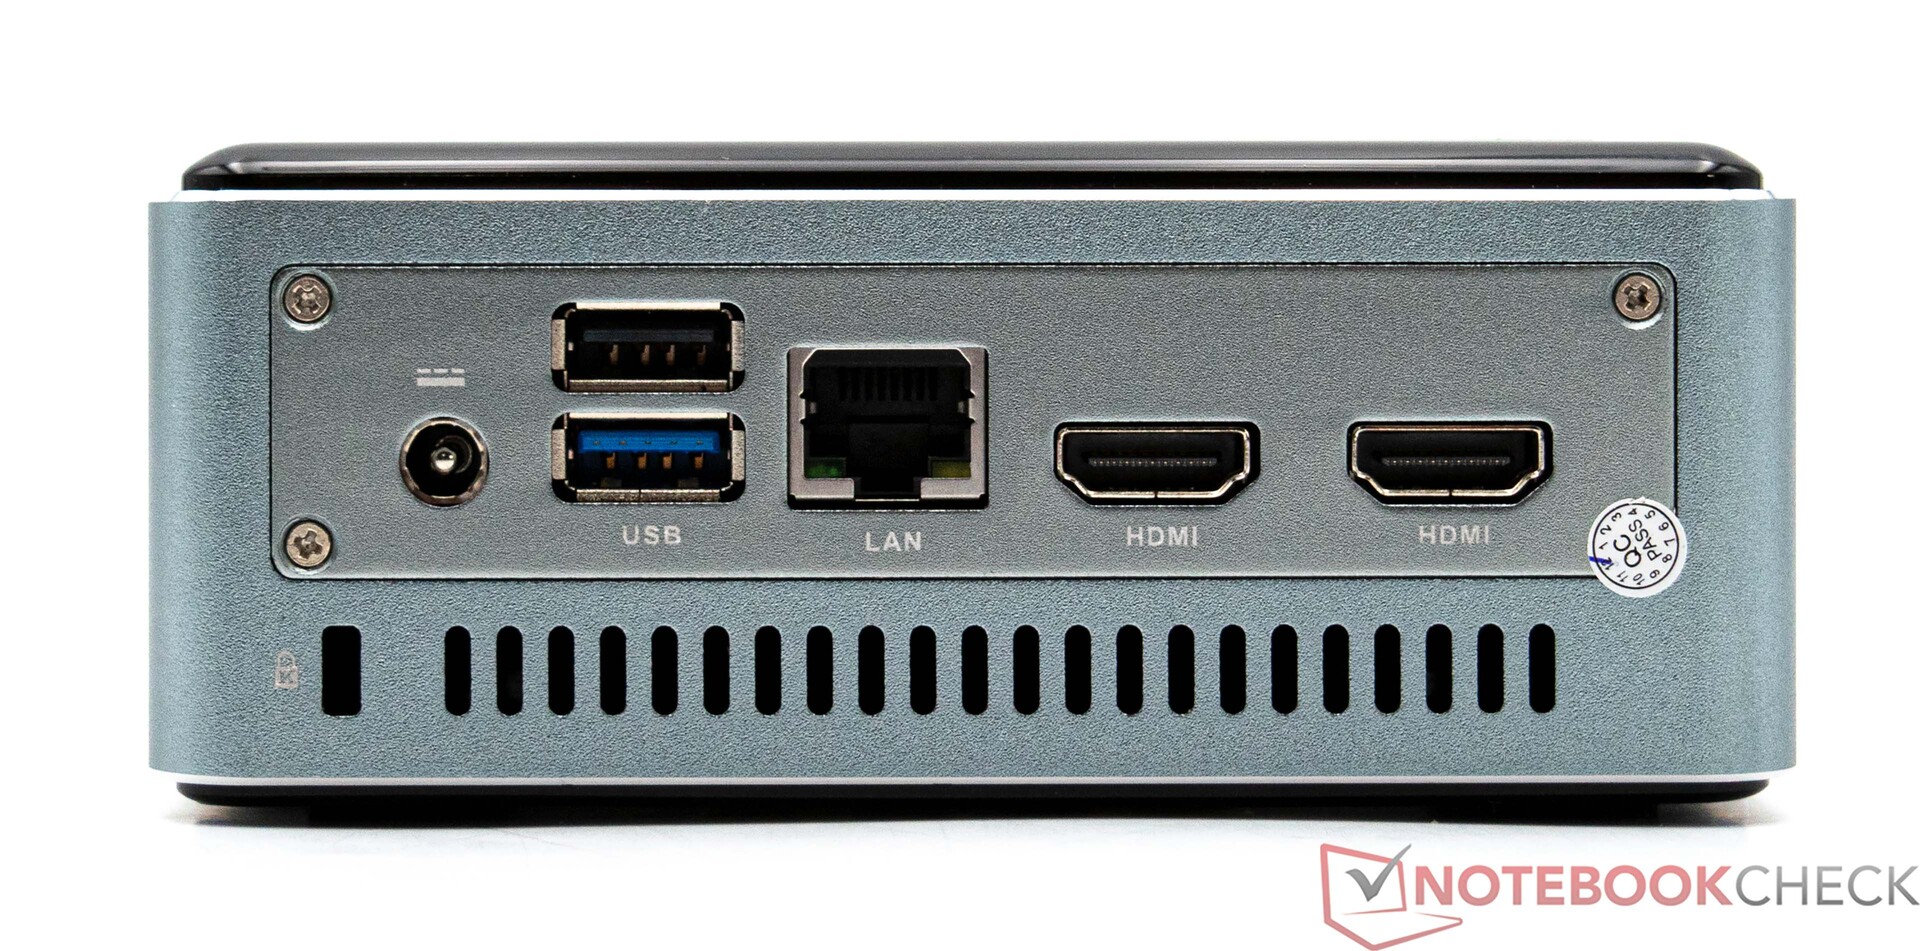
No que diz respeito às portas, o Maxtang MTN-FP750 oferece o básico. Todas elas podem ser encontradas na parte frontal e traseira. Há um total de cinco portas USB, uma das quais (USB Tipo C) também pode ser usada como um conector de monitor. Juntamente com as duas saídas HDMI na parte traseira, isso significa que um total de três monitores podem ser operados simultaneamente. Além disso, a parte traseira do dispositivo também abriga a porta LAN 2,5G.
Comunicação
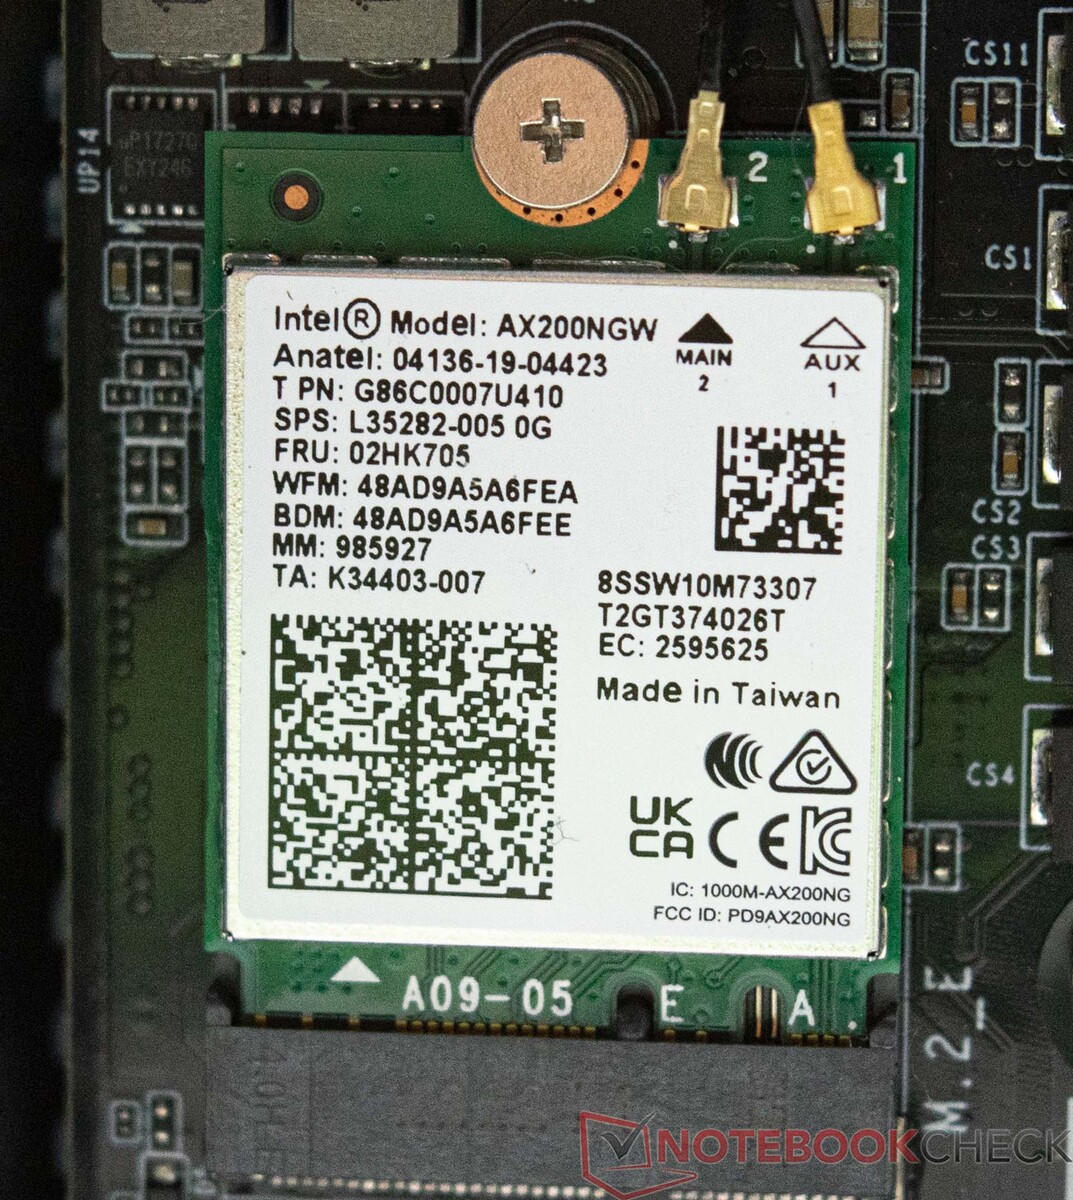
O Maxtang MTN-FP750 possui um módulo sem fio Intel Wi-Fi 6 AX200 que pode lidar com frequências de 2,4 e 5 GHz. Nos testes, nossa amostra de análise não nos surpreendeu exatamente com resultados impressionantes. Para o teste, usamos um Asus ROG Rapture GT-AXE11000. Como alternativa, o senhor também pode conectar o mini PC Maxtang à rede por meio de uma porta ethernet. É possível obter velocidades de transferência de até 2,5 Gbit/s.
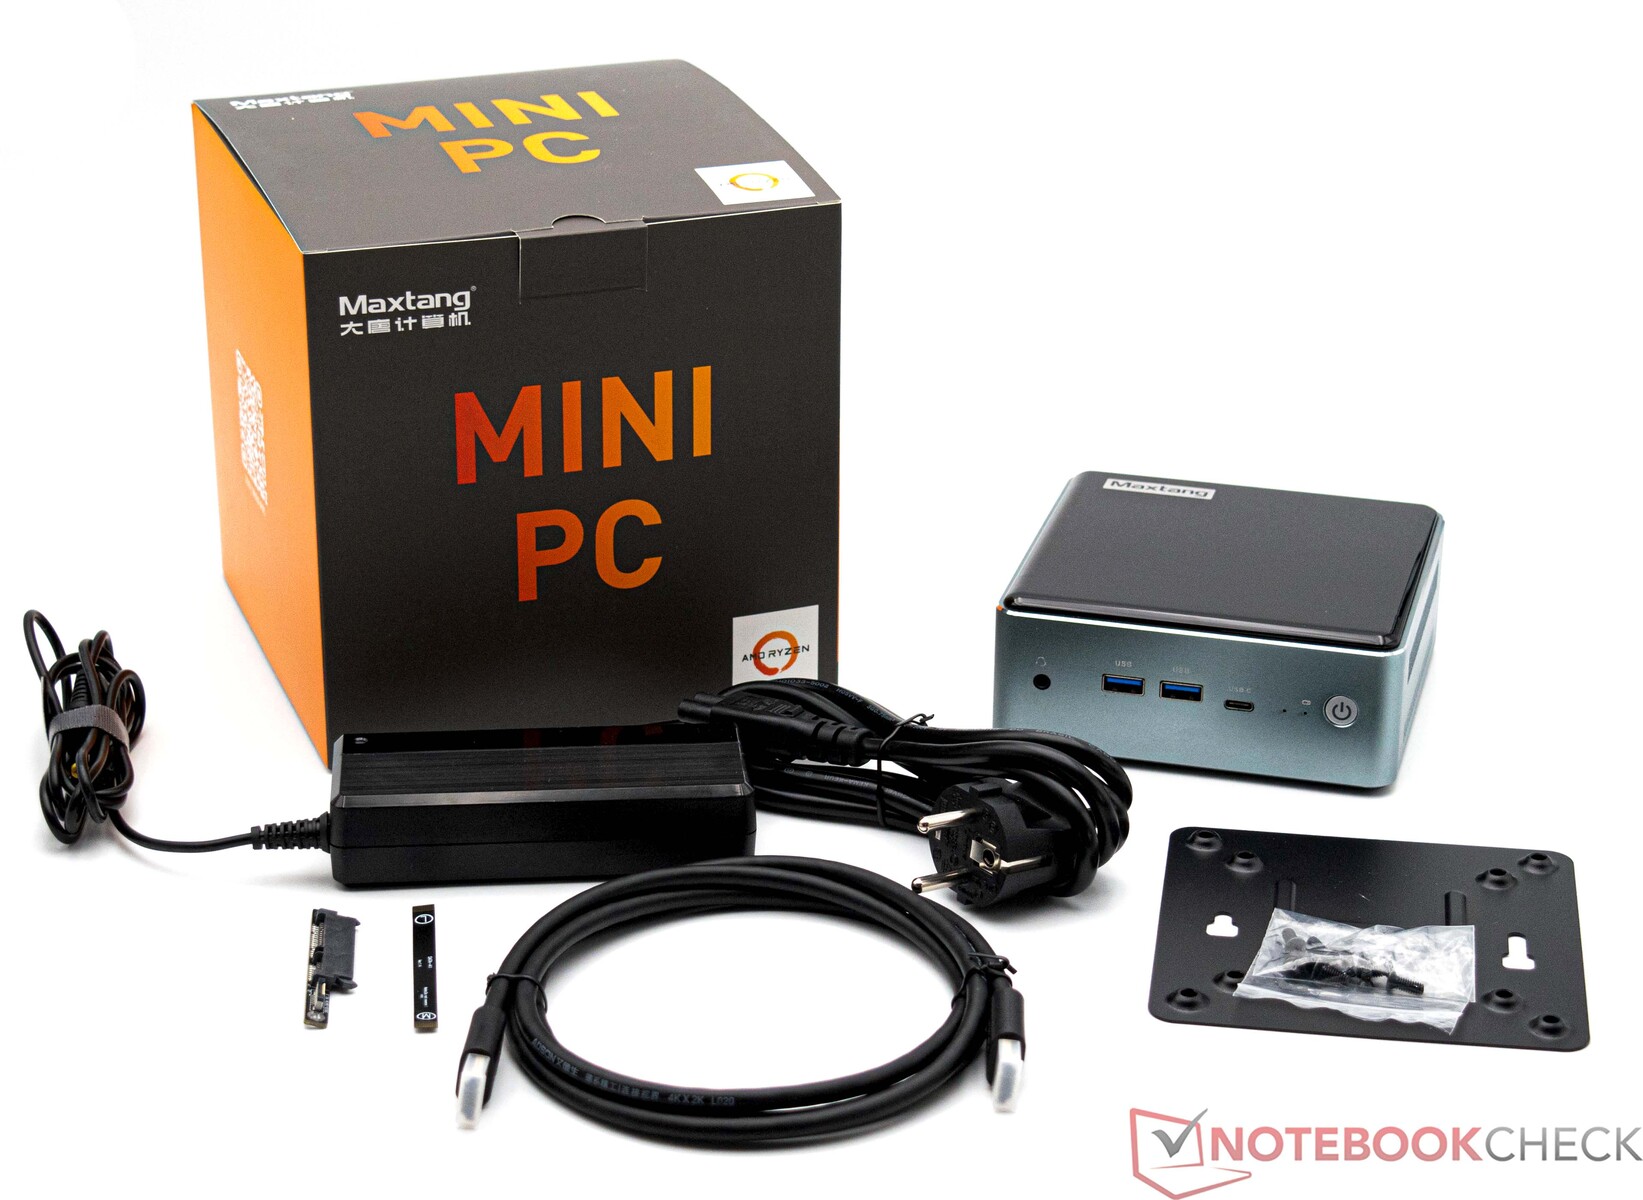
Acessórios
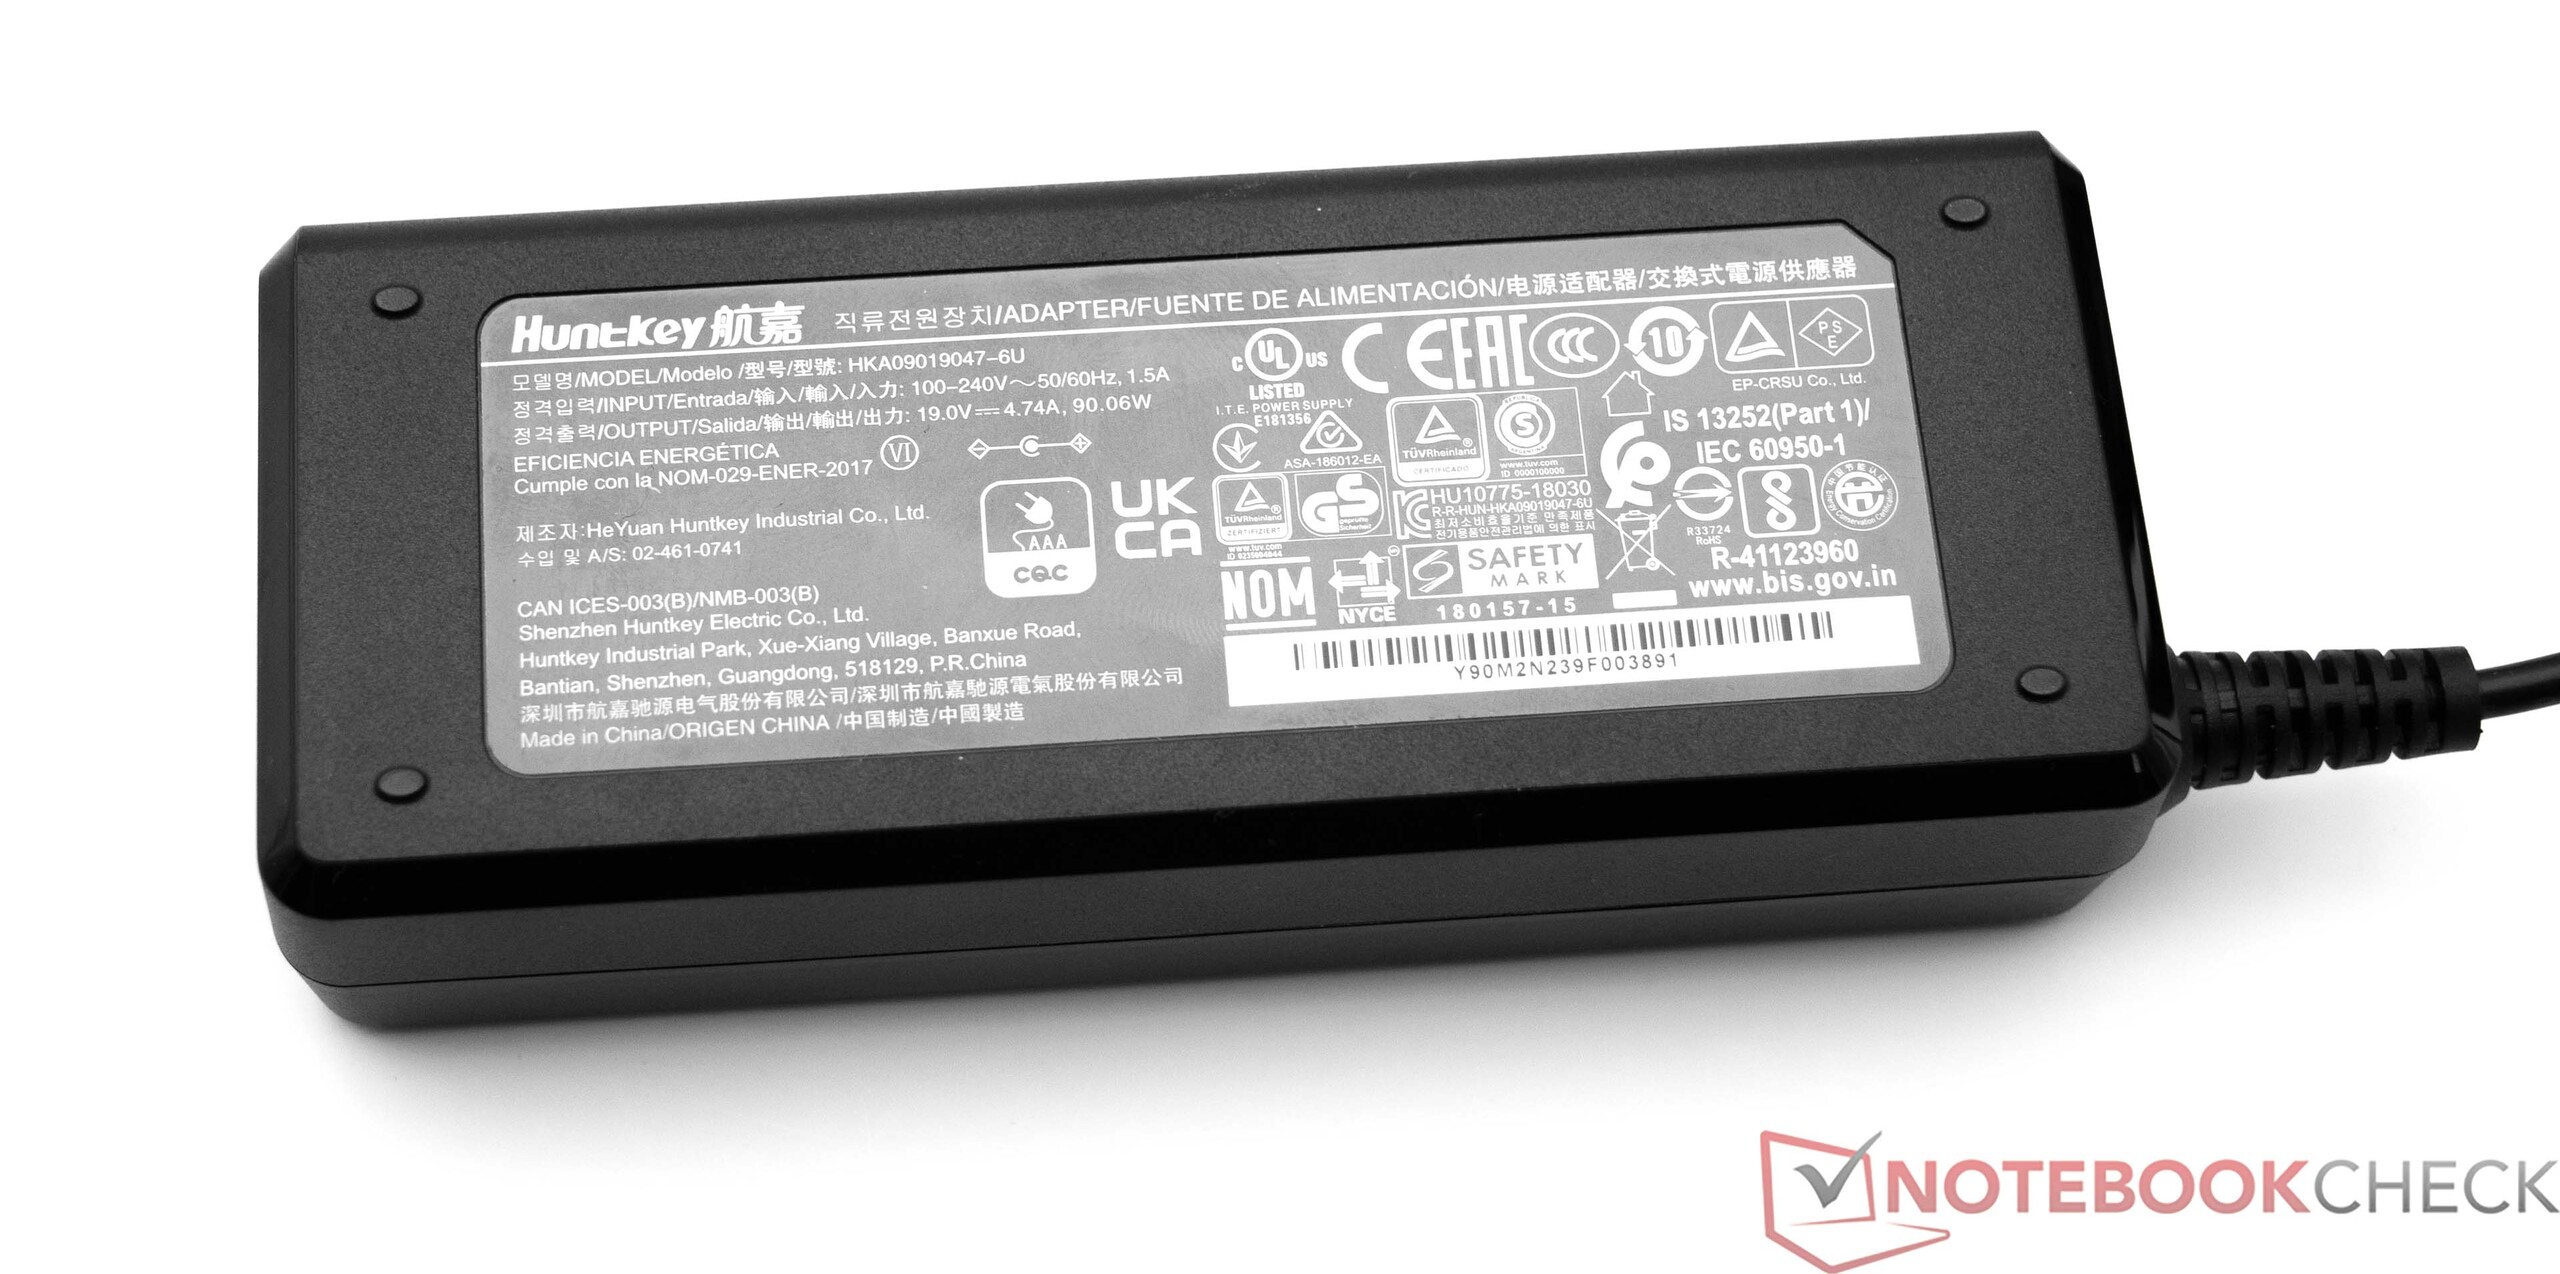
O Maxtang MTN-FP750 vem com todos os componentes mais importantes para colocar o dispositivo em funcionamento. Além da própria máquina, a caixa contém uma fonte de alimentação de 90 watts (19 V; 4,74 A), bem como uma placa de montagem para o conjunto VESA. Da mesma forma, um cabo HDMI e um guia de configuração rápida também fazem parte do pacote.
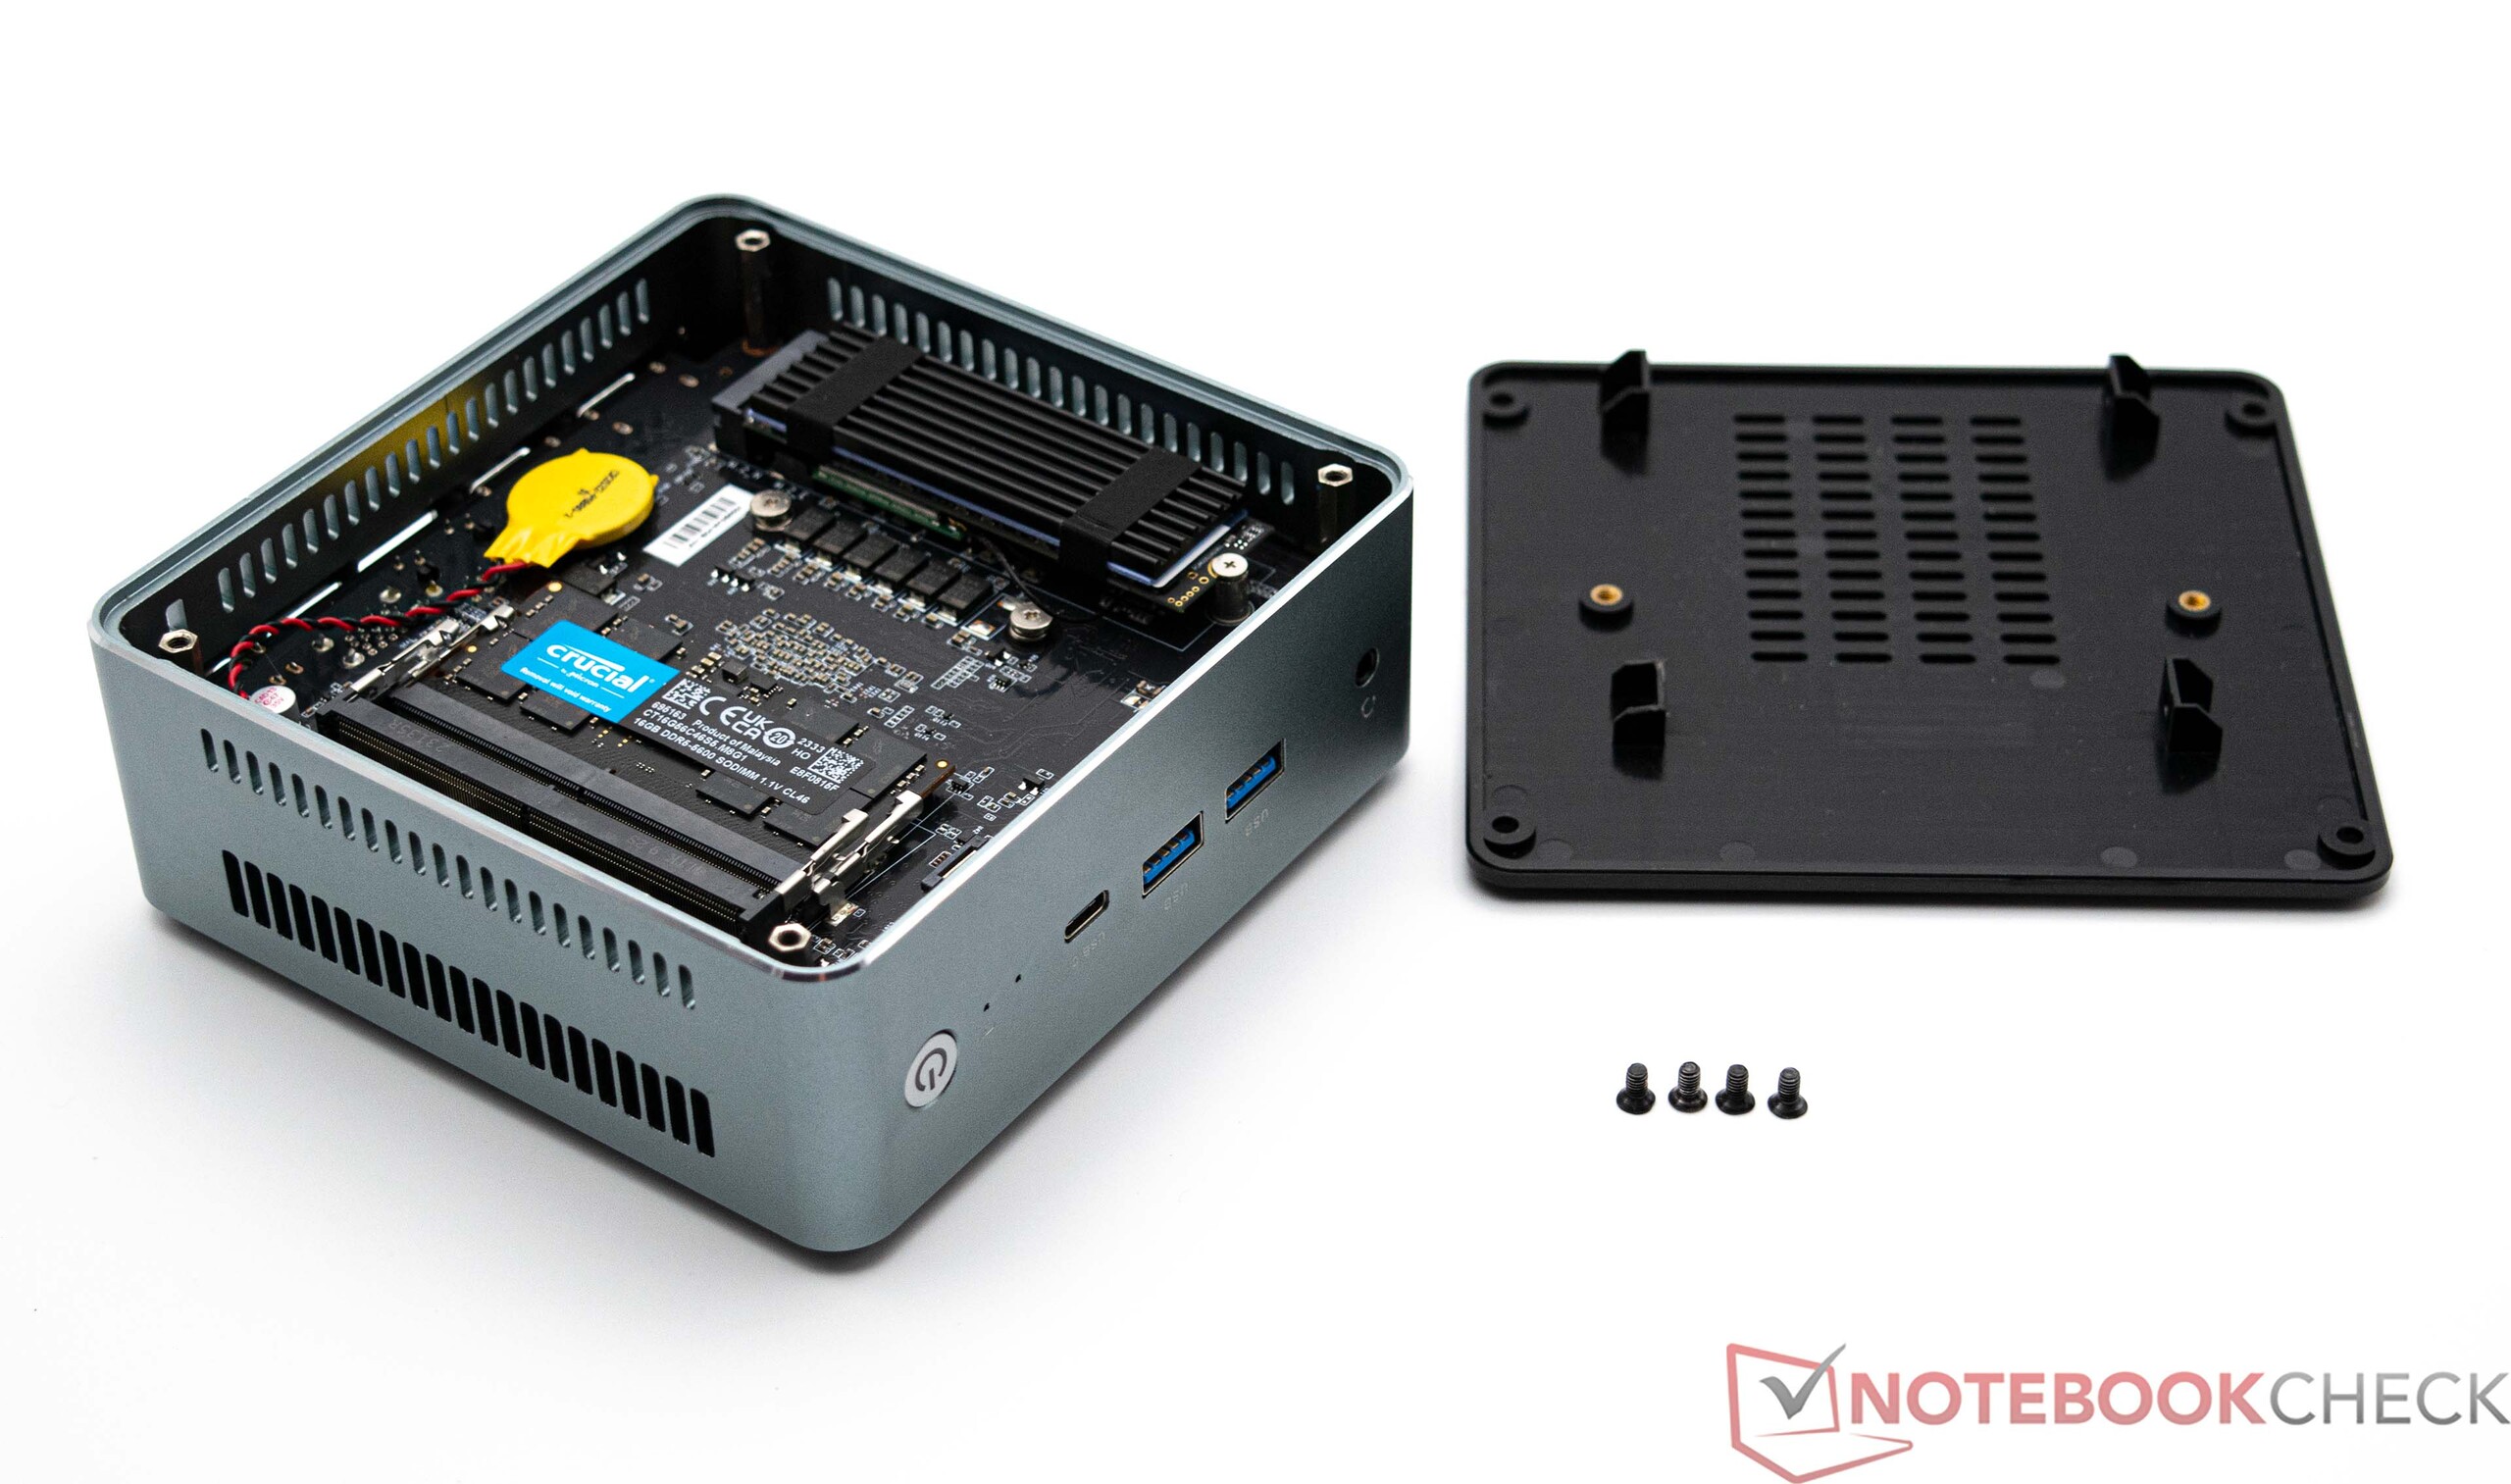
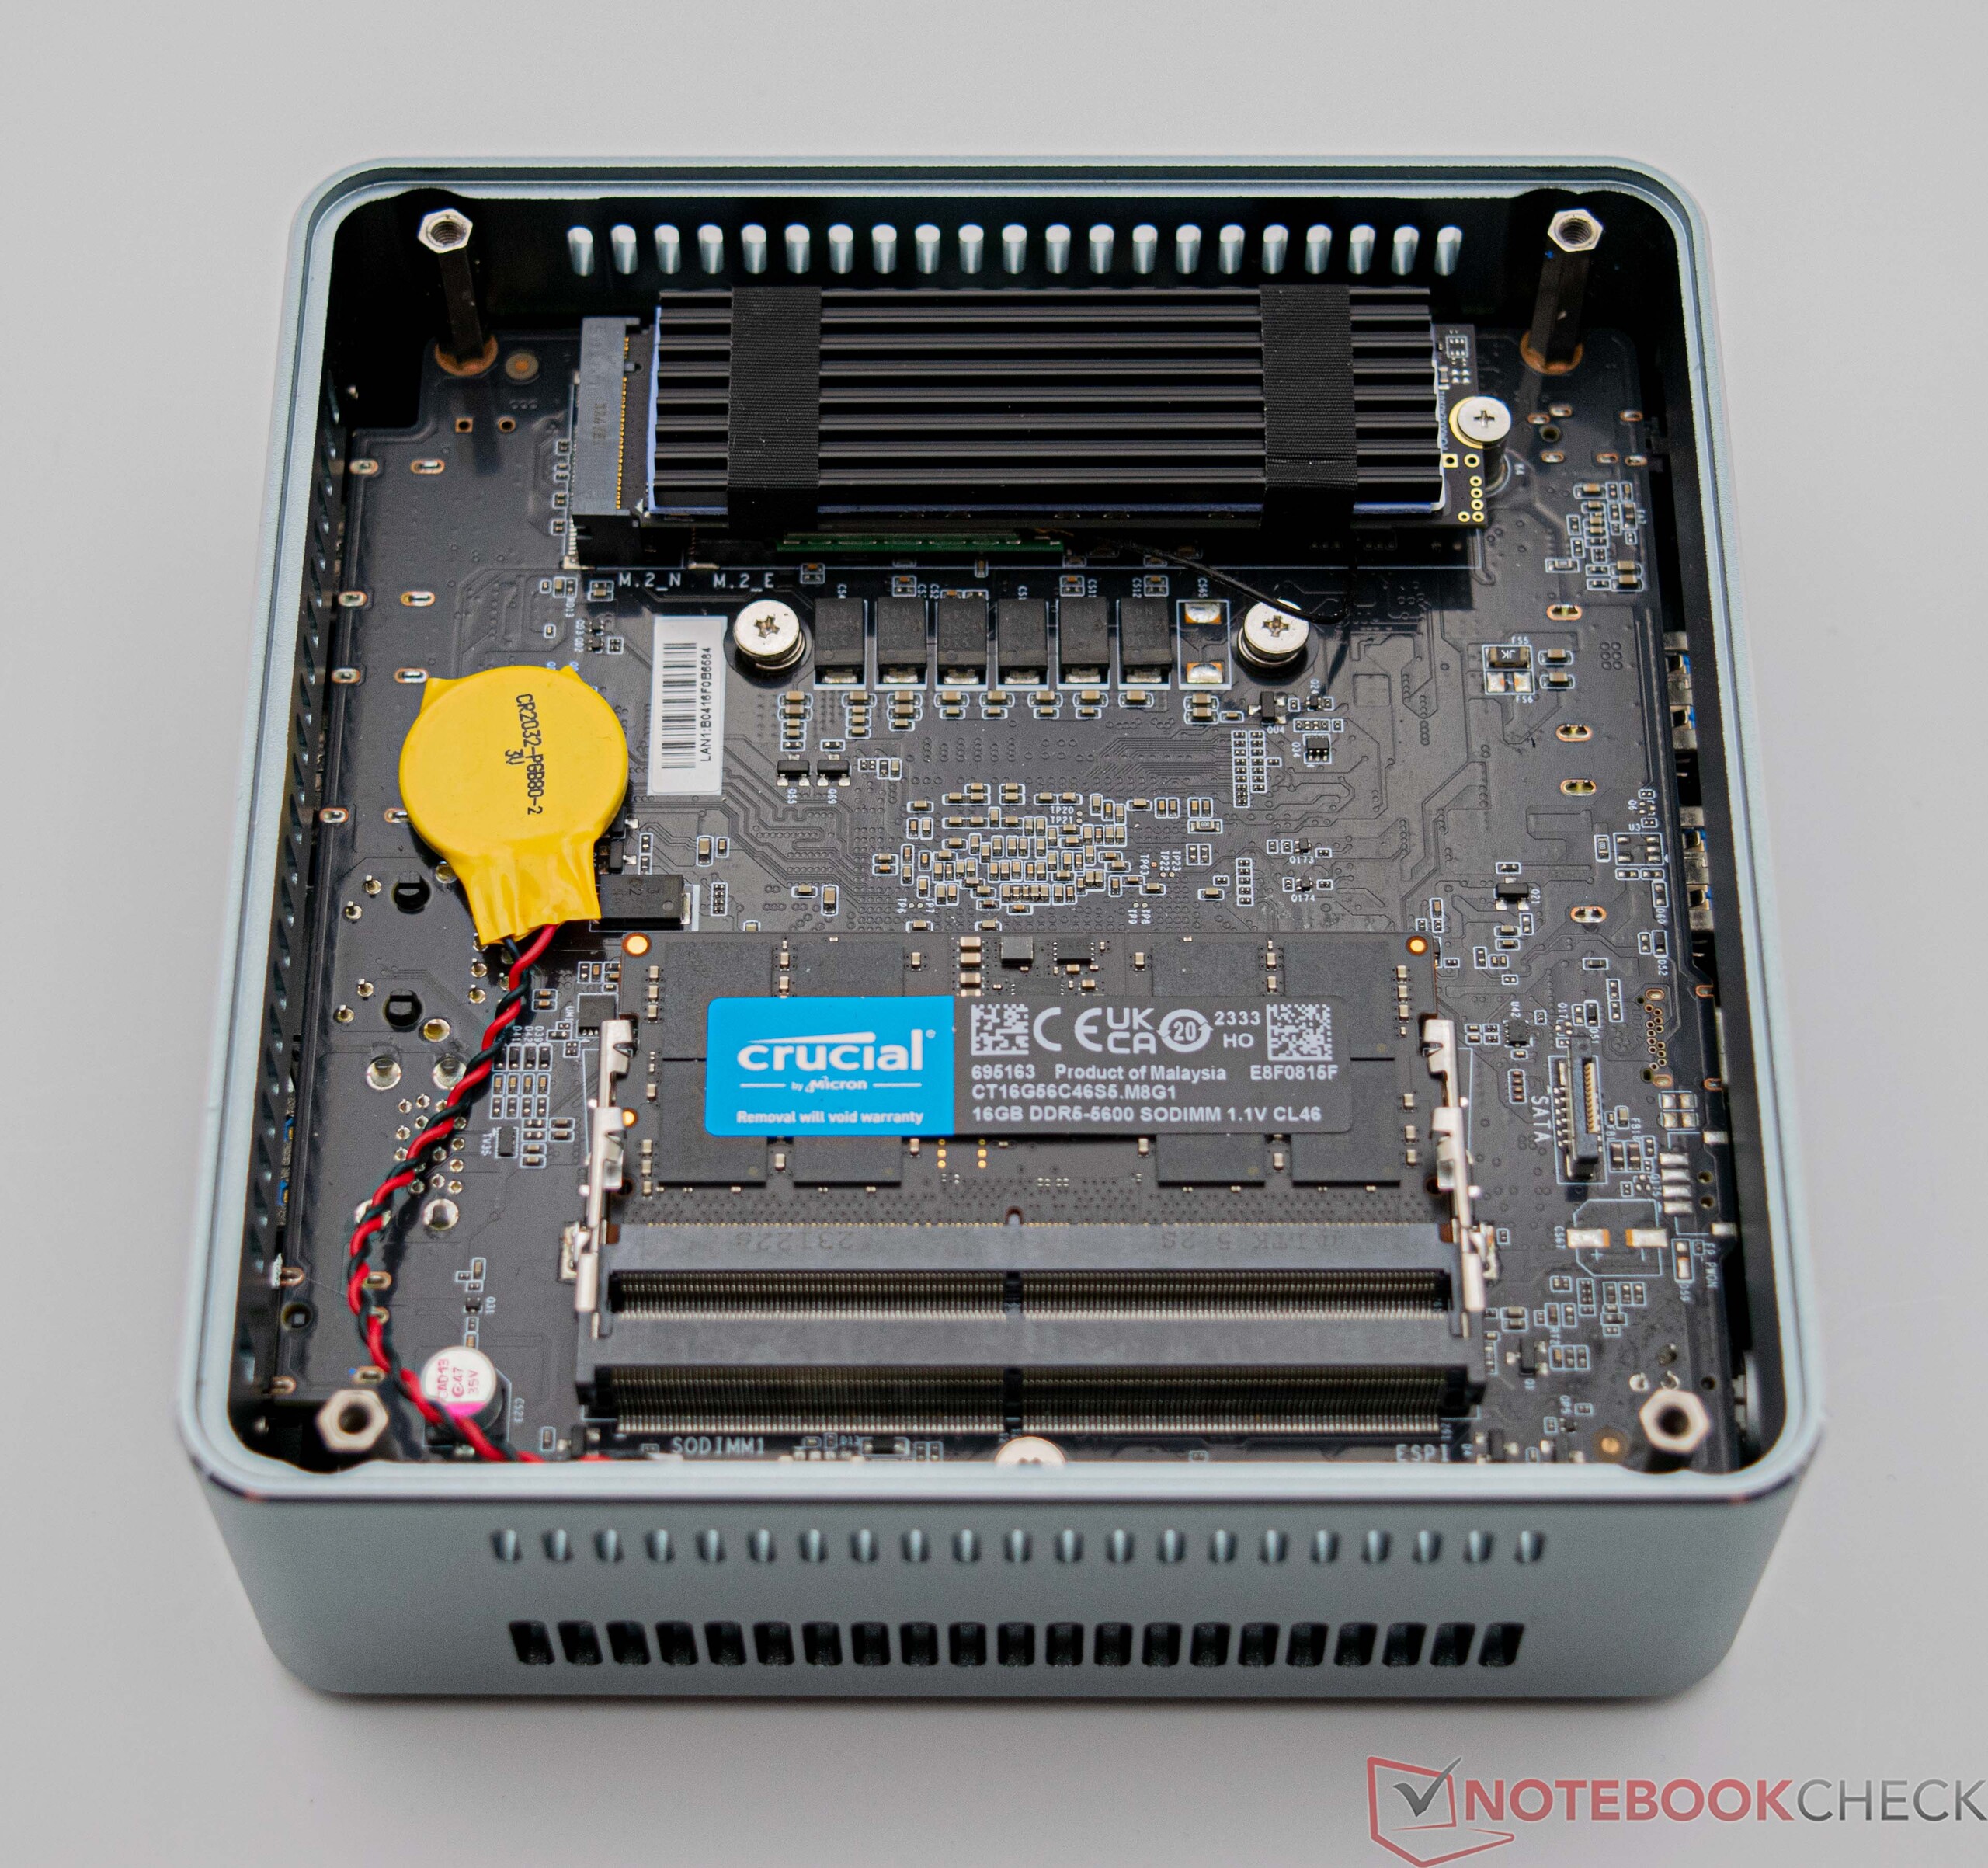
Manutenção
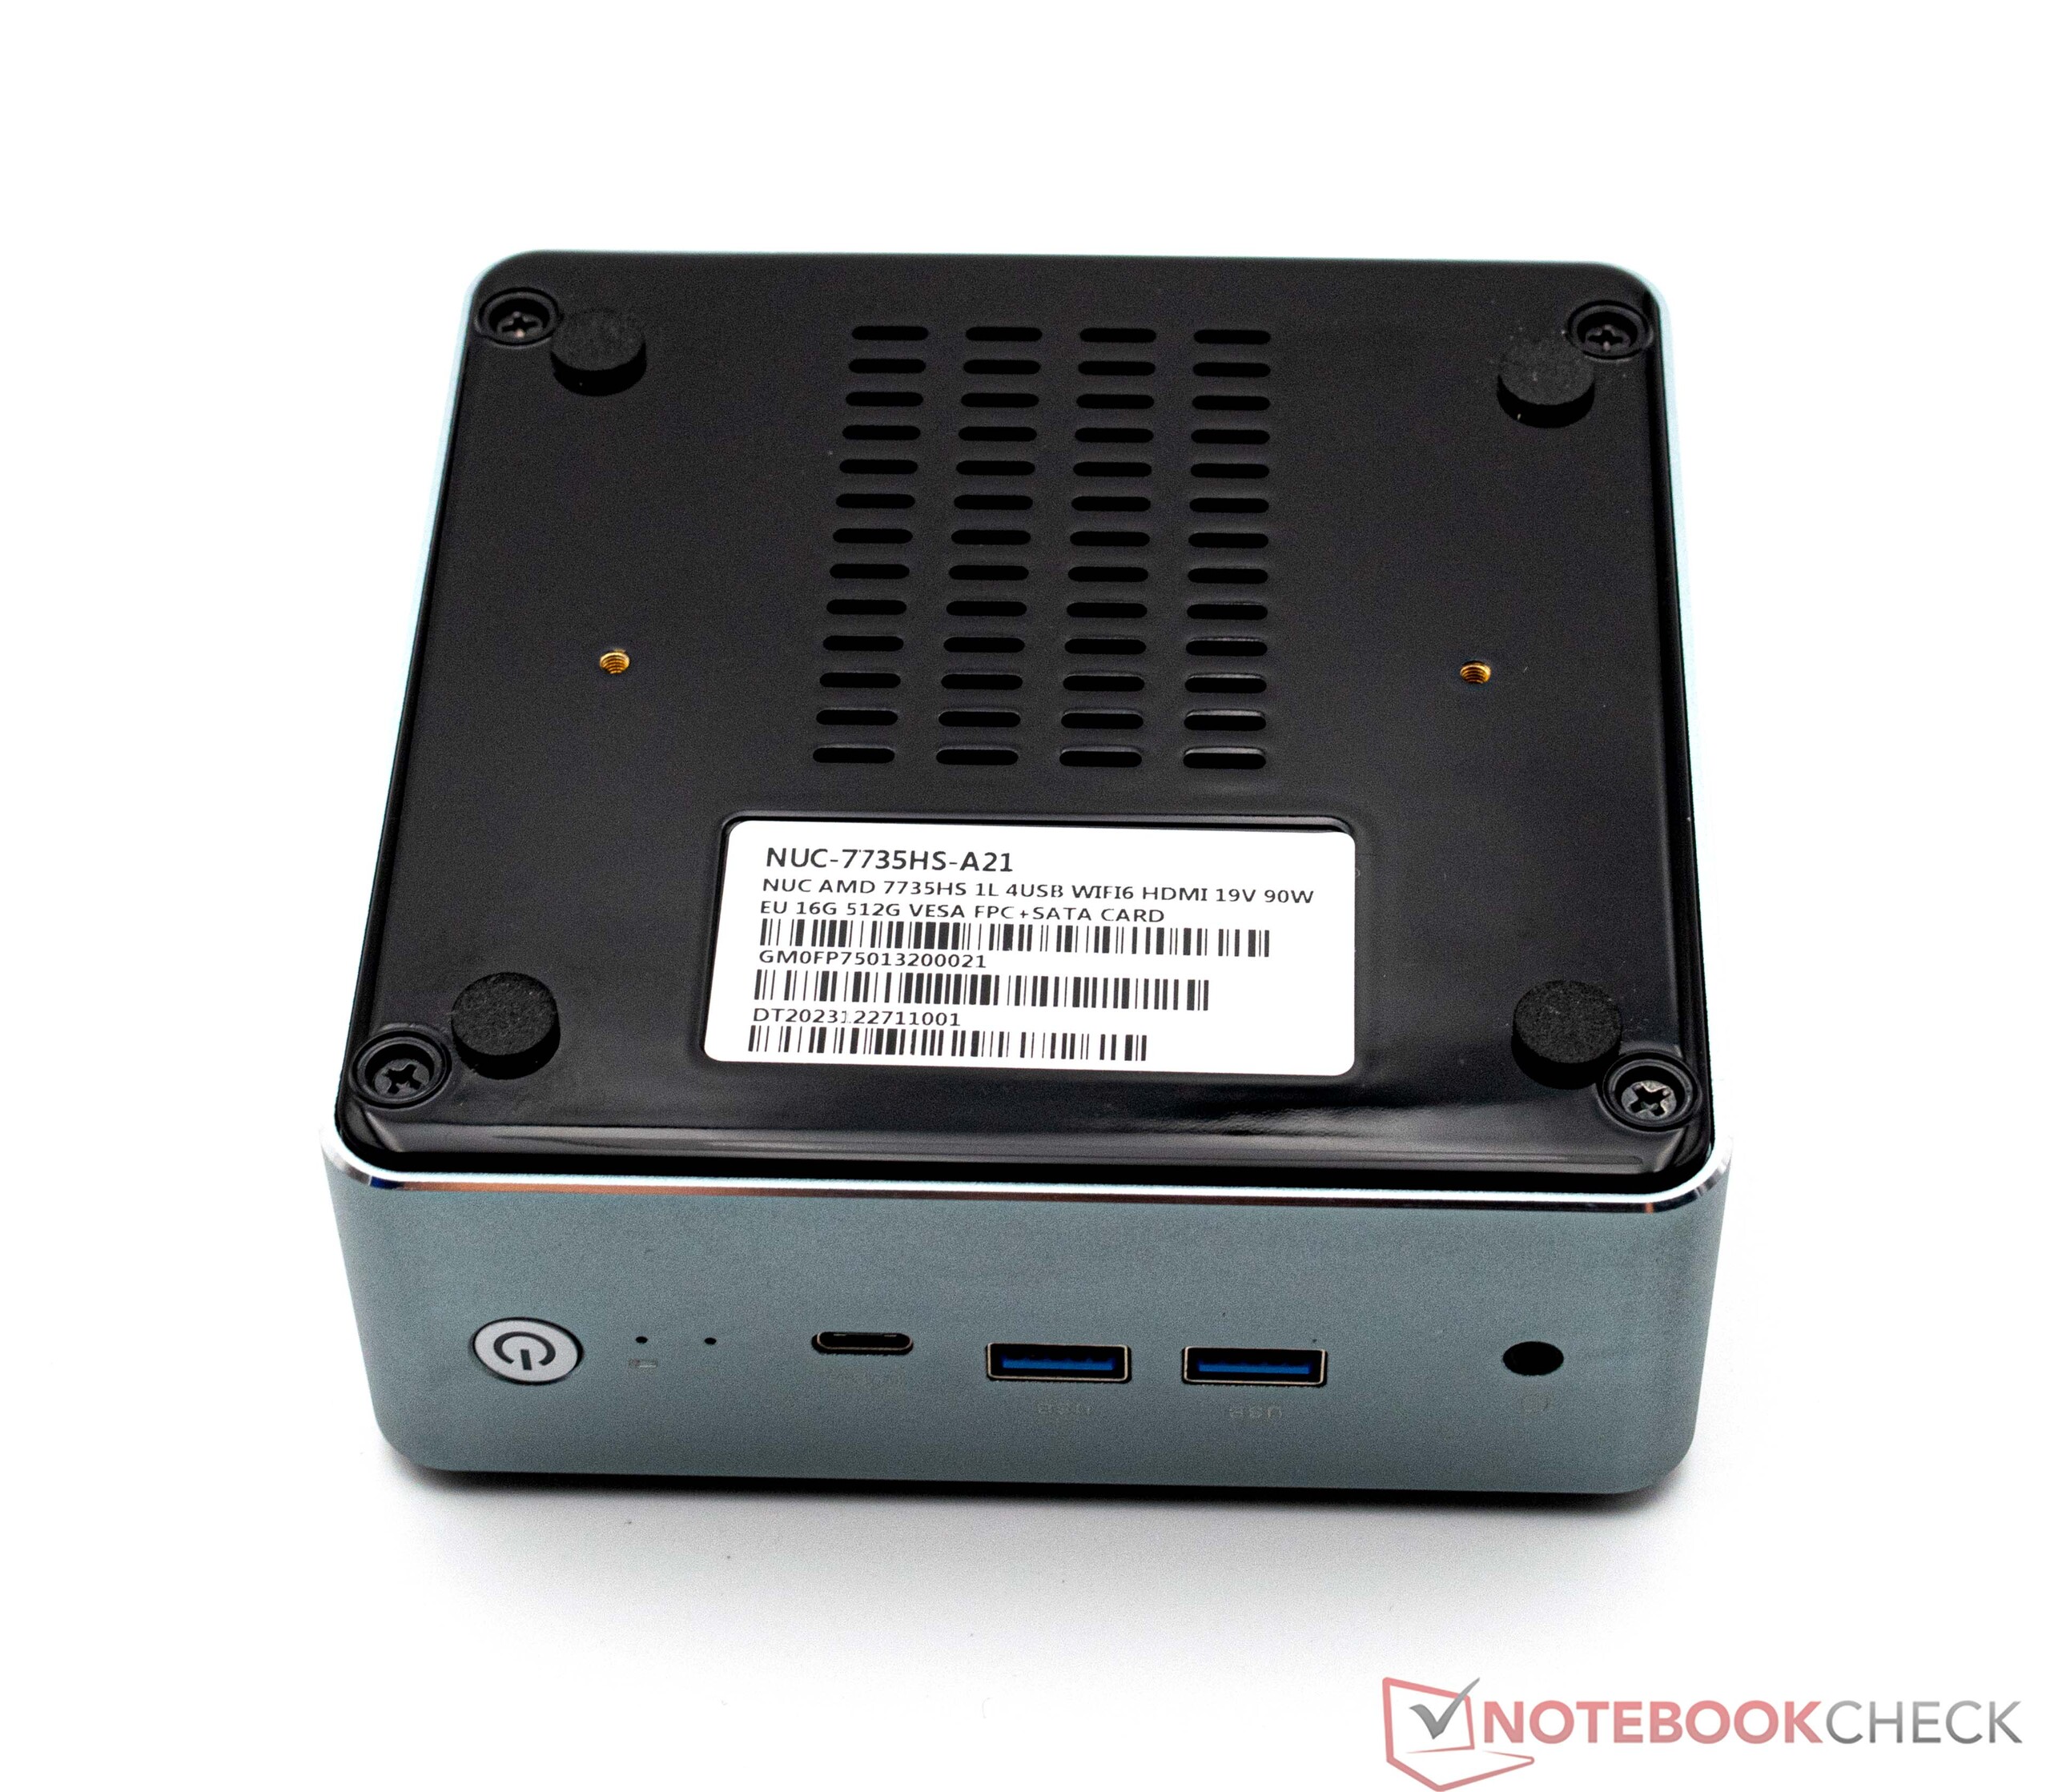
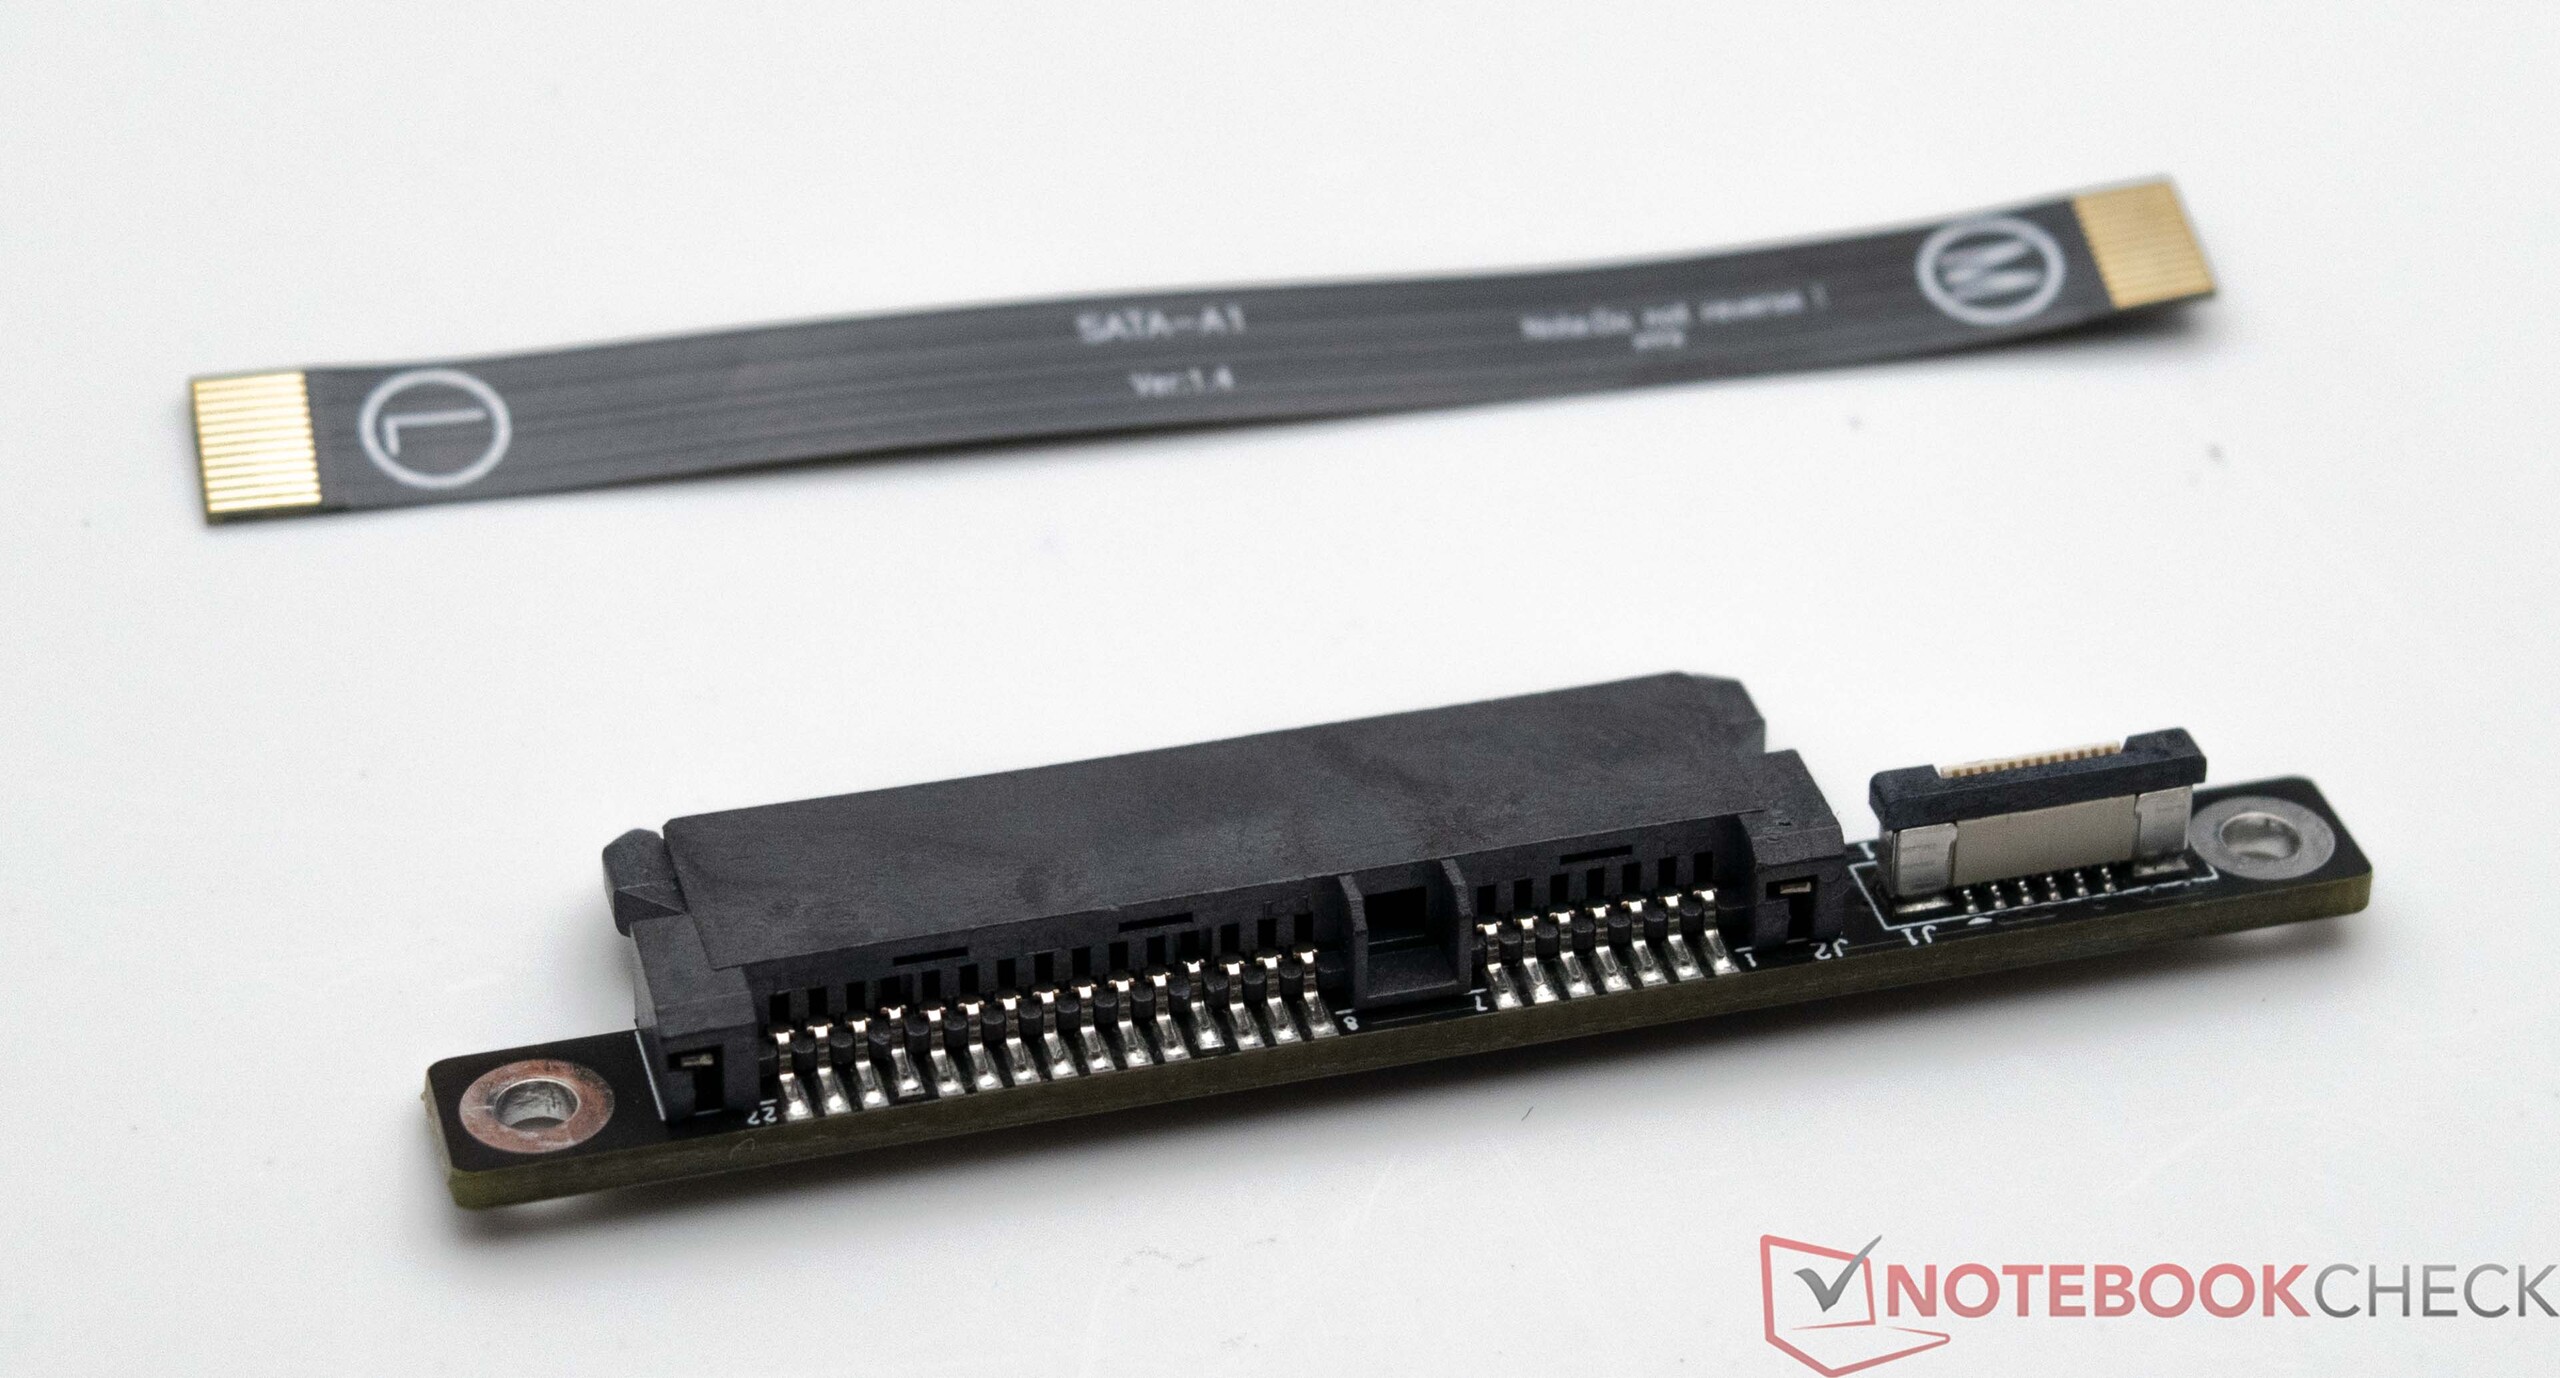
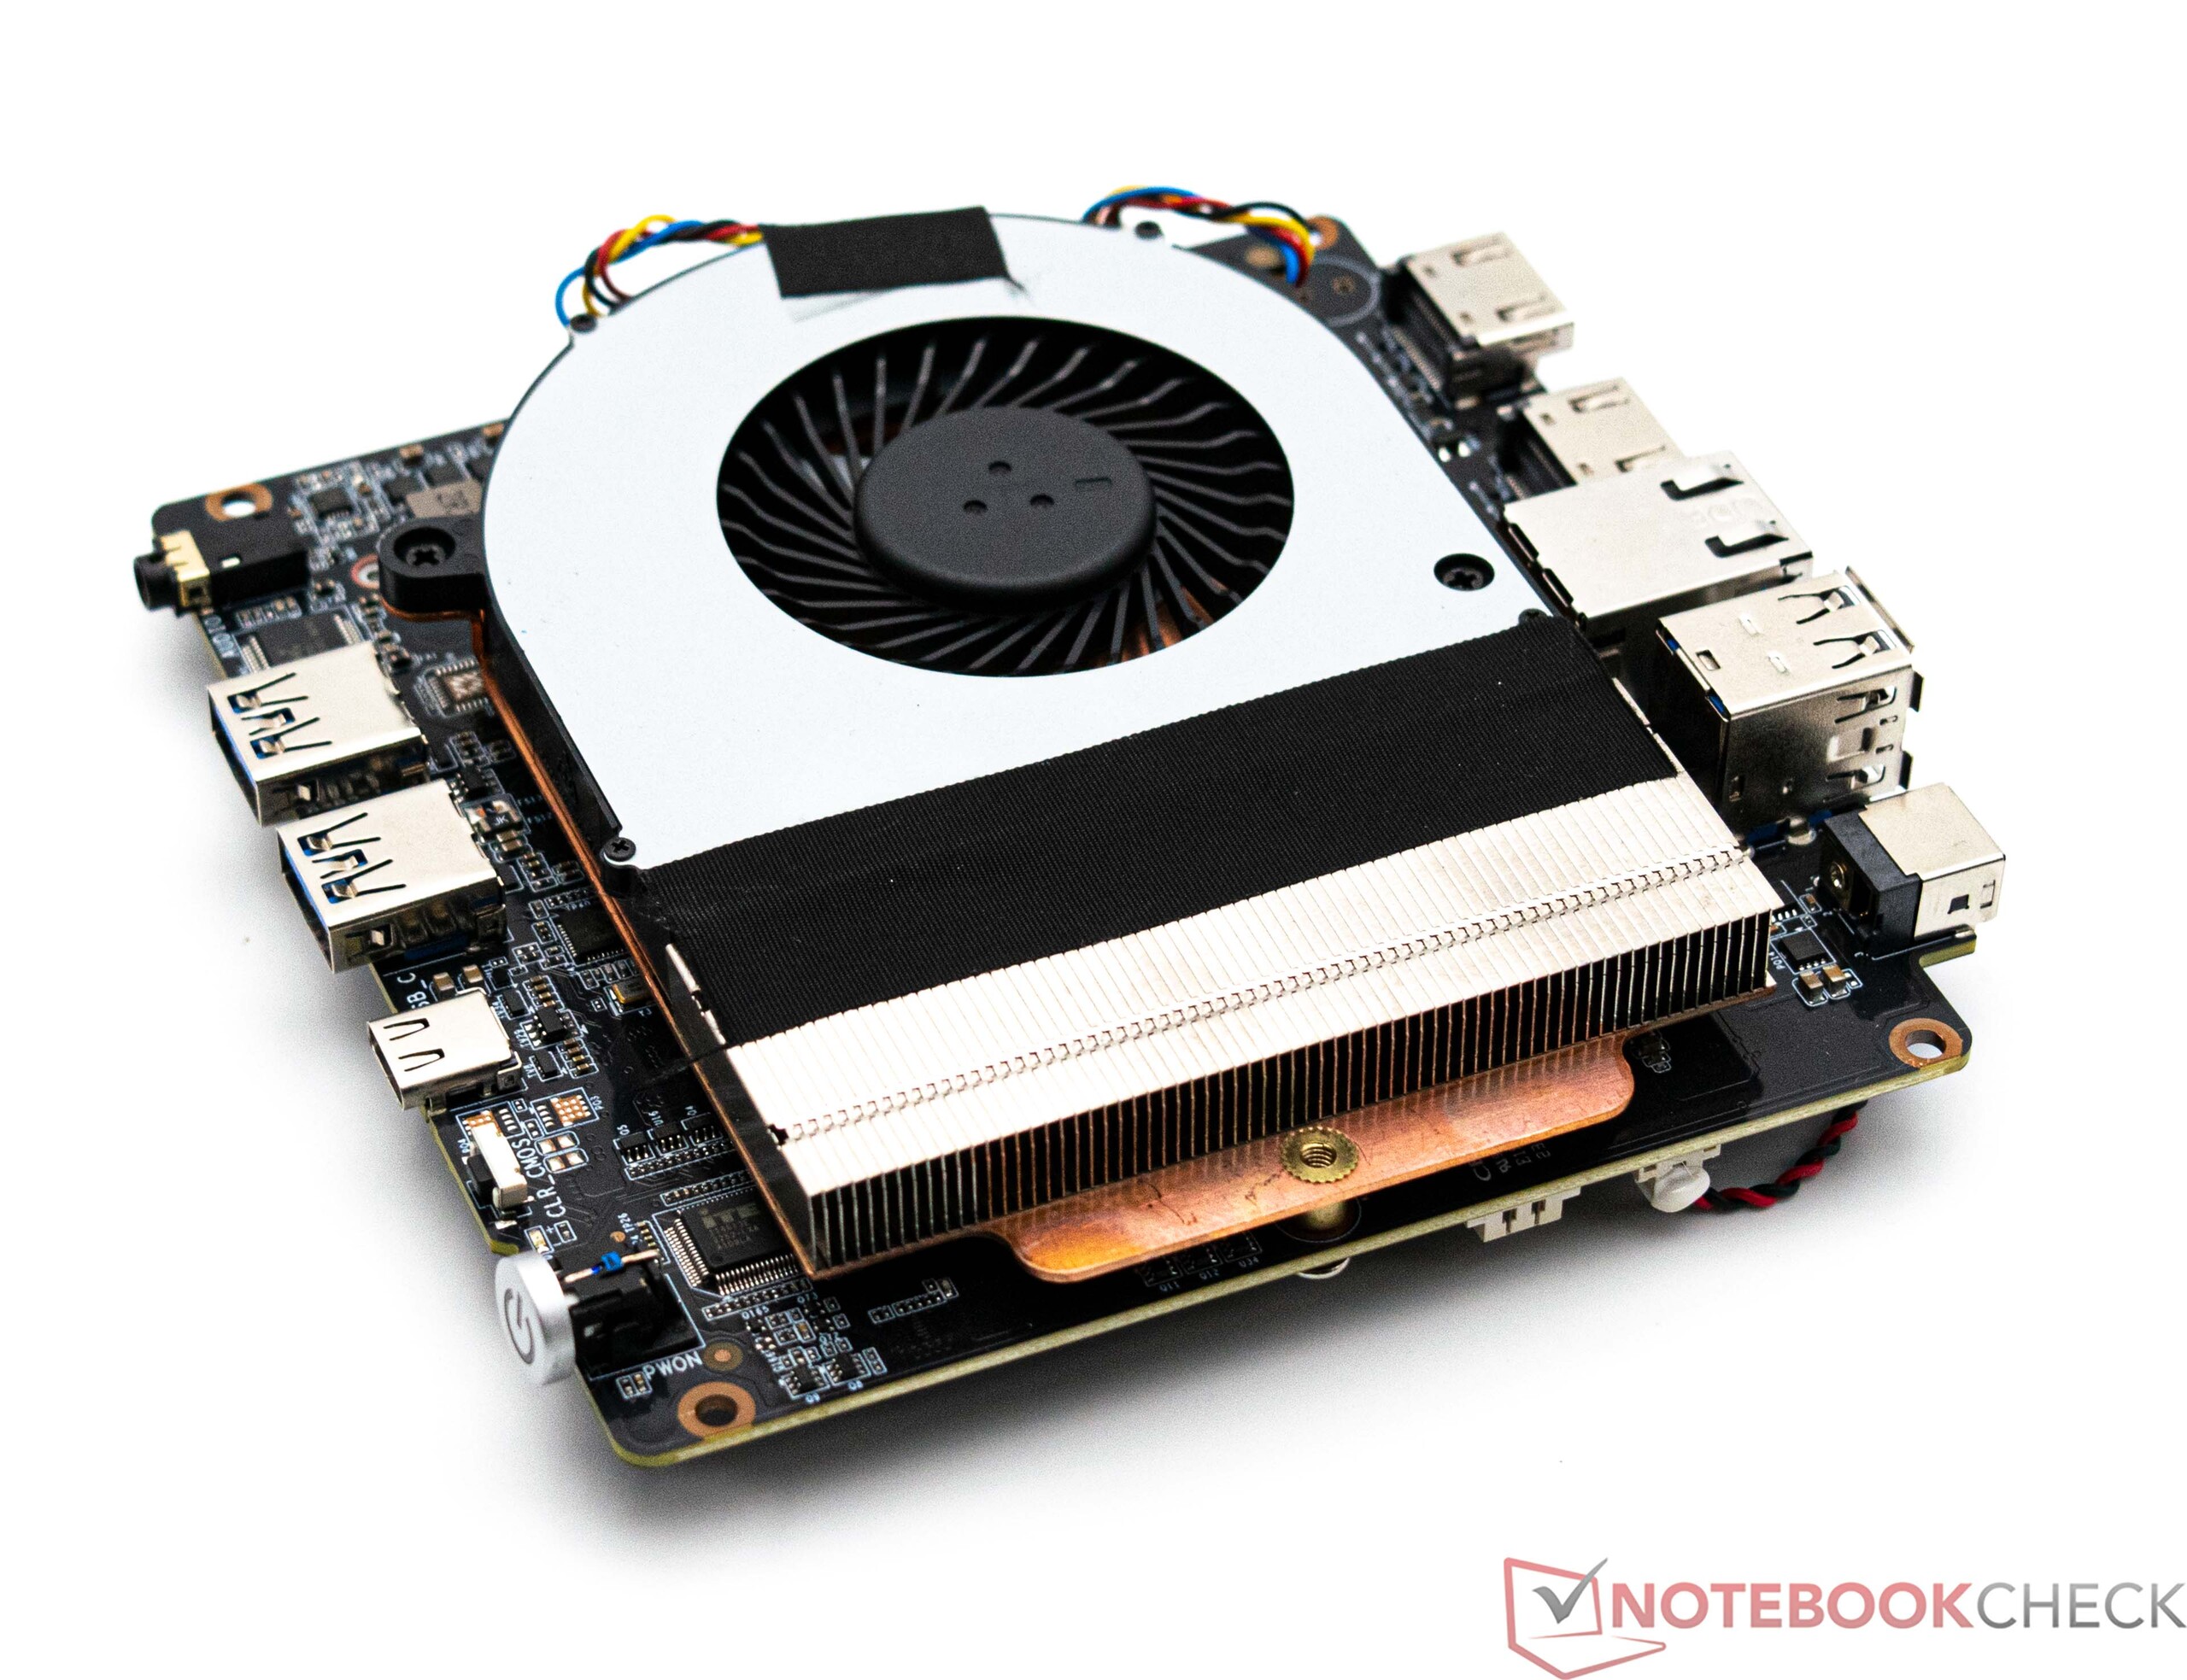
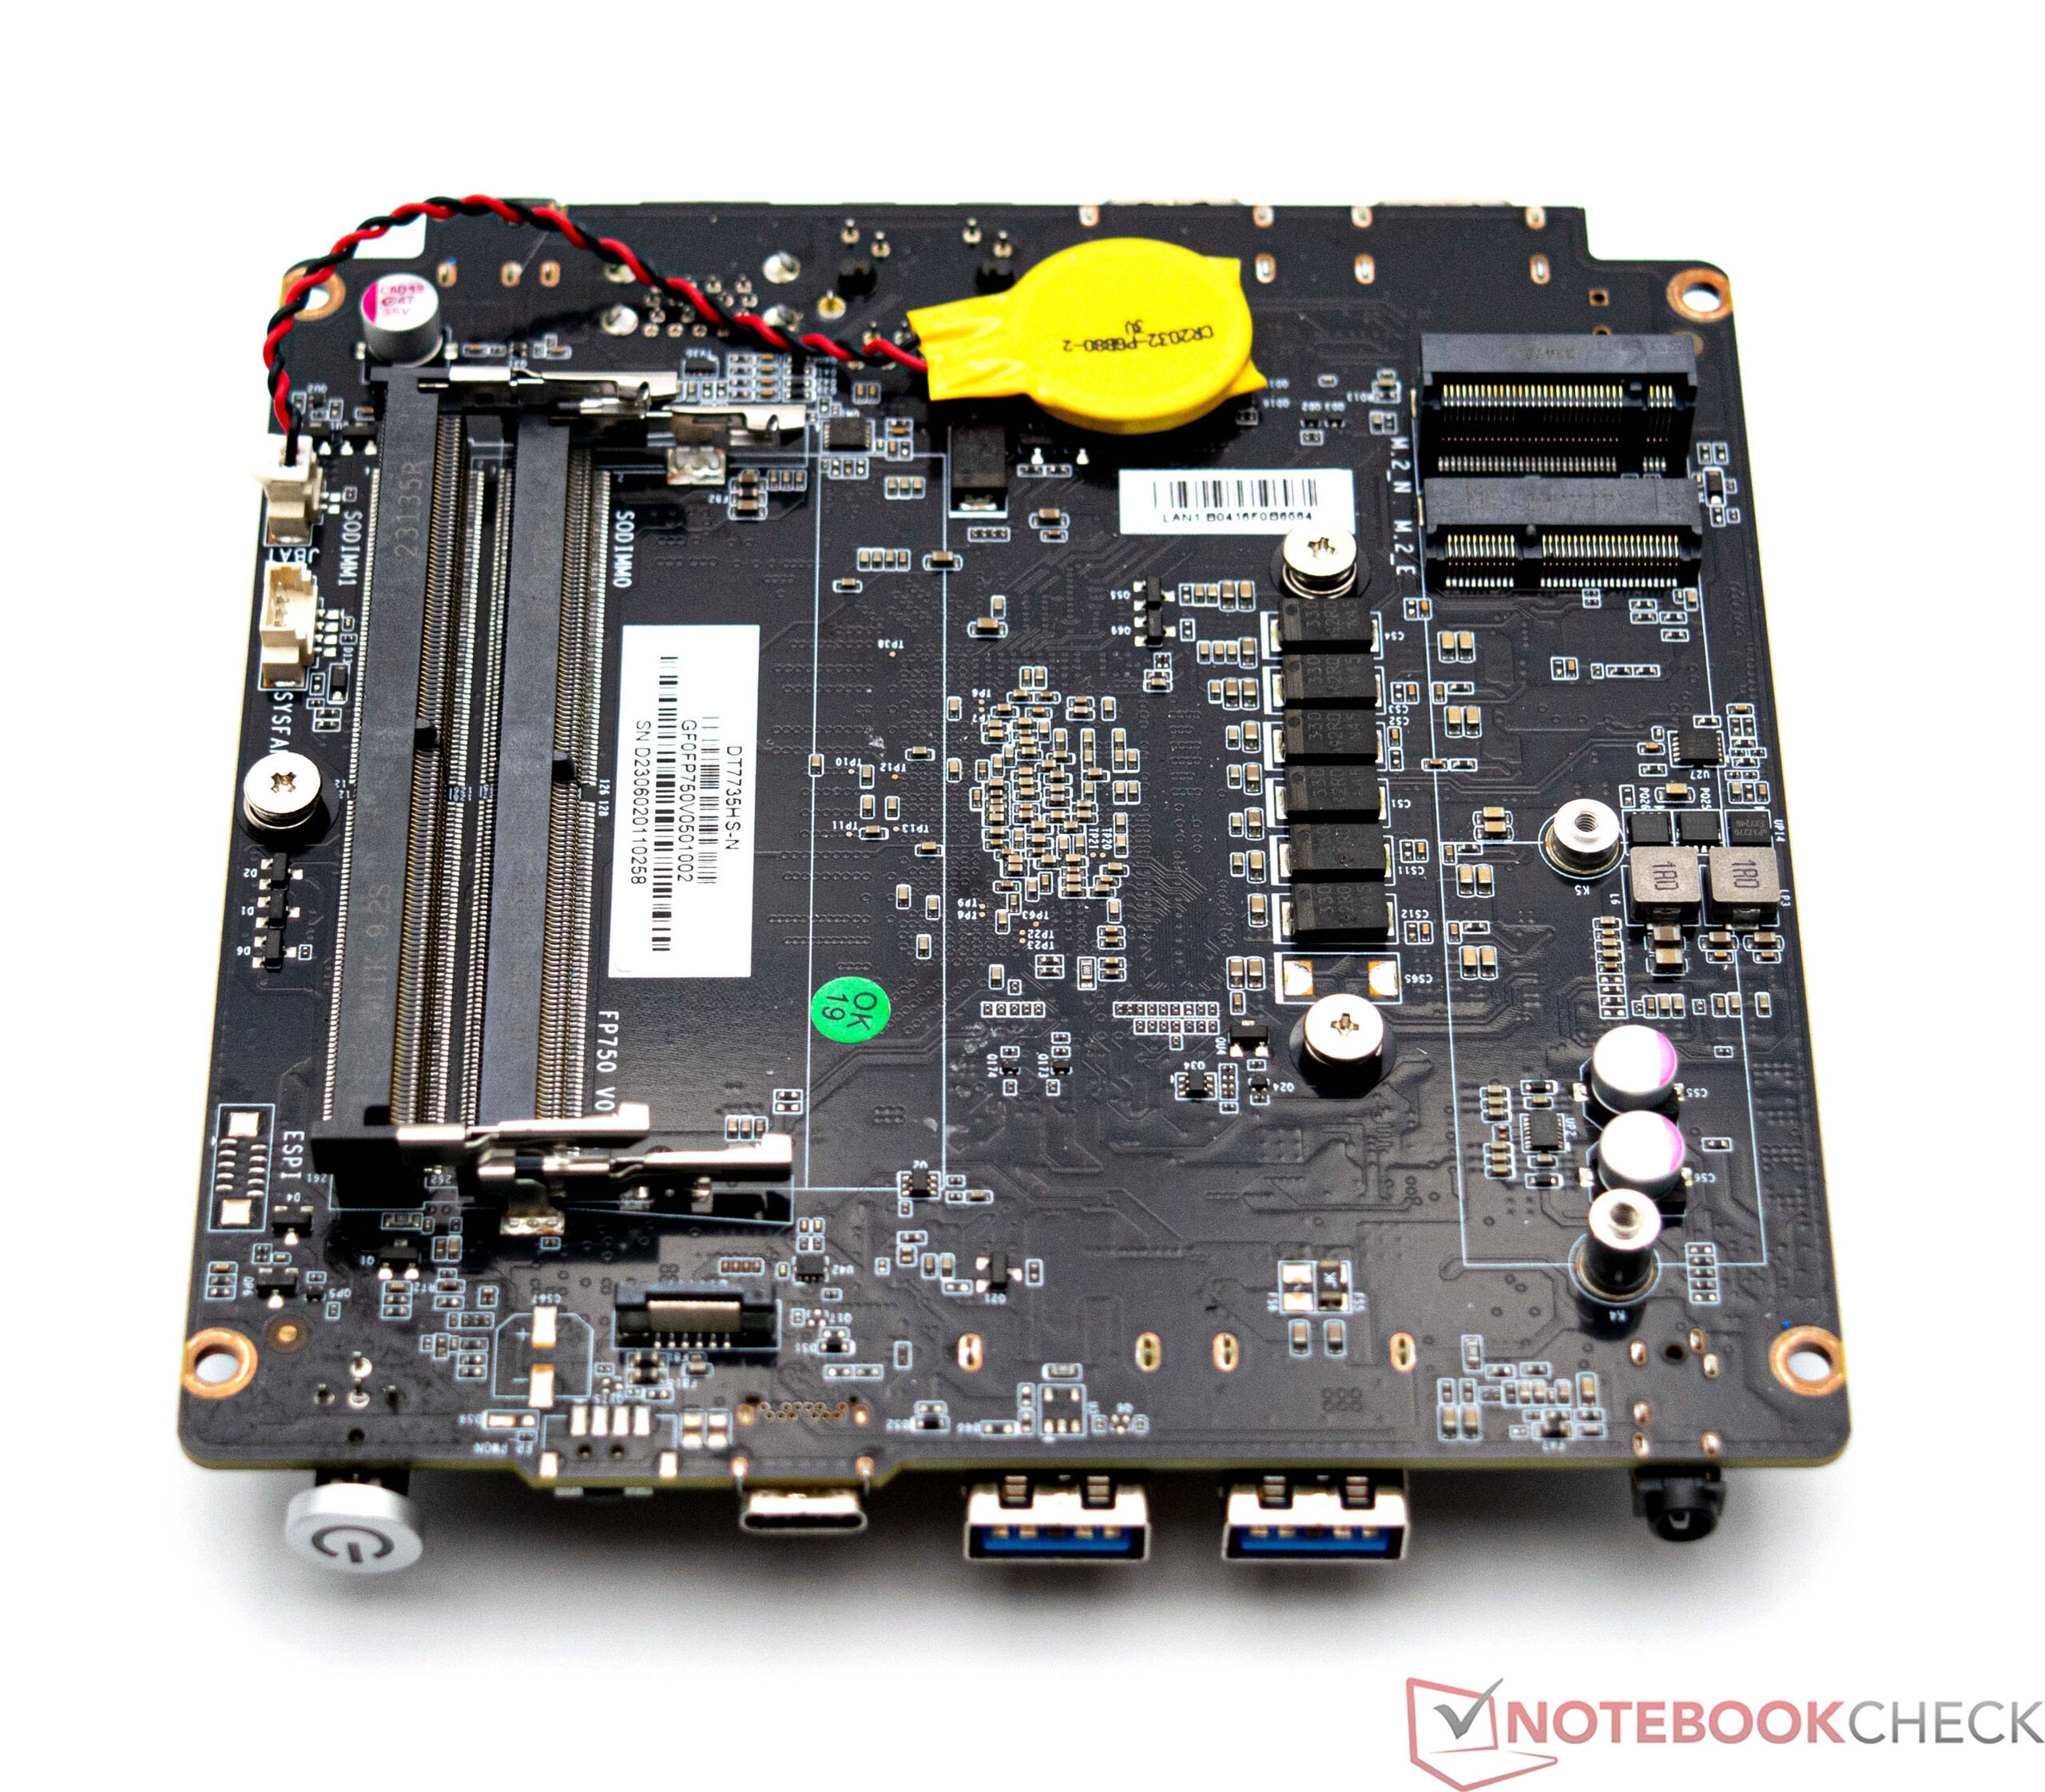
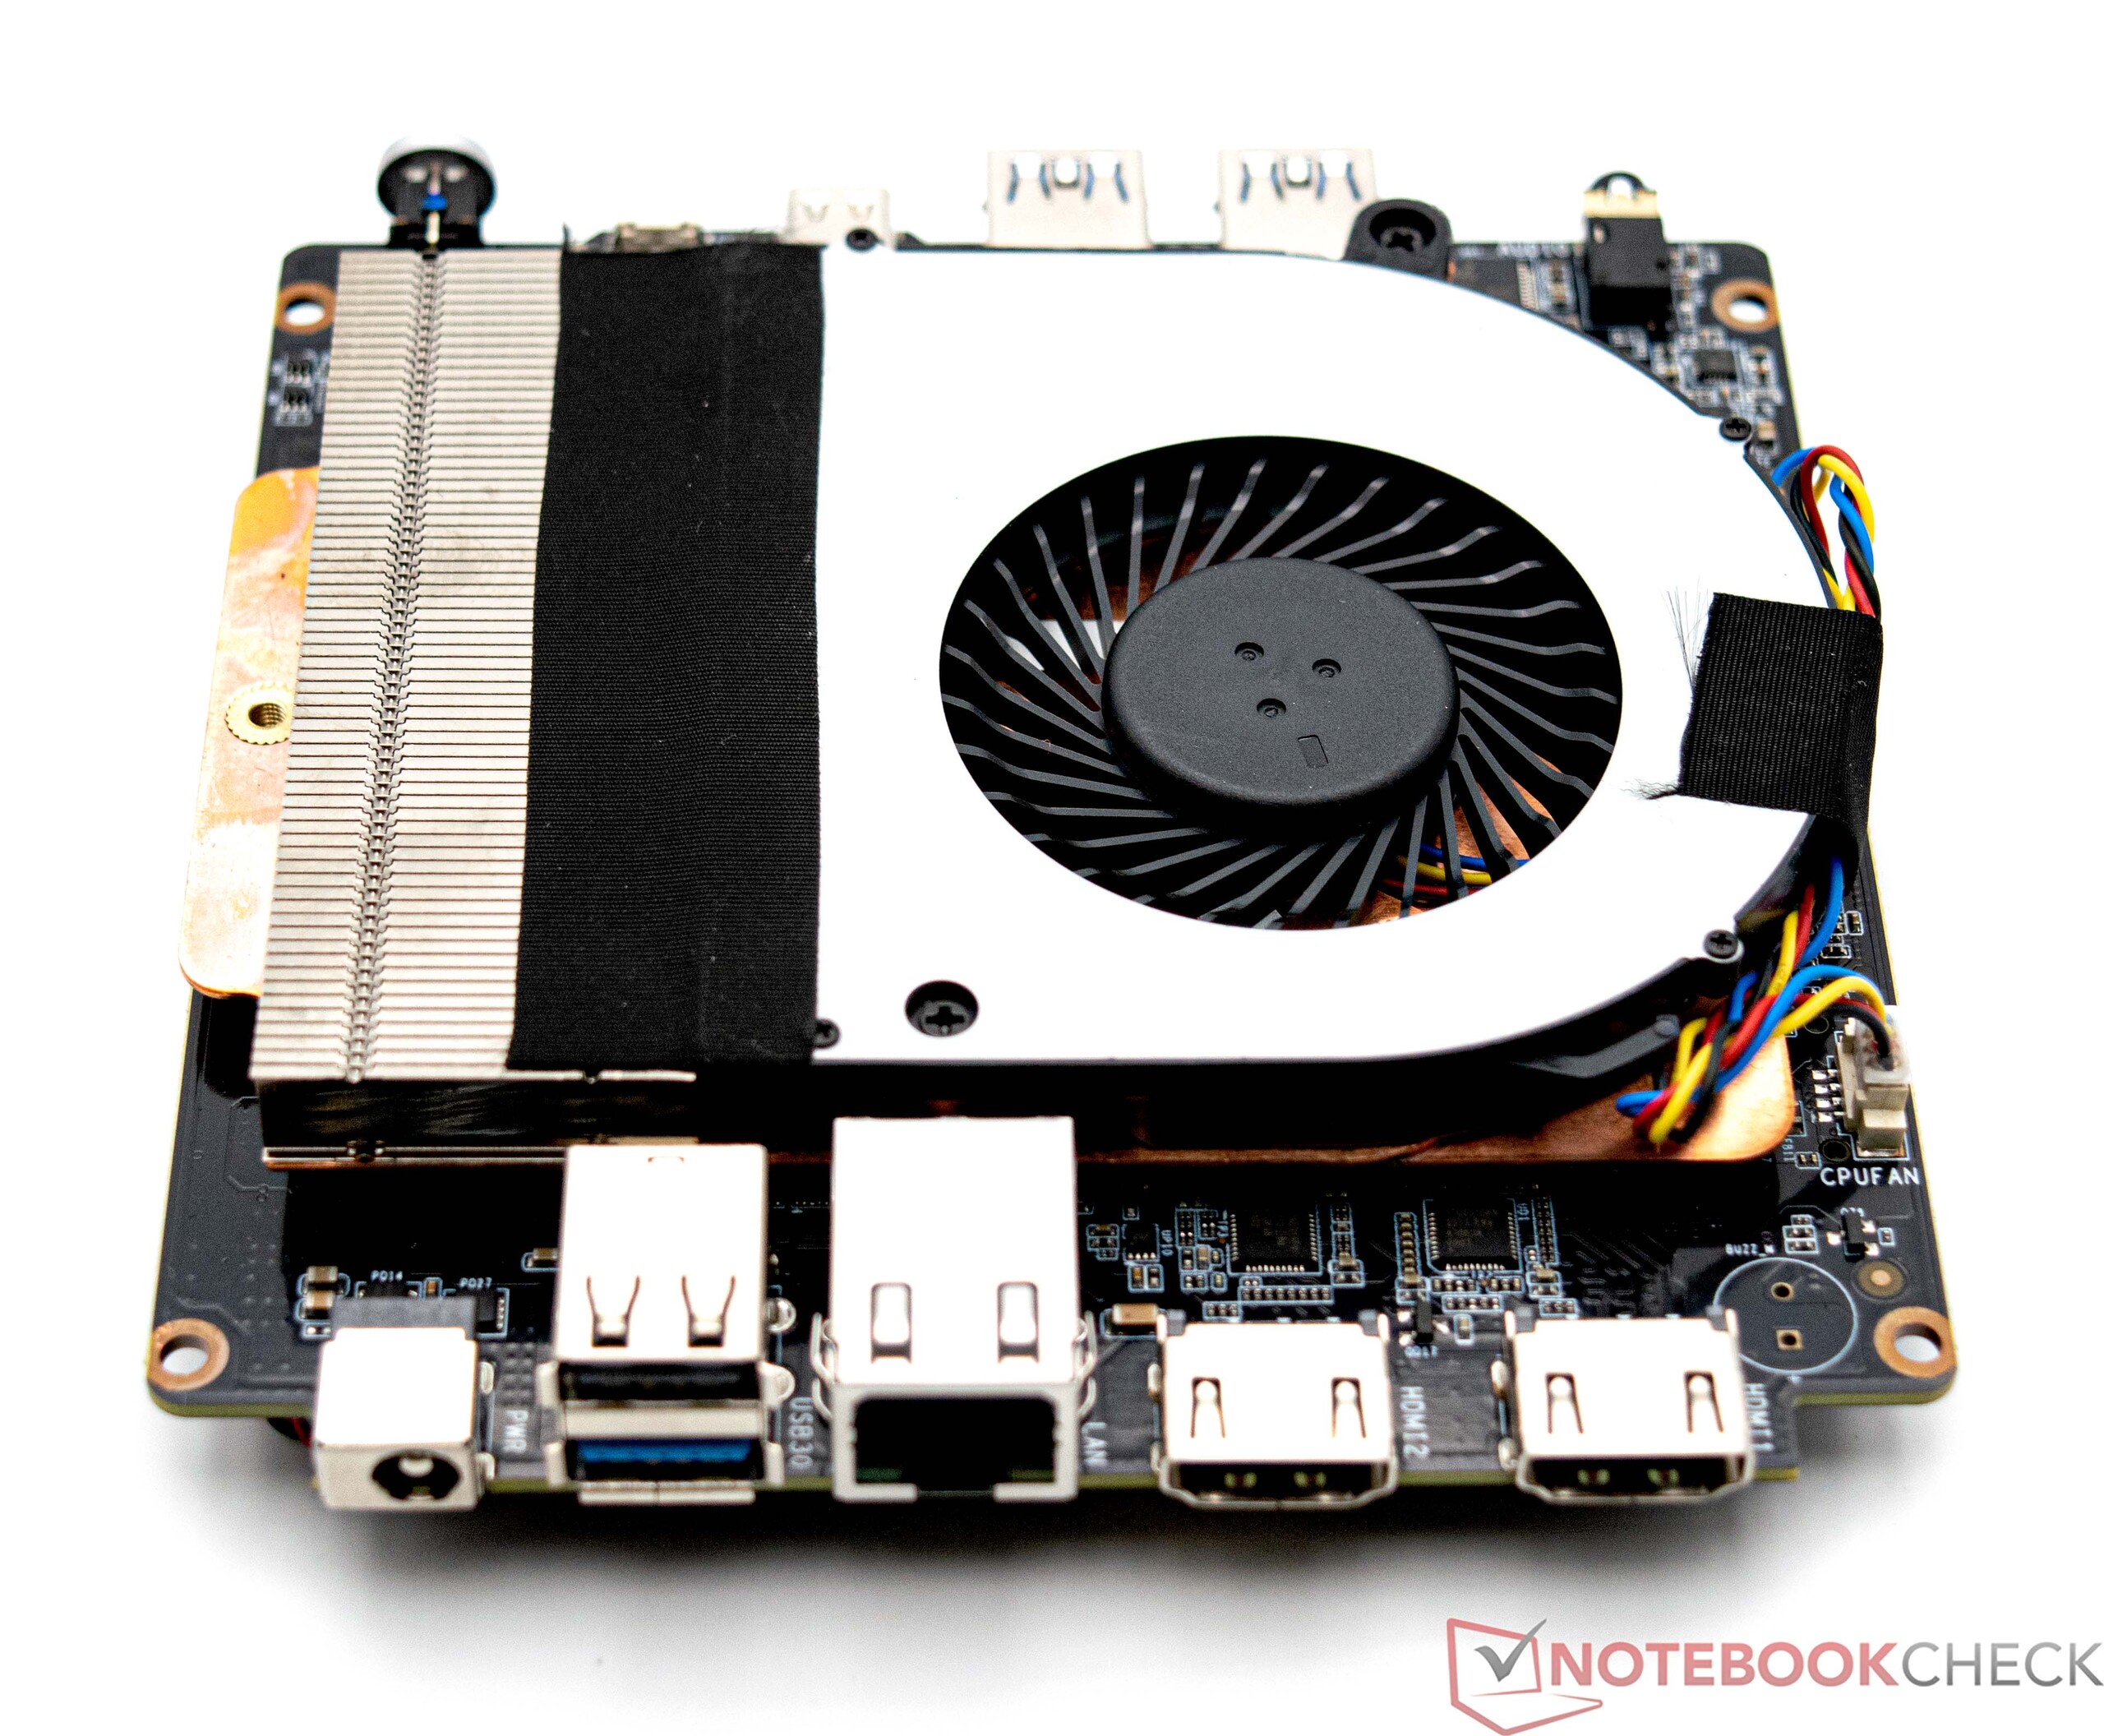
O mini PC Maxtang pode ser aberto com relativa facilidade. A base é fixada por quatro parafusos que são ocultados por pés de borracha colados. Sob a placa da base, é muito fácil acessar a RAM ou o SSD M.2. No nosso caso, ainda há espaço para instalar um módulo adicional de RAM e um segundo dispositivo de armazenamento em massa (formato de 2,5 polegadas). Para acessar a ventoinha, o dispositivo precisa ser desmontado ainda mais, o que torna impossível uma limpeza rápida.
Desempenho - Um AMD Ryzen 7 7735HS com 8 núcleos e 16 threads
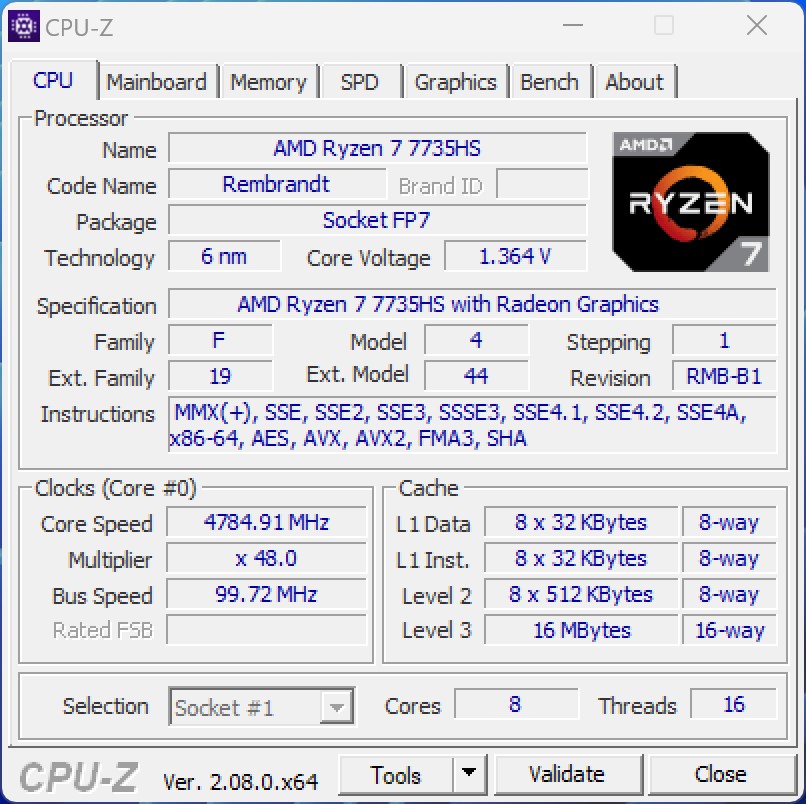
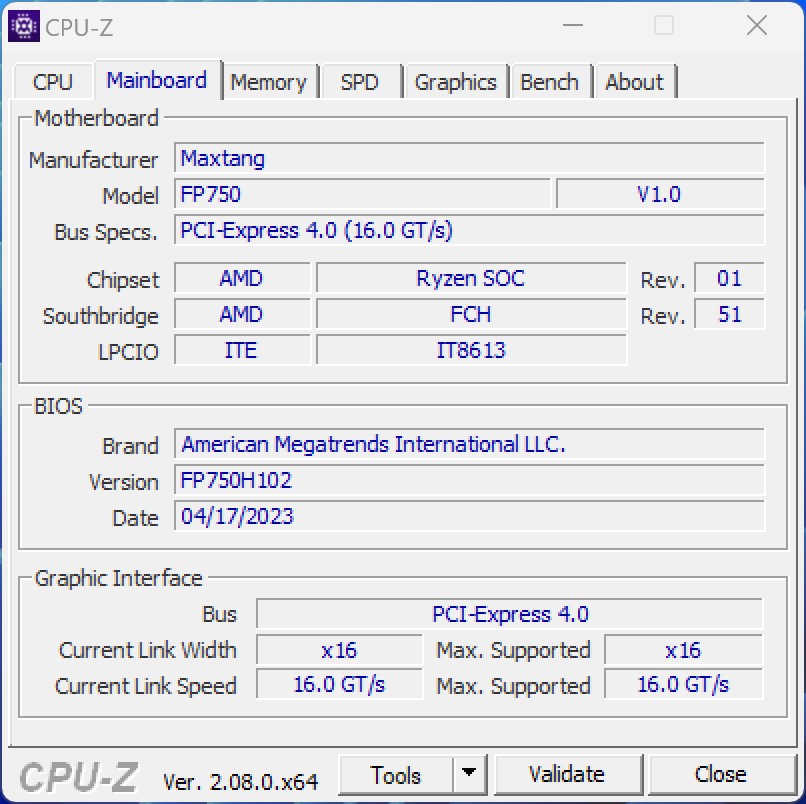
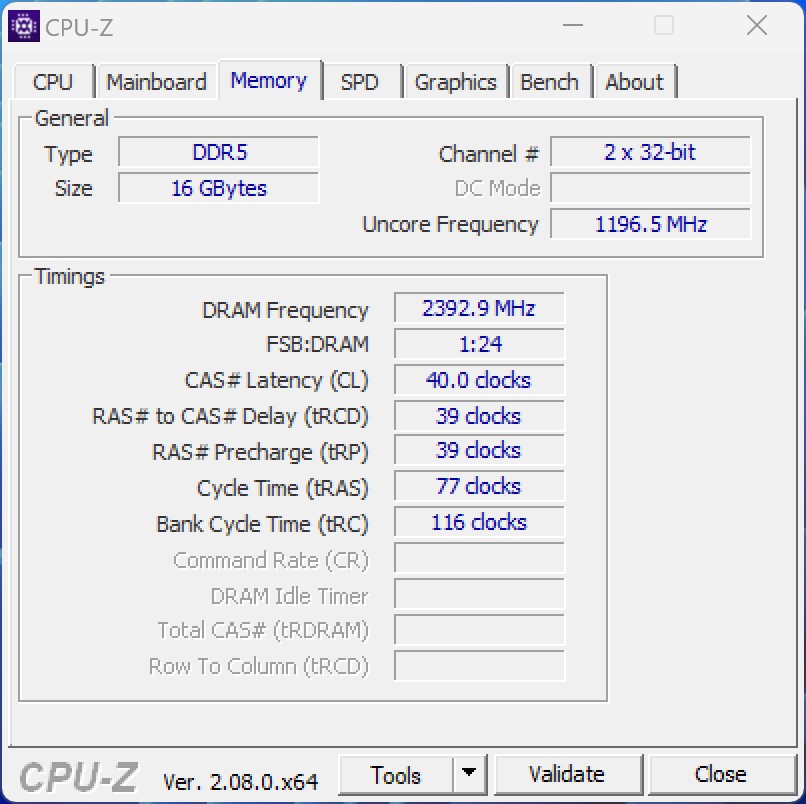
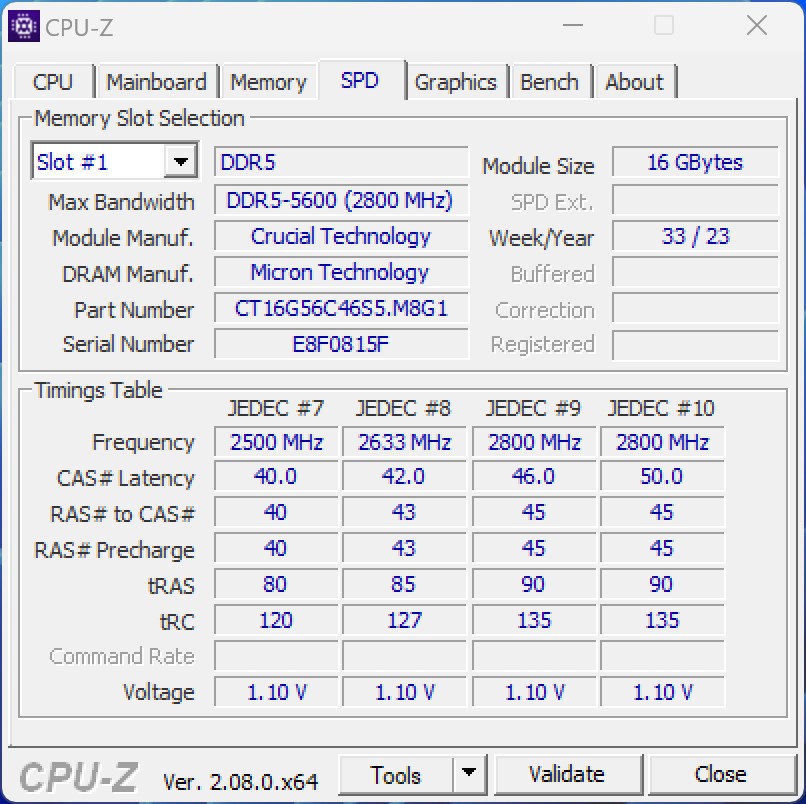
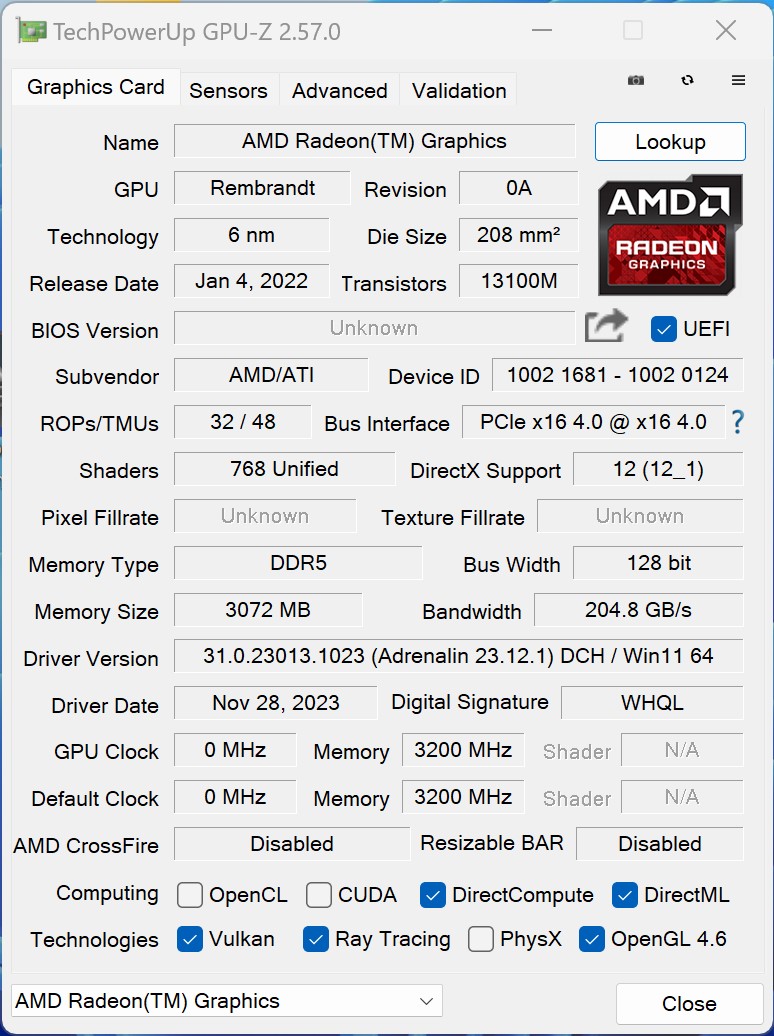
Nosso dispositivo de análise Maxtang MTN-FP750 vem com o AMD Ryzen 7 7735HS. Na AMD Radeon 680Mo SoC também tem uma poderosa iGPU à sua disposição. No entanto, em termos de RAM, o fabricante optou por dar ao mini PC um único módulo de 16 GB, DDR5-5600, embora, na prática, apenas um DDR5-4800 possa ser usado.

Condições de teste
Realizamos todos os testes de desempenho usando o perfil de energia de "desempenho mais alto". O desempenho do SoC não foi alterado ou modificado no BIOS e o dispositivo manteve suas configurações de fábrica.
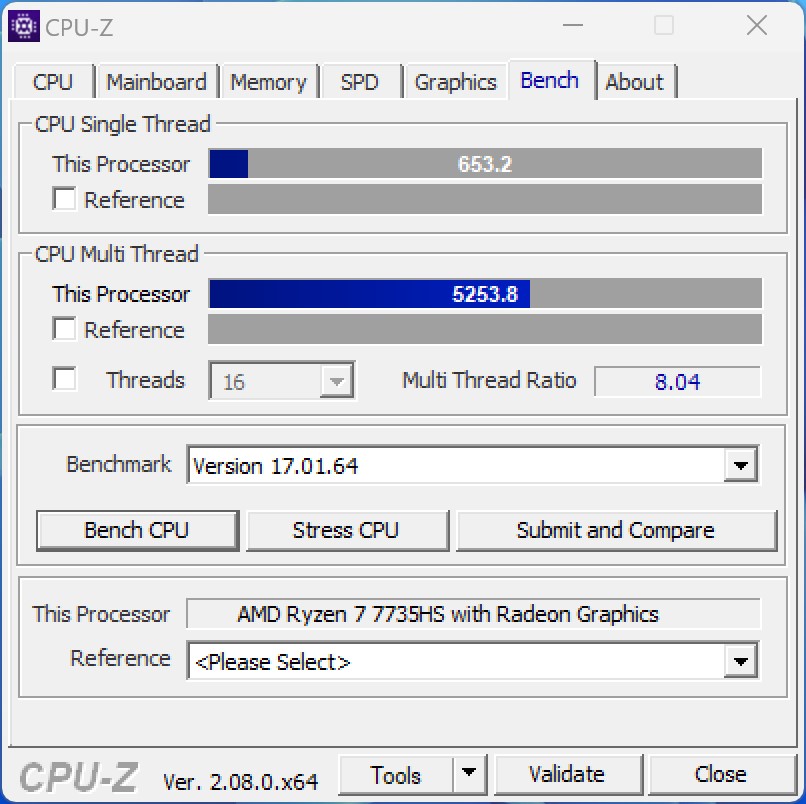
Processador
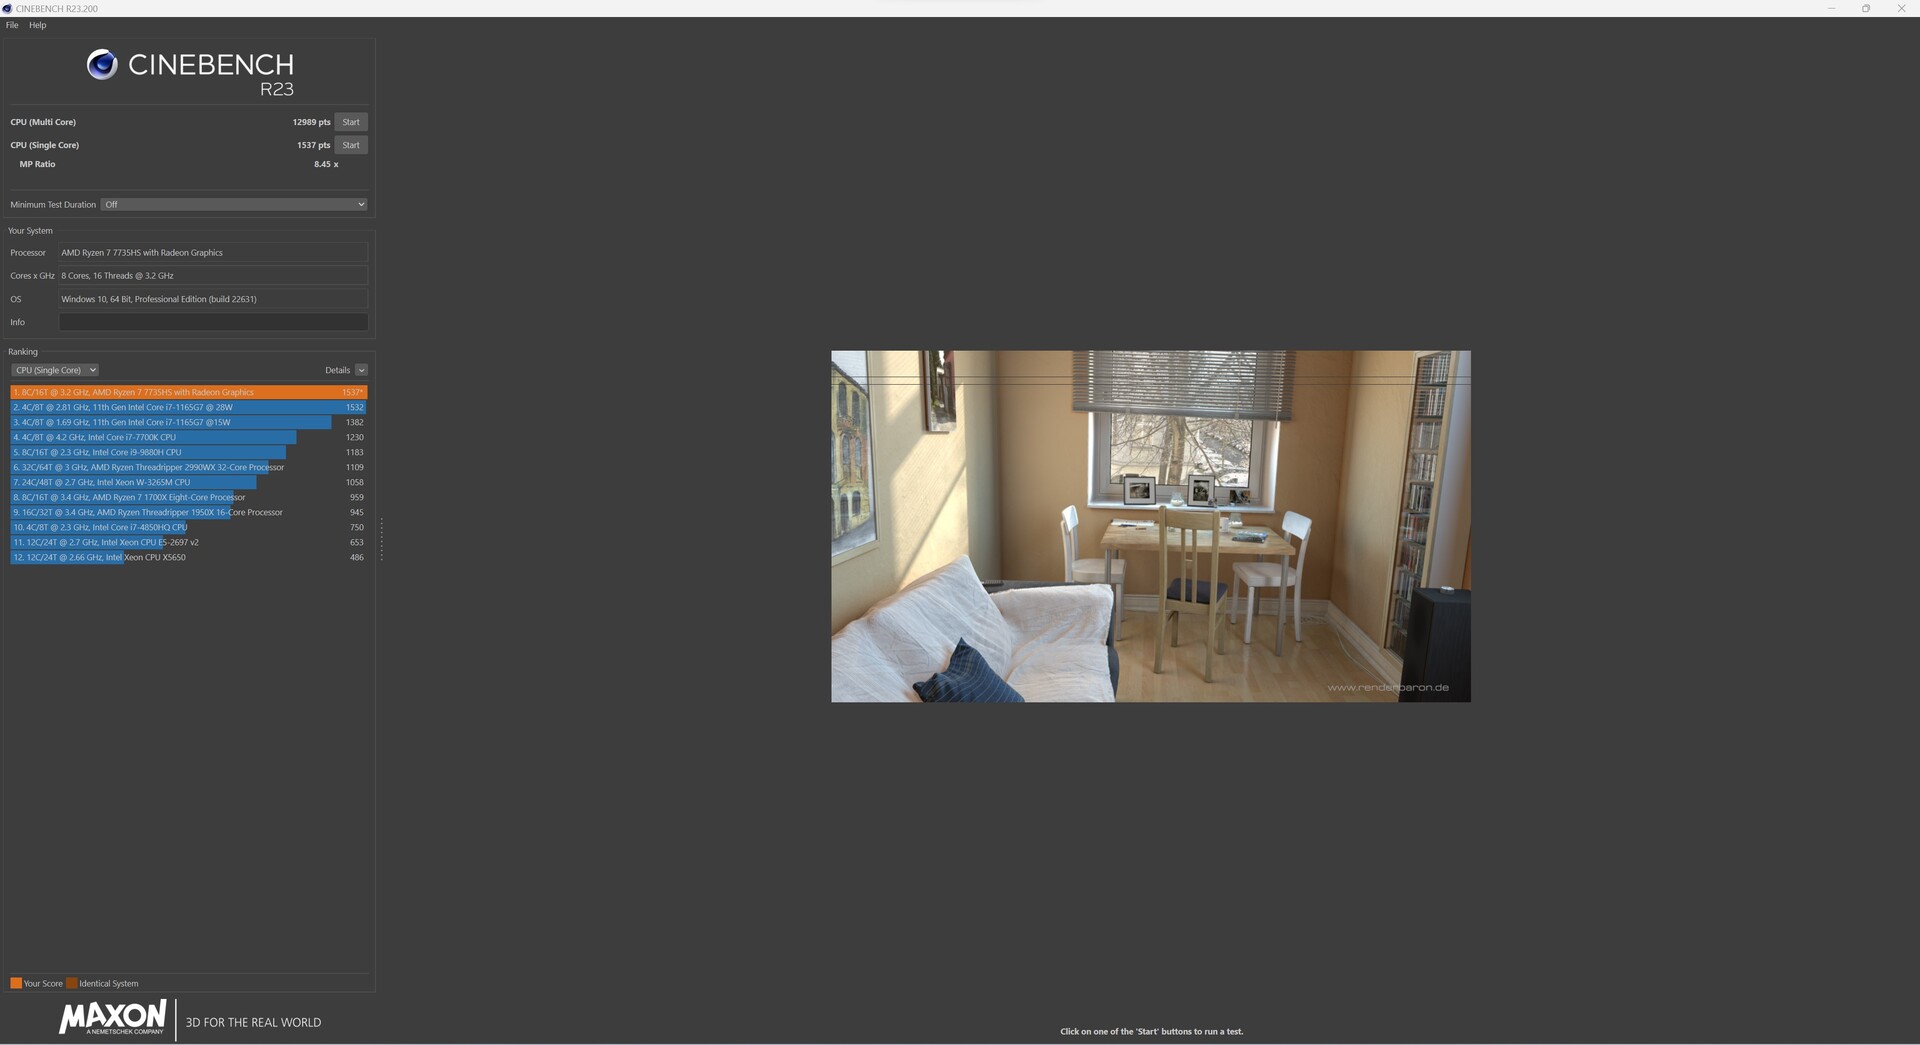
O AMD Ryzen 7 7735HS é um processador de 8 núcleos relativamente moderno da série Rembrandt. No entanto, o SoC Zen3 da AMD não pode mais ser considerado um dos novos produtos do setor. Apesar disso, o processador pode processar 16 threads em paralelo, o que representa um bom desempenho multi-thread. Na comparação de desempenho, nosso Maxtang MTN-FP750 só conseguiu garantir o penúltimo lugar. A razão para isso é o limite de energia de 35 watts do AMD Ryzen 7 7735HS.
Outros benchmarks de processador podem ser encontrados aqui.
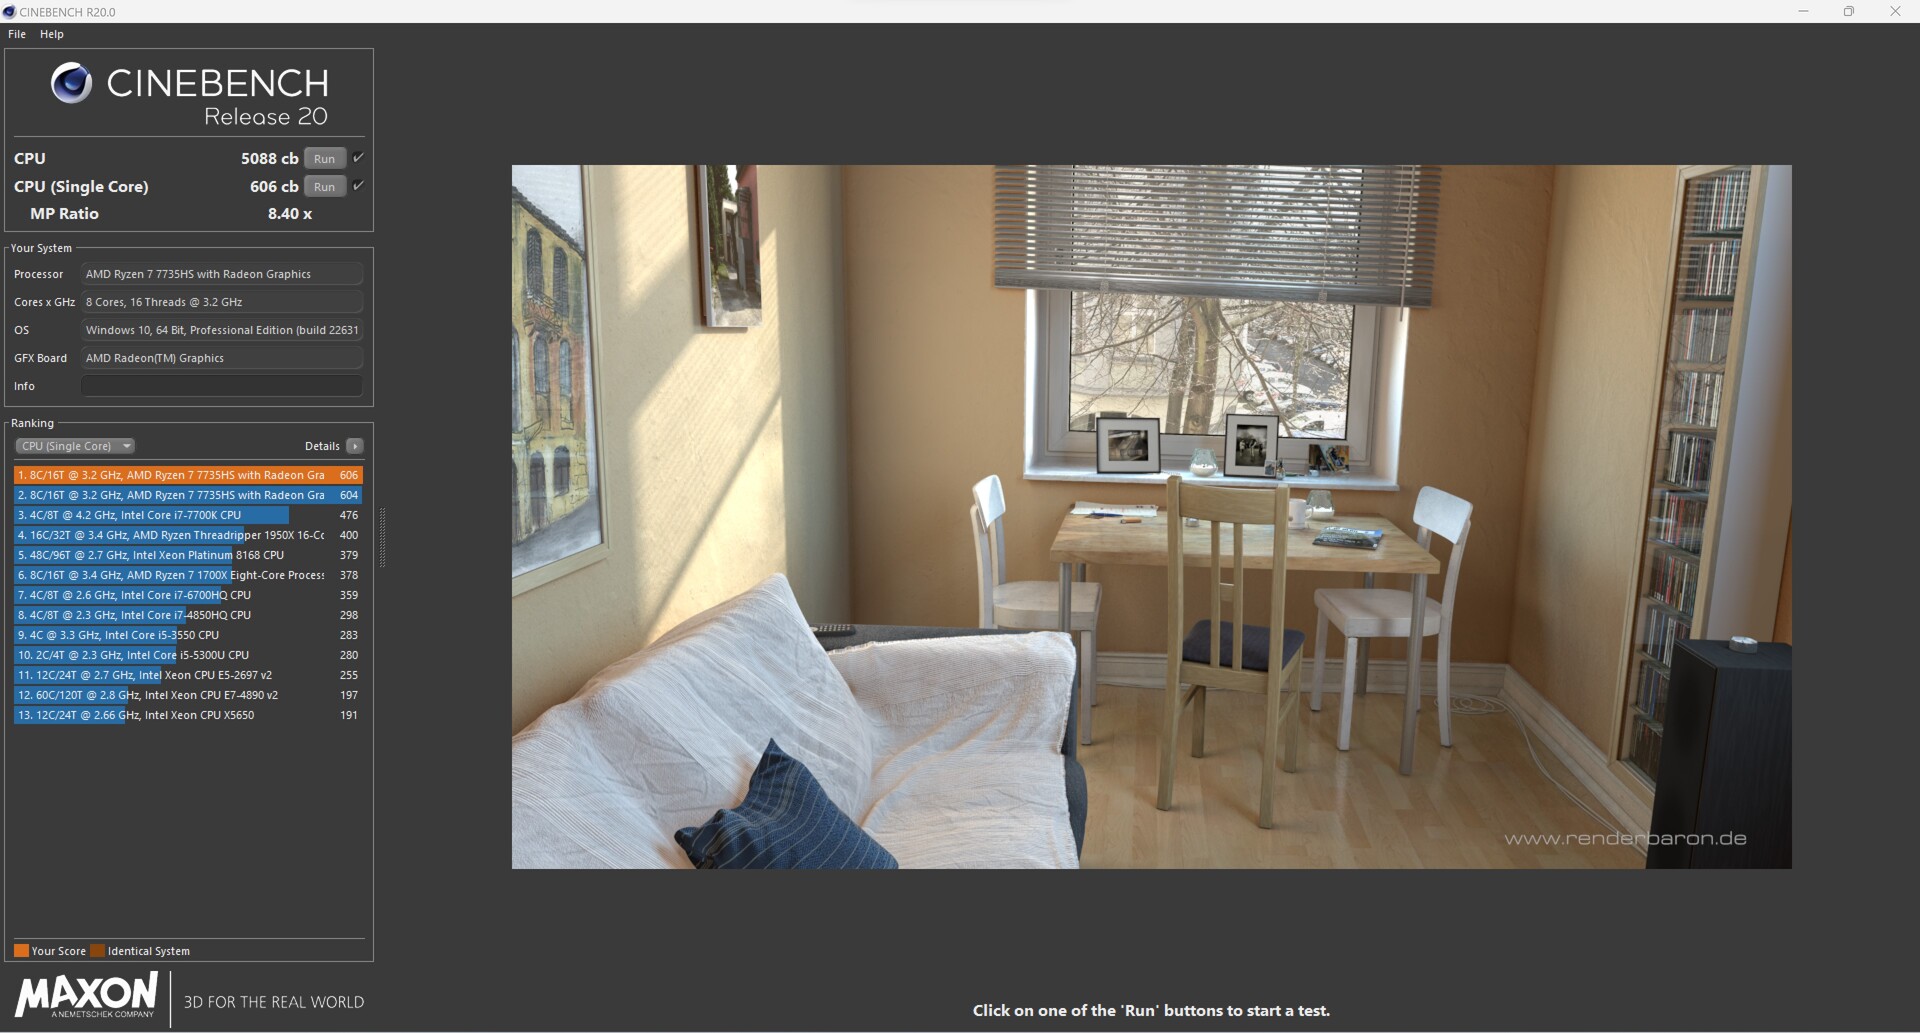
Resultados do Cinebench com configurações de fábrica (PL1 e PL2 = 35 watts)

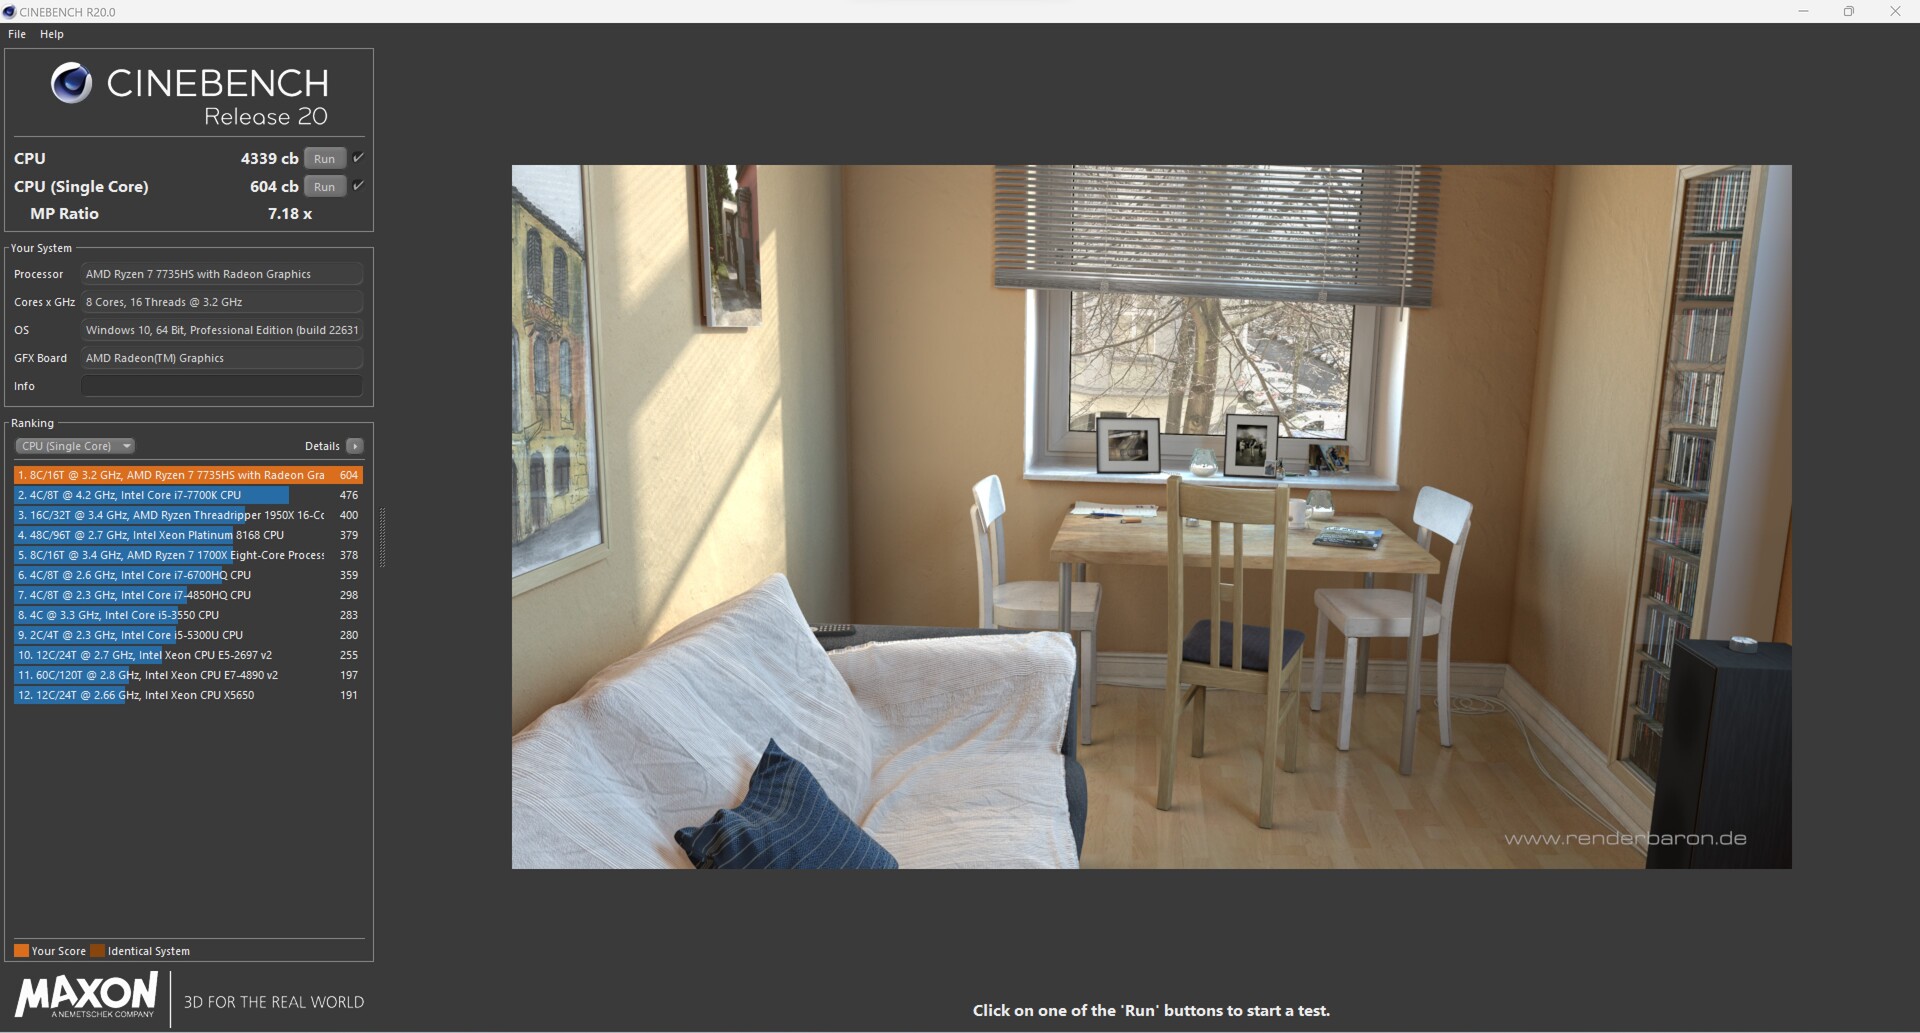
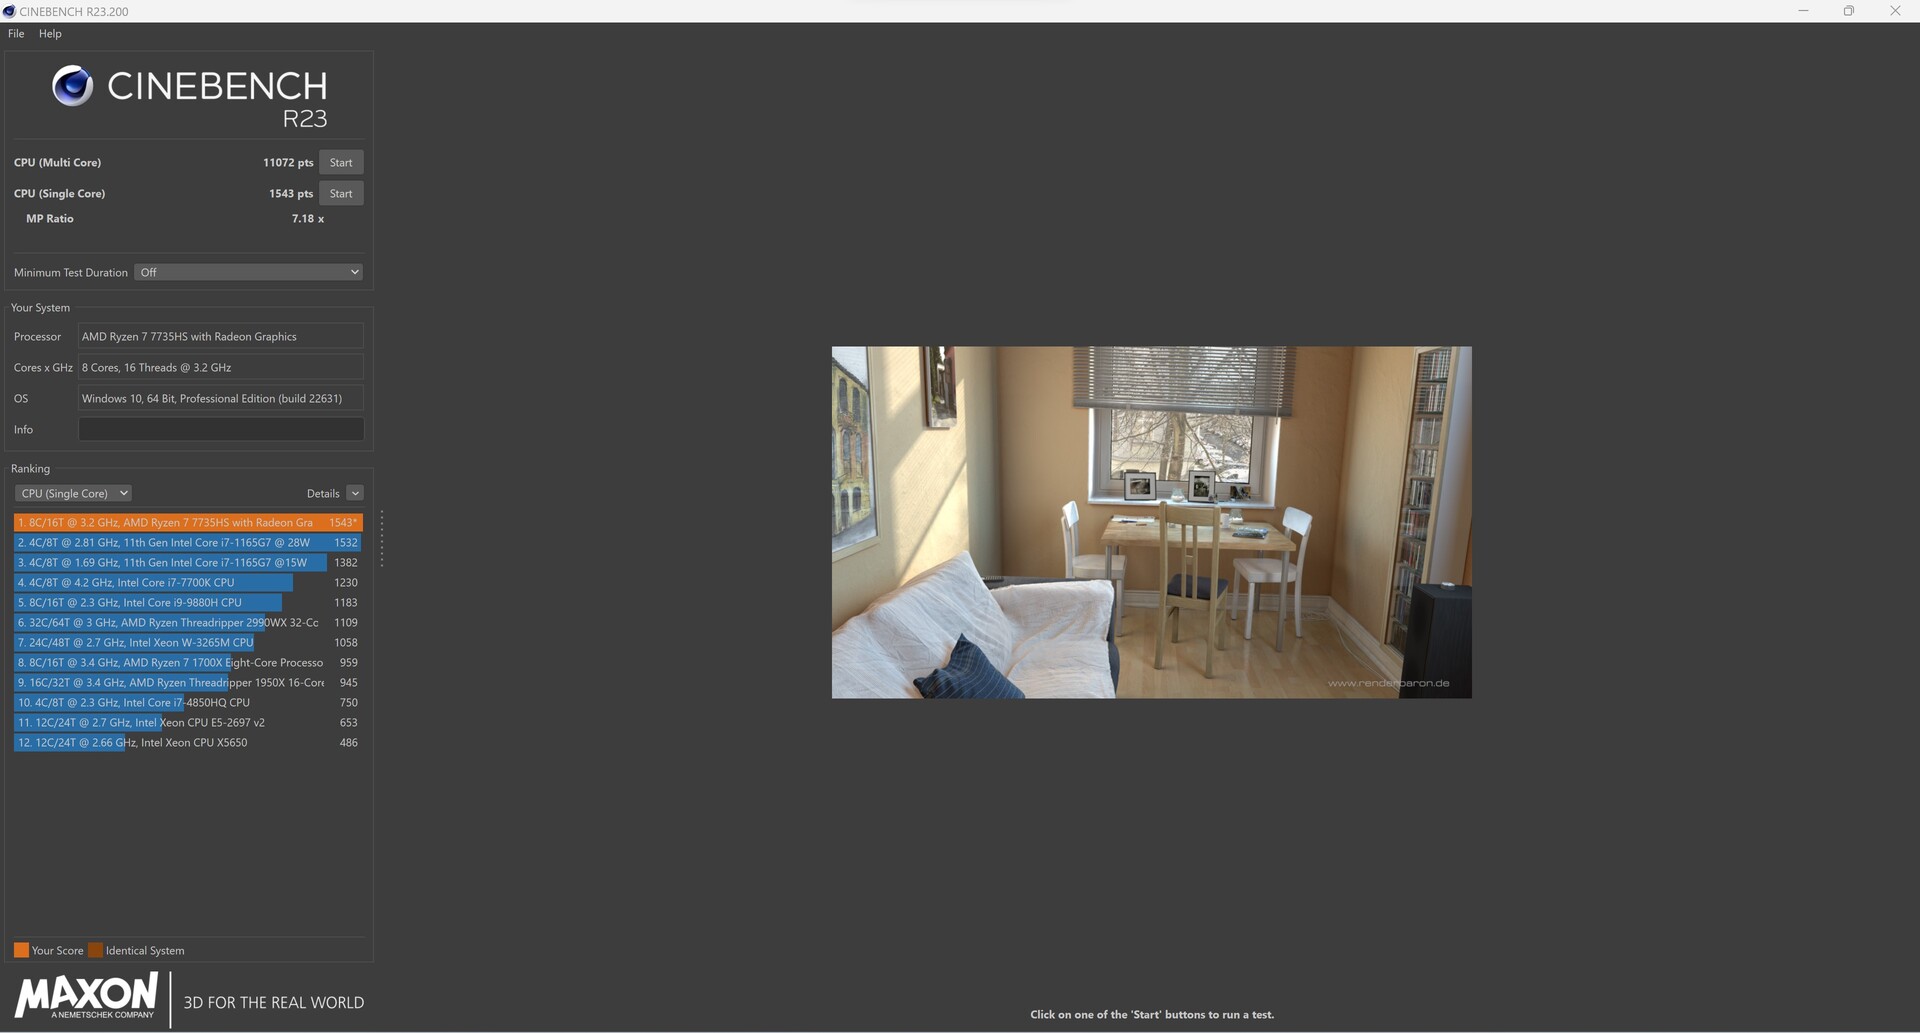
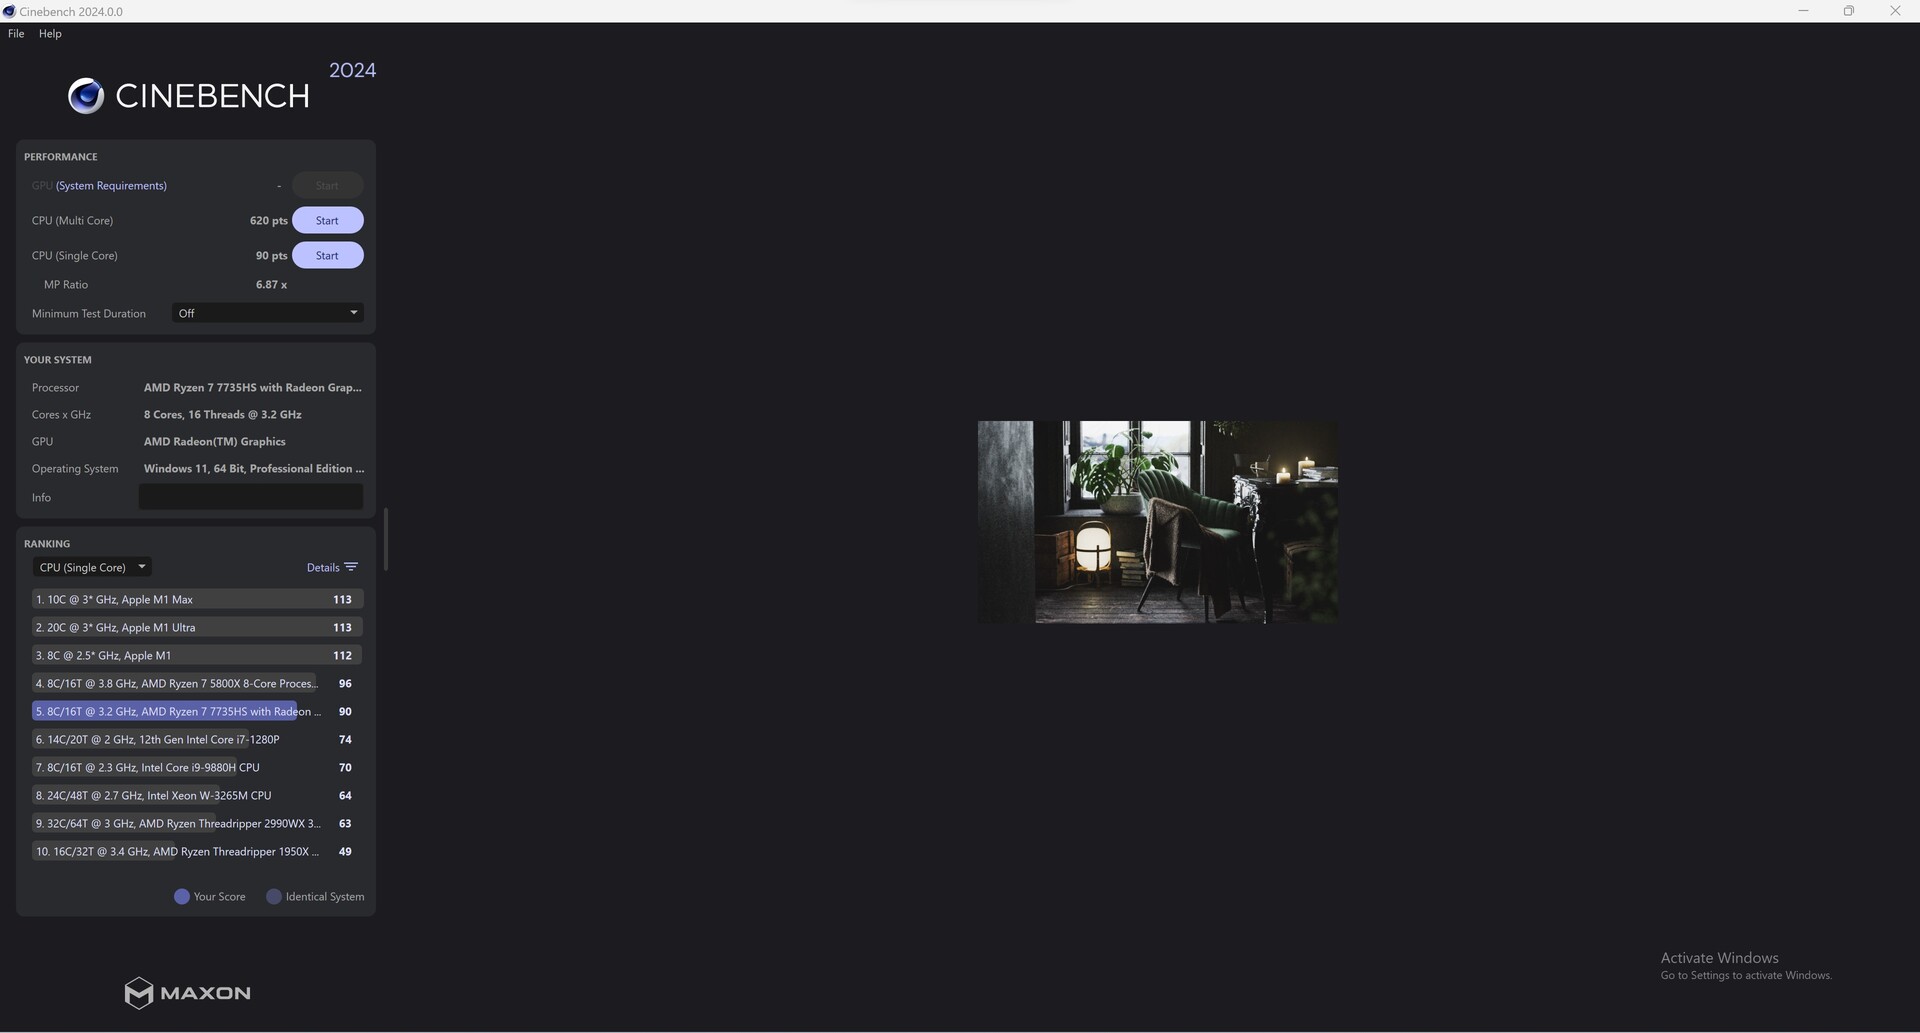
Resultados do Cinebench com uma meta de potência mais alta (PL1 = 54 watts, PL2 = 65 watts)

| Performance rating - Percent | |
| Minisforum Neptune Series NAD9 | |
| Minisforum Venus Series NAB6 | |
| Geekom AS 6, R9 6900HX | |
| NiPoGi AD08 | |
| Geekom Mini IT12 | |
| Geekom A5 | |
| Maxtang MTN-FP750 | |
| Cinebench R10 | |
| Rendering Single CPUs 64Bit | |
| Minisforum Venus Series NAB6 | |
| Geekom Mini IT12 | |
| NiPoGi AD08 | |
| Minisforum Neptune Series NAD9 | |
| Maxtang MTN-FP750 | |
| Geekom AS 6, R9 6900HX | |
| Geekom A5 | |
| Rendering Multiple CPUs 64Bit | |
| Minisforum Neptune Series NAD9 | |
| Minisforum Venus Series NAB6 | |
| Geekom AS 6, R9 6900HX | |
| Geekom A5 | |
| Maxtang MTN-FP750 | |
| NiPoGi AD08 | |
| Geekom Mini IT12 | |
| Blender - v2.79 BMW27 CPU | |
| NiPoGi AD08 | |
| Geekom A5 | |
| Minisforum Venus Series NAB6 | |
| Geekom Mini IT12 | |
| Maxtang MTN-FP750 | |
| Minisforum Neptune Series NAD9 | |
| Geekom AS 6, R9 6900HX | |
| WinRAR - Result | |
| Minisforum Venus Series NAB6 | |
| Minisforum Neptune Series NAD9 | |
| NiPoGi AD08 | |
| Geekom A5 | |
| Geekom AS 6, R9 6900HX | |
| Geekom Mini IT12 | |
| Maxtang MTN-FP750 | |
| 3DMark 11 - 1280x720 Performance Physics | |
| Minisforum Neptune Series NAD9 | |
| Minisforum Venus Series NAB6 | |
| Geekom AS 6, R9 6900HX | |
| Geekom A5 | |
| NiPoGi AD08 | |
| Maxtang MTN-FP750 | |
| Geekom Mini IT12 | |
| HWBOT x265 Benchmark v2.2 - 4k Preset | |
| Geekom AS 6, R9 6900HX | |
| Minisforum Neptune Series NAD9 | |
| Minisforum Venus Series NAB6 | |
| Geekom A5 | |
| Maxtang MTN-FP750 | |
| NiPoGi AD08 | |
| Geekom Mini IT12 | |
| R Benchmark 2.5 - Overall mean | |
| Geekom A5 | |
| Maxtang MTN-FP750 | |
| Geekom AS 6, R9 6900HX | |
| NiPoGi AD08 | |
| Geekom Mini IT12 | |
| Minisforum Neptune Series NAD9 | |
| Minisforum Venus Series NAB6 | |
| LibreOffice - 20 Documents To PDF | |
| Maxtang MTN-FP750 | |
| Geekom A5 | |
| Geekom Mini IT12 | |
| NiPoGi AD08 | |
| Geekom AS 6, R9 6900HX | |
| Minisforum Venus Series NAB6 | |
| Minisforum Neptune Series NAD9 | |
| WebXPRT 3 - Overall | |
| Minisforum Neptune Series NAD9 | |
| Minisforum Venus Series NAB6 | |
| NiPoGi AD08 | |
| Geekom Mini IT12 | |
| Maxtang MTN-FP750 | |
| Geekom A5 | |
| Geekom AS 6, R9 6900HX | |
| Mozilla Kraken 1.1 - Total | |
| Geekom A5 | |
| Geekom AS 6, R9 6900HX | |
| Maxtang MTN-FP750 | |
| Minisforum Neptune Series NAD9 | |
| Geekom Mini IT12 | |
| NiPoGi AD08 | |
| Minisforum Venus Series NAB6 | |
* ... menor é melhor
AIDA64: FP32 Ray-Trace | FPU Julia | CPU SHA3 | CPU Queen | FPU SinJulia | FPU Mandel | CPU AES | CPU ZLib | FP64 Ray-Trace | CPU PhotoWorxx
| Performance rating | |
| Média da turma Mini PC | |
| Geekom AS 6, R9 6900HX | |
| Geekom A5 | |
| Maxtang MTN-FP750 | |
| Minisforum Neptune Series NAD9 | |
| Minisforum Venus Series NAB6 | |
| NiPoGi AD08 | |
| Geekom Mini IT12 | |
| AIDA64 / FP32 Ray-Trace | |
| Média da turma Mini PC (974 - 82725, n=103, últimos 2 anos) | |
| Geekom AS 6, R9 6900HX | |
| Maxtang MTN-FP750 | |
| Geekom A5 | |
| Minisforum Neptune Series NAD9 | |
| Minisforum Venus Series NAB6 | |
| NiPoGi AD08 | |
| Geekom Mini IT12 | |
| AIDA64 / FPU Julia | |
| Média da turma Mini PC (6115 - 363782, n=103, últimos 2 anos) | |
| Geekom AS 6, R9 6900HX | |
| Maxtang MTN-FP750 | |
| Geekom A5 | |
| Minisforum Neptune Series NAD9 | |
| Minisforum Venus Series NAB6 | |
| NiPoGi AD08 | |
| Geekom Mini IT12 | |
| AIDA64 / CPU SHA3 | |
| Média da turma Mini PC (385 - 9475, n=103, últimos 2 anos) | |
| Geekom AS 6, R9 6900HX | |
| Maxtang MTN-FP750 | |
| Geekom A5 | |
| Minisforum Neptune Series NAD9 | |
| Minisforum Venus Series NAB6 | |
| NiPoGi AD08 | |
| Geekom Mini IT12 | |
| AIDA64 / CPU Queen | |
| Geekom AS 6, R9 6900HX | |
| Média da turma Mini PC (20501 - 162855, n=86, últimos 2 anos) | |
| Geekom A5 | |
| Maxtang MTN-FP750 | |
| Minisforum Neptune Series NAD9 | |
| Minisforum Venus Series NAB6 | |
| Geekom Mini IT12 | |
| NiPoGi AD08 | |
| AIDA64 / FPU SinJulia | |
| Média da turma Mini PC (1116 - 31931, n=103, últimos 2 anos) | |
| Maxtang MTN-FP750 | |
| Geekom AS 6, R9 6900HX | |
| Geekom A5 | |
| Minisforum Neptune Series NAD9 | |
| Minisforum Venus Series NAB6 | |
| NiPoGi AD08 | |
| Geekom Mini IT12 | |
| AIDA64 / FPU Mandel | |
| Média da turma Mini PC (3322 - 192994, n=103, últimos 2 anos) | |
| Geekom AS 6, R9 6900HX | |
| Maxtang MTN-FP750 | |
| Geekom A5 | |
| Minisforum Neptune Series NAD9 | |
| Minisforum Venus Series NAB6 | |
| NiPoGi AD08 | |
| Geekom Mini IT12 | |
| AIDA64 / CPU ZLib | |
| Média da turma Mini PC (127.2 - 2431, n=103, últimos 2 anos) | |
| Geekom AS 6, R9 6900HX | |
| Minisforum Neptune Series NAD9 | |
| Geekom A5 | |
| NiPoGi AD08 | |
| Minisforum Venus Series NAB6 | |
| Maxtang MTN-FP750 | |
| Geekom Mini IT12 | |
| AIDA64 / FP64 Ray-Trace | |
| Média da turma Mini PC (537 - 43587, n=103, últimos 2 anos) | |
| Geekom AS 6, R9 6900HX | |
| Maxtang MTN-FP750 | |
| Geekom A5 | |
| Minisforum Neptune Series NAD9 | |
| Minisforum Venus Series NAB6 | |
| NiPoGi AD08 | |
| Geekom Mini IT12 | |
| AIDA64 / CPU PhotoWorxx | |
| Média da turma Mini PC (8069 - 96843, n=103, últimos 2 anos) | |
| Geekom AS 6, R9 6900HX | |
| Geekom Mini IT12 | |
| Minisforum Venus Series NAB6 | |
| Geekom A5 | |
| NiPoGi AD08 | |
| Minisforum Neptune Series NAD9 | |
| Maxtang MTN-FP750 | |
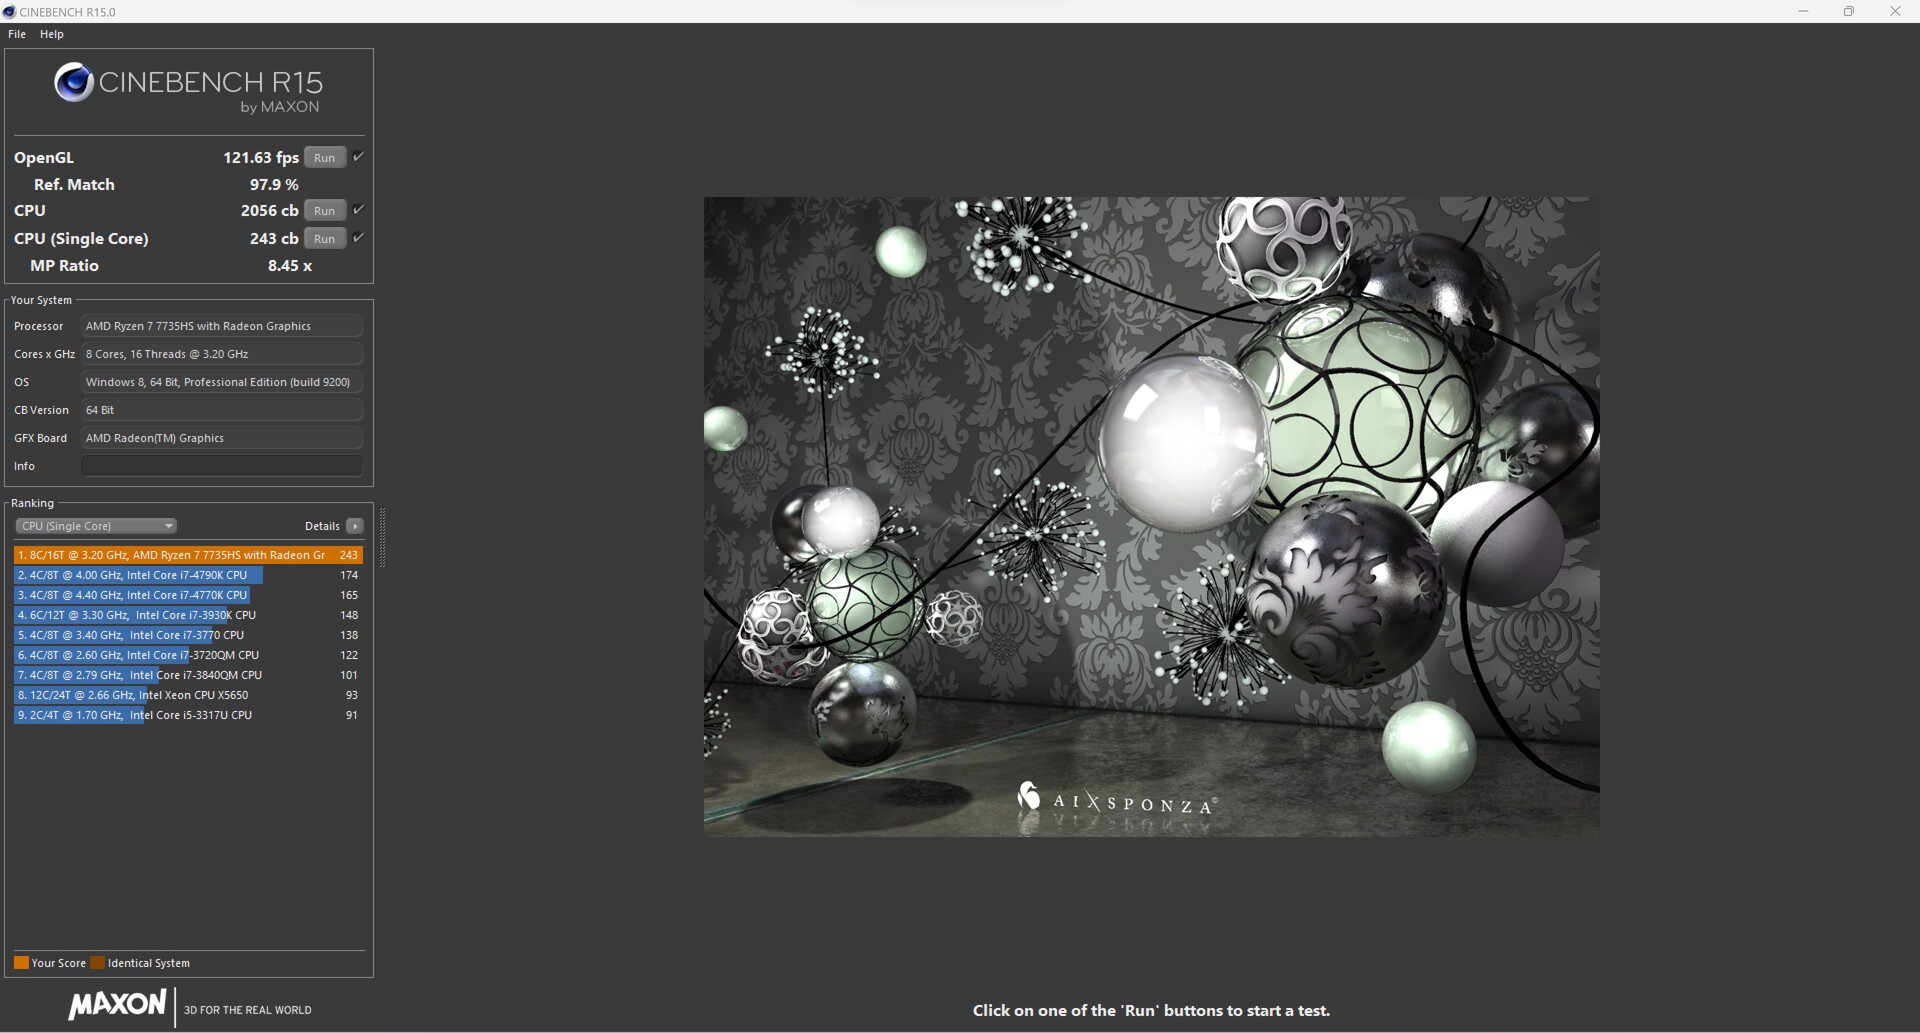
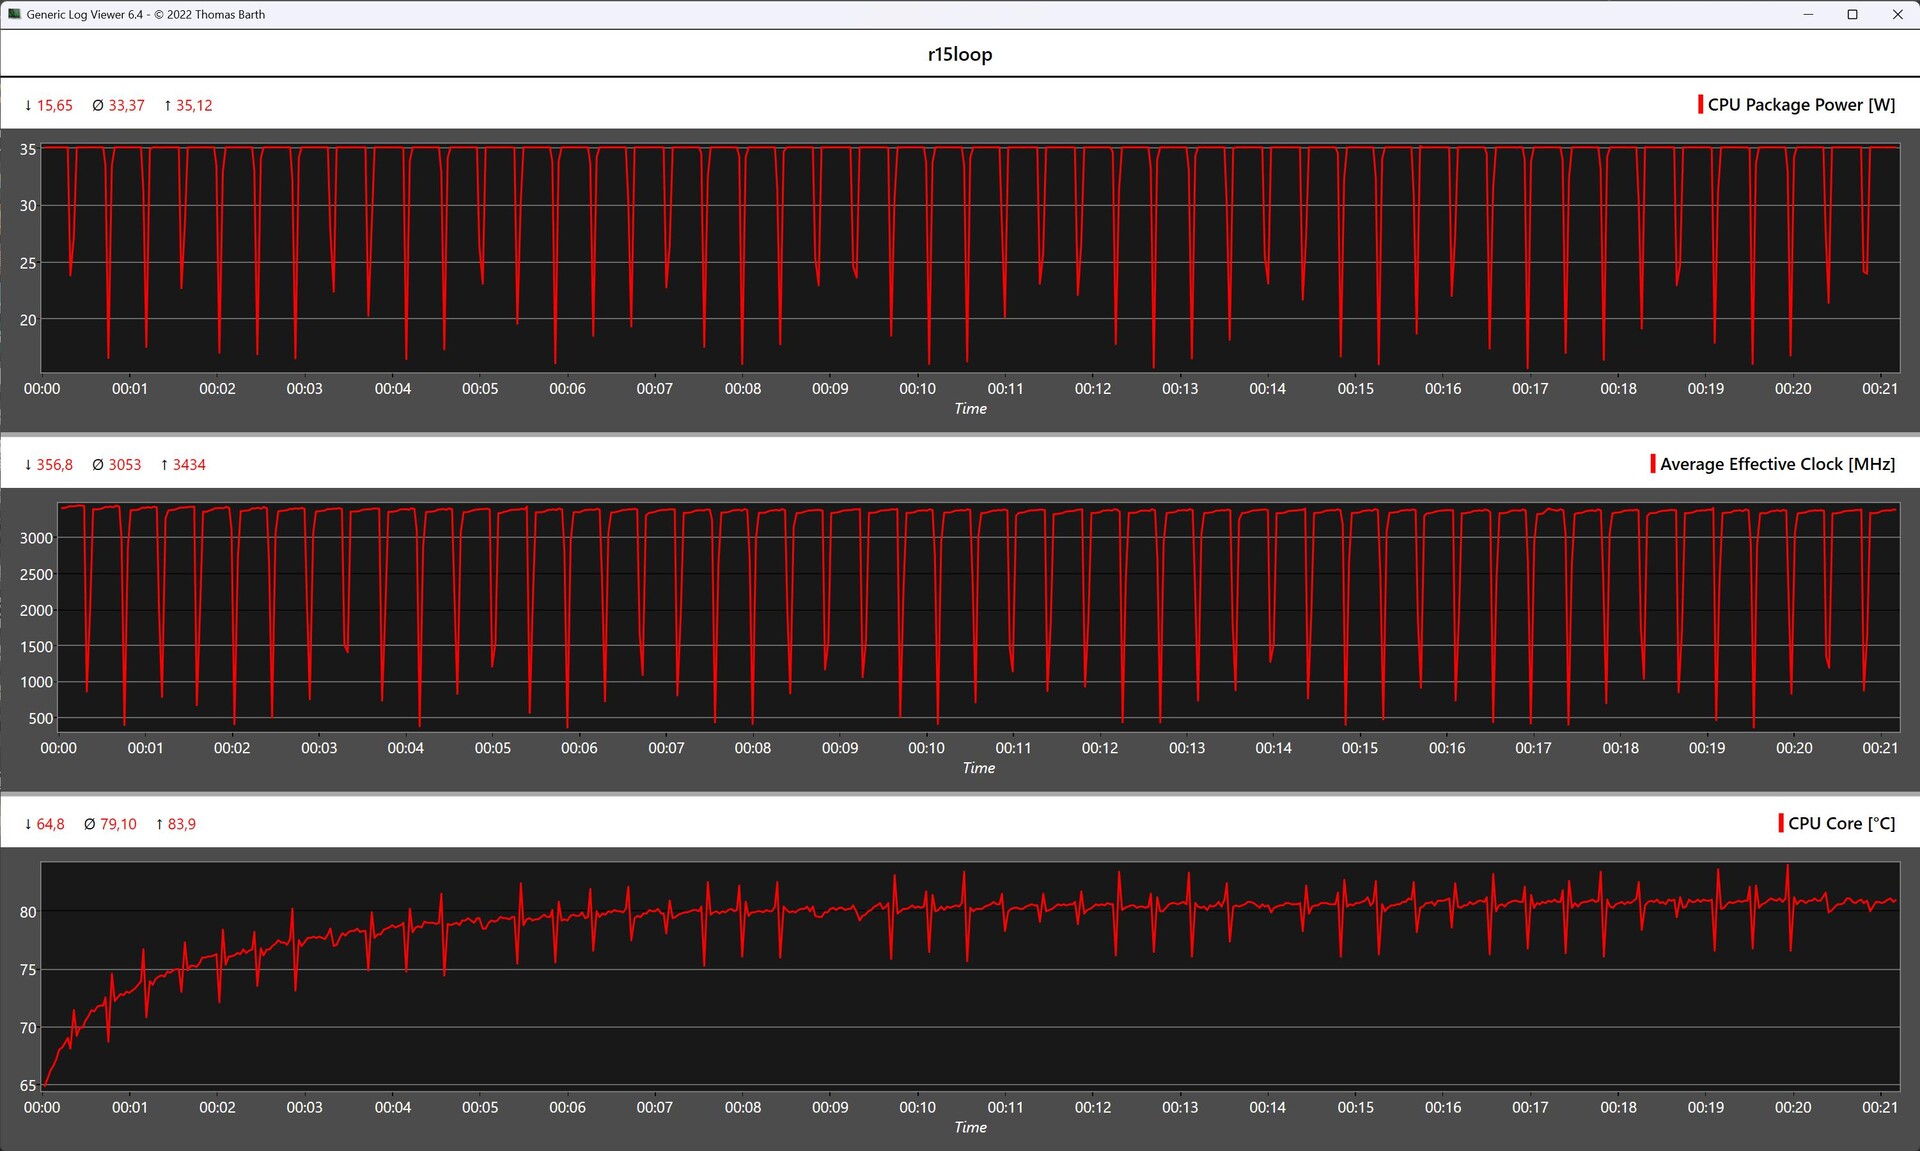
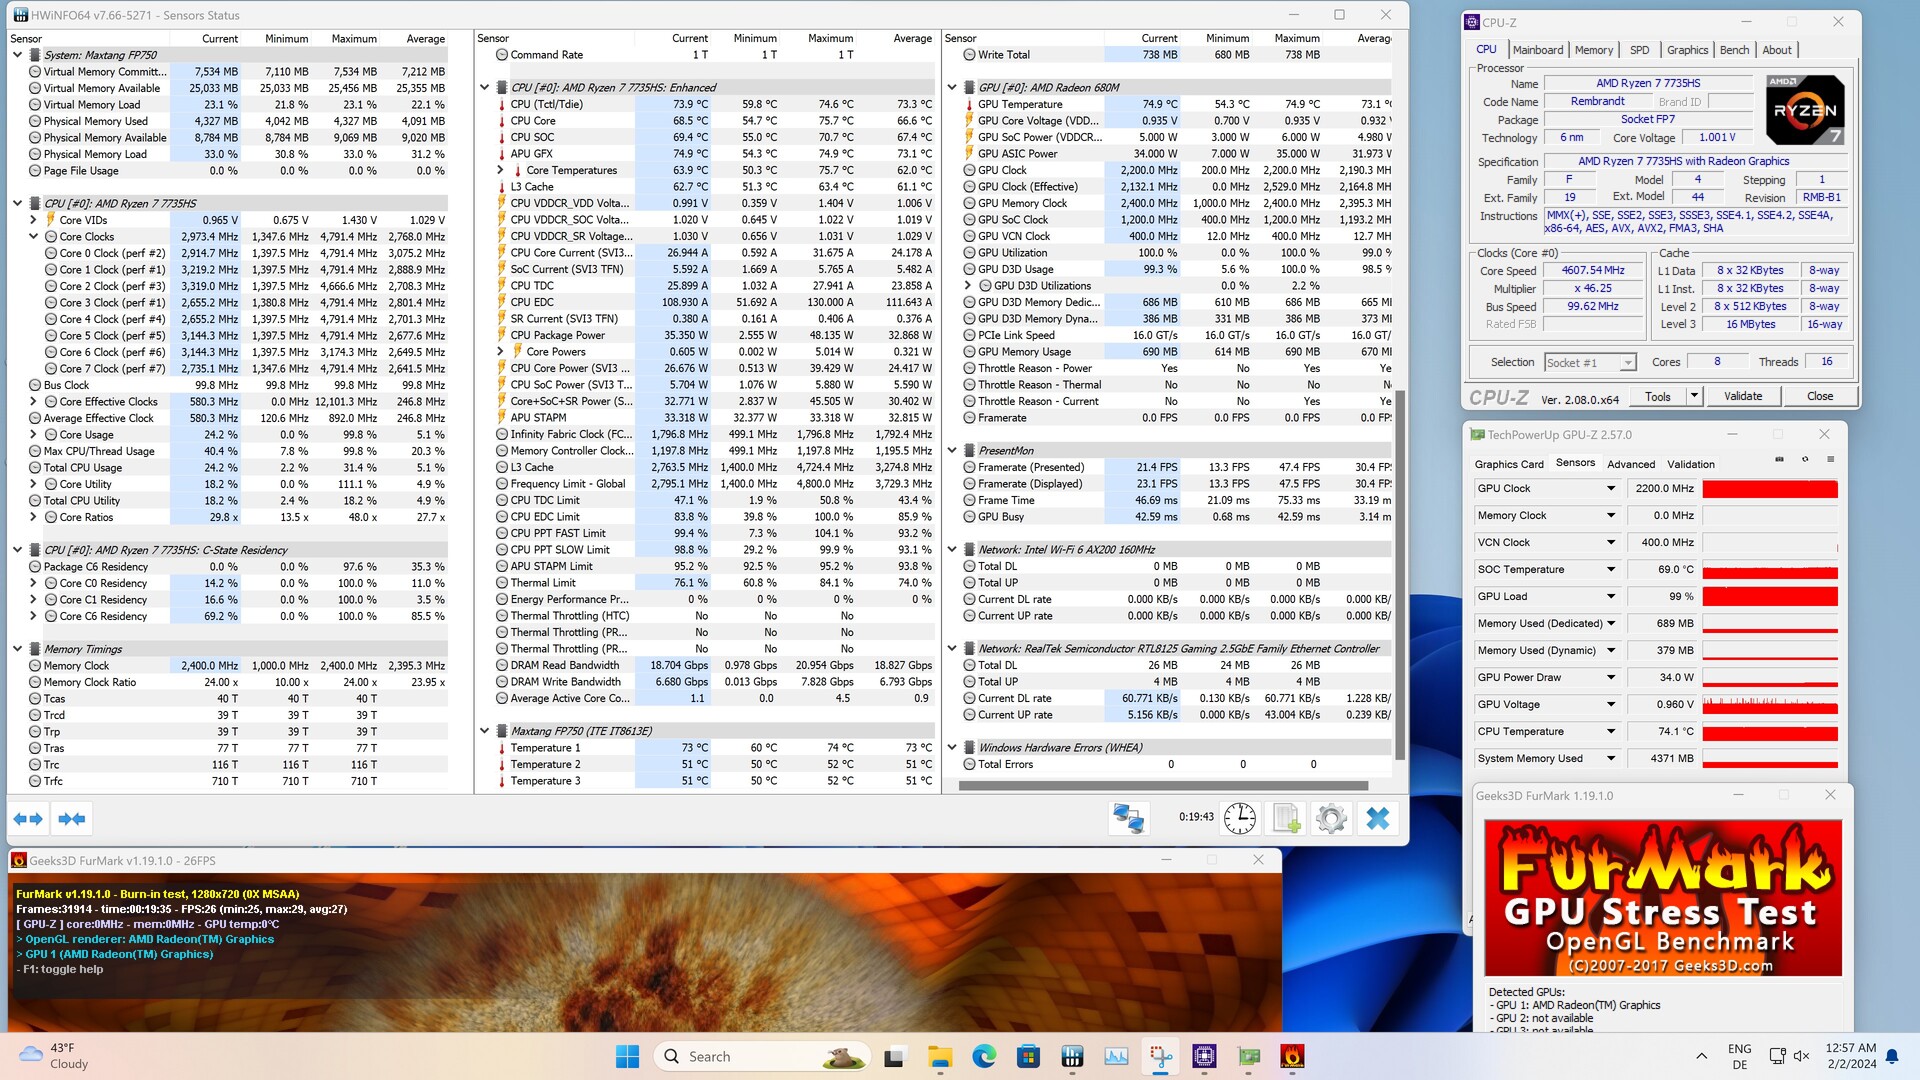
Maxtang MTN-FP750 vs. Cinebench R15 Multi-Loop
O multi-loop Cinebench R15 nos mostrou como o sistema de resfriamento funciona bem sob carga. A unidade de resfriamento não atinge seus limites devido ao baixo TDP máximo de apenas 35 watts e é por isso que o dispositivo conseguiu obter um desempenho estável e consistente da CPU. Na comparação, nosso exemplar analisado conseguiu até mesmo garantir o segundo lugar, atrás do Geekom AS 6.
Desempenho do sistema
Mais uma vez, nos testes sintéticos de desempenho do sistema, nosso dispositivo de análise também ficou para trás. Nas tarefas diárias durante os testes e de um ponto de vista subjetivo, o Maxtang MTN-FP750 foi capaz de oferecer um bom desempenho do sistema, desde que o sistema não fosse desafiado a lidar com muitas tarefas simultaneamente. A RAM parece ser o gargalo, pois quando o senhor subtrai a memória gráfica, apenas 12 dos 16 GB estão disponíveis.
| AIDA64 / Memory Copy | |
| Média da turma Mini PC (15933 - 163031, n=103, últimos 2 anos) | |
| Geekom AS 6, R9 6900HX | |
| Minisforum Venus Series NAB6 | |
| Minisforum Neptune Series NAD9 | |
| Geekom Mini IT12 | |
| NiPoGi AD08 | |
| Geekom A5 | |
| Maxtang MTN-FP750 | |
| AIDA64 / Memory Read | |
| Média da turma Mini PC (14143 - 123769, n=103, últimos 2 anos) | |
| Geekom AS 6, R9 6900HX | |
| Minisforum Venus Series NAB6 | |
| Minisforum Neptune Series NAD9 | |
| Geekom Mini IT12 | |
| NiPoGi AD08 | |
| Geekom A5 | |
| Maxtang MTN-FP750 | |
| AIDA64 / Memory Write | |
| Média da turma Mini PC (10630 - 216693, n=103, últimos 2 anos) | |
| Geekom AS 6, R9 6900HX | |
| Minisforum Venus Series NAB6 | |
| Minisforum Neptune Series NAD9 | |
| Geekom Mini IT12 | |
| Geekom A5 | |
| NiPoGi AD08 | |
| Maxtang MTN-FP750 | |
| AIDA64 / Memory Latency | |
| NiPoGi AD08 | |
| Média da turma Mini PC (88.1 - 184.8, n=104, últimos 2 anos) | |
| Minisforum Neptune Series NAD9 | |
| Geekom AS 6, R9 6900HX | |
| Geekom A5 | |
| Geekom Mini IT12 | |
| Maxtang MTN-FP750 | |
| Minisforum Venus Series NAB6 | |
* ... menor é melhor
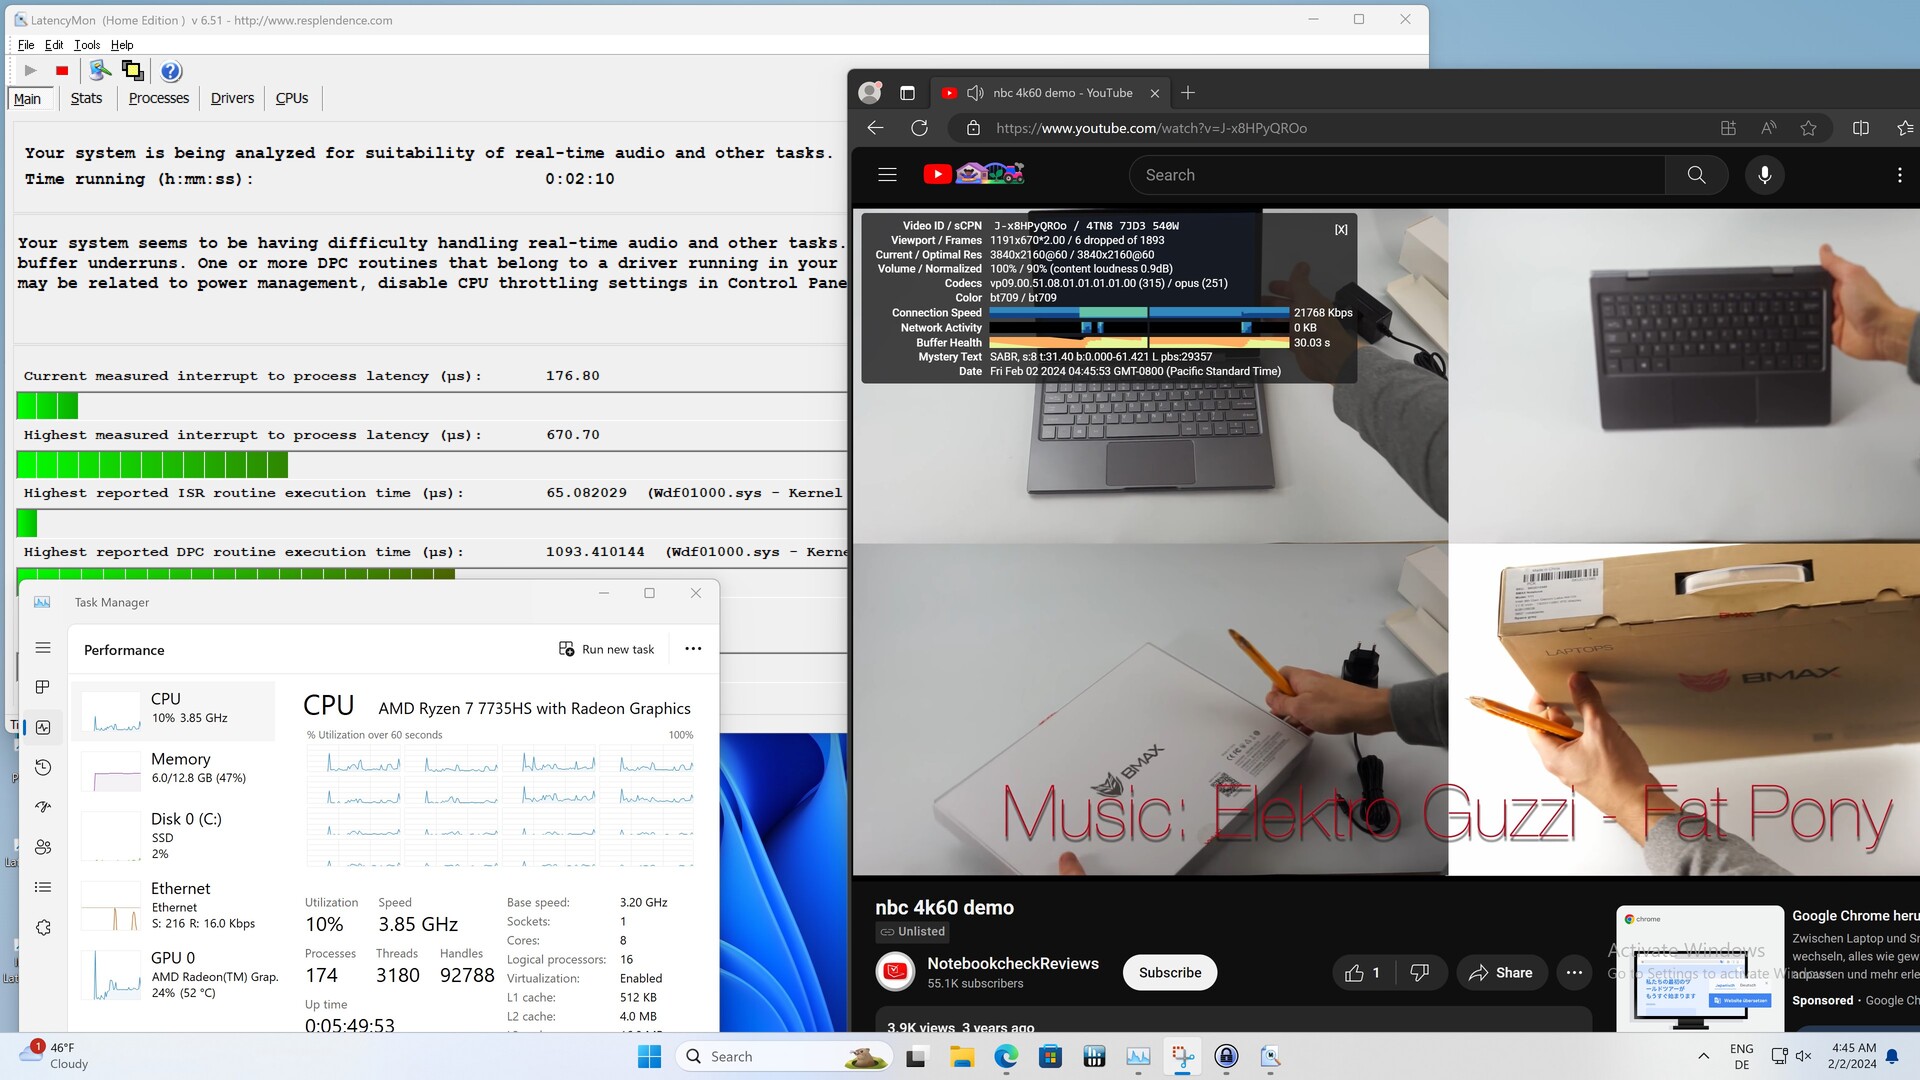
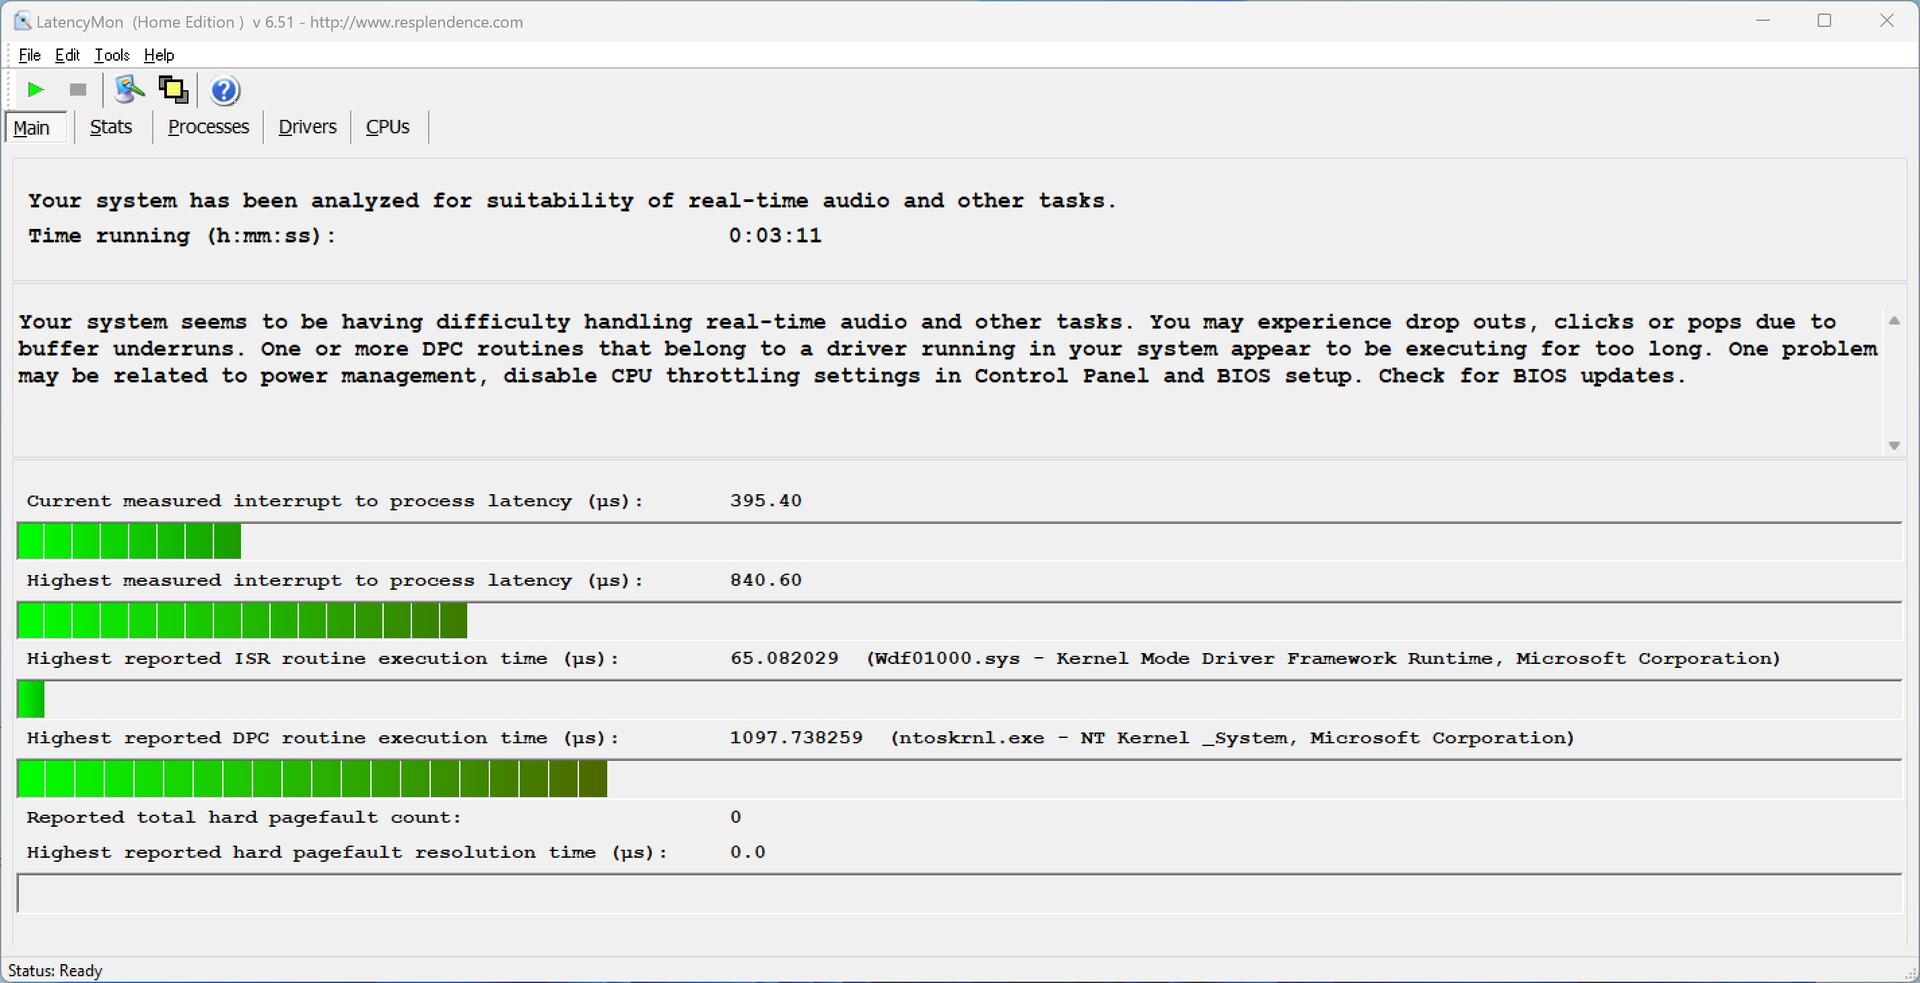
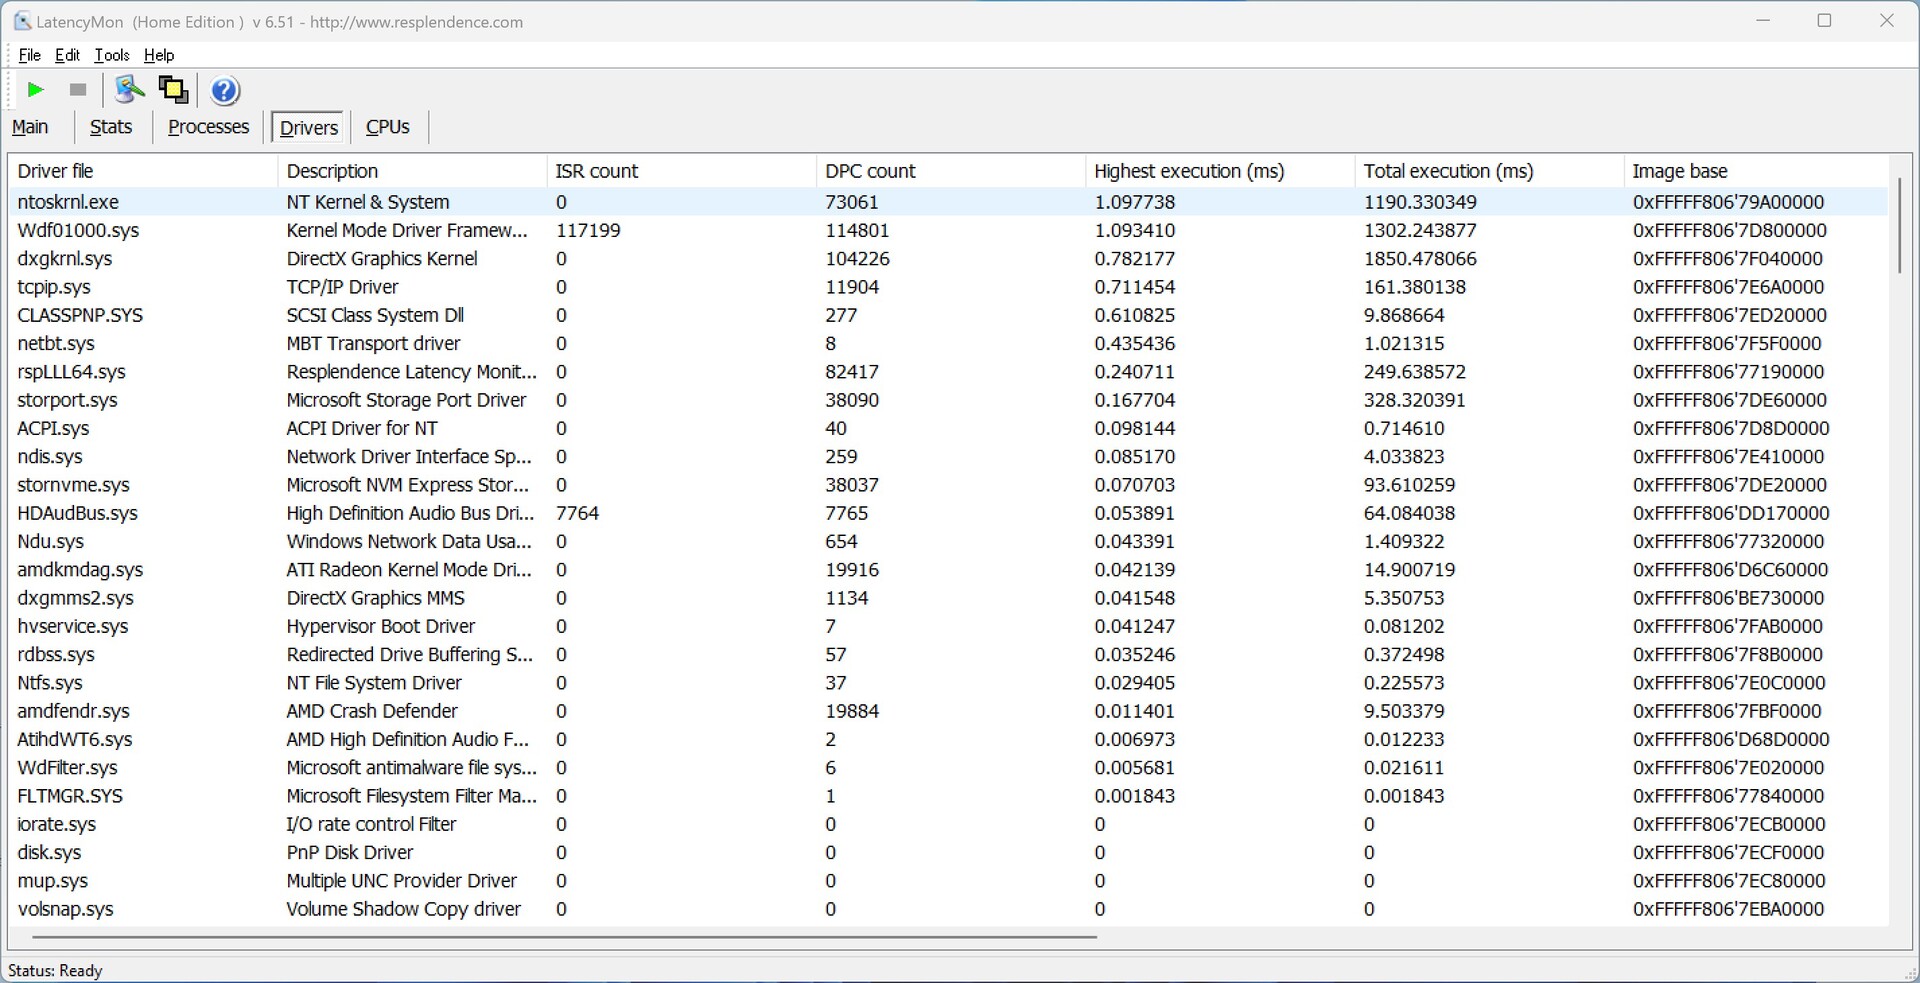
Latências de DPC
Já registramos latências ligeiramente maiores ao abrir várias guias usando o navegador Edge. No entanto, elas não aumentaram com a continuação do teste. Ao reproduzir nosso vídeo de teste em 4K, a iGPU foi estressada em cerca de 24% de sua capacidade.
| DPC Latencies / LatencyMon - interrupt to process latency (max), Web, Youtube, Prime95 | |
| Geekom AS 6, R9 6900HX | |
| Geekom A5 | |
| Minisforum Neptune Series NAD9 | |
| Maxtang MTN-FP750 | |
| NiPoGi AD08 | |
| Geekom Mini IT12 | |
| Minisforum Venus Series NAB6 | |
* ... menor é melhor
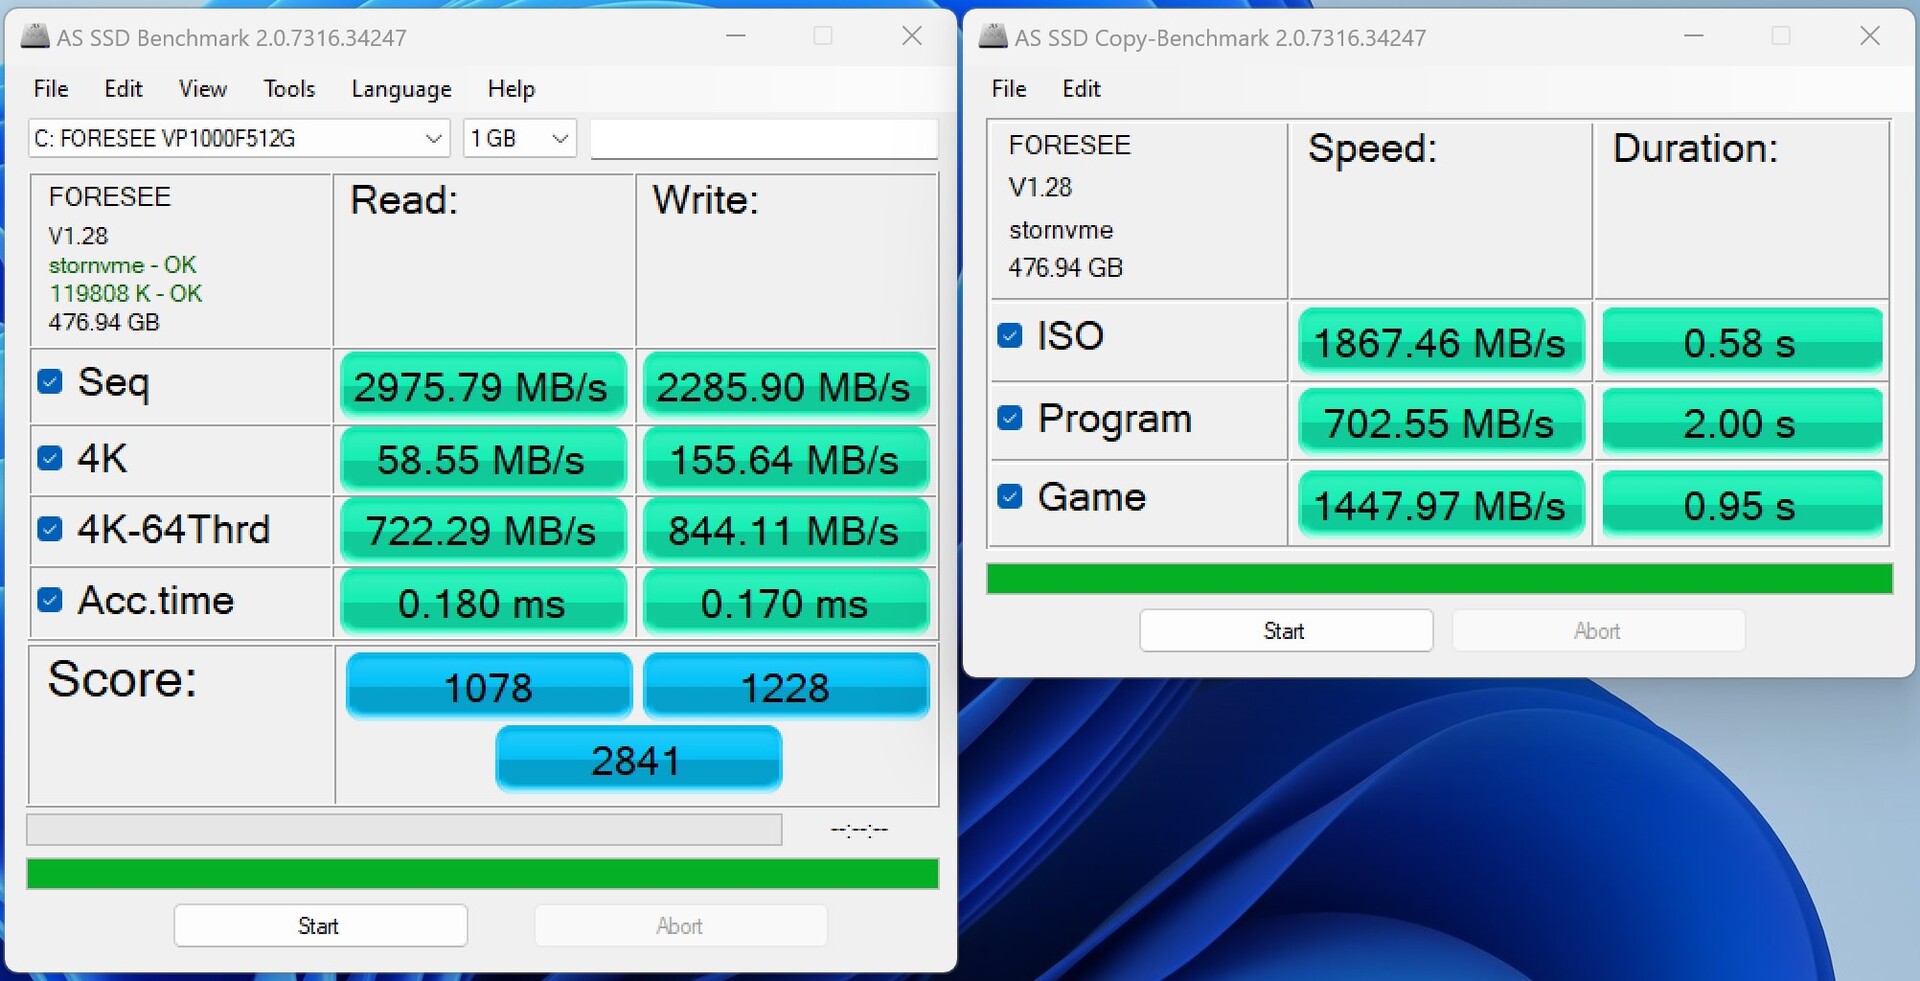
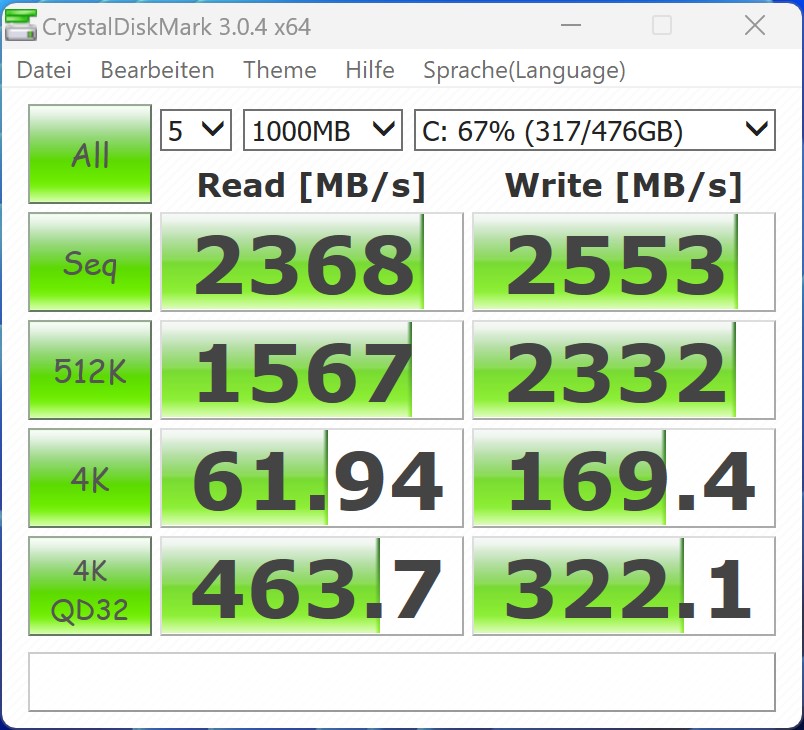
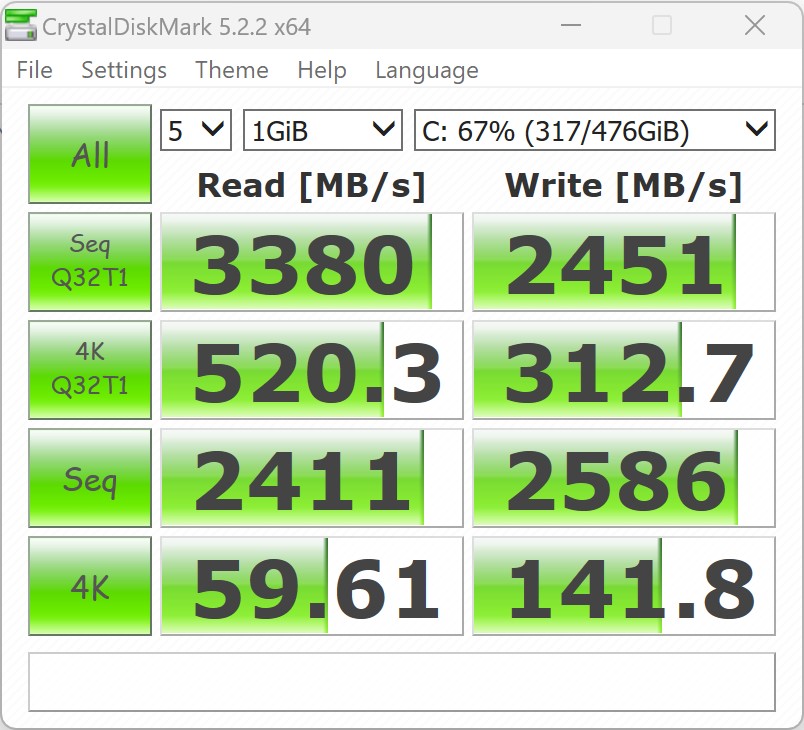
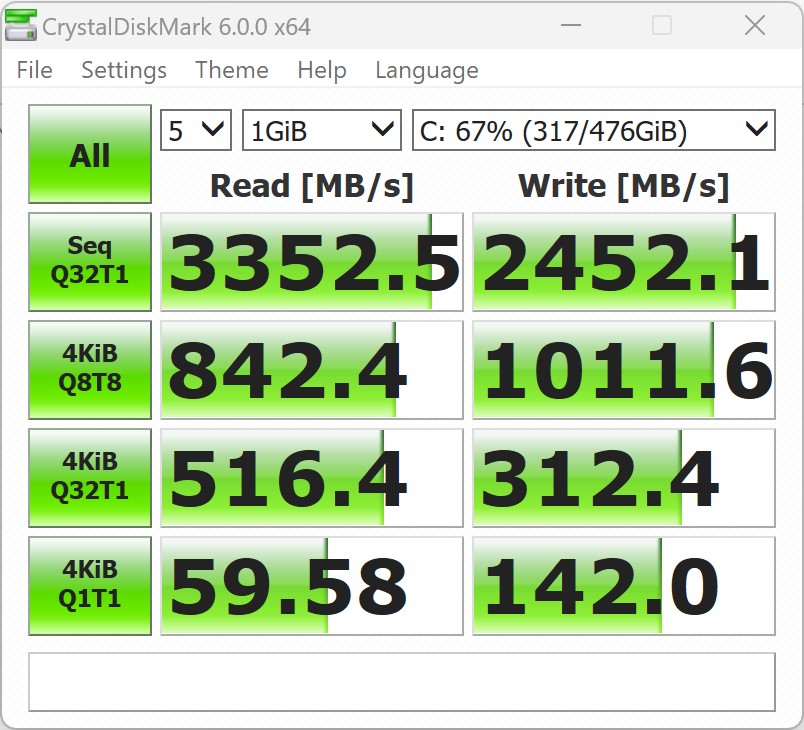
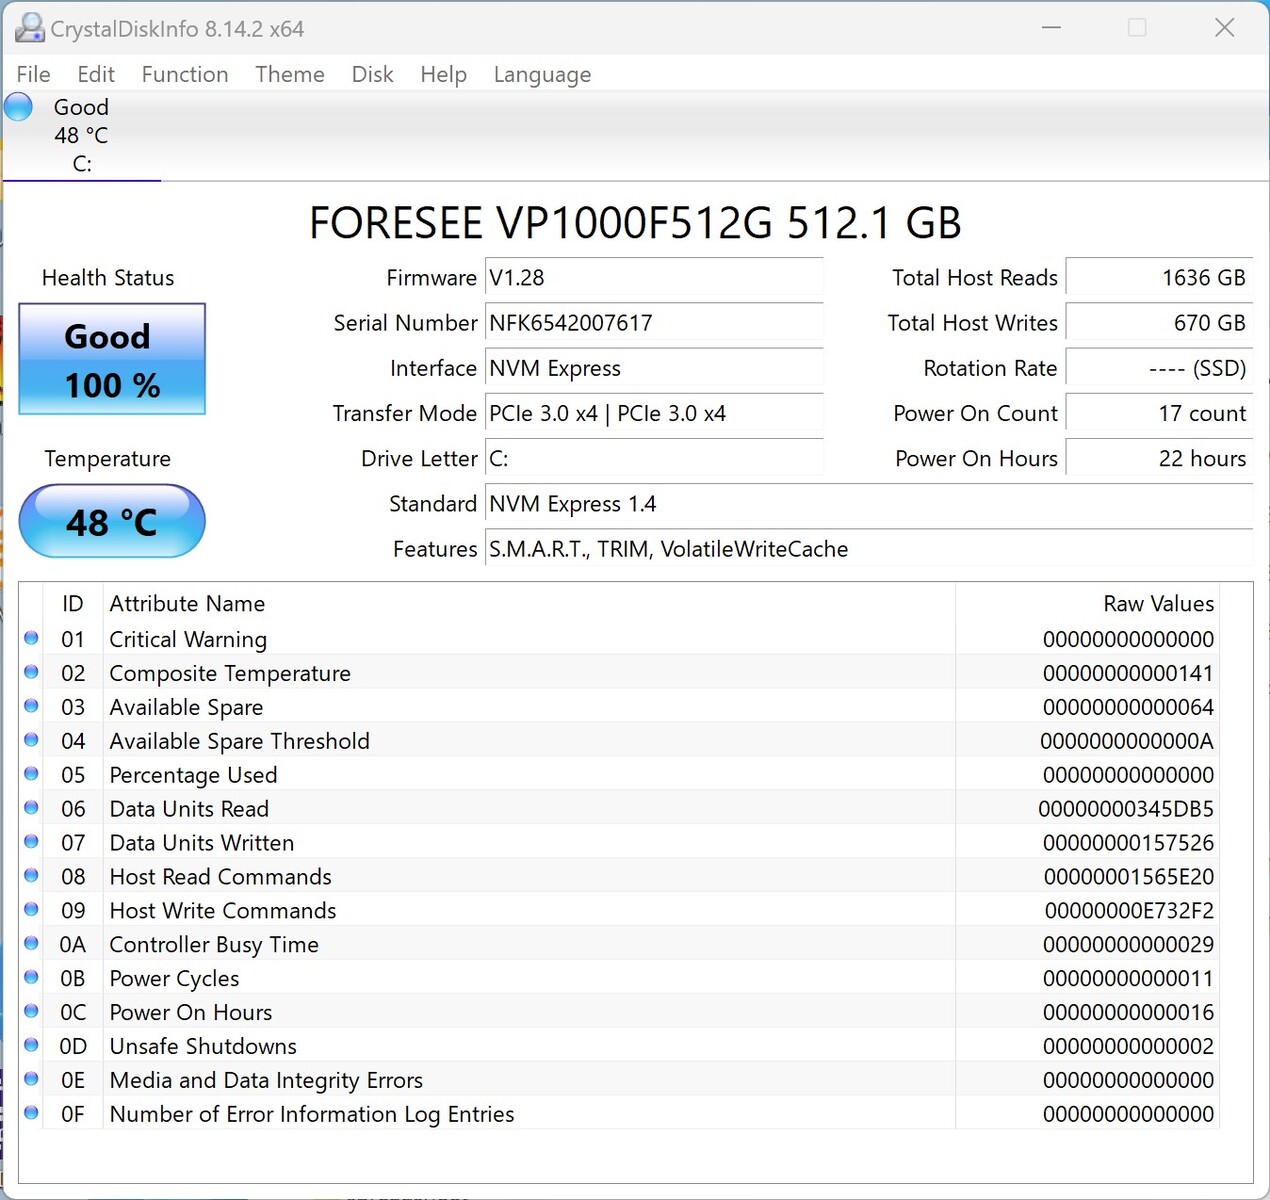
Armazenamento em massa
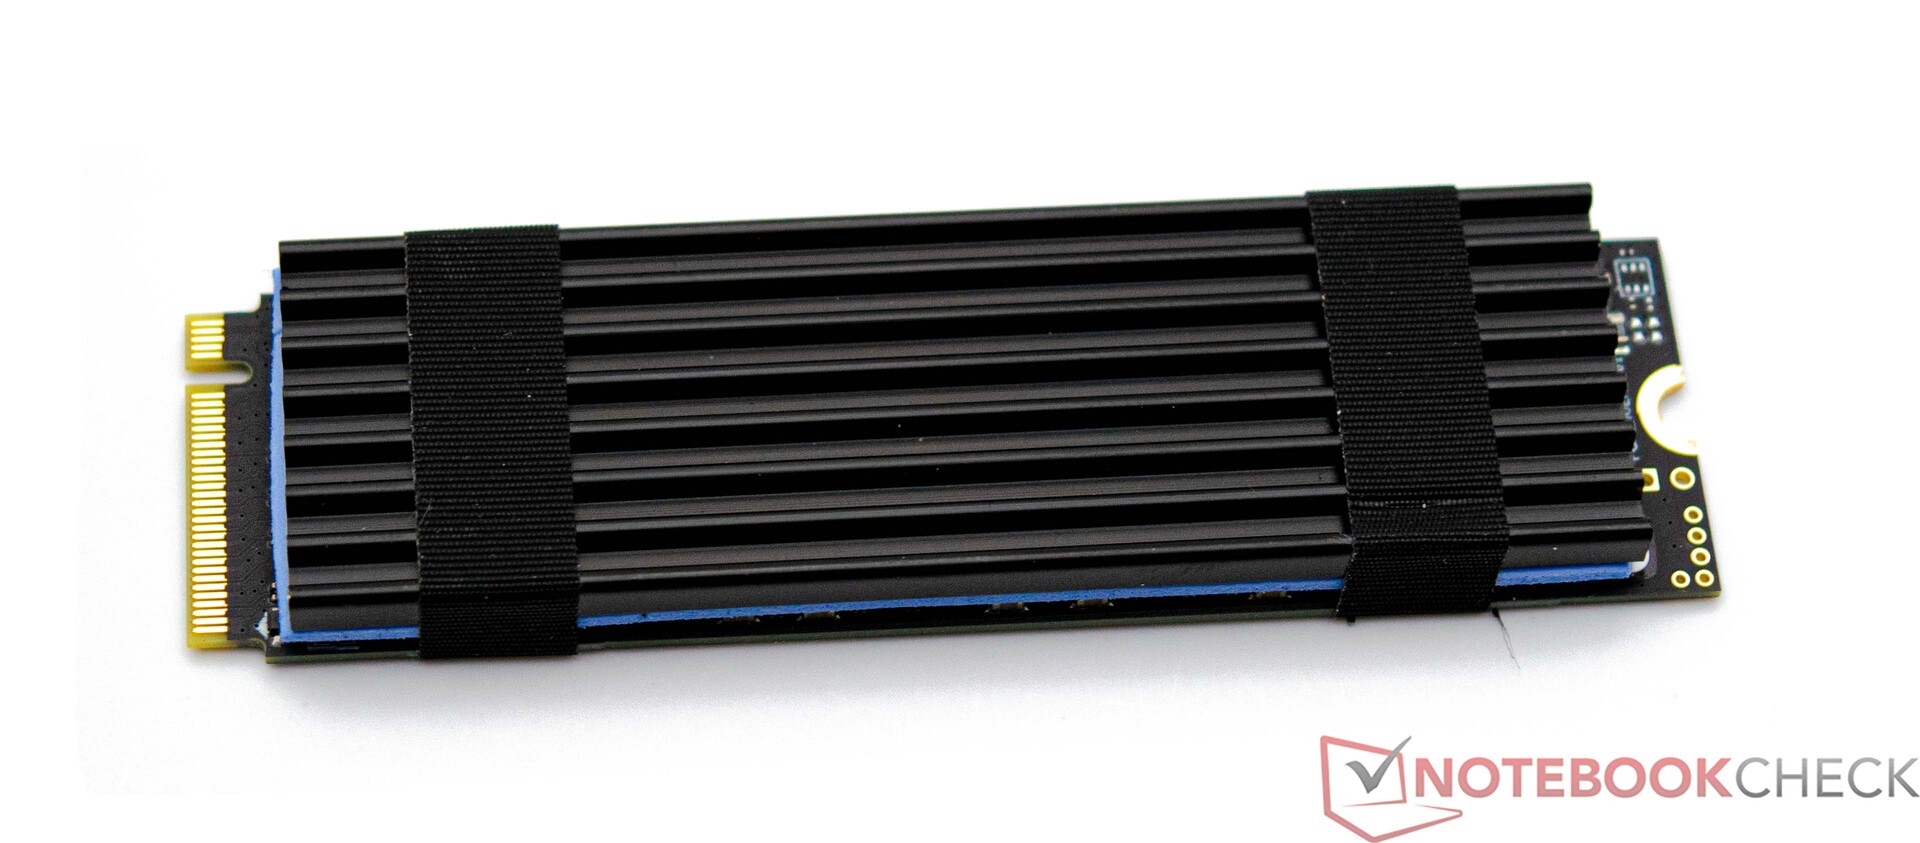
A Maxtang equipou nossa amostra de análise do MTN-FP750 com um SSD Foresee de 512 GB. A SSD PCIe 3.0 usa a interface M.2 com a maior largura de banda possível e não é artificialmente prejudicada por uma interface lenta. Apesar disso, o nosso dispositivo de análise só conseguiu um lugar no meio da tabela. É possível instalar um dispositivo de armazenamento adicional de 2,5 polegadas. Veja nossa tabela de comparação para mais comparações e benchmarks.

| Drive Performance rating - Percent | |
| Minisforum Neptune Series NAD9 | |
| Minisforum Venus Series NAB6 | |
| Média da turma Mini PC | |
| Geekom A5 | |
| NiPoGi AD08 | |
| Geekom Mini IT12 | |
| Maxtang MTN-FP750 | |
| Geekom AS 6, R9 6900HX | |
* ... menor é melhor
Continuous Performance Read: DiskSpd Read Loop, Queue Depth 8
Placa de vídeo
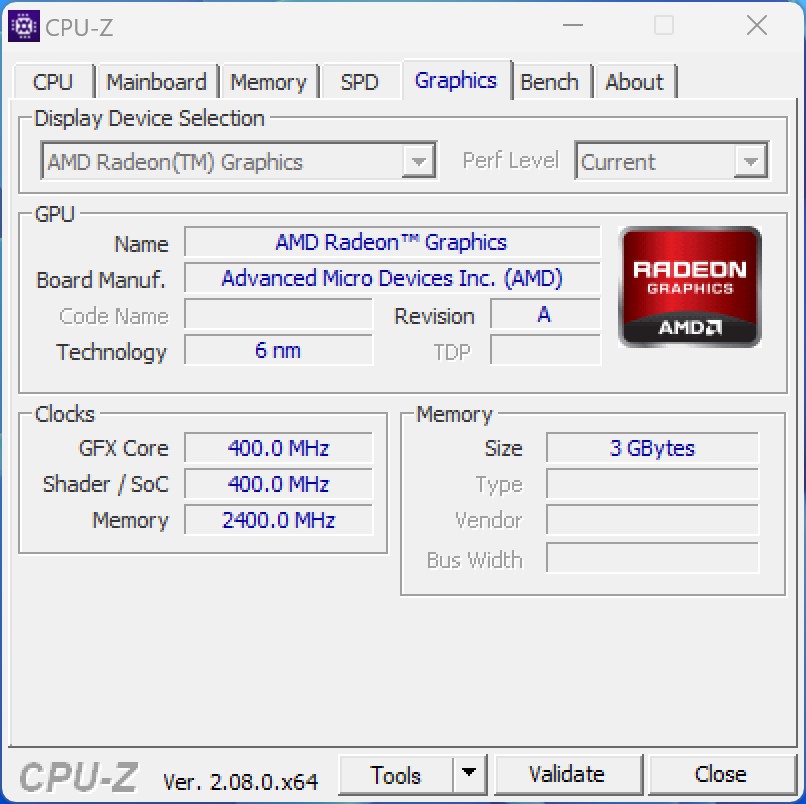
A saída gráfica é gerenciada pela AMD Radeon 680Muma iGPU que oferece bom desempenho na maioria das situações. No entanto, com o Maxtang MTN-FP750, isso é um pouco diferente e o motivo é a RAM instalada. O fabricante só equipou nosso dispositivo de análise com um módulo de RAM. Nessa configuração, a AMD Radeon 680M é praticamente mais rápida do que a Intel Iris Xe Graphics G7 com 96 EUs. Até mesmo o Geekom A5 está à frente de nossa amostra de análise com sua AMD Radeon RX Vega 8 mais antiga.
Para descobrir o motivo do baixo desempenho, pegamos outro módulo de RAM de nossos suprimentos e realizamos alguns benchmarks. Com isso, obtivemos resultados praticamente iguais aos do Geekom AS 6 o que faz com que o Maxtang MTN-FP750 não seja de forma alguma inferior aos seus concorrentes.
Outros benchmarks da AMD Radeon 680M podem ser encontrados aqui.
| 3DMark Performance rating - Percent | |
| Média AMD Radeon 680M | |
| Geekom AS 6, R9 6900HX | |
| Minisforum Neptune Series NAD9 | |
| Geekom A5 | |
| Geekom Mini IT12 | |
| Maxtang MTN-FP750 | |
| Minisforum Venus Series NAB6 | |
| NiPoGi AD08 | |
| Performance rating - Percent | |
| Geekom AS 6, R9 6900HX | |
| Geekom A5 | |
| Maxtang MTN-FP750 | |
| Minisforum Neptune Series NAD9 | |
| Geekom Mini IT12 | |
| Minisforum Venus Series NAB6 | |
| NiPoGi AD08 | |
| Unigine Valley 1.0 | |
| 1920x1080 Extreme HD DirectX AA:x8 | |
| Geekom AS 6, R9 6900HX | |
| Minisforum Neptune Series NAD9 | |
| Geekom A5 | |
| Geekom Mini IT12 | |
| Minisforum Venus Series NAB6 | |
| NiPoGi AD08 | |
| Maxtang MTN-FP750 | |
| 1920x1080 Extreme HD Preset OpenGL AA:x8 | |
| Geekom AS 6, R9 6900HX | |
| Geekom Mini IT12 | |
| Minisforum Neptune Series NAD9 | |
| Minisforum Venus Series NAB6 | |
| Geekom A5 | |
| Maxtang MTN-FP750 | |
| NiPoGi AD08 | |
| Maxtang MTN-FP750, AMD Radeon 680M R7 7735HS | Minisforum Neptune Series NAD9, Intel Iris Xe Graphics G7 96EUs i9-12900H | Geekom AS 6, R9 6900HX, AMD Radeon 680M R9 6900HX | Geekom Mini IT12, Intel Iris Xe Graphics G7 96EUs i7-1260P | Geekom A5, AMD Radeon RX Vega 8 (Ryzen 4000/5000) R7 5800H | Minisforum Venus Series NAB6, Intel UHD Graphics 64EUs (Alder Lake 12th Gen) i7-12650H | NiPoGi AD08, Intel UHD Graphics 64EUs (Alder Lake 12th Gen) i7-12650H | Média da turma Mini PC | |
|---|---|---|---|---|---|---|---|---|
| SPECviewperf 12 | -26% | 58% | -31% | 2% | -37% | -34% | 204% | |
| 1900x1060 3ds Max (3dsmax-05) (fps) | 46.9 | 40.9 -13% | 75.3 61% | 38.7 -17% | 51.7 10% | 36.2 -23% | 34.4 -27% | 146.2 ? 212% |
| 1900x1060 Catia (catia-04) (fps) | 51.5 | 41.2 -20% | 70.3 37% | 38.5 -25% | 44.2 -14% | 34.5 -33% | 30.3 -41% | 138.8 ? 170% |
| 1900x1060 Creo (creo-01) (fps) | 33.2 | 9.64 -71% | 45.2 36% | 7.52 -77% | 36.3 9% | 6.44 -81% | 21.1 -36% | 68.8 ? 107% |
| 1900x1060 Energy (energy-01) (fps) | 0.41 | 76.1 | 0.41 | 0.35 | 0.77 | 21.3 ? | ||
| 1900x1060 Maya (maya-04) (fps) | 45.2 | 39.9 -12% | 58.3 29% | 36.5 -19% | 40.3 -11% | 33.4 -26% | 32.5 -28% | 125.8 ? 178% |
| 1900x1060 Medical (medical-01) (fps) | 17.9 | 12.3 -31% | 44 146% | 11.2 -37% | 18.2 2% | 9.12 -49% | 8.41 -53% | 76.6 ? 328% |
| 1900x1060 Showcase (showcase-01) (fps) | 17.5 | 17.9 2% | 30.1 72% | 16.7 -5% | 21.7 24% | 15.9 -9% | 15.2 -13% | 81.5 ? 366% |
| 1900x1060 Solidworks (sw-03) (fps) | 72.1 | 47.2 -35% | 88.8 23% | 43.7 -39% | 68.3 -5% | 44.5 -38% | 43.4 -40% | 119.3 ? 65% |
| SPECviewperf 13 | -27% | 51% | -30% | 2% | -37% | -40% | 232% | |
| 3ds Max (3dsmax-06) (fps) | 48.3 | 40.5 -16% | 76.7 59% | 37.9 -22% | 51.6 7% | 36 -25% | 34.1 -29% | 142.9 ? 196% |
| Catia (catia-05) (fps) | 73.9 | 59.4 -20% | 105 42% | 56.3 -24% | 62.1 -16% | 49.6 -33% | 43.2 -42% | 191.8 ? 160% |
| Creo (creo-02) (fps) | 44.9 | 38.8 -14% | 78.4 75% | 36.8 -18% | 50.6 13% | 33 -27% | 33.1 -26% | 160.7 ? 258% |
| Energy (energy-02) (fps) | 11.4 | 4.27 -63% | 13.9 22% | 4.29 -62% | 10.6 -7% | 2.82 -75% | 2.62 -77% | 38.9 ? 241% |
| Maya (maya-05) (fps) | 58.3 | 44.2 -24% | 99 70% | 42.9 -26% | 56.5 -3% | 38.2 -34% | 41.3 -29% | 199.4 ? 242% |
| Medical (medical-02) (fps) | 32.8 | 14.5 -56% | 44.9 37% | 14 -57% | 31 -5% | 10.9 -67% | 8.63 -74% | 146.5 ? 347% |
| Showcase (showcase-02) (fps) | 17.4 | 17.9 3% | 30.4 75% | 16.8 -3% | 21.5 24% | 15.7 -10% | 15.1 -13% | 77.7 ? 347% |
| Solidworks (sw-04) (fps) | 72.9 | 55.8 -23% | 95 30% | 54.1 -26% | 72.4 -1% | 53.9 -26% | 51.9 -29% | 121.1 ? 66% |
| SPECviewperf 2020 | -35% | 84% | -24% | 2% | -43% | 297% | ||
| 3840x2160 Medical (medical-03) (fps) | 4.72 | 2.57 -46% | 8.59 82% | 3.37 -29% | 4.82 2% | 2.54 -46% | 22.9 ? 385% | |
| 3840x2160 Energy (energy-03) (fps) | 6.6 | 3.02 -54% | 16.9 156% | 7.39 12% | 5.33 -19% | 1.9 -71% | 33.7 ? 411% | |
| 3840x2160 Creo (creo-03) (fps) | 17.5 | 15.3 -13% | 28.9 65% | 15.1 -14% | 19.1 9% | 12.7 -27% | 49.8 ? 185% | |
| 3840x2160 CATIA (catia-06) (fps) | 13.1 | 8.2 -37% | 20.4 56% | 8.23 -37% | 13.1 0% | 7.63 -42% | 34.8 ? 166% | |
| 3840x2160 3ds Max (3dsmax-07) (fps) | 9.26 | 9.67 4% | 17.5 89% | 9.65 4% | 11.3 22% | 8.65 -7% | 55.4 ? 498% | |
| 3840x2160 Siemens NX (snx-04) (fps) | 33 | 6.69 -80% | 58.5 77% | 6.23 -81% | 38 15% | 6.61 -80% | 51.5 ? 56% | |
| 3840x2160 Maya (maya-06) (fps) | 29.5 | 24 -19% | 47.4 61% | 23.7 -20% | 25.8 -13% | 21.2 -28% | 141.1 ? 378% | |
| Média Total (Programa/Configurações) | -29% /
-29% | 64% /
64% | -28% /
-28% | 2% /
2% | -39% /
-39% | -37% /
-37% | 244% /
244% |
| 3DMark 06 Score 1366x768 | 25274 pontos | |
| 3DMark Vantage P Result | 24874 pontos | |
| 3DMark 11 Performance | 6723 pontos | |
| 3DMark Ice Storm Standard Score | 127954 pontos | |
| 3DMark Cloud Gate Standard Score | 21960 pontos | |
| 3DMark Fire Strike Score | 4002 pontos | |
| 3DMark Fire Strike Extreme Score | 2090 pontos | |
| 3DMark Time Spy Score | 1591 pontos | |
Ajuda | ||
Desempenho em jogos
Nossa especificação de análise Maxtang MTN-FP750 tem apenas uma adequação limitada para jogos. A relativamente poderosa AMD Radeon 680M não consegue fornecer toda a sua potência. Portanto, recomendamos a instalação de dois módulos de RAM para obter o melhor desempenho. Uma orientação aproximada sobre o desempenho em jogos pode ser encontrada na forma do Geekom AS 6.
Para mais comparações e benchmarks, dê uma olhada na nossa Lista de jogos de GPU.
| The Witcher 3 | |
| 1024x768 Low Graphics & Postprocessing | |
| Geekom AS 6, R9 6900HX | |
| Minisforum Neptune Series NAD9 | |
| Geekom Mini IT12 | |
| Geekom A5 | |
| Minisforum Venus Series NAB6 | |
| NiPoGi AD08 | |
| Maxtang MTN-FP750 | |
| 1920x1080 High Graphics & Postprocessing (Nvidia HairWorks Off) | |
| Geekom AS 6, R9 6900HX | |
| Minisforum Neptune Series NAD9 | |
| NiPoGi AD08 | |
| Geekom Mini IT12 | |
| Minisforum Venus Series NAB6 | |
| Geekom A5 | |
| Maxtang MTN-FP750 | |
| Borderlands 3 | |
| 1280x720 Very Low Overall Quality (DX11) | |
| Geekom A5 | |
| Geekom AS 6, R9 6900HX | |
| Minisforum Neptune Series NAD9 | |
| Maxtang MTN-FP750 | |
| Geekom Mini IT12 | |
| Minisforum Venus Series NAB6 | |
| NiPoGi AD08 | |
| 1920x1080 High Overall Quality (DX11) | |
| Geekom AS 6, R9 6900HX | |
| Geekom A5 | |
| Minisforum Neptune Series NAD9 | |
| Maxtang MTN-FP750 | |
| Geekom Mini IT12 | |
| Minisforum Venus Series NAB6 | |
| NiPoGi AD08 | |
| GTA V | |
| 1024x768 Lowest Settings possible | |
| Geekom A5 | |
| Minisforum Neptune Series NAD9 | |
| Minisforum Venus Series NAB6 | |
| Geekom AS 6, R9 6900HX | |
| Geekom Mini IT12 | |
| NiPoGi AD08 | |
| Maxtang MTN-FP750 | |
| 1920x1080 High/On (Advanced Graphics Off) AA:2xMSAA + FX AF:8x | |
| Geekom AS 6, R9 6900HX | |
| Geekom A5 | |
| Maxtang MTN-FP750 | |
| Minisforum Neptune Series NAD9 | |
| Geekom Mini IT12 | |
| Minisforum Venus Series NAB6 | |
| NiPoGi AD08 | |
| baixo | média | alto | ultra | |
|---|---|---|---|---|
| GTA V (2015) | 95.5 | 85.7 | 28.2 | 12.7 |
| The Witcher 3 (2015) | 73 | 46.7 | 23.7 | 14.9 |
| Dota 2 Reborn (2015) | 115.8 | 87.4 | 60.5 | 53.1 |
| Final Fantasy XV Benchmark (2018) | 39.2 | 20.5 | 14.6 | |
| X-Plane 11.11 (2018) | 49.8 | 39.8 | 33.8 | |
| Far Cry 5 (2018) | 46 | 25 | 22 | 21 |
| Strange Brigade (2018) | 78.4 | 31.4 | 26.7 | 23.1 |
| Shadow of the Tomb Raider (2018) | 53.3 | 21.8 | 19.8 | 16.4 |
| Far Cry New Dawn (2019) | 40 | 23 | 21 | 20 |
| Metro Exodus (2019) | 43.1 | 17.6 | 13.8 | 11.7 |
| Borderlands 3 (2019) | 58.2 | 24.8 | 15.7 | 12.5 |
| F1 2020 (2020) | 96.9 | 49.8 | 39.1 | 27.5 |
| F1 2021 (2021) | 97 | 49.8 | 36.4 | 16.7 |
| God of War (2022) | 19.5 | 15.9 | 11.7 | |
| GRID Legends (2022) | 58.2 | 45 | 34.2 | 26.6 |
| Tiny Tina's Wonderlands (2022) | 37.7 | 28.2 | 20.2 | 16.2 |
| F1 22 (2022) | 45.6 | 40.6 | 32.1 | 9.25 |
| F1 23 (2023) | 45.3 | 40.1 | 29.1 | |
| Total War Pharaoh (2023) | 43.3 | 33.3 | 21.6 | 16.9 |
| Prince of Persia The Lost Crown (2024) | 89.3 | 58.8 | 58.4 |
Emissões - Econômicas, mas não inaudíveis
Emissões de ruído
Sem estresse, o Maxtang MTN-FP750 é, em sua maior parte, silencioso. No entanto, sob carga, atingimos rapidamente 45 dB(A) e só conseguimos perceber uma diferença mínima entre carga média e carga total. Porém, podemos considerar que isso está dentro da tolerância de medição. É uma pena que pareça haver apenas dois níveis de ventilador. Uma olhada na tabela mostra que tanto o Geekom A5 e o NiPoGi AD08 eram ainda mais barulhentos no mesmo cenário.
Barulho
| Ocioso |
| 25.3 / 25.3 / 25.4 dB |
| Carga |
| 45.1 / 45.3 dB |
 | ||
30 dB silencioso 40 dB(A) audível 50 dB(A) ruidosamente alto |
||
min: | ||
| Maxtang MTN-FP750 R7 7735HS, Radeon 680M | Minisforum Neptune Series NAD9 i9-12900H, Iris Xe G7 96EUs | Geekom AS 6, R9 6900HX R9 6900HX, Radeon 680M | Geekom Mini IT12 i7-1260P, Iris Xe G7 96EUs | Geekom A5 R7 5800H, Vega 8 | Minisforum Venus Series NAB6 i7-12650H, UHD Graphics 64EUs | NiPoGi AD08 i7-12650H, UHD Graphics 64EUs | |
|---|---|---|---|---|---|---|---|
| Noise | -3% | -14% | -3% | -7% | -4% | -14% | |
| desligado / ambiente * (dB) | 25 | 30.2 -21% | 30 -20% | 29.8 -19% | 25 -0% | 29.4 -18% | 25 -0% |
| Idle Minimum * (dB) | 25.3 | 30.5 -21% | 33.2 -31% | 29.9 -18% | 28.2 -11% | 29.4 -16% | 31.1 -23% |
| Idle Average * (dB) | 25.3 | 30.5 -21% | 33.6 -33% | 30.1 -19% | 28.2 -11% | 29.5 -17% | 31.2 -23% |
| Idle Maximum * (dB) | 25.4 | 30.5 -20% | 33.6 -32% | 30.2 -19% | 28.2 -11% | 29.7 -17% | 31.3 -23% |
| Load Average * (dB) | 45.1 | 30.5 32% | 36.8 18% | 32.1 29% | 47.8 -6% | 34.6 23% | 51.7 -15% |
| Load Maximum * (dB) | 45.3 | 30.5 33% | 39.8 12% | 32.5 28% | 47.4 -5% | 36.1 20% | 45.8 -1% |
* ... menor é melhor
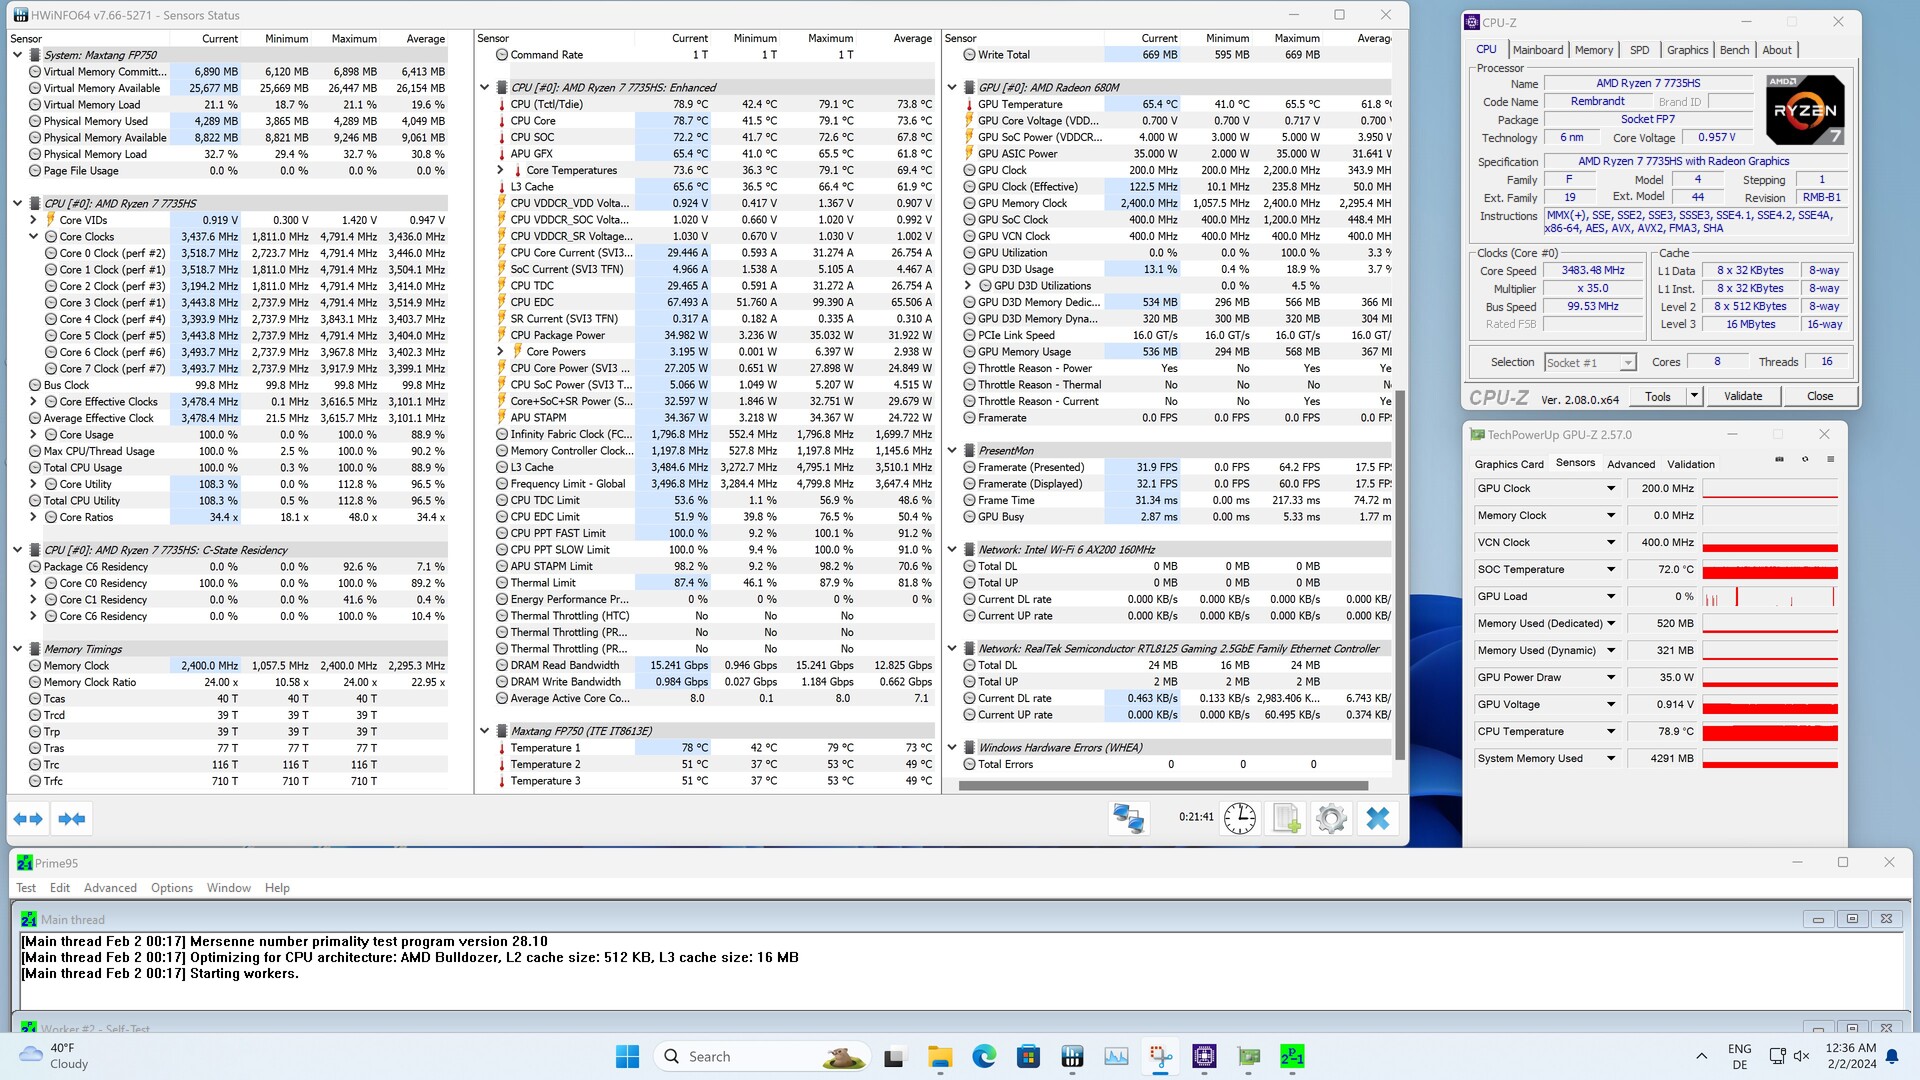
Temperatura
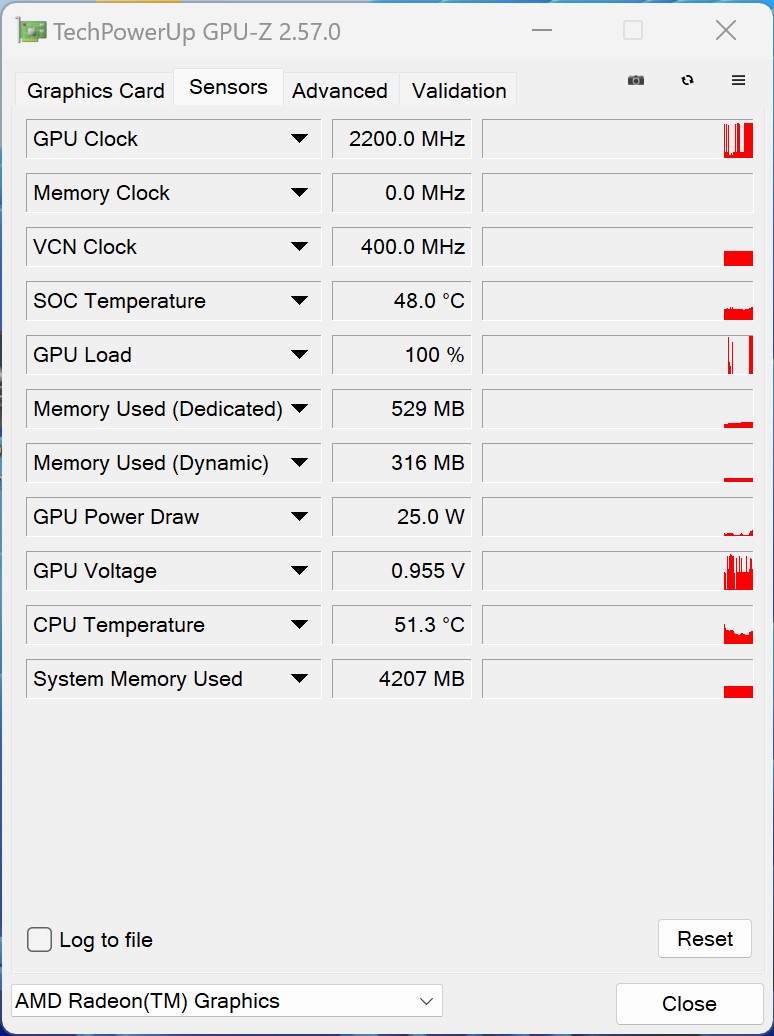
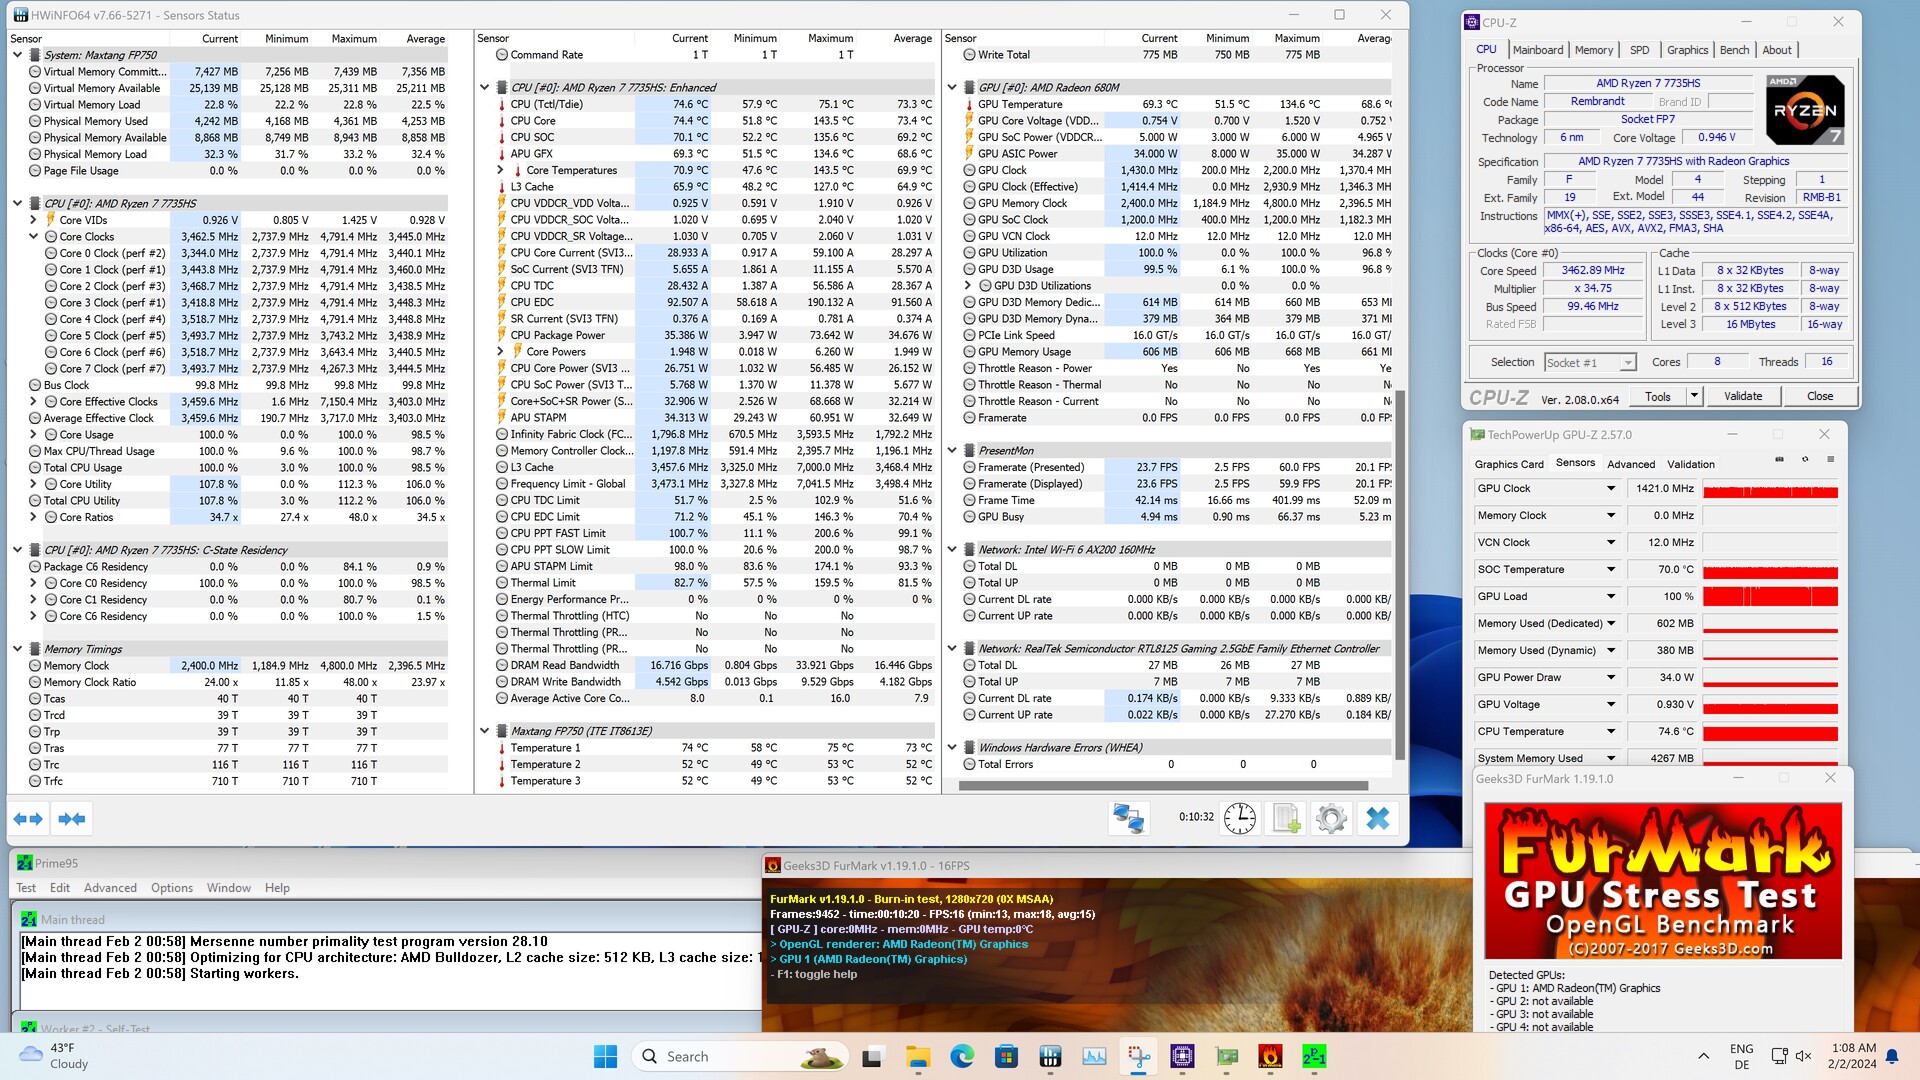
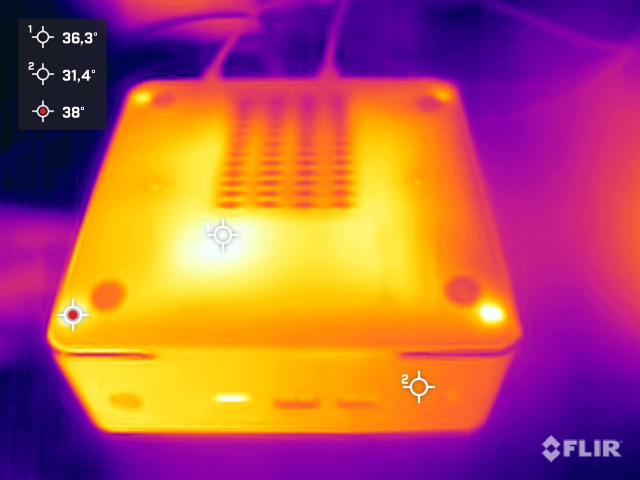
O gabinete do Maxtang MTN-FP750 aquece minimamente quando está funcionando em modo inativo ou sob carga. Observamos um ponto de acesso na parte superior da unidade, medindo apenas 40 °C, enquanto a parte inferior do dispositivo não chegou nem a 35 °C. No entanto, o SoC fica consideravelmente mais quente, embora, com quase 80 °C, ainda estivéssemos na zona verde. Além disso, o fabricante definiu uma temperatura máxima de 90 °C no BIOS. Mesmo assim, não conseguimos atingir essa temperatura com o limite de energia predefinido de 35 watts.
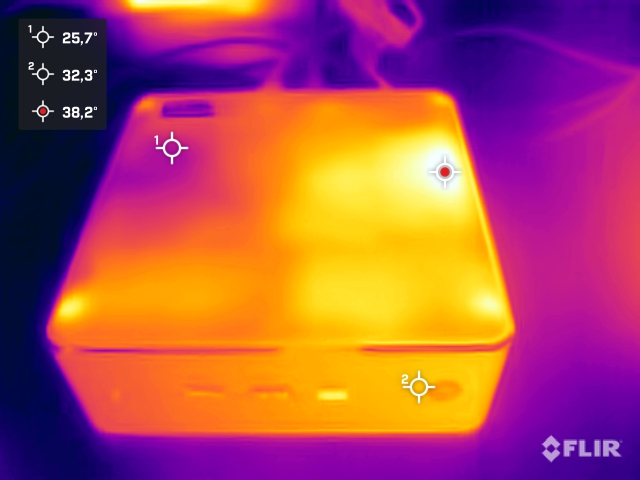
(+) A temperatura máxima no lado superior é 39.7 °C / 103 F, em comparação com a média de 35.4 °C / 96 F , variando de 20.6 a 69.5 °C para a classe Mini PC.
(+) A parte inferior aquece até um máximo de 34.3 °C / 94 F, em comparação com a média de 36.1 °C / 97 F
(+) Em uso inativo, a temperatura média para o lado superior é 29.4 °C / 85 F, em comparação com a média do dispositivo de 32.1 °C / ### class_avg_f### F.
Consumo de energia
Em nossa comparação, o Maxtang MTN-FP750 pertence ao grupo de dispositivos mais econômicos. Em modo inativo, já registramos um consumo de energia muito baixo, de apenas 7 a 8,4 watts. Somente o Geekom A5 e o Geekom Mini IT12 podem acompanhar o ritmo com resultados igualmente baixos. Sob carga, nossa amostra de análise continuou a ser comparativamente econômica, com nosso dispositivo de medição registrando um pico de apenas 61,4 watts. Considerando os limites de energia restritos do processador, esses não são requisitos de energia particularmente surpreendentes sob carga.
Isso significa que a PSU de 90 watts nunca tem problemas para fornecer energia suficiente ao mini PC de forma confiável. A PSU pode até mesmo lidar sem esforço com o ajuste manual do consumo de energia.

| desligado | |
| Ocioso | |
| Carga |
|
Key:
min: | |
| Maxtang MTN-FP750 R7 7735HS, Radeon 680M | Minisforum Neptune Series NAD9 i9-12900H, Iris Xe G7 96EUs | Geekom AS 6, R9 6900HX R9 6900HX, Radeon 680M | Geekom Mini IT12 i7-1260P, Iris Xe G7 96EUs | Geekom A5 R7 5800H, Vega 8 | Minisforum Venus Series NAB6 i7-12650H, UHD Graphics 64EUs | NiPoGi AD08 i7-12650H, UHD Graphics 64EUs | Média AMD Radeon 680M | Média da turma Mini PC | |
|---|---|---|---|---|---|---|---|---|---|
| Power Consumption | -73% | -23% | -2% | -12% | -50% | -107% | -10% | -44% | |
| Idle Minimum * (Watt) | 7 | 12.1 -73% | 6.8 3% | 5 29% | 6.9 1% | 10.4 -49% | 14.2 -103% | 6.93 ? 1% | 8.65 ? -24% |
| Idle Average * (Watt) | 8.1 | 13 -60% | 9.4 -16% | 7 14% | 7.9 2% | 12.3 -52% | 15.1 -86% | 8.98 ? -11% | 10.8 ? -33% |
| Idle Maximum * (Watt) | 8.4 | 18.2 -117% | 13.7 -63% | 10.7 -27% | 8.9 -6% | 12.4 -48% | 28.7 -242% | 10.5 ? -25% | 13.7 ? -63% |
| Load Average * (Watt) | 54.2 | 70.6 -30% | 45.3 16% | 50.3 7% | 60.8 -12% | 72.9 -35% | 76.9 -42% | 53.5 ? 1% | 64.4 ? -19% |
| Load Maximum * (Watt) | 61.4 | 113 -84% | 94.8 -54% | 82 -34% | 89.7 -46% | 101.2 -65% | 100.2 -63% | 70.5 ? -15% | 112.2 ? -83% |
* ... menor é melhor
Power consumption with an external monitor
Pro
Contra
Veredicto - Melhor desempenho, mas somente após a otimização
O Maxtang MTN-FP750 é um mini PC relativamente simples para uso em casa ou no local de trabalho. O AMD Ryzen 7 7735HS oferece potência suficiente para lidar com a maioria das tarefas. Seus 8 núcleos e 16 threads tornam o mini PC adequado para aplicativos que exigem muito desempenho. A RAM instalada é de 16 GB, o que não representa nenhum problema por enquanto. No entanto, no final das contas, o uso de um único módulo de RAM valeu a pena, apesar de o Maxtang MTN-FP750 permitir a instalação de módulos SO-DIMM. Isso significa que, nos testes, o Maxtang MTN-FP750 não apresentou o tipo de desempenho que esperávamos. As diferenças de desempenho mais notáveis podem ser encontradas nos benchmarks 3D. Esse problema pode ser evitado com a instalação de um módulo de RAM adicional e, sem dúvida, é algo a que os clientes devem prestar atenção.
De acordo com a folha de dados, o Maxtang MTN-FP750 oferece excelente desempenho. No entanto, nos testes, o mini PC não conseguiu fornecer a potência prometida.
A maior vantagem do Maxtang MTN-FP750 é seu baixo preço em comparação com a concorrência apresentada aqui em nossa comparação. O desempenho é um pouco pior, a menos que o senhor resolva o problema com suas próprias mãos e os limites de potência do SoC não possam ser ajustados. Em nossa opinião, o limite de potência definido de 35 watts é um pouco conservador demais. Com 45 watts, o fabricante poderia ter chegado a um bom compromisso. O mesmo se aplica à RAM, que pode ser expandida com um segundo módulo. Se o senhor considerar esses dois pontos, em termos de desempenho, esse é um Maxtang MTN-FP750 completamente diferente daquele que testamos.
A seleção de portas pode ser descrita como sólida. Todas as portas importantes estão disponíveis, mas é só isso. Thunderbolt ou USB4 estão ausentes, o que limita um pouco o número de casos de uso. Um efeito colateral positivo de ter uma CPU com limitações de desempenho são os requisitos de energia do Maxtang MTN-FP750. Nos testes, esse dispositivo foi significativamente mais econômico do que seus concorrentes. Infelizmente, isso não influenciou positivamente o ruído comparativamente alto da ventoinha. Um conceito de resfriamento um pouco melhor teria resultado em melhores resultados nessa área.
Preço e disponibilidade
Em nossa configuração de análise, o Maxtang MTN-FP750 pode ser adquirido por $440 dólares americanos diretamente do fabricante.
Maxtang MTN-FP750
- 02/27/2024 v7 (old)
Sebastian Bade
Transparência
A seleção dos dispositivos a serem analisados é feita pela nossa equipe editorial. A amostra de teste foi fornecida gratuitamente ao autor pelo fabricante para fins de revisão. Não houve influência de terceiros nesta revisão, nem o fabricante recebeu uma cópia desta revisão antes da publicação. Não houve obrigação de publicar esta revisão. Como empresa de mídia independente, a Notebookcheck não está sujeita à autoridade de fabricantes, varejistas ou editores.
É assim que o Notebookcheck está testando
Todos os anos, o Notebookcheck analisa de forma independente centenas de laptops e smartphones usando procedimentos padronizados para garantir que todos os resultados sejam comparáveis. Desenvolvemos continuamente nossos métodos de teste há cerca de 20 anos e definimos padrões da indústria no processo. Em nossos laboratórios de teste, equipamentos de medição de alta qualidade são utilizados por técnicos e editores experientes. Esses testes envolvem um processo de validação em vários estágios. Nosso complexo sistema de classificação é baseado em centenas de medições e benchmarks bem fundamentados, o que mantém a objetividade.
