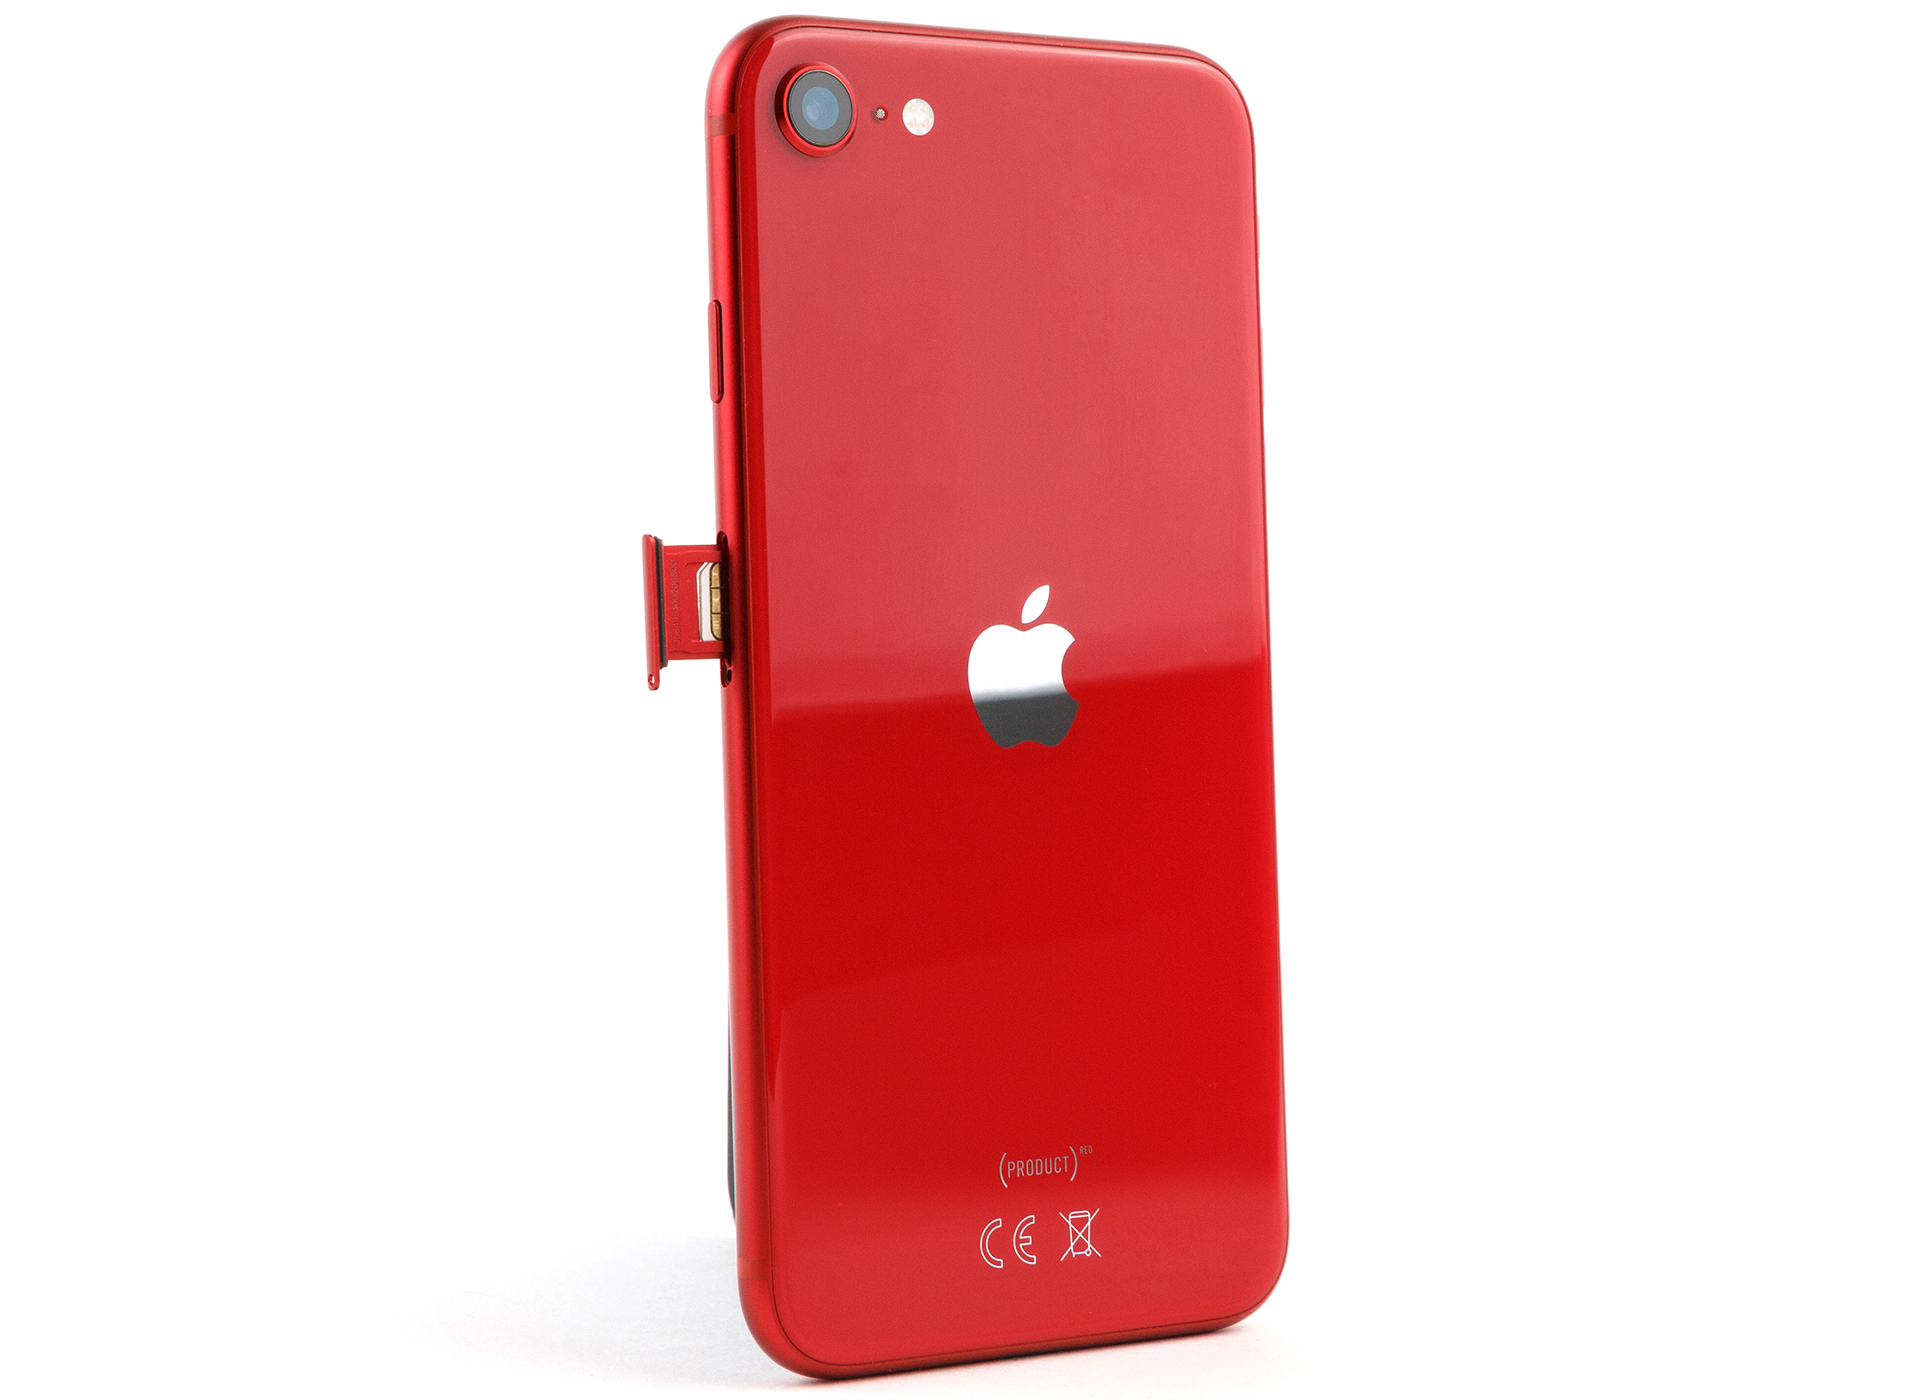
Breve Análise do Apple iPhone SE 2020 - Telefone pequeno com um coração que bate rápido
Competing Devices
Avaliação | Data | Modelo | Peso | Unidade | Size | Resolução | Preço |
|---|---|---|---|---|---|---|---|
| 85.2 % v7 (old) | 05/2020 | Apple iPhone SE 2020 A13 Bionic, A13 Bionic GPU | 148 g | 128 GB NVMe | 4.70" | 1334x750 | |
| 85.7 % v7 (old) | 12/2019 | Google Pixel 4 SD 855, Adreno 640 | 162 g | 64 GB UFS 2.1 Flash | 5.70" | 2280x1080 | |
| 86.5 % v7 (old) | 09/2019 | Apple iPhone 11 A13 Bionic, A13 Bionic GPU | 194 g | 64 GB SSD | 6.10" | 1792x828 | |
| 82.9 % v7 (old) | 10/2017 | Apple iPhone 8 A11 Bionic, A11 Bionic GPU | 148 g | Apple 256 GB (iPhone 8 / Plus) | 4.70" | 1334x750 | |
| 86 % v7 (old) | 03/2020 | Samsung Galaxy S10 Lite SD 855, Adreno 640 | 186 g | 128 GB UFS 3.0 Flash | 6.70" | 2400x1080 | |
| 83.8 % v7 (old) | 01/2020 | Xiaomi Mi Note 10 Pro SD 730G, Adreno 618 | 208 g | 256 GB UFS 2.0 Flash | 6.47" | 2340x1080 |

| Networking | |
| iperf3 transmit AX12 | |
| Apple iPhone SE 2020 | |
| Google Pixel 4 | |
| Apple iPhone 11 | |
| Samsung Galaxy S10 Lite | |
| Xiaomi Mi Note 10 Pro | |
| iperf3 receive AX12 | |
| Apple iPhone SE 2020 | |
| Samsung Galaxy S10 Lite | |
| Apple iPhone 11 | |
| Google Pixel 4 | |
| Xiaomi Mi Note 10 Pro | |


| |||||||||||||||||||||||||
iluminação: 92 %
iluminação com acumulador: 688 cd/m²
Contraste: 2457:1 (Preto: 0.28 cd/m²)
ΔE ColorChecker Calman: 1 | ∀{0.5-29.43 Ø4.71}
ΔE Greyscale Calman: 1.7 | ∀{0.09-98 Ø4.96}
99.9% sRGB (Calman 2D)
Gamma: 2.25
CCT: 6790 K
| Apple iPhone SE 2020 IPS, 1334x750, 4.7" | Apple iPhone 8 IPS True Tone, 1334x750, 4.7" | Apple iPhone 11 IPS, 1792x828, 6.1" | Google Pixel 4 OLED, 2280x1080, 5.7" | Samsung Galaxy S10 Lite Super AMOLED Plus, 2400x1080, 6.7" | Xiaomi Mi Note 10 Pro AMOLED, 2340x1080, 6.5" | |
|---|---|---|---|---|---|---|
| Screen | -18% | -19% | 8% | -71% | -132% | |
| Brightness middle (cd/m²) | 688 | 604 -12% | 679 -1% | 554 -19% | 622 -10% | 579 -16% |
| Brightness (cd/m²) | 659 | 580 -12% | 671 2% | 550 -17% | 630 -4% | 576 -13% |
| Brightness Distribution (%) | 92 | 91 -1% | 93 1% | 94 2% | 96 4% | 89 -3% |
| Black Level * (cd/m²) | 0.28 | 0.44 -57% | 0.68 -143% | |||
| Contrast (:1) | 2457 | 1373 -44% | 999 -59% | |||
| Colorchecker dE 2000 * | 1 | 1.2 -20% | 0.8 20% | 0.8 20% | 2.7 -170% | 4.61 -361% |
| Colorchecker dE 2000 max. * | 2.2 | 2.3 -5% | 2.4 -9% | 1.4 36% | 5.9 -168% | 7.72 -251% |
| Greyscale dE 2000 * | 1.7 | 1.6 6% | 1.1 35% | 1.3 24% | 3 -76% | 4.2 -147% |
| Gamma | 2.25 98% | 2.25 98% | 2.24 98% | 2.22 99% | 2.09 105% | 2.244 98% |
| CCT | 6790 96% | 6688 97% | 6610 98% | 6213 105% | 6246 104% | 7201 90% |
* ... menor é melhor
Cintilação da tela / PWM (modulação por largura de pulso)
| Tela tremeluzindo / PWM não detectado | 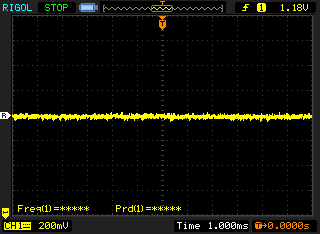 | ||
[pwm_comparison] Em comparação: 52 % de todos os dispositivos testados não usam PWM para escurecer a tela. Se PWM foi detectado, uma média de 7744 (mínimo: 5 - máximo: 343500) Hz foi medida. | |||
Exibir tempos de resposta
| ↔ Tempo de resposta preto para branco | ||
|---|---|---|
| 21.2 ms ... ascensão ↗ e queda ↘ combinadas | ↗ 6 ms ascensão | 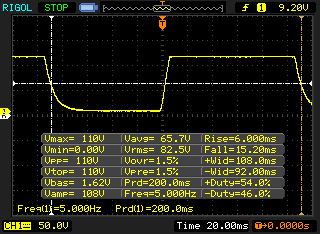 |
| ↘ 15.2 ms queda | ||
| A tela mostra boas taxas de resposta em nossos testes, mas pode ser muito lenta para jogadores competitivos. Em comparação, todos os dispositivos testados variam de 0.1 (mínimo) a 240 (máximo) ms. » 48 % de todos os dispositivos são melhores. Isso significa que o tempo de resposta medido é semelhante à média de todos os dispositivos testados (19.8 ms). | ||
| ↔ Tempo de resposta 50% cinza a 80% cinza | ||
| 36.8 ms ... ascensão ↗ e queda ↘ combinadas | ↗ 9.2 ms ascensão | 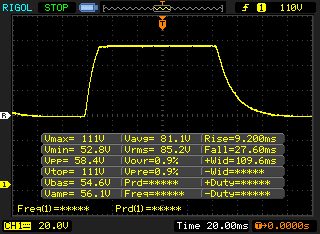 |
| ↘ 27.6 ms queda | ||
| A tela mostra taxas de resposta lentas em nossos testes e será insatisfatória para os jogadores. Em comparação, todos os dispositivos testados variam de 0.165 (mínimo) a 636 (máximo) ms. » 53 % de todos os dispositivos são melhores. Isso significa que o tempo de resposta medido é pior que a média de todos os dispositivos testados (30.9 ms). | ||
| AnTuTu v8 - Total Score (classificar por valor) | |
| Apple iPhone SE 2020 | |
| Google Pixel 4 | |
| Samsung Galaxy S10 Lite | |
| Apple iPhone 11 Pro | |
| Média Apple A13 Bionic (489463 - 534558, n=3) | |
| Basemark GPU 1.2 | |
| 1920x1080 Metal Medium Offscreen (classificar por valor) | |
| Apple iPhone SE 2020 | |
| Média Apple A13 Bionic (136.6 - 153, n=2) | |
| Média da turma Smartphone (n=1últimos 2 anos) | |
| Metal Medium Native (classificar por valor) | |
| Apple iPhone SE 2020 | |
| Média Apple A13 Bionic (94.9 - 211, n=2) | |
| Média da turma Smartphone (n=1últimos 2 anos) | |
| Jetstream 2 - 2.0 Total | |
| Média da turma Smartphone (63.9 - 423, n=116, últimos 2 anos) | |
| Apple iPhone SE 2020 (Safari Mobile 13.1) | |
| Média Apple A13 Bionic (128.5 - 142.2, n=5) | |
| Apple iPhone 11 (Safari Mobile 13.0) | |
| Samsung Galaxy S10 Lite (Chrome 80) | |
| Google Pixel 4 (Chrome 78) | |
| JetStream 1.1 - 1.1 Total | |
| Apple iPhone 11 (Safari Mobile 13.0) | |
| Média Apple A13 Bionic (279 - 302, n=5) | |
| Apple iPhone SE 2020 (Safari Mobile 13.1) | |
| Apple iPhone 8 | |
| Samsung Galaxy S10 Lite (Chrome 80) | |
| Google Pixel 4 (Chrome 78) | |
| Speedometer 2.0 - Result 2.0 | |
| Média da turma Smartphone (49.3 - 733, n=76, últimos 2 anos) | |
| Média Apple A13 Bionic (153 - 171, n=5) | |
| Apple iPhone SE 2020 (Safari Mobile 13.1) | |
| Apple iPhone 11 (Safari Mobile 13.0) | |
| Samsung Galaxy S10 Lite (Chrome 80) | |
| Google Pixel 4 (Chrome 78) | |
| WebXPRT 3 - Overall | |
| Apple iPhone 11 (Safari Mobile 13.0) | |
| Média Apple A13 Bionic (146 - 202, n=5) | |
| Média da turma Smartphone (104 - 380, n=12, últimos 2 anos) | |
| Apple iPhone SE 2020 (Safari Mobile 13.1) | |
| Samsung Galaxy S10 Lite (Chrome 80) | |
| Google Pixel 4 (Chrome 78) | |
| Octane V2 - Total Score | |
| Média da turma Smartphone (2800 - 126661, n=140, últimos 2 anos) | |
| Apple iPhone SE 2020 (Safari Mobile 13.1) | |
| Apple iPhone 11 (Safari Mobile 13.0) | |
| Média Apple A13 Bionic (47288 - 49388, n=5) | |
| Apple iPhone 8 | |
| Samsung Galaxy S10 Lite (Chrome 80) | |
| Google Pixel 4 (Chrome 78) | |
| Mozilla Kraken 1.1 - Total | |
| Samsung Galaxy S10 Lite (Chrome 80) | |
| Google Pixel 4 (Chrome 78) | |
| Média da turma Smartphone (257 - 28190, n=119, últimos 2 anos) | |
| Apple iPhone 8 | |
| Apple iPhone 11 (Safari Mobile 13.0) | |
| Média Apple A13 Bionic (545 - 573, n=5) | |
| Apple iPhone SE 2020 (Safari Mobile 13.1) | |
* ... menor é melhor
(±) A temperatura máxima no lado superior é 40.5 °C / 105 F, em comparação com a média de 35.3 °C / 96 F , variando de 21.9 a 247 °C para a classe Smartphone.
(±) A parte inferior aquece até um máximo de 41.4 °C / 107 F, em comparação com a média de 34 °C / 93 F
(±) Em uso inativo, a temperatura média para o lado superior é 32 °C / 90 F, em comparação com a média do dispositivo de 33 °C / ### class_avg_f### F.
Apple iPhone SE 2020 análise de áudio
(+) | os alto-falantes podem tocar relativamente alto (###valor### dB)
Graves 100 - 315Hz
(-) | quase nenhum baixo - em média 22% menor que a mediana
(±) | a linearidade dos graves é média (9.2% delta para a frequência anterior)
Médios 400 - 2.000 Hz
(±) | médios reduzidos - em média 6.3% menor que a mediana
(+) | médios são lineares (5.6% delta para frequência anterior)
Altos 2 - 16 kHz
(±) | máximos mais altos - em média 8.4% maior que a mediana
(+) | os máximos são lineares (4.2% delta da frequência anterior)
Geral 100 - 16.000 Hz
(±) | a linearidade do som geral é média (22.6% diferença em relação à mediana)
Comparado com a mesma classe
» 49% de todos os dispositivos testados nesta classe foram melhores, 6% semelhantes, 44% piores
» O melhor teve um delta de 11%, a média foi 34%, o pior foi 134%
Comparado com todos os dispositivos testados
» 67% de todos os dispositivos testados foram melhores, 6% semelhantes, 28% piores
» O melhor teve um delta de 4%, a média foi 23%, o pior foi 134%
Apple iPhone 8 análise de áudio
(±) | o volume do alto-falante é médio, mas bom (###valor### dB)
Graves 100 - 315Hz
(±) | graves reduzidos - em média 14.6% menor que a mediana
(±) | a linearidade dos graves é média (9.2% delta para a frequência anterior)
Médios 400 - 2.000 Hz
(+) | médios equilibrados - apenas 4.3% longe da mediana
(+) | médios são lineares (4.2% delta para frequência anterior)
Altos 2 - 16 kHz
(±) | máximos mais altos - em média 5.1% maior que a mediana
(+) | os máximos são lineares (4.7% delta da frequência anterior)
Geral 100 - 16.000 Hz
(±) | a linearidade do som geral é média (18.2% diferença em relação à mediana)
Comparado com a mesma classe
» 18% de todos os dispositivos testados nesta classe foram melhores, 8% semelhantes, 73% piores
» O melhor teve um delta de 11%, a média foi 34%, o pior foi 134%
Comparado com todos os dispositivos testados
» 39% de todos os dispositivos testados foram melhores, 8% semelhantes, 53% piores
» O melhor teve um delta de 4%, a média foi 23%, o pior foi 134%
| desligado | |
| Ocioso | |
| Carga |
|
Key:
min: | |
| Apple iPhone SE 2020 1822 mAh | Google Pixel 4 2800 mAh | Apple iPhone 11 3110 mAh | Apple iPhone 8 1821 mAh | Samsung Galaxy S10 Lite 4500 mAh | Média Apple A13 Bionic | Média da turma Smartphone | |
|---|---|---|---|---|---|---|---|
| Power Consumption | -70% | -63% | -27% | -42% | -92% | -92% | |
| Idle Minimum * (Watt) | 0.44 | 1.01 -130% | 0.56 -27% | 0.54 -23% | 0.58 -32% | 0.76 ? -73% | 0.879 ? -100% |
| Idle Average * (Watt) | 1.56 | 1.63 -4% | 2.99 -92% | 1.63 -4% | 1.55 1% | 3.39 ? -117% | 1.474 ? 6% |
| Idle Maximum * (Watt) | 1.63 | 1.69 -4% | 3.02 -85% | 1.67 -2% | 1.64 -1% | 3.44 ? -111% | 1.663 ? -2% |
| Load Average * (Watt) | 2.32 | 4.67 -101% | 4.17 -80% | 2.74 -18% | 4.29 -85% | 4.66 ? -101% | 6.75 ? -191% |
| Load Maximum * (Watt) | 4.12 | 8.78 -113% | 5.44 -32% | 7.78 -89% | 8.03 -95% | 6.42 ? -56% | 11.2 ? -172% |
* ... menor é melhor
| Apple iPhone SE 2020 1822 mAh | Google Pixel 4 2800 mAh | Apple iPhone 11 3110 mAh | Apple iPhone 8 1821 mAh | Samsung Galaxy S10 Lite 4500 mAh | Xiaomi Mi Note 10 Pro 5260 mAh | |
|---|---|---|---|---|---|---|
| Duração da bateria | -16% | 56% | 3% | 44% | 59% | |
| Reader / Idle (h) | 32.3 | 16.8 -48% | 46.1 43% | 27.2 -16% | 41.7 29% | |
| H.264 (h) | 11.4 | 10.3 -10% | 19.1 68% | 11.6 2% | 19.7 73% | |
| WiFi v1.3 (h) | 11.6 | 7.7 -34% | 14.4 24% | 9.8 -16% | 13.7 18% | 18.5 59% |
| Load (h) | 2.4 | 3.1 29% | 4.5 88% | 3.4 42% | 3.7 54% |
Pro
Contra
Veredicto - A atualização do iPhone 8 foi um sucesso, mas não para todos
Com o iPhone SE, a Apple lançou um atraente smartphone que brilha com um processador rápido, uma ótima tela, Wi-Fi rápido e um longo período de atualização. Além disso, é à prova d'água e compatível com o carregamento sem fio.
O iPhone SE (2020) é atualmente o bilhete mais barato para o universo Apple.
As maiores fraquezas são a má relação tela/corpo e a tela menor. No entanto, aqueles que vêm de um iPhone 6, 7, 8 ou da primeira geração SE provavelmente não acharão este último um grande problema. Este é exatamente o grupo alvo do iPhone SE2. Em contraste, é improvável que os usuários Android sejam influenciados devido aos inconvenientes acima mencionados e às poucas possibilidades em termos de câmera. Para este grupo, o iPhone 11 será provavelmente uma opção mais atrativa.
O iPhone SE (2020) é uma peça de tecnologia muito polida. Entretanto, o Google Pixel 4 é a única opção real para potenciais compradores que procuram um equivalente baseado em Android, que neste caso oferece uma melhor relação tela/corpo, um painel de 90-Hz, uma configuração de câmara dupla e pior duração da bateria a um preço idêntico.
Apple iPhone SE 2020
- 05/15/2020 v7 (old)
Daniel Schmidt
Price comparison
