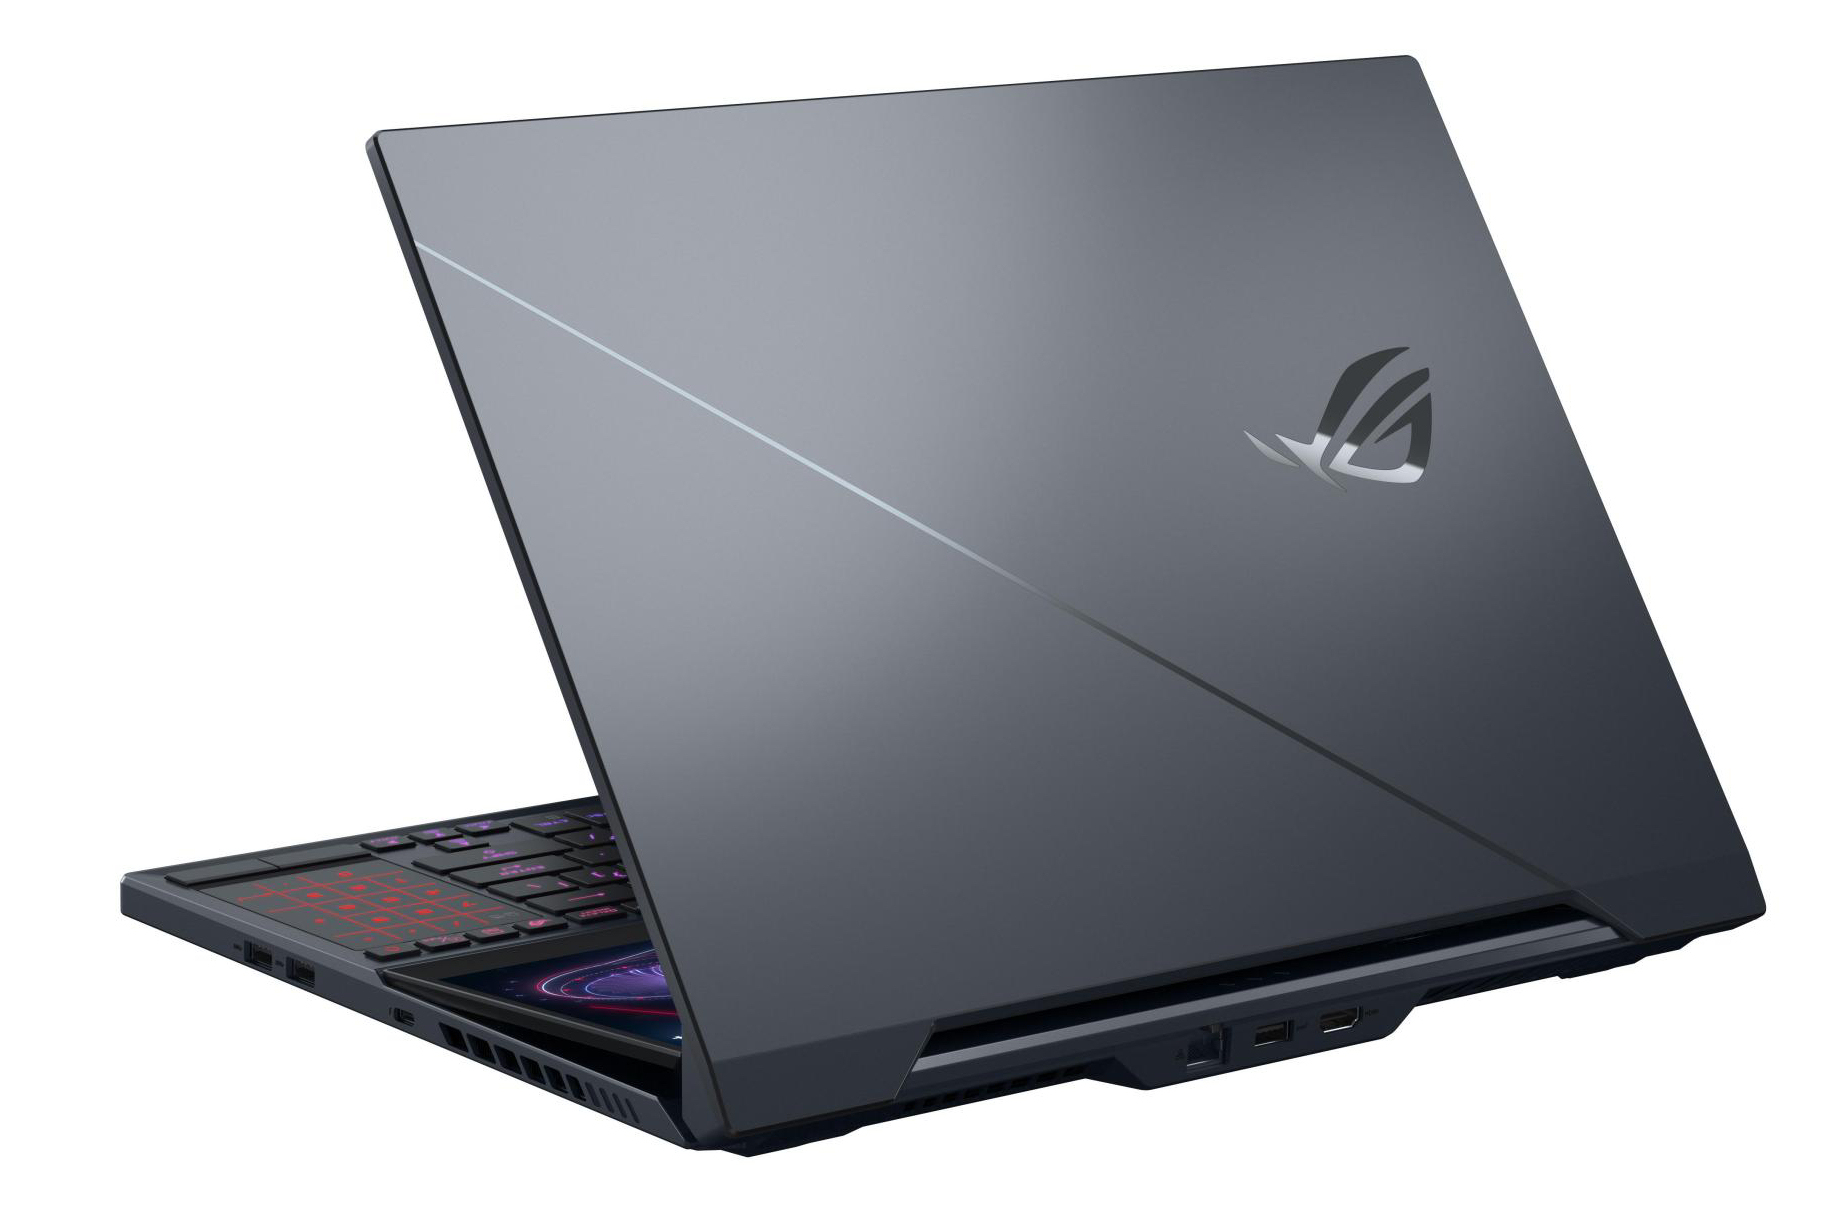
Breve Análise do Asus ROG Zephyrus Duo 15 GX550LXS: Portátil para jogos exclusivo com muito desempenho sob o capô
Avaliação | Data | Modelo | Peso | Altura | Size | Resolução | Preço |
|---|---|---|---|---|---|---|---|
| 84.5 % v7 (old) | 07/2020 | Asus ROG Zephyrus Duo 15 GX550LXS i9-10980HK, GeForce RTX 2080 Super Max-Q | 2.5 kg | 20 mm | 15.60" | 3840x2160 | |
v (old) | 04/2020 | Acer Predator Triton 500 PT515-52-70N3 i7-10750H, GeForce RTX 2080 Super Max-Q | 2.1 kg | 18 mm | 15.60" | 1920x1080 | |
| 82.8 % v7 (old) | 05/2020 | MSI GS66 Stealth 10SFS i9-10980HK, GeForce RTX 2070 Super Max-Q | 2.2 kg | 20 mm | 15.60" | 1920x1080 | |
| 85.8 % v7 (old) | 05/2020 | Gigabyte Aero 15 OLED XB-8DE51B0SP i7-10875H, GeForce RTX 2070 Super Max-Q | 2.2 kg | 20 mm | 15.60" | 3840x2160 |
| |||||||||||||||||||||||||
iluminação: 90 %
iluminação com acumulador: 398 cd/m²
Contraste: 1421:1 (Preto: 0.28 cd/m²)
ΔE ColorChecker Calman: 1.53 | ∀{0.5-29.43 Ø4.72}
calibrated: 0.77
ΔE Greyscale Calman: 2.4 | ∀{0.09-98 Ø4.97}
100% sRGB (Argyll 1.6.3 3D)
100% AdobeRGB 1998 (Argyll 1.6.3 3D)
99.9% AdobeRGB 1998 (Argyll 3D)
100% sRGB (Argyll 3D)
87% Display P3 (Argyll 3D)
Gamma: 2.19
CCT: 6996 K
| Asus ROG Zephyrus Duo 15 GX550LXS AU Optronics B156ZAN03.1, IPS, 3840x2160, 15.6" | Acer Predator Triton 500 PT515-52-70N3 AUO B156HAN12.0 (AUO7A8C), IPS, 1920x1080, 15.6" | MSI GS66 Stealth 10SFS AUO B156HAN12.0 (AUO328E), IPS, 1920x1080, 15.6" | Gigabyte Aero 15 OLED XB-8DE51B0SP Samsung SDCA029, OLED, 3840x2160, 15.6" | |
|---|---|---|---|---|
| Display | -16% | -16% | 4% | |
| Display P3 Coverage (%) | 87 | 70.3 -19% | 69.5 -20% | 99.9 15% |
| sRGB Coverage (%) | 100 | 99.5 0% | 99.6 0% | 100 0% |
| AdobeRGB 1998 Coverage (%) | 99.9 | 72.2 -28% | 70.8 -29% | 98.2 -2% |
| Response Times | 66% | 68% | 95% | |
| Response Time Grey 50% / Grey 80% * (ms) | 56.4 ? | 14.4 ? 74% | 14 ? 75% | 2.2 ? 96% |
| Response Time Black / White * (ms) | 24.4 ? | 10.4 ? 57% | 9.6 ? 61% | 1.8 ? 93% |
| PWM Frequency (Hz) | 60 ? | |||
| Screen | -48% | -31% | -30% | |
| Brightness middle (cd/m²) | 398 | 320 -20% | 316 -21% | 385 -3% |
| Brightness (cd/m²) | 385 | 318 -17% | 311 -19% | 390 1% |
| Brightness Distribution (%) | 90 | 88 -2% | 92 2% | 93 3% |
| Black Level * (cd/m²) | 0.28 | 0.24 14% | 0.21 25% | |
| Contrast (:1) | 1421 | 1333 -6% | 1505 6% | |
| Colorchecker dE 2000 * | 1.53 | 4.03 -163% | 3.03 -98% | 2.46 -61% |
| Colorchecker dE 2000 max. * | 3.69 | 8.43 -128% | 7.32 -98% | 4.01 -9% |
| Colorchecker dE 2000 calibrated * | 0.77 | 0.98 -27% | 1.1 -43% | 2.6 -238% |
| Greyscale dE 2000 * | 2.4 | 5.94 -148% | 3.9 -63% | 1.39 42% |
| Gamma | 2.19 100% | 2.42 91% | 2.42 91% | 2.31 95% |
| CCT | 6996 93% | 6751 96% | 7439 87% | 6395 102% |
| Color Space (Percent of AdobeRGB 1998) (%) | 100 | 66 -34% | 65 -35% | 98 -2% |
| Color Space (Percent of sRGB) (%) | 100 | 99 -1% | 100 0% | 100 0% |
| Média Total (Programa/Configurações) | 1% /
-28% | 7% /
-16% | 23% /
-5% |
* ... menor é melhor
Exibir tempos de resposta
| ↔ Tempo de resposta preto para branco | ||
|---|---|---|
| 24.4 ms ... ascensão ↗ e queda ↘ combinadas | ↗ 10 ms ascensão | 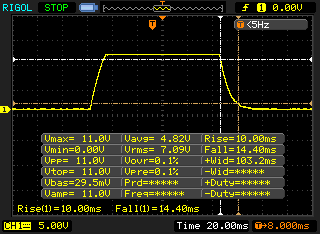 |
| ↘ 14.4 ms queda | ||
| A tela mostra boas taxas de resposta em nossos testes, mas pode ser muito lenta para jogadores competitivos. Em comparação, todos os dispositivos testados variam de 0.1 (mínimo) a 240 (máximo) ms. » 57 % de todos os dispositivos são melhores. Isso significa que o tempo de resposta medido é pior que a média de todos os dispositivos testados (19.8 ms). | ||
| ↔ Tempo de resposta 50% cinza a 80% cinza | ||
| 56.4 ms ... ascensão ↗ e queda ↘ combinadas | ↗ 26.4 ms ascensão | 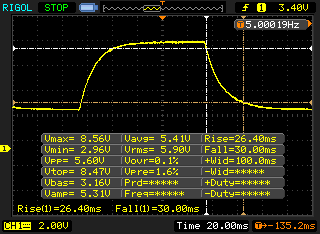 |
| ↘ 30 ms queda | ||
| A tela mostra taxas de resposta lentas em nossos testes e será insatisfatória para os jogadores. Em comparação, todos os dispositivos testados variam de 0.165 (mínimo) a 636 (máximo) ms. » 93 % de todos os dispositivos são melhores. Isso significa que o tempo de resposta medido é pior que a média de todos os dispositivos testados (31 ms). | ||
Cintilação da tela / PWM (modulação por largura de pulso)
| Tela tremeluzindo / PWM não detectado | 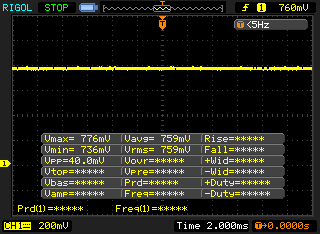 | ||
[pwm_comparison] Em comparação: 52 % de todos os dispositivos testados não usam PWM para escurecer a tela. Se PWM foi detectado, uma média de 7763 (mínimo: 5 - máximo: 343500) Hz foi medida. | |||
| Cinebench R15 | |
| CPU Single 64Bit | |
| Média da turma Gaming (188.8 - 343, n=109, últimos 2 anos) | |
| Asus ROG Zephyrus Duo 15 GX550LXS (Turbo) | |
| Gigabyte Aero 15 OLED XB-8DE51B0SP | |
| Média Intel Core i9-10980HK (198 - 219, n=15) | |
| Asus ROG Zephyrus Duo 15 GX550LXS | |
| MSI GS66 Stealth 10SFS | |
| Acer Predator Triton 500 PT515-52-70N3 | |
| CPU Multi 64Bit | |
| Média da turma Gaming (1578 - 6271, n=108, últimos 2 anos) | |
| Asus ROG Zephyrus Duo 15 GX550LXS (Turbo) | |
| Gigabyte Aero 15 OLED XB-8DE51B0SP | |
| Asus ROG Zephyrus Duo 15 GX550LXS | |
| Média Intel Core i9-10980HK (1606 - 1862, n=15) | |
| MSI GS66 Stealth 10SFS | |
| Acer Predator Triton 500 PT515-52-70N3 | |
| Blender - v2.79 BMW27 CPU | |
| Acer Predator Triton 500 PT515-52-70N3 | |
| MSI GS66 Stealth 10SFS | |
| Asus ROG Zephyrus Duo 15 GX550LXS (Turbo) | |
| Asus ROG Zephyrus Duo 15 GX550LXS | |
| Gigabyte Aero 15 OLED XB-8DE51B0SP | |
| Média Intel Core i9-10980HK (239 - 299, n=13) | |
| Média da turma Gaming (80 - 330, n=107, últimos 2 anos) | |
| 7-Zip 18.03 | |
| 7z b 4 -mmt1 | |
| Média da turma Gaming (4199 - 7436, n=108, últimos 2 anos) | |
| Gigabyte Aero 15 OLED XB-8DE51B0SP | |
| Média Intel Core i9-10980HK (5081 - 5542, n=13) | |
| Asus ROG Zephyrus Duo 15 GX550LXS | |
| MSI GS66 Stealth 10SFS | |
| Asus ROG Zephyrus Duo 15 GX550LXS (Turbo) | |
| Acer Predator Triton 500 PT515-52-70N3 | |
| 7z b 4 | |
| Média da turma Gaming (33491 - 148086, n=108, últimos 2 anos) | |
| Asus ROG Zephyrus Duo 15 GX550LXS | |
| Gigabyte Aero 15 OLED XB-8DE51B0SP | |
| Média Intel Core i9-10980HK (43786 - 49275, n=13) | |
| Asus ROG Zephyrus Duo 15 GX550LXS (Turbo) | |
| MSI GS66 Stealth 10SFS | |
| Acer Predator Triton 500 PT515-52-70N3 | |
| HWBOT x265 Benchmark v2.2 - 4k Preset | |
| Média da turma Gaming (11.5 - 44.3, n=108, últimos 2 anos) | |
| Gigabyte Aero 15 OLED XB-8DE51B0SP | |
| Média Intel Core i9-10980HK (12 - 14.6, n=13) | |
| Asus ROG Zephyrus Duo 15 GX550LXS | |
| Asus ROG Zephyrus Duo 15 GX550LXS (Turbo) | |
| MSI GS66 Stealth 10SFS | |
| Acer Predator Triton 500 PT515-52-70N3 | |
| LibreOffice - 20 Documents To PDF | |
| Asus ROG Zephyrus Duo 15 GX550LXS | |
| Média Intel Core i9-10980HK (44 - 89, n=13) | |
| MSI GS66 Stealth 10SFS | |
| Gigabyte Aero 15 OLED XB-8DE51B0SP | |
| Acer Predator Triton 500 PT515-52-70N3 | |
| Média da turma Gaming (19 - 88.8, n=108, últimos 2 anos) | |
| Asus ROG Zephyrus Duo 15 GX550LXS (Turbo) | |
| R Benchmark 2.5 - Overall mean | |
| Acer Predator Triton 500 PT515-52-70N3 | |
| Asus ROG Zephyrus Duo 15 GX550LXS (Turbo) | |
| MSI GS66 Stealth 10SFS | |
| Asus ROG Zephyrus Duo 15 GX550LXS | |
| Média Intel Core i9-10980HK (0.561 - 0.596, n=13) | |
| Gigabyte Aero 15 OLED XB-8DE51B0SP | |
| Média da turma Gaming (0.3439 - 0.759, n=109, últimos 2 anos) | |
* ... menor é melhor
| PCMark 8 Home Score Accelerated v2 | 3821 pontos | |
| PCMark 8 Creative Score Accelerated v2 | 4210 pontos | |
| PCMark 8 Work Score Accelerated v2 | 4762 pontos | |
| PCMark 10 Score | 5277 pontos | |
Ajuda | ||
| PCMark 8 | |
| Home Score Accelerated v2 | |
| Média da turma Gaming (n=1últimos 2 anos) | |
| Asus ROG Zephyrus Duo 15 GX550LXS | |
| Média Intel Core i9-10980HK, NVIDIA GeForce RTX 2080 Super Max-Q (n=1) | |
| Work Score Accelerated v2 | |
| Asus ROG Zephyrus Duo 15 GX550LXS | |
| Média Intel Core i9-10980HK, NVIDIA GeForce RTX 2080 Super Max-Q (n=1) | |
| Média da turma Gaming (n=1últimos 2 anos) | |
| DPC Latencies / LatencyMon - interrupt to process latency (max), Web, Youtube, Prime95 | |
| Acer Predator Triton 500 PT515-52-70N3 | |
| Asus ROG Zephyrus Duo 15 GX550LXS | |
| MSI GS66 Stealth 10SFS | |
| Gigabyte Aero 15 OLED XB-8DE51B0SP | |
* ... menor é melhor

| Asus ROG Zephyrus Duo 15 GX550LXS 2x Samsung PM981a MZVLB1T0HBLR (RAID 0) | Acer Predator Triton 500 PT515-52-70N3 Samsung SSD PM981a MZVLB512HBJQ | MSI GS66 Stealth 10SFS Samsung SSD PM981 MZVLB1T0HALR | Gigabyte Aero 15 OLED XB-8DE51B0SP Intel Optane Memory H10 with Solid State Storage 32GB + 512GB HBRPEKNX0202A(L/H) | Média 2x Samsung PM981a MZVLB1T0HBLR (RAID 0) | |
|---|---|---|---|---|---|
| CrystalDiskMark 5.2 / 6 | -8% | -13% | -4% | 23% | |
| Write 4K (MB/s) | 127.6 | 131.7 3% | 131.3 3% | 127.4 0% | 175.9 ? 38% |
| Read 4K (MB/s) | 48.4 | 47.34 -2% | 45.84 -5% | 147.5 205% | 49.7 ? 3% |
| Write Seq (MB/s) | 2958 | 2884 -3% | 2370 -20% | 485.9 -84% | 4078 ? 38% |
| Read Seq (MB/s) | 2984 | 2303 -23% | 1509 -49% | 1352 -55% | 3653 ? 22% |
| Write 4K Q32T1 (MB/s) | 472.7 | 423.9 -10% | 481.5 2% | 476.5 1% | 540 ? 14% |
| Read 4K Q32T1 (MB/s) | 529 | 487.7 -8% | 560 6% | 531 0% | 456 ? -14% |
| Write Seq Q32T1 (MB/s) | 3431 | 2822 -18% | 2392 -30% | 1061 -69% | 4457 ? 30% |
| Read Seq Q32T1 (MB/s) | 3536 | 3478 -2% | 3232 -9% | 2552 -28% | 5307 ? 50% |
| AS SSD | 2% | -1% | -36% | 9% | |
| Seq Read (MB/s) | 2981 | 2767 -7% | 1065 -64% | 1200 -60% | 3515 ? 18% |
| Seq Write (MB/s) | 2783 | 2613 -6% | 2360 -15% | 836 -70% | 2878 ? 3% |
| 4K Read (MB/s) | 43.98 | 47.55 8% | 48.09 9% | 65.8 50% | 48.4 ? 10% |
| 4K Write (MB/s) | 113.9 | 98.9 -13% | 110.7 -3% | 103.8 -9% | 165.6 ? 45% |
| 4K-64 Read (MB/s) | 1519 | 1205 -21% | 1635 8% | 789 -48% | 1419 ? -7% |
| 4K-64 Write (MB/s) | 1296 | 2007 55% | 1829 41% | 929 -28% | 1348 ? 4% |
| Access Time Read * (ms) | 0.062 | 0.065 -5% | 0.071 -15% | 0.103 -66% | 0.0455 ? 27% |
| Access Time Write * (ms) | 0.033 | 0.038 -15% | 0.034 -3% | 0.045 -36% | 0.04375 ? -33% |
| Score Read (Points) | 1861 | 1529 -18% | 1790 -4% | 975 -48% | 1818 ? -2% |
| Score Write (Points) | 1688 | 2367 40% | 2176 29% | 1117 -34% | 1801 ? 7% |
| Score Total (Points) | 4492 | 4677 4% | 4950 10% | 2594 -42% | 4521 ? 1% |
| Copy ISO MB/s (MB/s) | 2438 | 2919 ? 20% | |||
| Copy Program MB/s (MB/s) | 604 | 706 ? 17% | |||
| Copy Game MB/s (MB/s) | 1404 | 1560 ? 11% | |||
| Média Total (Programa/Configurações) | -3% /
-2% | -7% /
-6% | -20% /
-22% | 16% /
14% |
* ... menor é melhor
Continuous read performance: DiskSpd Read Loop, Queue Depth 8
| 3DMark 11 Performance | 23526 pontos | |
| 3DMark Cloud Gate Standard Score | 44534 pontos | |
| 3DMark Fire Strike Score | 17714 pontos | |
| 3DMark Time Spy Score | 7780 pontos | |
Ajuda | ||
| 3DMark 11 - 1280x720 Performance GPU | |
| Média da turma Gaming (21841 - 80022, n=106, últimos 2 anos) | |
| Asus ROG Zephyrus Duo 15 GX550LXS (Turbo) | |
| Acer Predator Triton 500 PT515-52-70N3 | |
| Média NVIDIA GeForce RTX 2080 Super Max-Q (26292 - 32995, n=10) | |
| Gigabyte Aero 15 OLED XB-8DE51B0SP | |
| Asus ROG Zephyrus Duo 15 GX550LXS | |
| MSI GS66 Stealth 10SFS | |
| 3DMark | |
| 1920x1080 Fire Strike Graphics | |
| Média da turma Gaming (12242 - 62849, n=118, últimos 2 anos) | |
| Asus ROG Zephyrus Duo 15 GX550LXS (Turbo) | |
| Acer Predator Triton 500 PT515-52-70N3 | |
| Média NVIDIA GeForce RTX 2080 Super Max-Q (19655 - 23649, n=10) | |
| Gigabyte Aero 15 OLED XB-8DE51B0SP | |
| Asus ROG Zephyrus Duo 15 GX550LXS | |
| MSI GS66 Stealth 10SFS | |
| 2560x1440 Time Spy Graphics | |
| Média da turma Gaming (5012 - 26212, n=118, últimos 2 anos) | |
| Asus ROG Zephyrus Duo 15 GX550LXS (Turbo) | |
| Acer Predator Triton 500 PT515-52-70N3 | |
| Média NVIDIA GeForce RTX 2080 Super Max-Q (7372 - 8979, n=11) | |
| Gigabyte Aero 15 OLED XB-8DE51B0SP | |
| Asus ROG Zephyrus Duo 15 GX550LXS | |
| MSI GS66 Stealth 10SFS | |
| The Witcher 3 - 1920x1080 Ultra Graphics & Postprocessing (HBAO+) | |
| Média da turma Gaming (95 - 240, n=7, últimos 2 anos) | |
| Asus ROG Zephyrus Duo 15 GX550LXS (Turbo) | |
| Média NVIDIA GeForce RTX 2080 Super Max-Q (74.3 - 96, n=11) | |
| Acer Predator Triton 500 PT515-52-70N3 | |
| Gigabyte Aero 15 OLED XB-8DE51B0SP | |
| Asus ROG Zephyrus Duo 15 GX550LXS | |
| MSI GS66 Stealth 10SFS | |
| BioShock Infinite - 1920x1080 Ultra Preset, DX11 (DDOF) | |
| Asus ROG Zephyrus Duo 15 GX550LXS (Turbo) | |
| Média NVIDIA GeForce RTX 2080 Super Max-Q (170.2 - 181.1, n=4) | |
| Asus ROG Zephyrus Duo 15 GX550LXS | |
| Doom Eternal - 1920x1080 Ultra Preset | |
| Asus ROG Zephyrus Duo 15 GX550LXS (Turbo) | |
| Média NVIDIA GeForce RTX 2080 Super Max-Q (140 - 177.7, n=8) | |
| Asus ROG Zephyrus Duo 15 GX550LXS | |
| Acer Predator Triton 500 PT515-52-70N3 | |
| MSI GS66 Stealth 10SFS | |
| Red Dead Redemption 2 - 1920x1080 Maximum Settings | |
| Asus ROG Zephyrus Duo 15 GX550LXS | |
| Acer Predator Triton 500 PT515-52-70N3 | |
| Média NVIDIA GeForce RTX 2080 Super Max-Q (40.6 - 45, n=5) | |
| Gigabyte Aero 15 OLED XB-8DE51B0SP | |
| Call of Duty Modern Warfare 2019 - 1920x1080 Maximum Settings AA:T2X Filmic SM | |
| Acer Predator Triton 500 PT515-52-70N3 | |
| Média NVIDIA GeForce RTX 2080 Super Max-Q (91.2 - 107, n=4) | |
| Asus ROG Zephyrus Duo 15 GX550LXS | |
| Far Cry 5 - 1920x1080 Ultra Preset AA:T | |
| Média da turma Gaming (70 - 151, n=8, últimos 2 anos) | |
| Asus ROG Zephyrus Duo 15 GX550LXS | |
| Média NVIDIA GeForce RTX 2080 Super Max-Q (91 - 110, n=4) | |
| Shadow of the Tomb Raider - 1920x1080 Highest Preset AA:T | |
| Média da turma Gaming (96 - 116, n=2, últimos 2 anos) | |
| Gigabyte Aero 15 OLED XB-8DE51B0SP | |
| Acer Predator Triton 500 PT515-52-70N3 | |
| Média NVIDIA GeForce RTX 2080 Super Max-Q (89 - 106, n=10) | |
| MSI GS66 Stealth 10SFS | |
| Asus ROG Zephyrus Duo 15 GX550LXS (Turbo) | |
| Asus ROG Zephyrus Duo 15 GX550LXS | |
| baixo | média | alto | ultra | QHD | 4K | |
|---|---|---|---|---|---|---|
| BioShock Infinite (2013) | 425.1 | 349.2 | 324.2 | 173.1 | ||
| The Witcher 3 (2015) | 330.5 | 237 | 143.4 | 75.8 | 53.5 | |
| Far Cry 5 (2018) | 143 | 115 | 108 | 102 | 77 | 42 |
| Shadow of the Tomb Raider (2018) | 103 | 95 | 93 | 89 | 67 | 36 |
| Total War: Three Kingdoms (2019) | 245.5 | 136.4 | 86.5 | 62.5 | 39.9 | 19.6 |
| Ghost Recon Breakpoint (2019) | 128 | 93 | 87 | 65 | 49 | 29 |
| Call of Duty Modern Warfare 2019 (2019) | 172.3 | 123.6 | 104.3 | 91.2 | 64.7 | 36.3 |
| Red Dead Redemption 2 (2019) | 131.4 | 99.7 | 68.3 | 44.9 | 36.2 | 23.5 |
| Doom Eternal (2020) | 205 | 168.3 | 154 | 152.1 | 116.7 | 64 |
| Gears Tactics (2020) | 210.4 | 161.2 | 110.6 | 89.7 | 57.9 | 30.3 |
| F1 2020 (2020) | 253 | 167 | 149 | 118 | 89 | 51 |
Barulho
| Ocioso |
| 33 / 34 / 35 dB |
| Carga |
| 48 / 49 dB |
 | ||
30 dB silencioso 40 dB(A) audível 50 dB(A) ruidosamente alto |
||
min: | ||
| Asus ROG Zephyrus Duo 15 GX550LXS i9-10980HK, GeForce RTX 2080 Super Max-Q | Acer Predator Triton 500 PT515-52-70N3 i7-10750H, GeForce RTX 2080 Super Max-Q | MSI GS66 Stealth 10SFS i9-10980HK, GeForce RTX 2070 Super Max-Q | Gigabyte Aero 15 OLED XB-8DE51B0SP i7-10875H, GeForce RTX 2070 Super Max-Q | Média NVIDIA GeForce RTX 2080 Super Max-Q | Média da turma Gaming | |
|---|---|---|---|---|---|---|
| Noise | 0% | -4% | -5% | 4% | 12% | |
| desligado / ambiente * (dB) | 30 | 30 -0% | 30 -0% | 30 -0% | 27.9 ? 7% | 24.1 ? 20% |
| Idle Minimum * (dB) | 33 | 30 9% | 32 3% | 34 -3% | 29.7 ? 10% | 25.9 ? 22% |
| Idle Average * (dB) | 34 | 33 3% | 34 -0% | 36 -6% | 30.8 ? 9% | 27.5 ? 19% |
| Idle Maximum * (dB) | 35 | 36 -3% | 39 -11% | 41 -17% | 35.4 ? -1% | 30 ? 14% |
| Load Average * (dB) | 48 | 50 -4% | 53 -10% | 48 -0% | 47.2 ? 2% | 43 ? 10% |
| Witcher 3 ultra * (dB) | 48 | 48 -0% | 48 -0% | 48 -0% | ||
| Load Maximum * (dB) | 49 | 50 -2% | 53 -8% | 54 -10% | 49.6 ? -1% | 54.2 ? -11% |
* ... menor é melhor
(±) A temperatura máxima no lado superior é 43 °C / 109 F, em comparação com a média de 40.4 °C / 105 F , variando de 21.2 a 68.8 °C para a classe Gaming.
(-) A parte inferior aquece até um máximo de 53 °C / 127 F, em comparação com a média de 43.2 °C / 110 F
(+) Em uso inativo, a temperatura média para o lado superior é 29.4 °C / 85 F, em comparação com a média do dispositivo de 33.9 °C / ### class_avg_f### F.
(-) Jogando The Witcher 3, a temperatura média para o lado superior é 40.1 °C / 104 F, em comparação com a média do dispositivo de 33.9 °C / ## #class_avg_f### F.
(-) Os apoios para as mãos e o touchpad podem ficar muito quentes ao toque, com um máximo de 44 °C / 111.2 F.
(-) A temperatura média da área do apoio para as mãos de dispositivos semelhantes foi 28.8 °C / 83.8 F (-15.2 °C / -27.4 F).
| Asus ROG Zephyrus Duo 15 GX550LXS i9-10980HK, GeForce RTX 2080 Super Max-Q | Acer Predator Triton 500 PT515-52-70N3 i7-10750H, GeForce RTX 2080 Super Max-Q | MSI GS66 Stealth 10SFS i9-10980HK, GeForce RTX 2070 Super Max-Q | Gigabyte Aero 15 OLED XB-8DE51B0SP i7-10875H, GeForce RTX 2070 Super Max-Q | Média NVIDIA GeForce RTX 2080 Super Max-Q | Média da turma Gaming | |
|---|---|---|---|---|---|---|
| Heat | 3% | -2% | -2% | -1% | -1% | |
| Maximum Upper Side * (°C) | 43 | 44 -2% | 53 -23% | 49 -14% | 47.9 ? -11% | 45.2 ? -5% |
| Maximum Bottom * (°C) | 53 | 50 6% | 55 -4% | 61 -15% | 51.9 ? 2% | 48.1 ? 9% |
| Idle Upper Side * (°C) | 32 | 29 9% | 28 12% | 27 16% | 30 ? 6% | 31 ? 3% |
| Idle Bottom * (°C) | 31 | 31 -0% | 29 6% | 29 6% | 31 ? -0% | 34.4 ? -11% |
* ... menor é melhor
Asus ROG Zephyrus Duo 15 GX550LXS análise de áudio
(+) | os alto-falantes podem tocar relativamente alto (###valor### dB)
Graves 100 - 315Hz
(-) | quase nenhum baixo - em média 15.2% menor que a mediana
(+) | o baixo é linear (6.2% delta para a frequência anterior)
Médios 400 - 2.000 Hz
(+) | médios equilibrados - apenas 3.8% longe da mediana
(+) | médios são lineares (5.2% delta para frequência anterior)
Altos 2 - 16 kHz
(±) | máximos mais altos - em média 5.6% maior que a mediana
(+) | os máximos são lineares (4.5% delta da frequência anterior)
Geral 100 - 16.000 Hz
(+) | o som geral é linear (14.5% diferença em relação à mediana)
Comparado com a mesma classe
» 27% de todos os dispositivos testados nesta classe foram melhores, 7% semelhantes, 66% piores
» O melhor teve um delta de 6%, a média foi 18%, o pior foi 132%
Comparado com todos os dispositivos testados
» 18% de todos os dispositivos testados foram melhores, 4% semelhantes, 78% piores
» O melhor teve um delta de 4%, a média foi 24%, o pior foi 134%
| desligado | |
| Ocioso | |
| Carga |
|
Key:
min: | |
| Asus ROG Zephyrus Duo 15 GX550LXS i9-10980HK, GeForce RTX 2080 Super Max-Q | Acer Predator Triton 500 PT515-52-70N3 i7-10750H, GeForce RTX 2080 Super Max-Q | MSI GS66 Stealth 10SFS i9-10980HK, GeForce RTX 2070 Super Max-Q | Gigabyte Aero 15 OLED XB-8DE51B0SP i7-10875H, GeForce RTX 2070 Super Max-Q | Média NVIDIA GeForce RTX 2080 Super Max-Q | Média da turma Gaming | |
|---|---|---|---|---|---|---|
| Power Consumption | 31% | 23% | 10% | 28% | 25% | |
| Idle Minimum * (Watt) | 23 | 11 52% | 13 43% | 18 22% | 12.9 ? 44% | 13.1 ? 43% |
| Idle Average * (Watt) | 30 | 15 50% | 16 47% | 21 30% | 17.3 ? 42% | 18.8 ? 37% |
| Idle Maximum * (Watt) | 39 | 25 36% | 27 31% | 38 3% | 26.9 ? 31% | 24.4 ? 37% |
| Load Average * (Watt) | 156 | 95 39% | 109 30% | 113 28% | 123.9 ? 21% | 108.6 ? 30% |
| Witcher 3 ultra * (Watt) | 152 | 140 8% | 155 -2% | 149 2% | ||
| Load Maximum * (Watt) | 208 | 211 -1% | 236 -13% | 256 -23% | 205 ? 1% | 255 ? -23% |
* ... menor é melhor
| Asus ROG Zephyrus Duo 15 GX550LXS i9-10980HK, GeForce RTX 2080 Super Max-Q, 90 Wh | Acer Predator Triton 500 PT515-52-70N3 i7-10750H, GeForce RTX 2080 Super Max-Q, 84 Wh | MSI GS66 Stealth 10SFS i9-10980HK, GeForce RTX 2070 Super Max-Q, 99.99 Wh | Gigabyte Aero 15 OLED XB-8DE51B0SP i7-10875H, GeForce RTX 2070 Super Max-Q, 94.2 Wh | Média da turma Gaming | |
|---|---|---|---|---|---|
| Duração da bateria | 38% | 48% | 79% | 56% | |
| Reader / Idle (h) | 8 | 8.3 4% | 8.4 5% | 8.6 8% | 8.71 ? 9% |
| H.264 (h) | 5.4 | 8.9 ? 65% | |||
| WiFi v1.3 (h) | 3.1 | 6.3 103% | 6.1 97% | 6.1 97% | 6.98 ? 125% |
| Load (h) | 1.2 | 1.3 8% | 1.7 42% | 2.8 133% | 1.51 ? 26% |
Pro
Contra
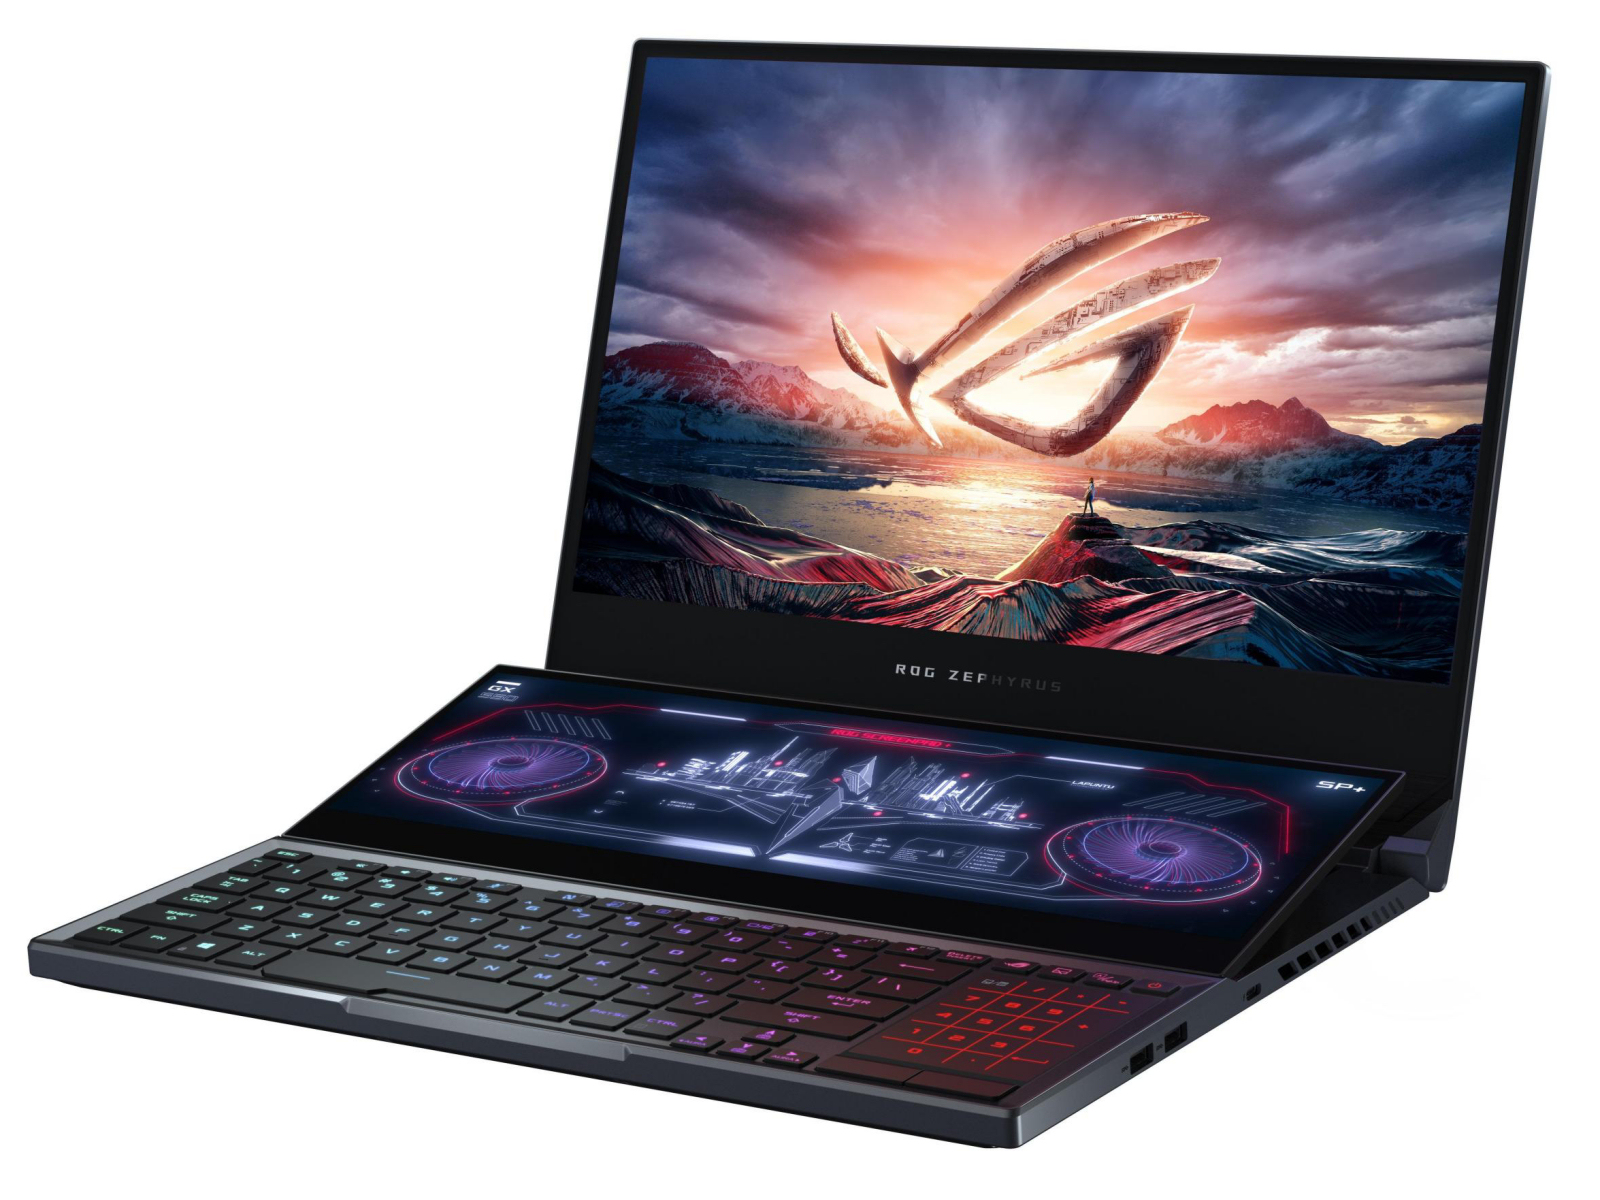
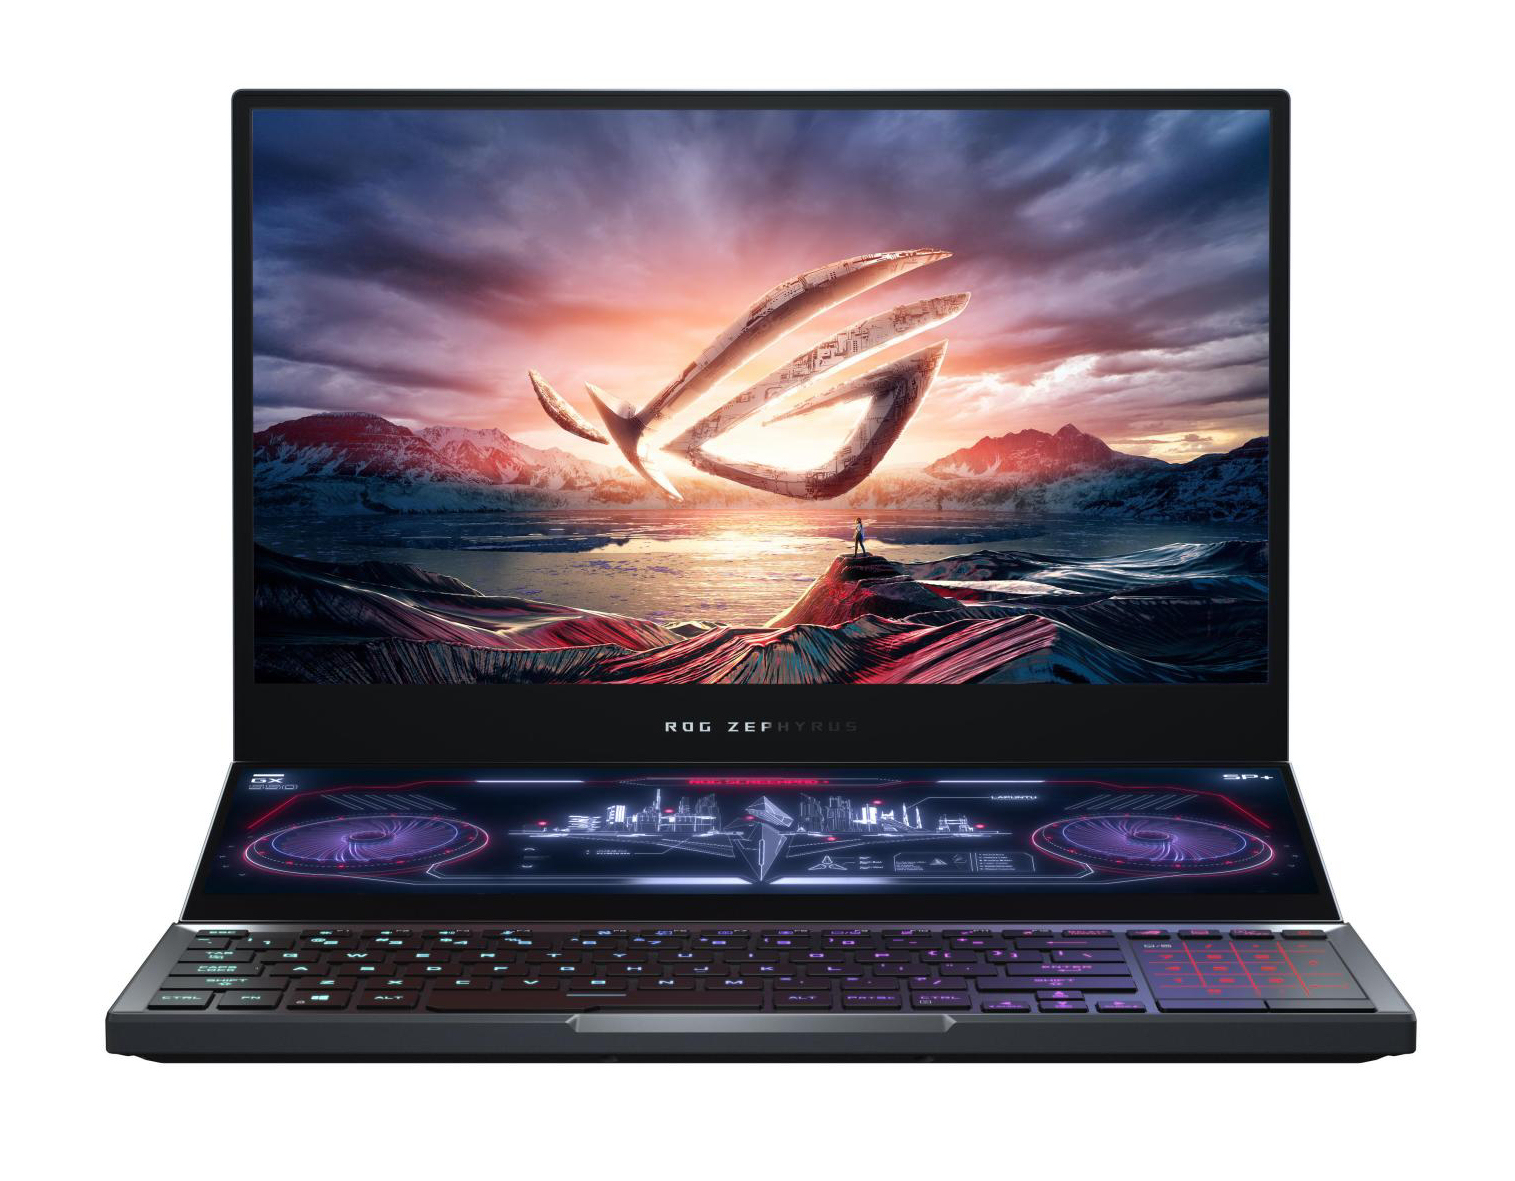
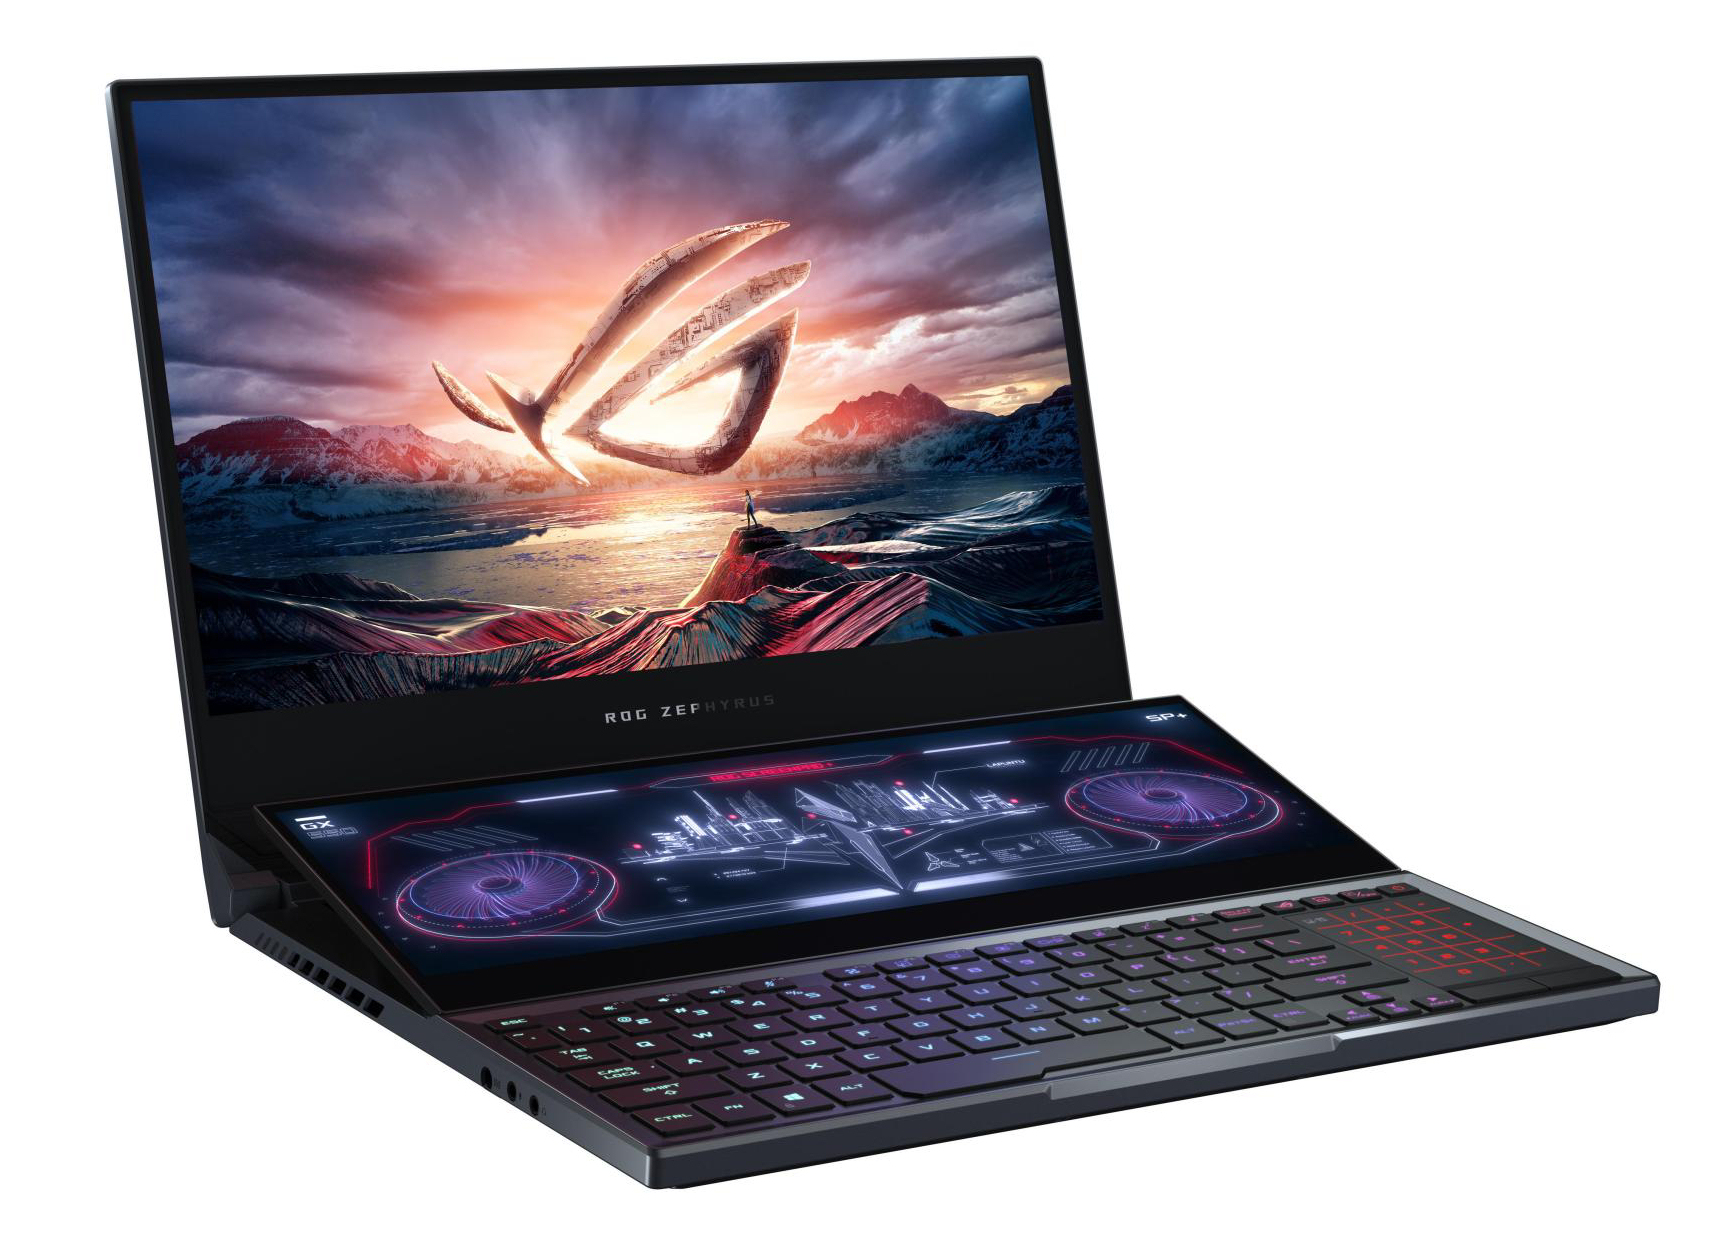
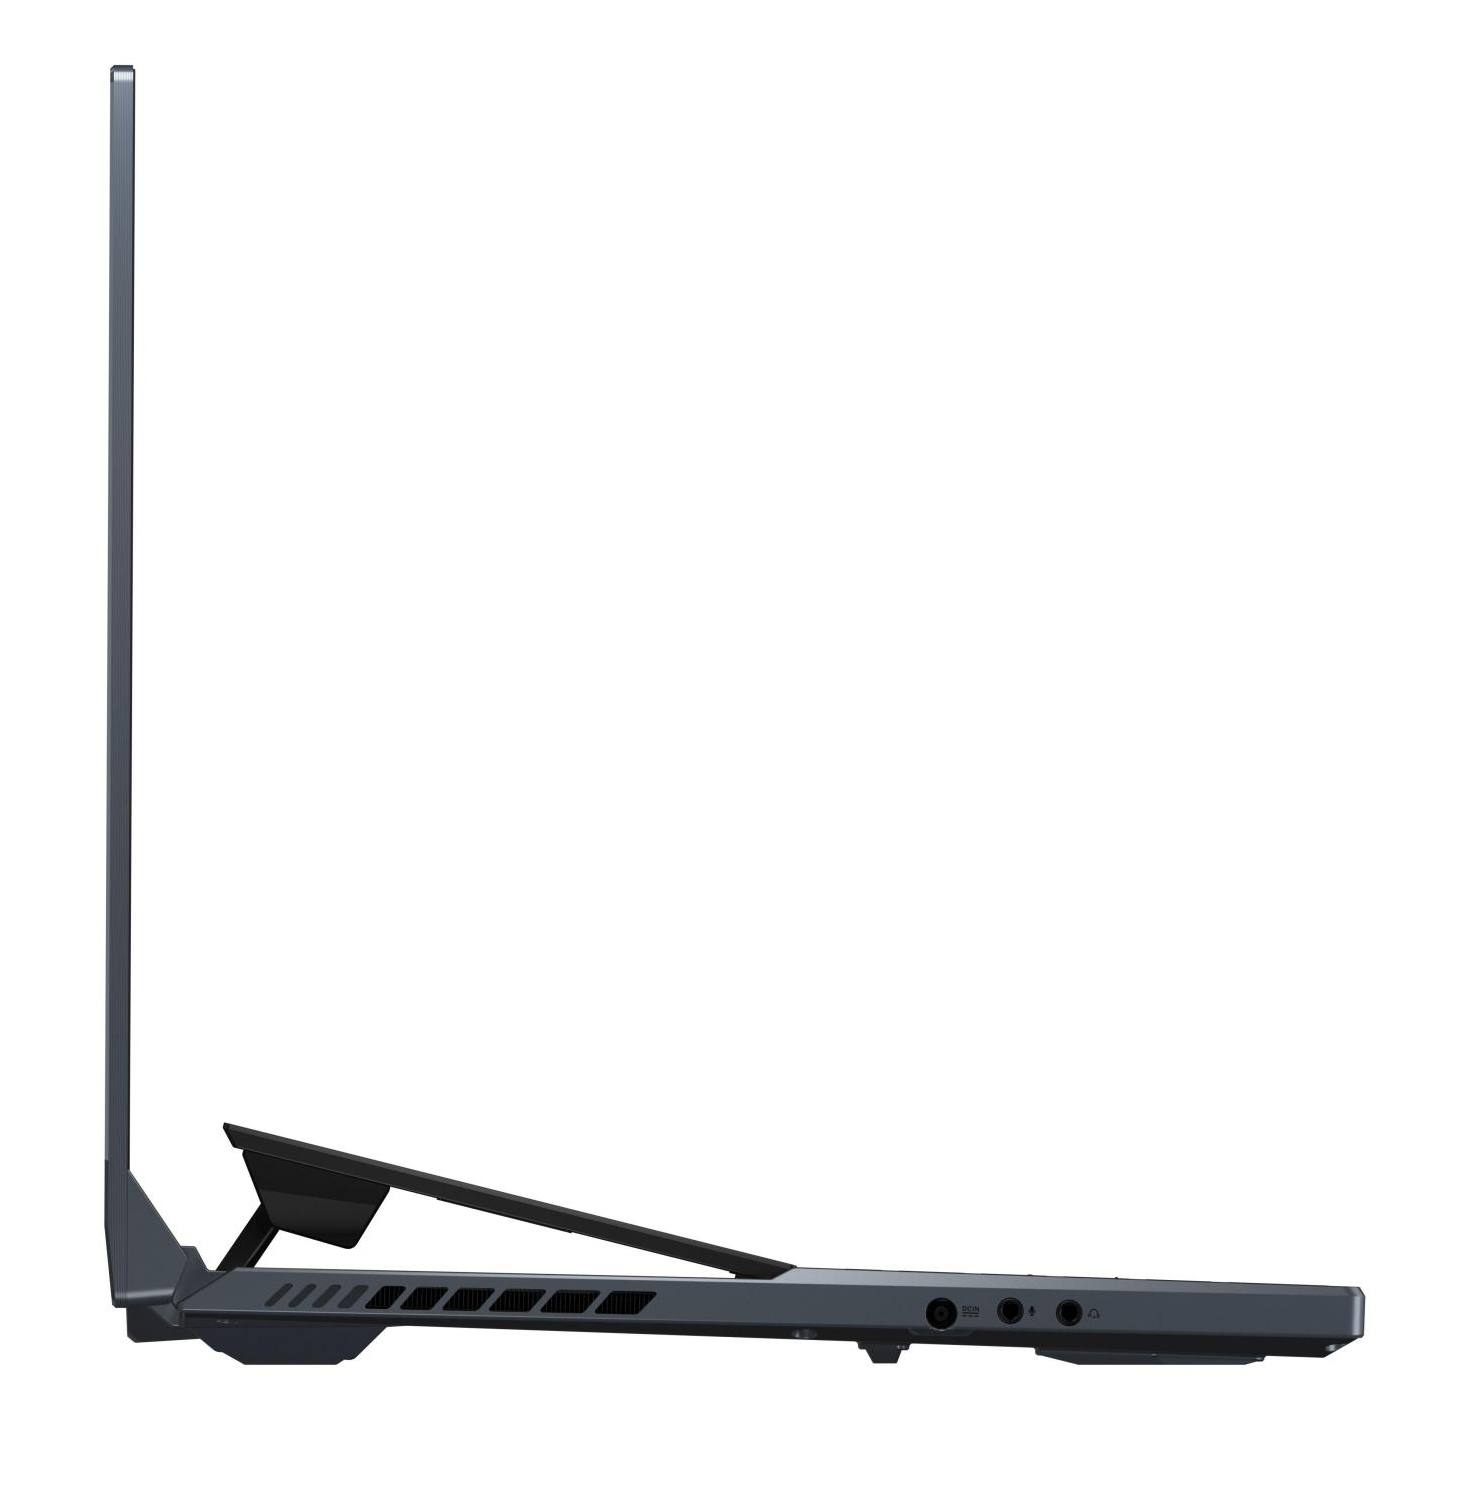
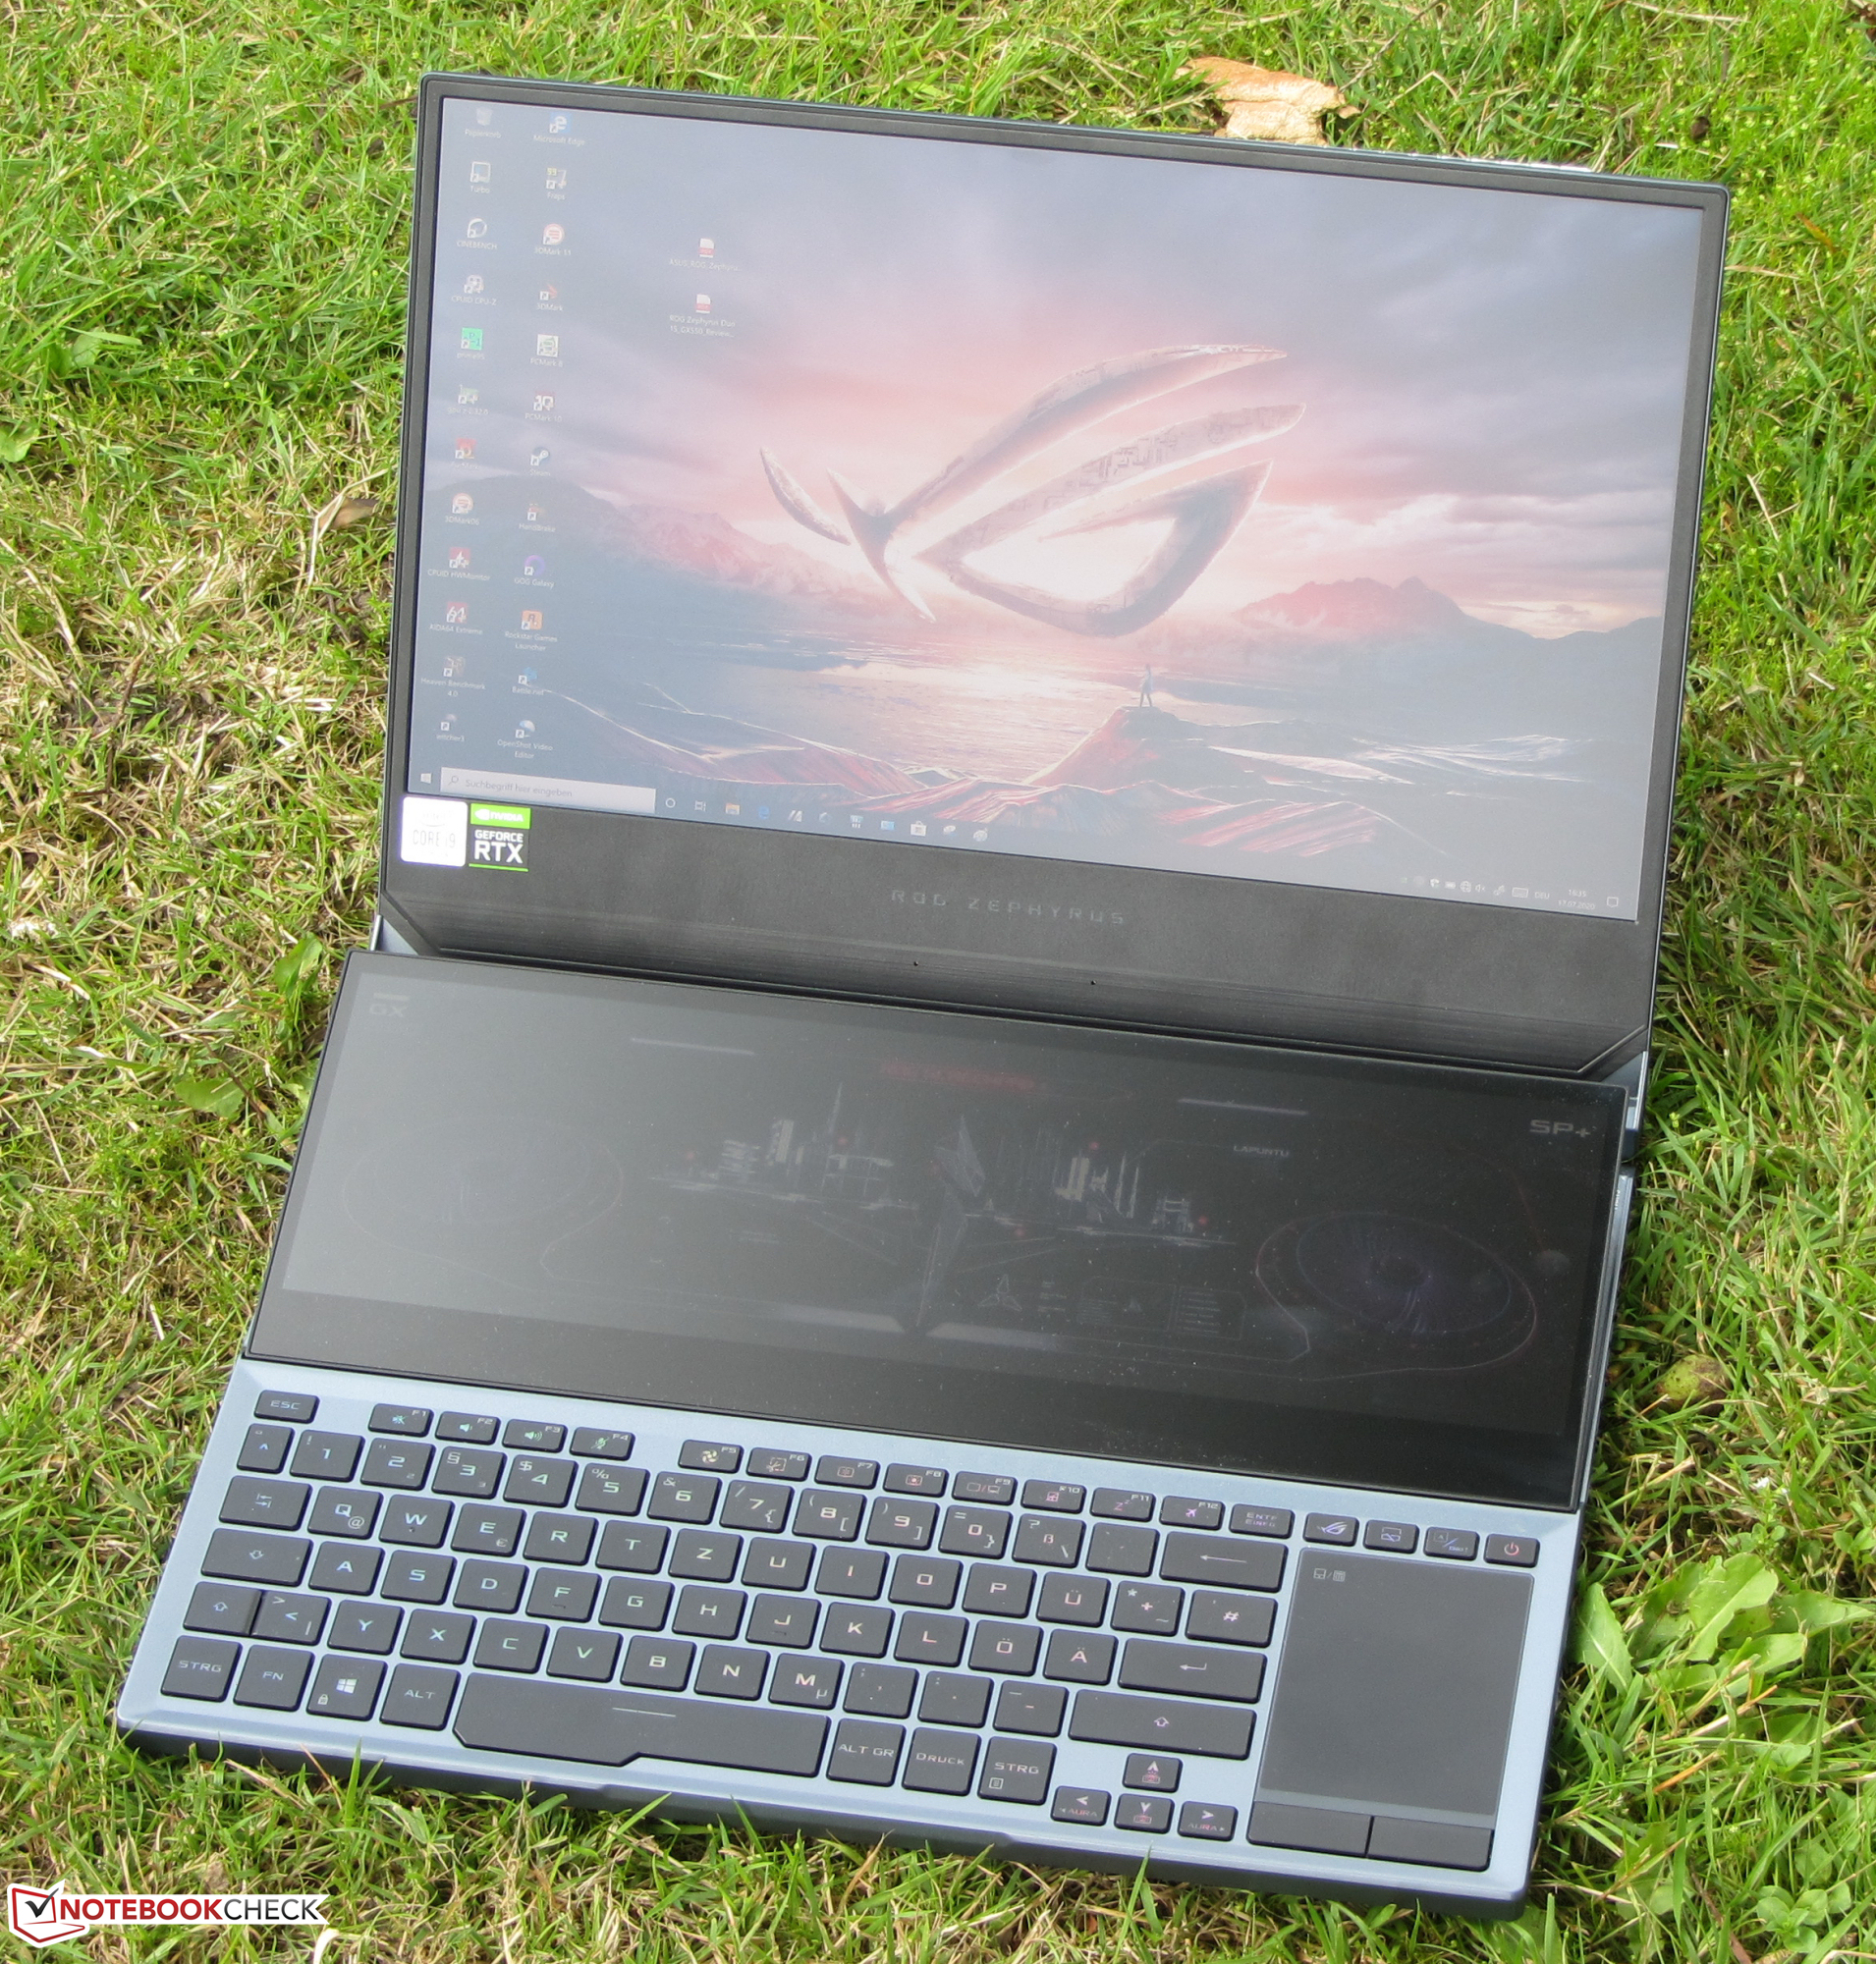
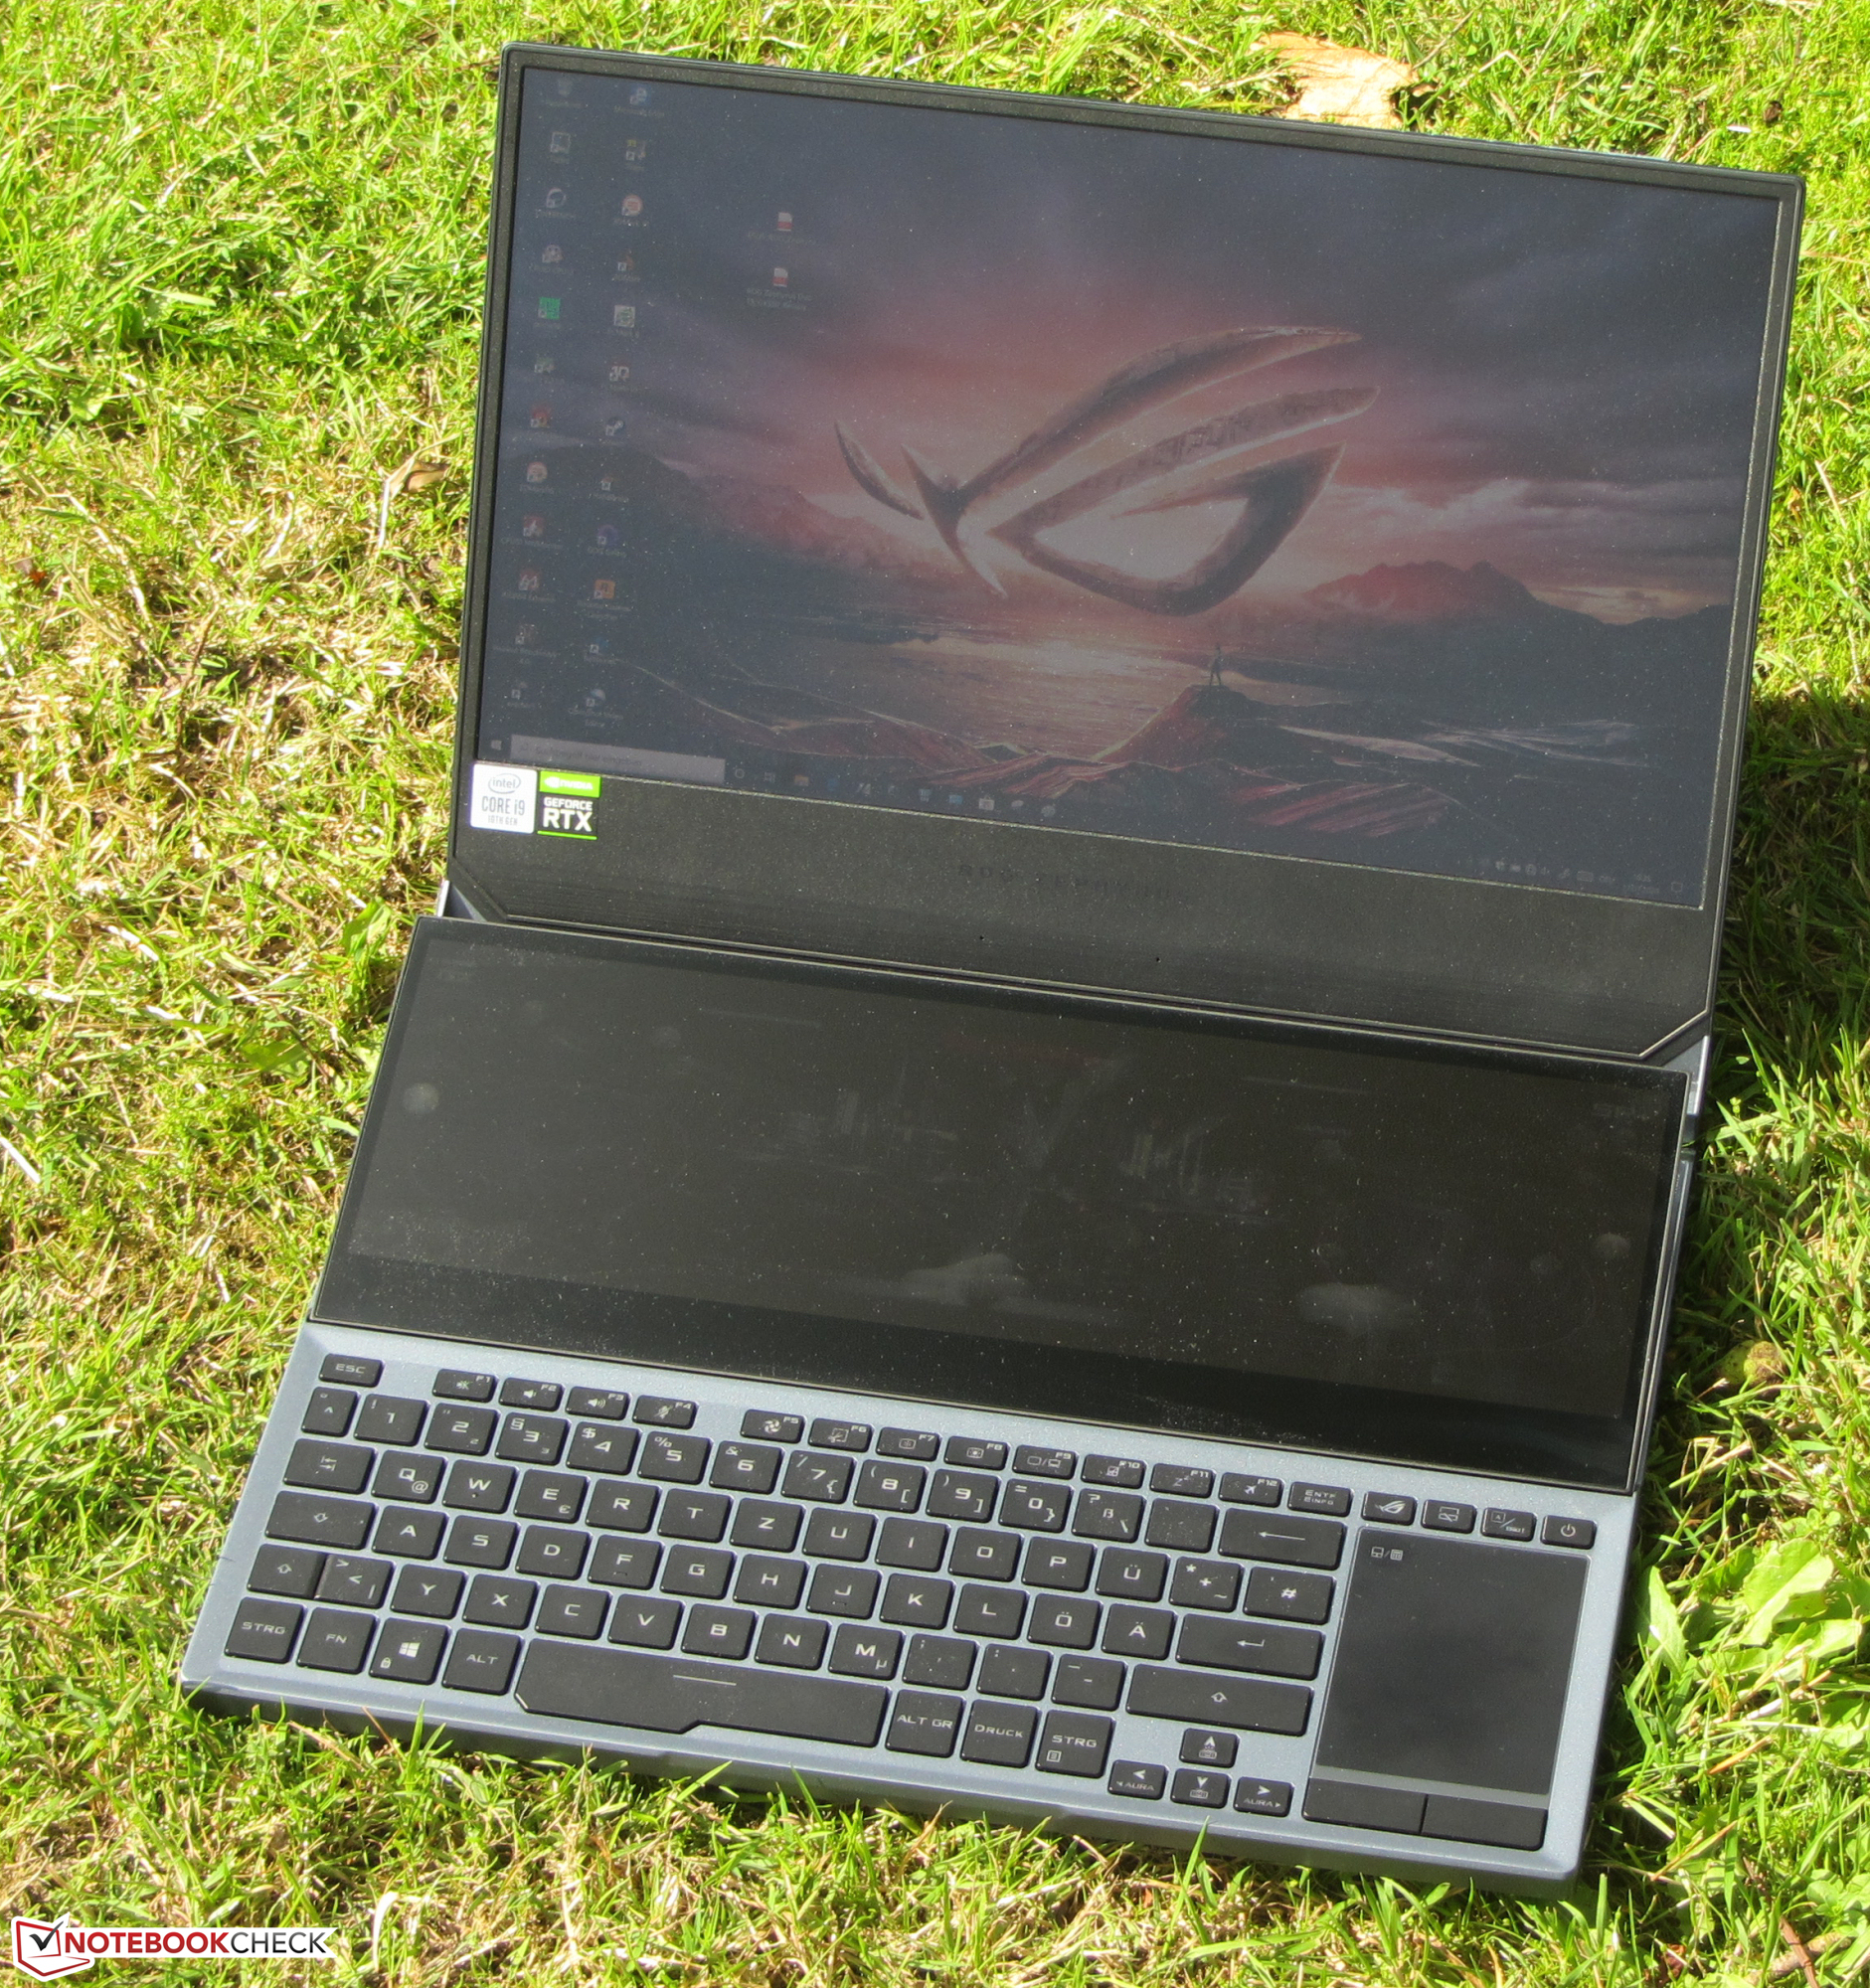
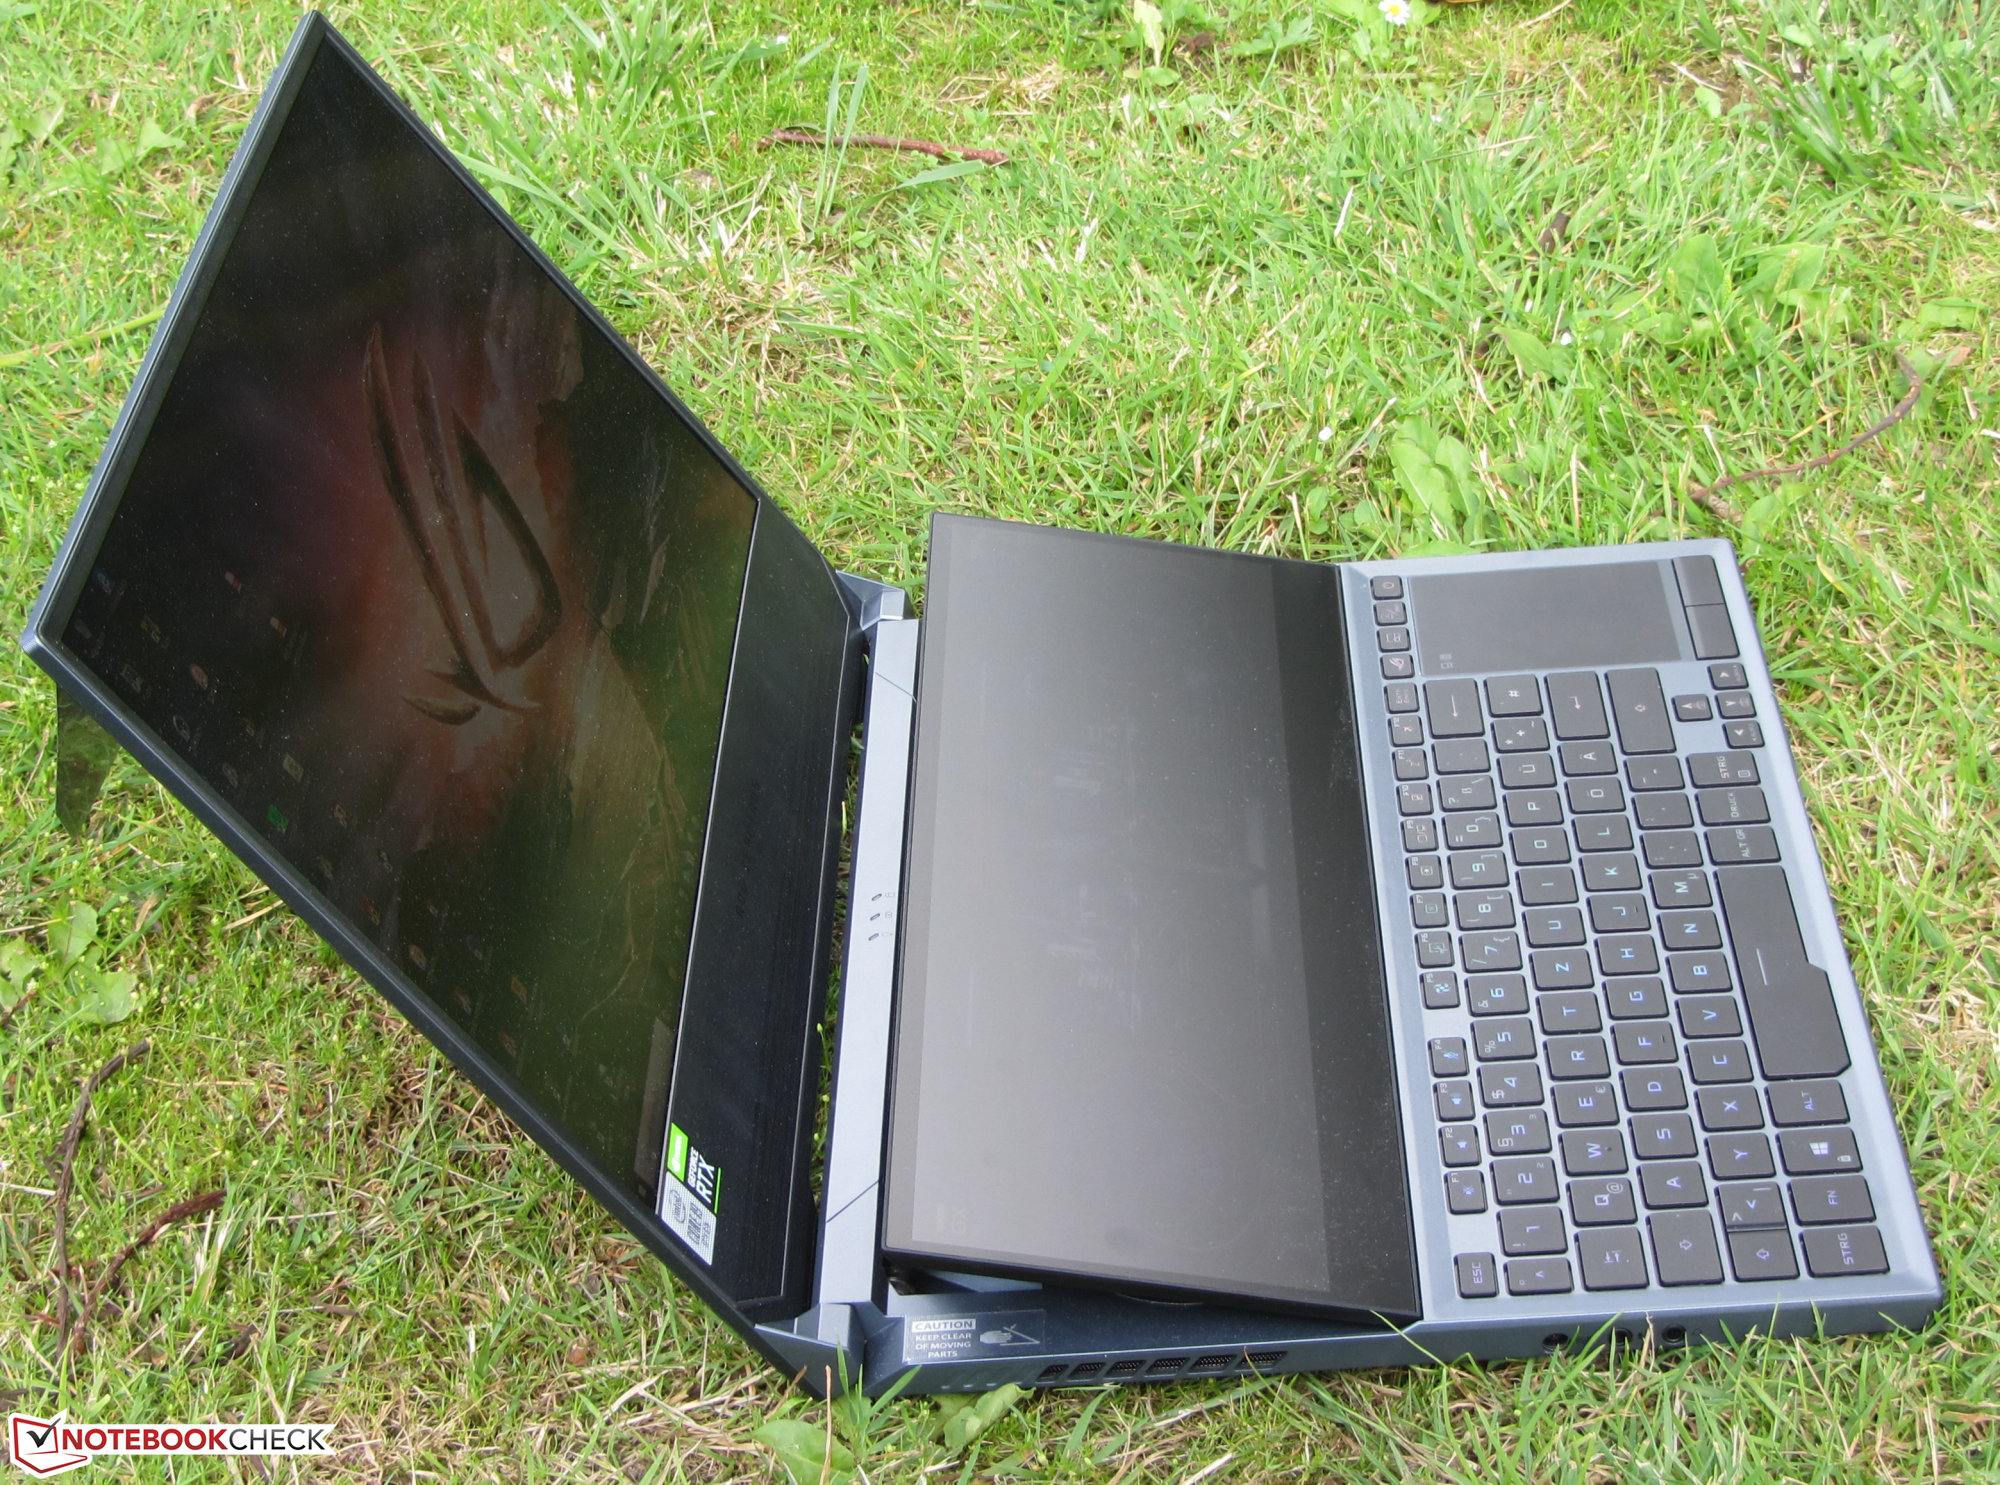
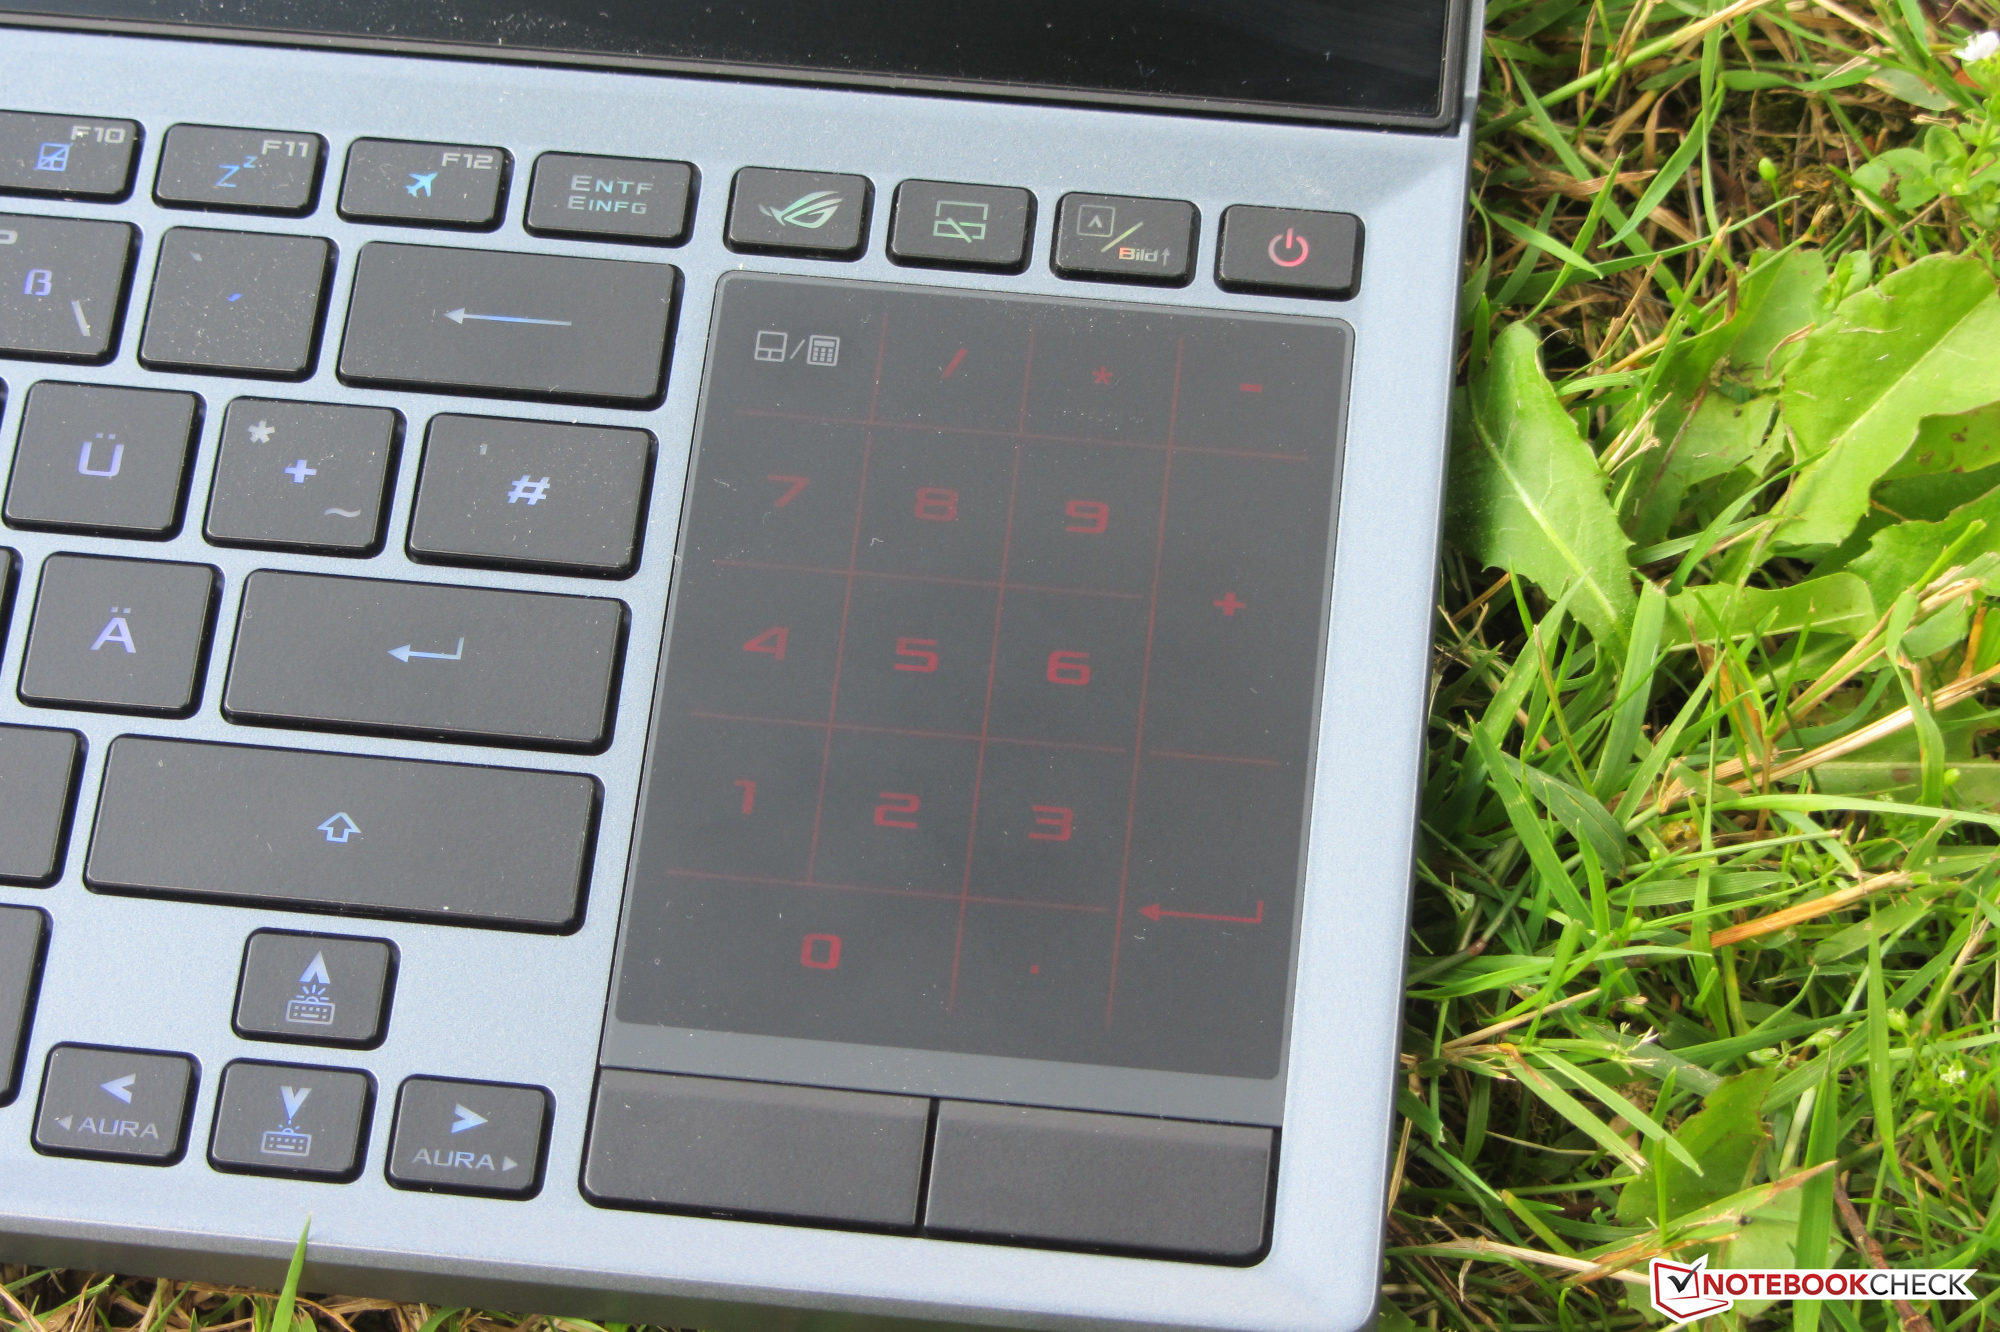
Com este dispositivo Zephyrus e seu Screenpad Plus, a Asus está tentando fornecer valor adicional ao grupo-alvo de jogadores, streamers e criadores de conteúdo. No geral, a Screenpad tende a ser útil de uma maneira ou de outra. No entanto, isso tem um custo: Comparado a outros portáteis para jogos sem tela secundária, o peso e as dimensões do Zephyrus são maiores.
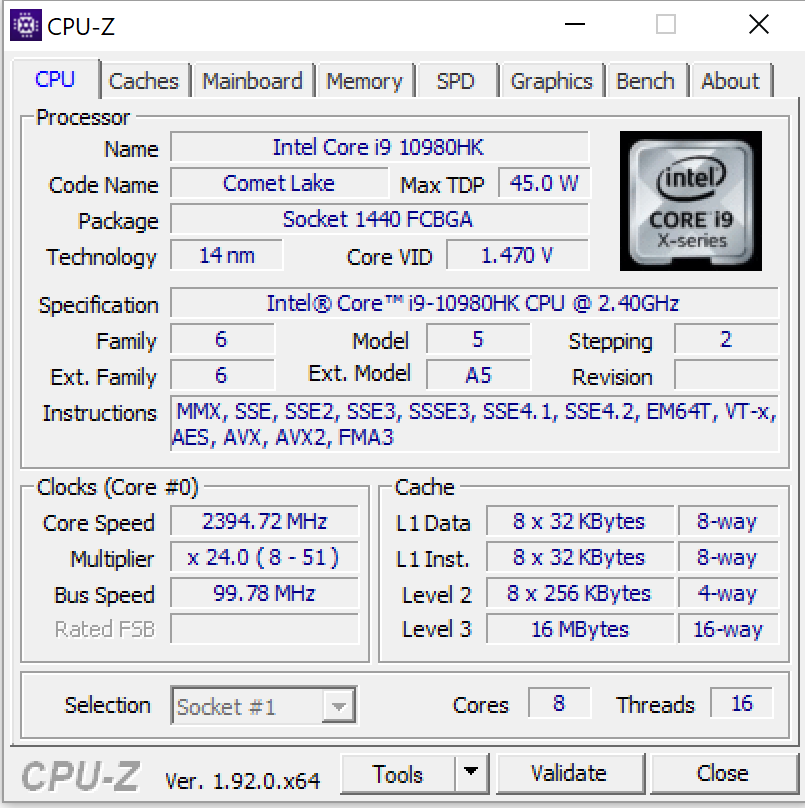
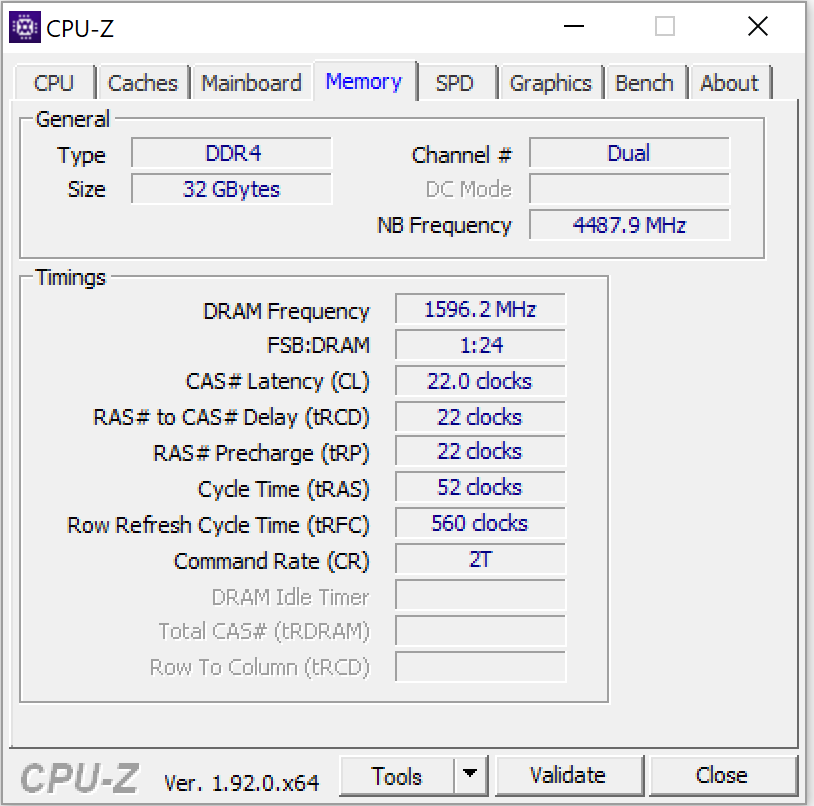
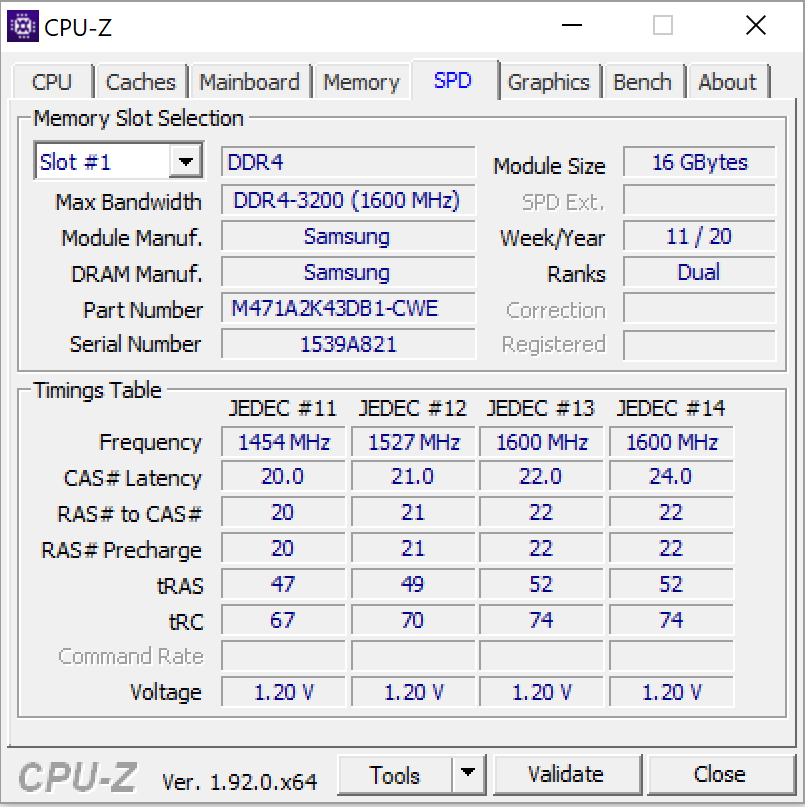
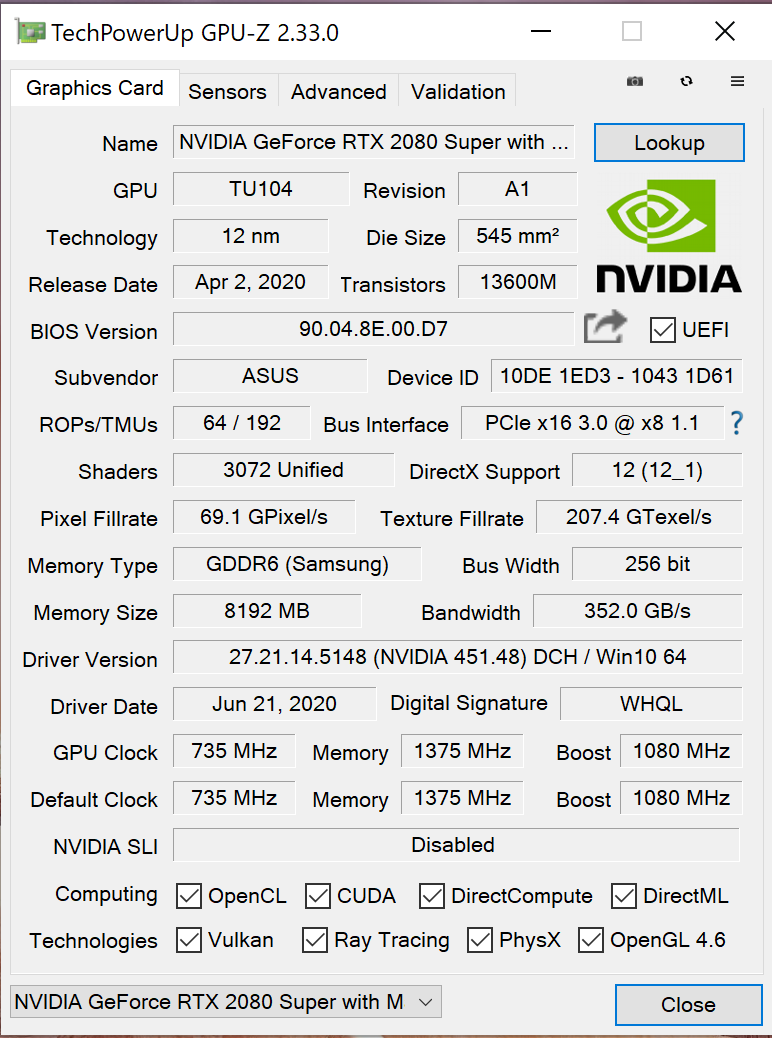
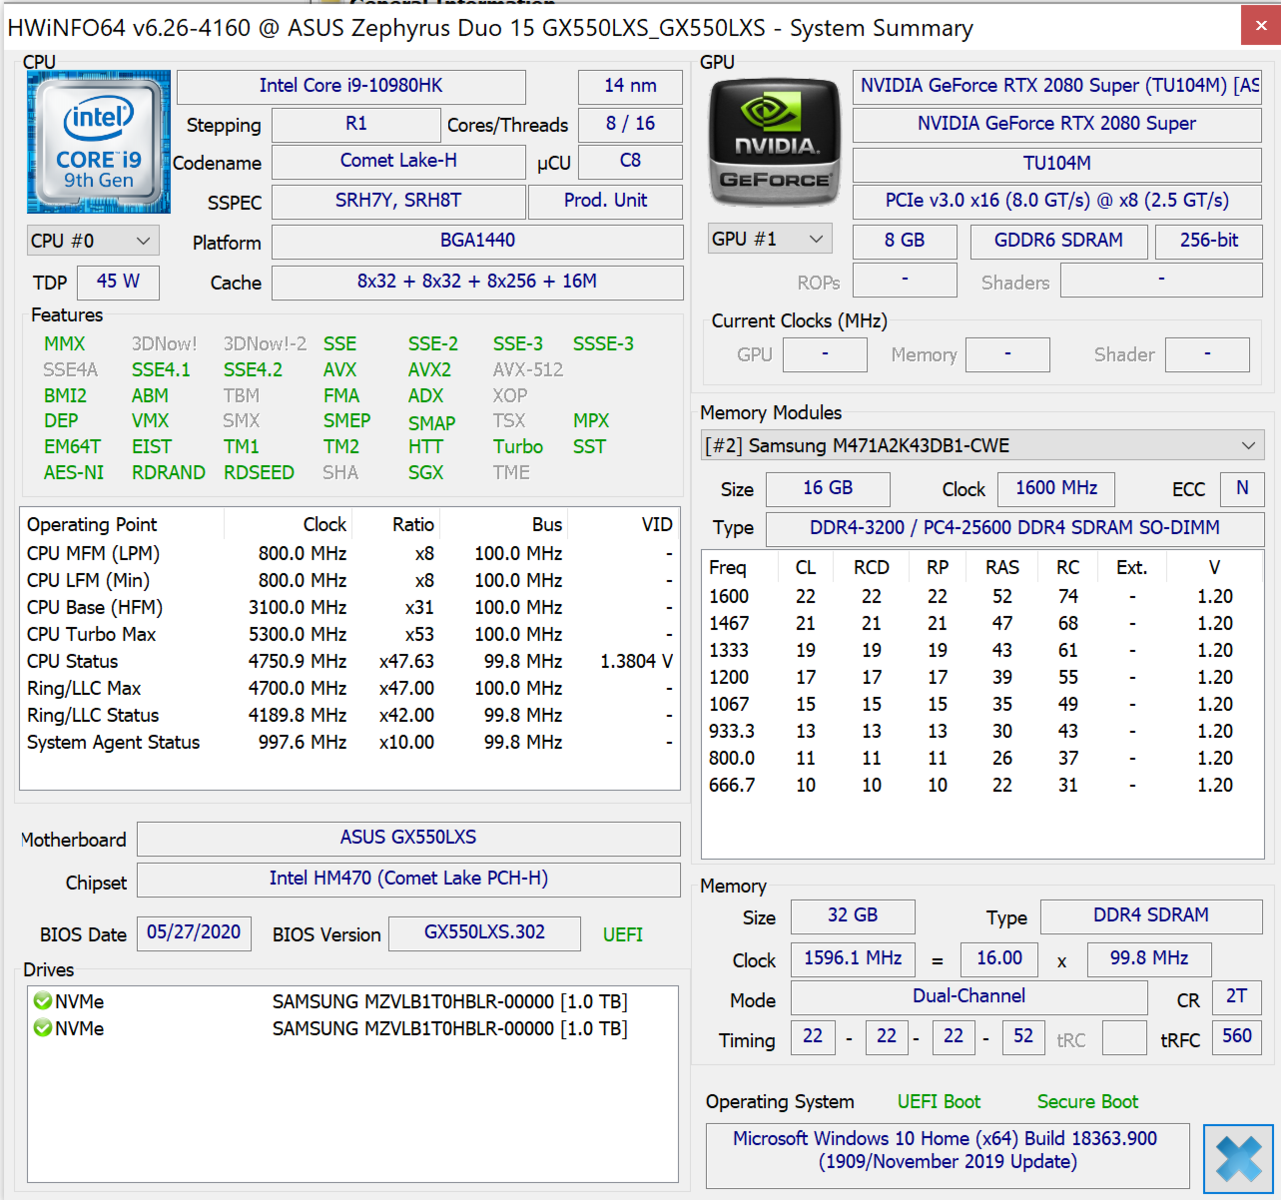
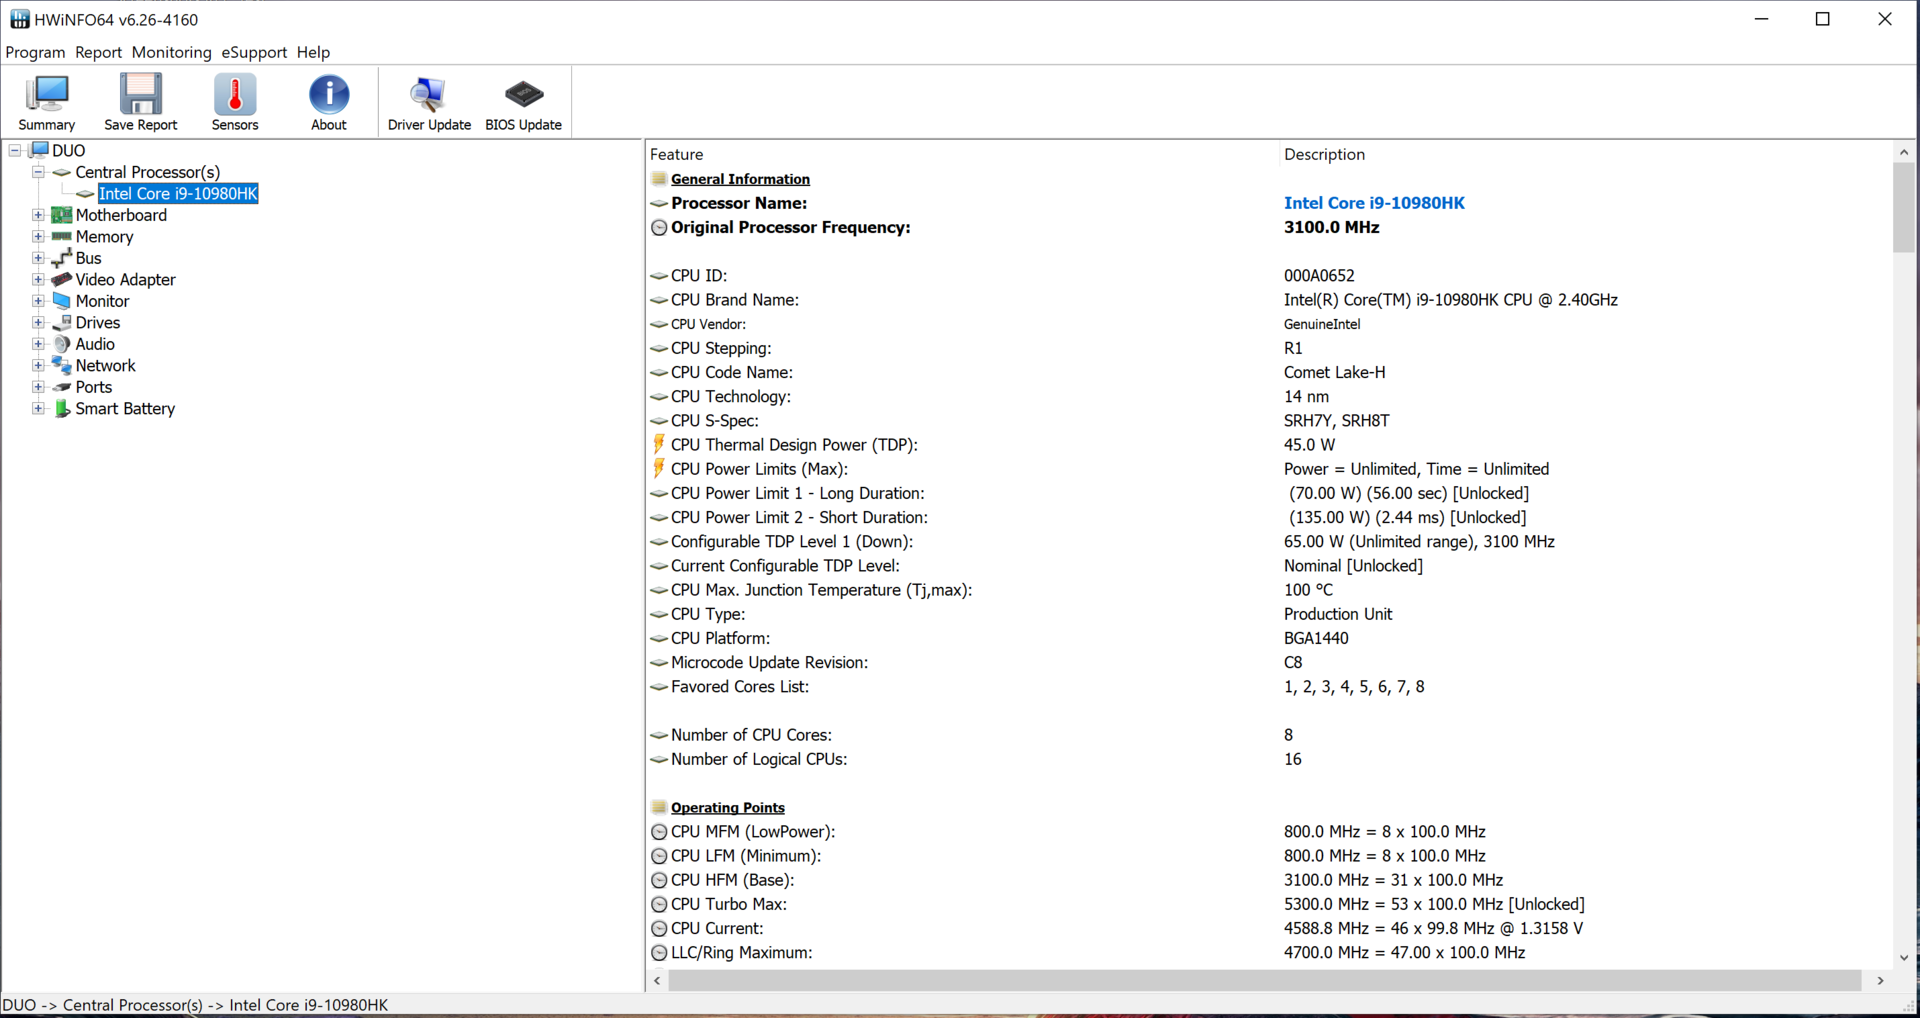
Graças à CPU octa-core Core i9-10980HK e à GPU GeForce RTX 2080 Super Max-Q, o portátil não apresenta falta de desempenho. Os núcleos de processamento são acompanhados por 32 GB de RAM (no modo de canal duplo), composto por um módulo de 16 GB e 16 GB de memória soldada. São possíveis atualizações de até 48 GB. Os dois SSDs NVMe em RAID 0 oferecem altas velocidades de transferência e muito armazenamento (2 TB).
Todos os jogos mais recentes funcionam sem problemas no Asus Zephyrus Duo 15 GX550LXS.
A tela IPS 4K habilitada para G-Sync oferece alto brilho, uma boa taxa de contraste, bons ângulos de visão e - graças à validação Pantone - ótimas cores. Além disso, abrange todo o espaço de cores AdobeRGB. Os tempos de resposta são medíocres. Para melhores tempos de resposta, também está disponível uma opção alternativa de tela Full HD de 300 Hz.
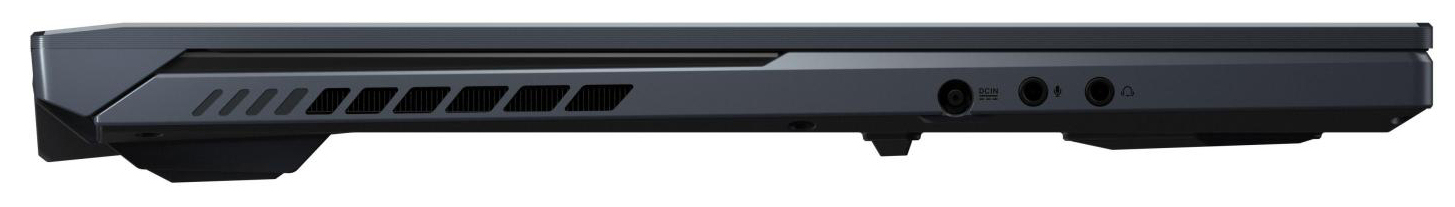
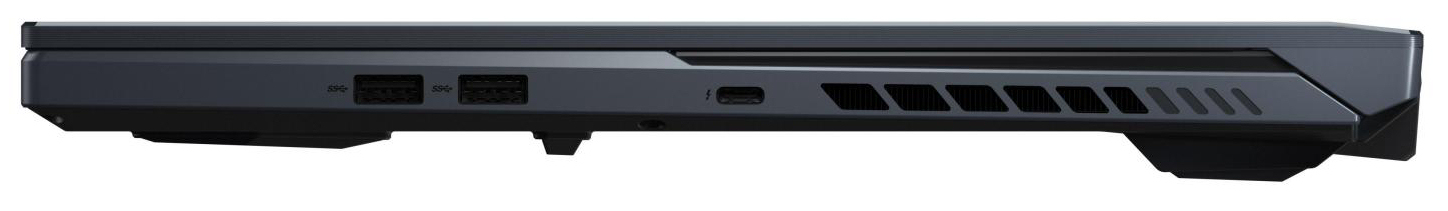
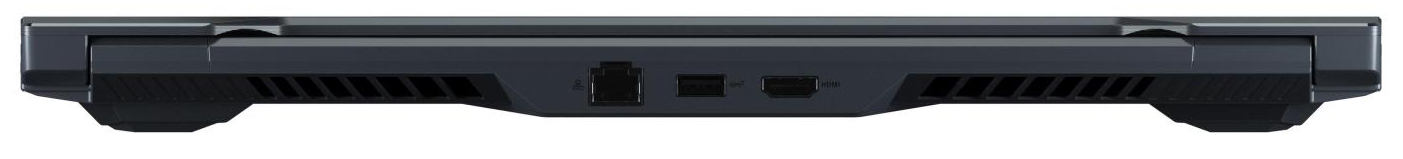
A seleção de portas generosa inclui notavelmente uma porta Thunderbolt 3. Pode ser usada para conectar docks ricos em recursos ou GPUs externas. Além disso, a porta pode ser usada para alimentar o dispositivo com um nível de desempenho reduzido, por exemplo, ao viajar, com o segundo adaptador de CA incluído (65 watts).
Asus ROG Zephyrus Duo 15 GX550LXS
- 07/22/2020 v7 (old)
Sascha Mölck
Price comparison
