Breve Análise do Portátil Acer Predator Triton 500: Superstar
Avaliação | Data | Modelo | Peso | Altura | Size | Resolução | Preço |
|---|---|---|---|---|---|---|---|
v (old) | 04/2020 | Acer Predator Triton 500 PT515-52-70N3 i7-10750H, GeForce RTX 2080 Super Max-Q | 2.1 kg | 18 mm | 15.60" | 1920x1080 | |
| 83.8 % v7 (old) | 06/2019 | MSI GS65 Stealth 9SG i7-9750H, GeForce RTX 2080 Max-Q | 2 kg | 18 mm | 15.60" | 1920x1080 | |
| 88.8 % v6 (old) | 05/2019 | Razer Blade 15 RTX 2080 Max-Q i7-9750H, GeForce RTX 2080 Max-Q | 2.2 kg | 17.8 mm | 15.60" | 1920x1080 | |
| 83 % v7 (old) | 09/2019 | Alienware m15 R2 P87F i7-9750H, GeForce RTX 2080 Max-Q | 2.2 kg | 18.3 mm | 15.60" | 1920x1080 |
| Networking | |
| iperf3 transmit AX12 | |
| Acer Predator Triton 500 PT515-52-70N3 | |
| iperf3 receive AX12 | |
| Acer Predator Triton 500 PT515-52-70N3 | |


| |||||||||||||||||||||||||
iluminação: 88 %
iluminação com acumulador: 320 cd/m²
Contraste: 1333:1 (Preto: 0.24 cd/m²)
ΔE ColorChecker Calman: 4.03 | ∀{0.5-29.43 Ø4.73}
calibrated: 0.98
ΔE Greyscale Calman: 5.94 | ∀{0.09-98 Ø4.97}
99% sRGB (Argyll 1.6.3 3D)
66% AdobeRGB 1998 (Argyll 1.6.3 3D)
72.2% AdobeRGB 1998 (Argyll 3D)
99.5% sRGB (Argyll 3D)
70.3% Display P3 (Argyll 3D)
Gamma: 2.42
CCT: 6751 K
| Acer Predator Triton 500 PT515-52-70N3 AUO B156HAN12.0 (AUO7A8C), IPS, 1920x1080, 15.6" | MSI GS65 Stealth 9SG Sharp LQ156M1JW03 (SHP14C5), IPS, 1920x1080, 15.6" | Razer Blade 15 RTX 2080 Max-Q Sharp LQ156M1JW03 (SHP14C5), IPS, 1920x1080, 15.6" | Alienware m15 R2 P87F Sharp LQ156M1, IPS, 1920x1080, 15.6" | |
|---|---|---|---|---|
| Display | -4% | -4% | -7% | |
| Display P3 Coverage (%) | 70.3 | 67.6 -4% | 66.9 -5% | 65.3 -7% |
| sRGB Coverage (%) | 99.5 | 97.5 -2% | 98.1 -1% | 95.1 -4% |
| AdobeRGB 1998 Coverage (%) | 72.2 | 68.9 -5% | 68.5 -5% | 65.9 -9% |
| Response Times | -5% | 6% | 1% | |
| Response Time Grey 50% / Grey 80% * (ms) | 14.4 ? | 13.6 ? 6% | 12.8 ? 11% | 16.4 ? -14% |
| Response Time Black / White * (ms) | 10.4 ? | 12 ? -15% | 10.4 ? -0% | 8.8 ? 15% |
| PWM Frequency (Hz) | 23260 ? | 23810 ? | 23810 ? | |
| Screen | 10% | 7% | -26% | |
| Brightness middle (cd/m²) | 320 | 282.3 -12% | 293 -8% | 324.2 1% |
| Brightness (cd/m²) | 318 | 269 -15% | 270 -15% | 304 -4% |
| Brightness Distribution (%) | 88 | 90 2% | 87 -1% | 90 2% |
| Black Level * (cd/m²) | 0.24 | 0.32 -33% | 0.29 -21% | 0.38 -58% |
| Contrast (:1) | 1333 | 882 -34% | 1010 -24% | 853 -36% |
| Colorchecker dE 2000 * | 4.03 | 1.17 71% | 1.69 58% | 5.01 -24% |
| Colorchecker dE 2000 max. * | 8.43 | 3.29 61% | 3.37 60% | 12.7 -51% |
| Colorchecker dE 2000 calibrated * | 0.98 | 1.06 -8% | 1.24 -27% | 1.64 -67% |
| Greyscale dE 2000 * | 5.94 | 1.3 78% | 2.3 61% | 7.9 -33% |
| Gamma | 2.42 91% | 2.2 100% | 2.3 96% | 2.35 94% |
| CCT | 6751 96% | 6643 98% | 6758 96% | 8455 77% |
| Color Space (Percent of AdobeRGB 1998) (%) | 66 | 63.8 -3% | 63 -5% | 60.8 -8% |
| Color Space (Percent of sRGB) (%) | 99 | 97.5 -2% | 98.5 -1% | 95.5 -4% |
| Média Total (Programa/Configurações) | 0% /
5% | 3% /
5% | -11% /
-19% |
* ... menor é melhor
Exibir tempos de resposta
| ↔ Tempo de resposta preto para branco | ||
|---|---|---|
| 10.4 ms ... ascensão ↗ e queda ↘ combinadas | ↗ 5.2 ms ascensão | 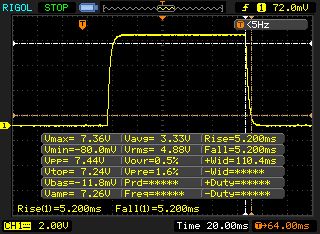 |
| ↘ 5.2 ms queda | ||
| A tela mostra boas taxas de resposta em nossos testes, mas pode ser muito lenta para jogadores competitivos. Em comparação, todos os dispositivos testados variam de 0.1 (mínimo) a 240 (máximo) ms. » 28 % de todos os dispositivos são melhores. Isso significa que o tempo de resposta medido é melhor que a média de todos os dispositivos testados (19.9 ms). | ||
| ↔ Tempo de resposta 50% cinza a 80% cinza | ||
| 14.4 ms ... ascensão ↗ e queda ↘ combinadas | ↗ 7.2 ms ascensão | 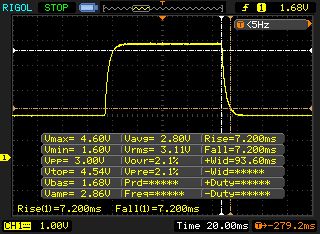 |
| ↘ 7.2 ms queda | ||
| A tela mostra boas taxas de resposta em nossos testes, mas pode ser muito lenta para jogadores competitivos. Em comparação, todos os dispositivos testados variam de 0.165 (mínimo) a 636 (máximo) ms. » 28 % de todos os dispositivos são melhores. Isso significa que o tempo de resposta medido é melhor que a média de todos os dispositivos testados (31.1 ms). | ||
Cintilação da tela / PWM (modulação por largura de pulso)
| Tela tremeluzindo / PWM não detectado | 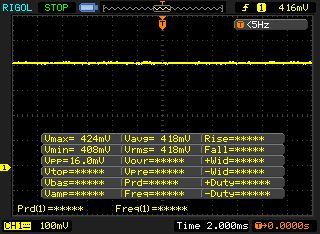 | ||
[pwm_comparison] Em comparação: 52 % de todos os dispositivos testados não usam PWM para escurecer a tela. Se PWM foi detectado, uma média de 7791 (mínimo: 5 - máximo: 343500) Hz foi medida. | |||
| DPC Latencies / LatencyMon - interrupt to process latency (max), Web, Youtube, Prime95 | |
| Acer Predator Triton 500 PT515-52-70N3 | |
* ... menor é melhor
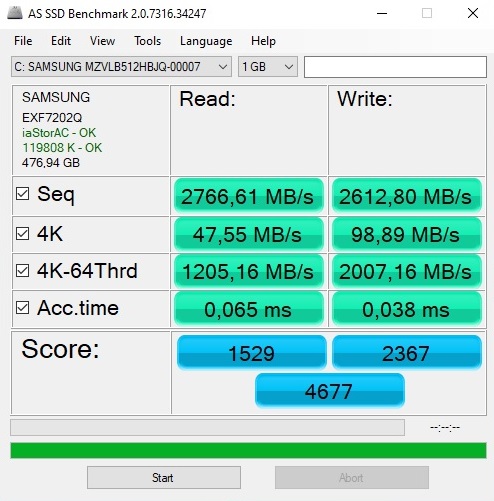
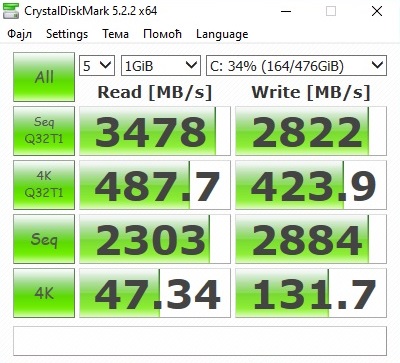
| Acer Predator Triton 500 PT515-52-70N3 Samsung SSD PM981a MZVLB512HBJQ | MSI GS65 Stealth 9SG Samsung SSD PM981 MZVLB512HAJQ | Razer Blade 15 RTX 2080 Max-Q Samsung SSD PM981 MZVLB512HAJQ | Alienware m15 R2 P87F 2x Toshiba XG6 KXG60ZNV512G (RAID 0) | |
|---|---|---|---|---|
| CrystalDiskMark 5.2 / 6 | -21% | -11% | 1% | |
| Write 4K (MB/s) | 131.7 | 91.3 -31% | 137.2 4% | 108.8 -17% |
| Read 4K (MB/s) | 47.34 | 40.73 -14% | 46.82 -1% | 45.41 -4% |
| Write Seq (MB/s) | 2884 | 1915 -34% | 1221 -58% | 2467 -14% |
| Read Seq (MB/s) | 2303 | 2051 -11% | 1217 -47% | 2456 7% |
| Write 4K Q32T1 (MB/s) | 423.9 | 308.3 -27% | 527 24% | 532 26% |
| Read 4K Q32T1 (MB/s) | 487.7 | 417.4 -14% | 614 26% | 590 21% |
| Write Seq Q32T1 (MB/s) | 2822 | 1922 -32% | 1986 -30% | 2801 -1% |
| Read Seq Q32T1 (MB/s) | 3478 | 3395 -2% | 3234 -7% | 3172 -9% |

| 3DMark 06 Standard Score | 38265 pontos | |
| 3DMark Vantage P Result | 60306 pontos | |
| 3DMark 11 Performance | 22730 pontos | |
| 3DMark Cloud Gate Standard Score | 38107 pontos | |
| 3DMark Fire Strike Score | 18678 pontos | |
| 3DMark Time Spy Score | 8043 pontos | |
Ajuda | ||
| The Witcher 3 - 1920x1080 Ultra Graphics & Postprocessing (HBAO+) | |
| Média da turma Gaming (95 - 240, n=8, últimos 2 anos) | |
| Acer Predator Triton 500 PT515-52-70N3 | |
| Alienware m15 R2 P87F | |
| Razer Blade 15 RTX 2080 Max-Q | |
| MSI GS65 Stealth 9SG | |
| baixo | média | alto | ultra | QHD | 4K | |
|---|---|---|---|---|---|---|
| GTA V (2015) | 179 | 172 | 153 | 85.8 | ||
| The Witcher 3 (2015) | 236 | 143 | 83.4 | 58.2 | ||
| Dota 2 Reborn (2015) | 146 | 134 | 123 | 118 | ||
| Fortnite (2018) | 121 | 114 | 99.5 | 80.3 | 44.5 | |
| Final Fantasy XV Benchmark (2018) | 103 | 80.8 | 37.6 | |||
| Kingdom Come: Deliverance (2018) | 119 | 100 | 72 | 56.1 | 31.9 | |
| X-Plane 11.11 (2018) | 107 | 93.4 | 79.5 | |||
| Monster Hunter World (2018) | 105 | 97.7 | 90 | 63.3 | 31.9 | |
| Shadow of the Tomb Raider (2018) | 111 | 105 | 97 | 72 | 39 | |
| Assassin´s Creed Odyssey (2018) | 92 | 78 | 58 | 53 | 32 | |
| Hitman 2 (2018) | 86.7 | 78.6 | 77 | 76 | 46.1 | |
| Battlefield V (2018) | 139 | 127 | 119 | 96.1 | 58.7 | |
| Darksiders III (2018) | 112 | 109 | 103 | 82.1 | 43.2 | |
| Just Cause 4 (2018) | 152 | 113 | 105 | 73.9 | 41.3 | |
| Apex Legends (2019) | 194 | 165 | 163 | 118 | 65 | |
| Far Cry New Dawn (2019) | 103 | 97 | 87 | 71 | 48 | |
| Metro Exodus (2019) | 101 | 77.8 | 63.4 | 51.2 | 31.6 | |
| Dirt Rally 2.0 (2019) | 166 | 162 | 98.8 | 76.4 | ||
| The Division 2 (2019) | 129 | 112 | 80 | 59 | 31 | |
| Anno 1800 (2019) | 94 | 74.4 | 44.9 | 38.8 | 23.2 | |
| Rage 2 (2019) | 126 | 106 | 103 | 68.4 | 34.1 | |
| F1 2019 (2019) | 174 | 141 | 138 | 122 | 74 | |
| Control (2019) | 107 | 79.8 | 48.4 | 24.9 | ||
| Borderlands 3 (2019) | 107 | 84.3 | 68.1 | 49.1 | 26.6 | |
| FIFA 20 (2019) | 251 | 241 | 240 | 239 | 190 | |
| Ghost Recon Breakpoint (2019) | 102 | 92 | 70 | 53 | 31 | |
| GRID 2019 (2019) | 85.9 | 77.7 | 72 | 66.4 | 46.9 | |
| Call of Duty Modern Warfare 2019 (2019) | 134 | 129 | 107 | 78.9 | 44.5 | |
| Need for Speed Heat (2019) | 93 | 86.6 | 83.3 | 66.9 | 40.9 | |
| Star Wars Jedi Fallen Order (2019) | 95.7 | 93.1 | 89.9 | 76.2 | 42.7 | |
| Red Dead Redemption 2 (2019) | 98 | 67.4 | 43.7 | 37 | 23.8 | |
| Escape from Tarkov (2020) | 121 | 121 | 119 | 83.1 | 39.7 | |
| Hunt Showdown (2020) | 119 | 101 | 68.8 | 32.4 | ||
| Doom Eternal (2020) | 164 | 150 | 147 | 108 | 58 |
Barulho
| Ocioso |
| 30 / 33 / 36 dB |
| Carga |
| 50 / 50 dB |
 | ||
30 dB silencioso 40 dB(A) audível 50 dB(A) ruidosamente alto |
||
min: | ||
| Acer Predator Triton 500 PT515-52-70N3 i7-10750H, GeForce RTX 2080 Super Max-Q | MSI GS65 Stealth 9SG i7-9750H, GeForce RTX 2080 Max-Q | Razer Blade 15 RTX 2080 Max-Q i7-9750H, GeForce RTX 2080 Max-Q | Alienware m15 R2 P87F i7-9750H, GeForce RTX 2080 Max-Q | Média da turma Gaming | |
|---|---|---|---|---|---|
| Noise | 7% | 13% | -3% | 12% | |
| desligado / ambiente * (dB) | 30 | 28.3 6% | 28.3 6% | 28.3 6% | 24.1 ? 20% |
| Idle Minimum * (dB) | 30 | 30.4 -1% | 28.8 4% | 28.5 5% | 25.8 ? 14% |
| Idle Average * (dB) | 33 | 30.5 8% | 28.8 13% | 28.5 14% | 27.4 ? 17% |
| Idle Maximum * (dB) | 36 | 30.6 15% | 29 19% | 49 -36% | 29.9 ? 17% |
| Load Average * (dB) | 50 | 37.6 25% | 33.5 33% | 49 2% | 43 ? 14% |
| Witcher 3 ultra * (dB) | 48 | 46 4% | 45 6% | 49 -2% | |
| Load Maximum * (dB) | 50 | 55.1 -10% | 45.2 10% | 55 -10% | 54 ? -8% |
* ... menor é melhor
(±) A temperatura máxima no lado superior é 44 °C / 111 F, em comparação com a média de 40.4 °C / 105 F , variando de 21.2 a 68.8 °C para a classe Gaming.
(-) A parte inferior aquece até um máximo de 50 °C / 122 F, em comparação com a média de 43.2 °C / 110 F
(+) Em uso inativo, a temperatura média para o lado superior é 27.9 °C / 82 F, em comparação com a média do dispositivo de 33.9 °C / ### class_avg_f### F.
(-) Jogando The Witcher 3, a temperatura média para o lado superior é 40.7 °C / 105 F, em comparação com a média do dispositivo de 33.9 °C / ## #class_avg_f### F.
(-) Os apoios para as mãos e o touchpad podem ficar muito quentes ao toque, com um máximo de 40 °C / 104 F.
(-) A temperatura média da área do apoio para as mãos de dispositivos semelhantes foi 28.8 °C / 83.8 F (-11.2 °C / -20.2 F).
| Acer Predator Triton 500 PT515-52-70N3 i7-10750H, GeForce RTX 2080 Super Max-Q | MSI GS65 Stealth 9SG i7-9750H, GeForce RTX 2080 Max-Q | Razer Blade 15 RTX 2080 Max-Q i7-9750H, GeForce RTX 2080 Max-Q | Alienware m15 R2 P87F i7-9750H, GeForce RTX 2080 Max-Q | Média da turma Gaming | |
|---|---|---|---|---|---|
| Heat | -5% | -1% | -11% | -4% | |
| Maximum Upper Side * (°C) | 44 | 45.6 -4% | 47 -7% | 53.8 -22% | 45.2 ? -3% |
| Maximum Bottom * (°C) | 50 | 53.8 -8% | 49.2 2% | 58 -16% | 47.9 ? 4% |
| Idle Upper Side * (°C) | 29 | 28.6 1% | 28.6 1% | 29.8 -3% | 31.1 ? -7% |
| Idle Bottom * (°C) | 31 | 33.2 -7% | 31.4 -1% | 32.2 -4% | 34.2 ? -10% |
* ... menor é melhor
Acer Predator Triton 500 PT515-52-70N3 análise de áudio
(+) | os alto-falantes podem tocar relativamente alto (###valor### dB)
Graves 100 - 315Hz
(-) | quase nenhum baixo - em média 20.2% menor que a mediana
(±) | a linearidade dos graves é média (11.3% delta para a frequência anterior)
Médios 400 - 2.000 Hz
(+) | médios equilibrados - apenas 3.7% longe da mediana
(+) | médios são lineares (3.2% delta para frequência anterior)
Altos 2 - 16 kHz
(+) | agudos equilibrados - apenas 3.2% longe da mediana
(+) | os máximos são lineares (6.1% delta da frequência anterior)
Geral 100 - 16.000 Hz
(±) | a linearidade do som geral é média (17% diferença em relação à mediana)
Comparado com a mesma classe
» 45% de todos os dispositivos testados nesta classe foram melhores, 12% semelhantes, 43% piores
» O melhor teve um delta de 6%, a média foi 18%, o pior foi 132%
Comparado com todos os dispositivos testados
» 30% de todos os dispositivos testados foram melhores, 8% semelhantes, 62% piores
» O melhor teve um delta de 4%, a média foi 24%, o pior foi 134%
MSI GS65 Stealth 9SG análise de áudio
(+) | os alto-falantes podem tocar relativamente alto (###valor### dB)
Graves 100 - 315Hz
(-) | quase nenhum baixo - em média 22.7% menor que a mediana
(±) | a linearidade dos graves é média (9% delta para a frequência anterior)
Médios 400 - 2.000 Hz
(±) | médios mais altos - em média 7% maior que a mediana
(+) | médios são lineares (6.4% delta para frequência anterior)
Altos 2 - 16 kHz
(+) | agudos equilibrados - apenas 2.7% longe da mediana
(±) | a linearidade dos máximos é média (10.6% delta para frequência anterior)
Geral 100 - 16.000 Hz
(±) | a linearidade do som geral é média (23.1% diferença em relação à mediana)
Comparado com a mesma classe
» 84% de todos os dispositivos testados nesta classe foram melhores, 5% semelhantes, 12% piores
» O melhor teve um delta de 6%, a média foi 18%, o pior foi 132%
Comparado com todos os dispositivos testados
» 69% de todos os dispositivos testados foram melhores, 5% semelhantes, 26% piores
» O melhor teve um delta de 4%, a média foi 24%, o pior foi 134%
| desligado | |
| Ocioso | |
| Carga |
|
Key:
min: | |
| Acer Predator Triton 500 PT515-52-70N3 i7-10750H, GeForce RTX 2080 Super Max-Q | MSI GS65 Stealth 9SG i7-9750H, GeForce RTX 2080 Max-Q | Razer Blade 15 RTX 2080 Max-Q i7-9750H, GeForce RTX 2080 Max-Q | Alienware m15 R2 P87F i7-9750H, GeForce RTX 2080 Max-Q | Média da turma Gaming | |
|---|---|---|---|---|---|
| Power Consumption | -22% | -2% | -71% | -15% | |
| Idle Minimum * (Watt) | 11 | 18.3 -66% | 12.5 -14% | 19 -73% | 13.2 ? -20% |
| Idle Average * (Watt) | 15 | 22 -47% | 15.3 -2% | 40.5 -170% | 18.9 ? -26% |
| Idle Maximum * (Watt) | 25 | 28.8 -15% | 20.7 17% | 52 -108% | 24.3 ? 3% |
| Load Average * (Watt) | 95 | 93 2% | 90.2 5% | 132.3 -39% | 108.3 ? -14% |
| Witcher 3 ultra * (Watt) | 140 | 142.6 -2% | 162 -16% | 183.3 -31% | |
| Load Maximum * (Watt) | 211 | 215.9 -2% | 209.3 1% | 217.2 -3% | 254 ? -20% |
* ... menor é melhor
| Acer Predator Triton 500 PT515-52-70N3 i7-10750H, GeForce RTX 2080 Super Max-Q, 84 Wh | MSI GS65 Stealth 9SG i7-9750H, GeForce RTX 2080 Max-Q, 82 Wh | Razer Blade 15 RTX 2080 Max-Q i7-9750H, GeForce RTX 2080 Max-Q, 80 Wh | Alienware m15 R2 P87F i7-9750H, GeForce RTX 2080 Max-Q, 76 Wh | Média da turma Gaming | |
|---|---|---|---|---|---|
| Duração da bateria | -5% | 43% | -16% | 10% | |
| Reader / Idle (h) | 8.3 | 15.9 92% | 9.2 11% | 8.71 ? 5% | |
| WiFi v1.3 (h) | 6.3 | 6 -5% | 6.6 5% | 5.5 -13% | 7.04 ? 12% |
| Load (h) | 1.3 | 1.7 31% | 0.7 -46% | 1.47 ? 13% |
Pro
Contra
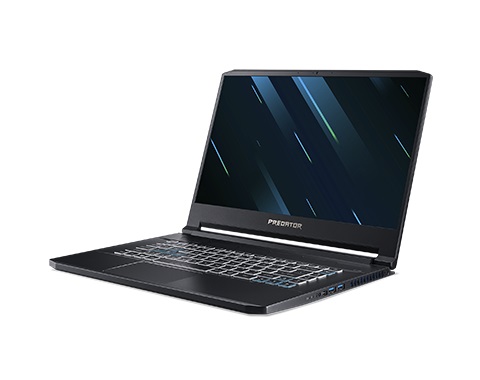
Em 2020, o Predator Triton 500 continua impressionando com sua combinação de baixo peso, dimensões compactas e potência generosa.
O chassi de 15 polegadas relativamente leve e plano pode ter colegas significativamente mais grossos em muitos benchmarks, mas a versão Max-Q da RTX 2080 Super não é exatamente a melhor escolha do ponto de vista de preço-desempenho. De qualquer forma, a GPU rápida garante taxas de quadros Full HD uniformes, mesmo com títulos modernos (nas configurações máximas, é claro). Um outro destaque seria a tela de 300 Hz, que não é apenas responsiva, mas rica em contraste também.
Em suma, quase não há nada a criticar sobre a nova versão do Triton 500. O maior ponto de crítica é, como tantas vezes, o ruído de fundo sob uso intenso.
Price comparison