Breve Análise do Conversível Asus Transformer 4 Pro (i7-7500U, HD620)


| SD Card Reader | |
| average JPG Copy Test (av. of 3 runs) | |
| Acer TravelMate P648-G2-M-73T0 (Toshiba Exceria Pro SDXC 64 GB UHS-II) | |
| Microsoft Surface Pro (2017) i7 (Toshiba Exceria Pro M401 64 GB) | |
| Asus Transformer 4 Pro (i7-7500U, HD620) (Toshiba Exceria Pro M401 64 GB) | |
| Porsche Design BOOK ONE (Toshiba Exceria Pro M501) | |
| maximum AS SSD Seq Read Test (1GB) | |
| Acer TravelMate P648-G2-M-73T0 (Toshiba Exceria Pro SDXC 64 GB UHS-II) | |
| Microsoft Surface Pro (2017) i7 (Toshiba Exceria Pro M401 64 GB) | |
| Asus Transformer 4 Pro (i7-7500U, HD620) (Toshiba Exceria Pro M401 64 GB) | |
| Porsche Design BOOK ONE (Toshiba Exceria Pro M501) | |
| |||||||||||||||||||||||||
iluminação: 89 %
iluminação com acumulador: 262 cd/m²
Contraste: 1008:1 (Preto: 0.26 cd/m²)
ΔE ColorChecker Calman: 3.34 | ∀{0.5-29.43 Ø4.71}
ΔE Greyscale Calman: 3.28 | ∀{0.09-98 Ø4.96}
90% sRGB (Argyll 1.6.3 3D)
59% AdobeRGB 1998 (Argyll 1.6.3 3D)
65.9% AdobeRGB 1998 (Argyll 3D)
90% sRGB (Argyll 3D)
69.6% Display P3 (Argyll 3D)
Gamma: 2.47
CCT: 7180 K
| Asus Transformer 4 Pro (i7-7500U, HD620) BOE06EC, , 2160x1440, 12.6" | Acer Switch 5 SW512-52-5819 WST KL.1200w.004, , 2160x1440, 12" | Lenovo Ideapad Miix 720-12IKB AUO B120YAN01 / AUO106F, , 2880x1920, 12" | Asus Transformer 3 Pro T303UA-GN050T BOE BOE06AC (NV126A1M-N51), , 2880x1920, 12.6" | Microsoft Surface Pro (2017) i7 LG Display LP123WQ112604, , 2736x1824, 12.3" | |
|---|---|---|---|---|---|
| Display | -9% | -2% | 17% | 2% | |
| Display P3 Coverage (%) | 69.6 | 58.8 -16% | 65.2 -6% | 81.8 18% | 66.6 -4% |
| sRGB Coverage (%) | 90 | 87.5 -3% | 91 1% | 98.3 9% | 96.5 7% |
| AdobeRGB 1998 Coverage (%) | 65.9 | 60.6 -8% | 66.1 0% | 82.2 25% | 67.8 3% |
| Response Times | 9% | 2% | 12% | 11% | |
| Response Time Grey 50% / Grey 80% * (ms) | 41 ? | 37 ? 10% | 45 ? -10% | 30 ? 27% | 37 ? 10% |
| Response Time Black / White * (ms) | 28 ? | 26 ? 7% | 24 ? 14% | 29 ? -4% | 25 ? 11% |
| PWM Frequency (Hz) | 200 ? | 22130 ? | |||
| Screen | -26% | -7% | -2% | 6% | |
| Brightness middle (cd/m²) | 262 | 369 41% | 406 55% | 316 21% | 482 84% |
| Brightness (cd/m²) | 254 | 331 30% | 396 56% | 307 21% | 466 83% |
| Brightness Distribution (%) | 89 | 75 -16% | 88 -1% | 91 2% | 92 3% |
| Black Level * (cd/m²) | 0.26 | 0.46 -77% | 0.3 -15% | 0.29 -12% | 0.395 -52% |
| Contrast (:1) | 1008 | 802 -20% | 1353 34% | 1090 8% | 1220 21% |
| Colorchecker dE 2000 * | 3.34 | 5.52 -65% | 5.28 -58% | 3.91 -17% | 4 -20% |
| Colorchecker dE 2000 max. * | 7.12 | 9.29 -30% | 9.83 -38% | 7.9 -11% | 7.2 -1% |
| Greyscale dE 2000 * | 3.28 | 6.95 -112% | 6.71 -105% | 5.37 -64% | 5.7 -74% |
| Gamma | 2.47 89% | 2.58 85% | 2.29 96% | 2.36 93% | 2.28 96% |
| CCT | 7180 91% | 7009 93% | 6532 100% | 7812 83% | 7950 82% |
| Color Space (Percent of AdobeRGB 1998) (%) | 59 | 56 -5% | 59 0% | 72 22% | 62 5% |
| Color Space (Percent of sRGB) (%) | 90 | 88 -2% | 91 1% | 98 9% | 96 7% |
| Média Total (Programa/Configurações) | -9% /
-18% | -2% /
-5% | 9% /
4% | 6% /
6% |
* ... menor é melhor
Exibir tempos de resposta
| ↔ Tempo de resposta preto para branco | ||
|---|---|---|
| 28 ms ... ascensão ↗ e queda ↘ combinadas | ↗ 16 ms ascensão | 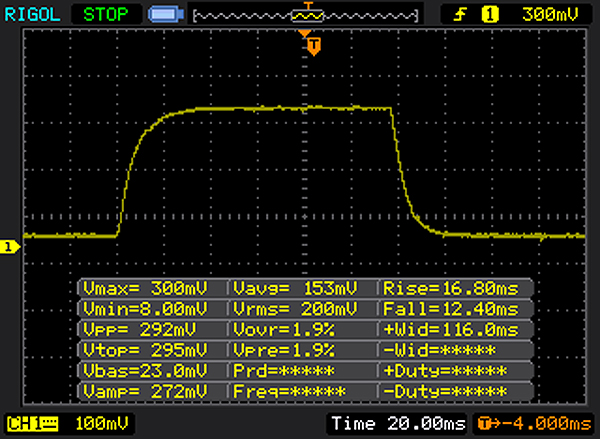 |
| ↘ 12 ms queda | ||
| A tela mostra taxas de resposta relativamente lentas em nossos testes e pode ser muito lenta para os jogadores. Em comparação, todos os dispositivos testados variam de 0.1 (mínimo) a 240 (máximo) ms. » 71 % de todos os dispositivos são melhores. Isso significa que o tempo de resposta medido é pior que a média de todos os dispositivos testados (19.8 ms). | ||
| ↔ Tempo de resposta 50% cinza a 80% cinza | ||
| 41 ms ... ascensão ↗ e queda ↘ combinadas | ↗ 22 ms ascensão | 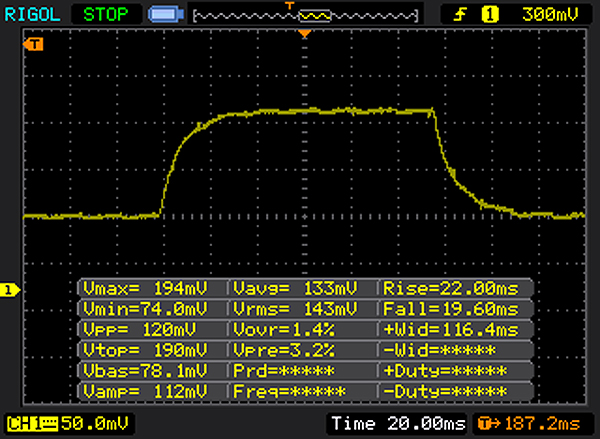 |
| ↘ 19 ms queda | ||
| A tela mostra taxas de resposta lentas em nossos testes e será insatisfatória para os jogadores. Em comparação, todos os dispositivos testados variam de 0.165 (mínimo) a 636 (máximo) ms. » 65 % de todos os dispositivos são melhores. Isso significa que o tempo de resposta medido é pior que a média de todos os dispositivos testados (30.9 ms). | ||
Cintilação da tela / PWM (modulação por largura de pulso)
| Tela tremeluzindo / PWM não detectado | ||
[pwm_comparison] Em comparação: 52 % de todos os dispositivos testados não usam PWM para escurecer a tela. Se PWM foi detectado, uma média de 7744 (mínimo: 5 - máximo: 343500) Hz foi medida. | ||


| PCMark 8 Home Score Accelerated v2 | 2591 pontos | |
| PCMark 8 Work Score Accelerated v2 | 4034 pontos | |
Ajuda | ||
| Asus Transformer 4 Pro (i7-7500U, HD620) SK Hynix HFS256G39TND-N210A | Acer Switch 5 SW512-52-5819 Intel SSD 600p SSDPEKKW512G7 | Lenovo Ideapad Miix 720-12IKB Samsung SSD PM961 1TB M.2 PCIe 3.0 x4 NVMe (MZVLW1T0) | Asus Transformer 3 Pro T303UA-GN050T SK Hynix Canvas SC300 512GB M.2 (HFS512G39MND) | Microsoft Surface Pro (2017) i7 Samsung PM971 KUS040202M | Acer TravelMate P648-G2-M-73T0 SK Hynix HFS256G39TND-N210A | |
|---|---|---|---|---|---|---|
| CrystalDiskMark 3.0 | 89% | 256% | 3% | 116% | 20% | |
| Read Seq (MB/s) | 475.3 | 1066 124% | 2408 407% | 398.9 -16% | 1308 175% | 518 9% |
| Write Seq (MB/s) | 260.9 | 593 127% | 1702 552% | 402 54% | 961 268% | 267.2 2% |
| Read 512 (MB/s) | 289.3 | 653 126% | 1301 350% | 303.1 5% | 227.5 -21% | 562 94% |
| Write 512 (MB/s) | 260.7 | 535 105% | 1288 394% | 320.3 23% | 792 204% | 263.5 1% |
| Read 4k (MB/s) | 30.06 | 35.92 19% | 53.6 78% | 26.11 -13% | 53.6 78% | 32.88 9% |
| Write 4k (MB/s) | 73.5 | 128.3 75% | 162.2 121% | 57.7 -21% | 136.3 85% | 85.6 16% |
| Read 4k QD32 (MB/s) | 296.8 | 460.6 55% | 504 70% | 245.8 -17% | 485.6 64% | 351.3 18% |
| Write 4k QD32 (MB/s) | 239.8 | 425.4 77% | 420.8 75% | 253.8 6% | 421.5 76% | 265.2 11% |

| 3DMark 11 Performance | 1552 pontos | |
| 3DMark Cloud Gate Standard Score | 5878 pontos | |
| 3DMark Fire Strike Score | 316 pontos | |
Ajuda | ||
| Rise of the Tomb Raider - 1024x768 Lowest Preset | |
| Microsoft Surface Pro (2017) i7 | |
| Asus Transformer 3 Pro T303UA-GN050T | |
| Acer Switch 5 SW512-52-5819 | |
| Acer TravelMate P648-G2-M-73T0 | |
| Lenovo Ideapad Miix 720-12IKB | |
| Asus Transformer 4 Pro (i7-7500U, HD620) | |
| baixo | média | alto | ultra | |
|---|---|---|---|---|
| BioShock Infinite (2013) | 24.55 | 11.32 | 9.98 | |
| Thief (2014) | 10.6 | 6.1 | ||
| Rise of the Tomb Raider (2016) | 6.86 |
Barulho
| Ocioso |
| 30.2 / 30.2 / dB |
| Carga |
| 30.8 / 32.9 dB |
 | ||
30 dB silencioso 40 dB(A) audível 50 dB(A) ruidosamente alto |
||
min: | ||
(±) A temperatura máxima no lado superior é 40.5 °C / 105 F, em comparação com a média de 35.4 °C / 96 F , variando de 19.6 a 60 °C para a classe Convertible.
(+) A parte inferior aquece até um máximo de 37 °C / 99 F, em comparação com a média de 36.9 °C / 98 F
(+) Em uso inativo, a temperatura média para o lado superior é 29 °C / 84 F, em comparação com a média do dispositivo de 30.3 °C / ### class_avg_f### F.
(+) Os apoios para as mãos e o touchpad estão atingindo a temperatura máxima da pele (33 °C / 91.4 F) e, portanto, não estão quentes.
(-) A temperatura média da área do apoio para as mãos de dispositivos semelhantes foi 28 °C / 82.4 F (-5 °C / -9 F).
Asus Transformer 4 Pro (i7-7500U, HD620) análise de áudio
(-) | alto-falantes não muito altos (###valor### dB)
Graves 100 - 315Hz
(-) | quase nenhum baixo - em média 17.8% menor que a mediana
(±) | a linearidade dos graves é média (10.3% delta para a frequência anterior)
Médios 400 - 2.000 Hz
(+) | médios equilibrados - apenas 1.8% longe da mediana
(±) | a linearidade dos médios é média (8.1% delta para frequência anterior)
Altos 2 - 16 kHz
(±) | máximos mais altos - em média 7.7% maior que a mediana
(±) | a linearidade dos máximos é média (8.5% delta para frequência anterior)
Geral 100 - 16.000 Hz
(±) | a linearidade do som geral é média (24.8% diferença em relação à mediana)
Comparado com a mesma classe
» 75% de todos os dispositivos testados nesta classe foram melhores, 6% semelhantes, 18% piores
» O melhor teve um delta de 6%, a média foi 20%, o pior foi 57%
Comparado com todos os dispositivos testados
» 76% de todos os dispositivos testados foram melhores, 5% semelhantes, 19% piores
» O melhor teve um delta de 4%, a média foi 23%, o pior foi 134%
Apple MacBook 12 (Early 2016) 1.1 GHz análise de áudio
(+) | os alto-falantes podem tocar relativamente alto (###valor### dB)
Graves 100 - 315Hz
(±) | graves reduzidos - em média 11.3% menor que a mediana
(±) | a linearidade dos graves é média (14.2% delta para a frequência anterior)
Médios 400 - 2.000 Hz
(+) | médios equilibrados - apenas 2.4% longe da mediana
(+) | médios são lineares (5.5% delta para frequência anterior)
Altos 2 - 16 kHz
(+) | agudos equilibrados - apenas 2% longe da mediana
(+) | os máximos são lineares (4.5% delta da frequência anterior)
Geral 100 - 16.000 Hz
(+) | o som geral é linear (10.2% diferença em relação à mediana)
Comparado com a mesma classe
» 7% de todos os dispositivos testados nesta classe foram melhores, 2% semelhantes, 90% piores
» O melhor teve um delta de 5%, a média foi 18%, o pior foi 53%
Comparado com todos os dispositivos testados
» 5% de todos os dispositivos testados foram melhores, 1% semelhantes, 94% piores
» O melhor teve um delta de 4%, a média foi 23%, o pior foi 134%
| desligado | |
| Ocioso | |
| Carga |
|
Key:
min: | |
| Asus Transformer 4 Pro (i7-7500U, HD620) i7-7500U, HD Graphics 620, SK Hynix HFS256G39TND-N210A, IPS, 2160x1440, 12.6" | Acer Switch 5 SW512-52-5819 i7-7500U, HD Graphics 620, Intel SSD 600p SSDPEKKW512G7, IPS, 2160x1440, 12" | Lenovo Ideapad Miix 720-12IKB i7-7500U, HD Graphics 620, Samsung SSD PM961 1TB M.2 PCIe 3.0 x4 NVMe (MZVLW1T0), IPS, 2880x1920, 12" | Asus Transformer 3 Pro T303UA-GN050T 6500U, HD Graphics 520, SK Hynix Canvas SC300 512GB M.2 (HFS512G39MND), IPS, 2880x1920, 12.6" | Microsoft Surface Pro (2017) i7 i7-7660U, Iris Plus Graphics 640, Samsung PM971 KUS040202M, IPS, 2736x1824, 12.3" | Acer TravelMate P648-G2-M-73T0 i7-7500U, HD Graphics 620, SK Hynix HFS256G39TND-N210A, IPS, 1920x1080, 14" | |
|---|---|---|---|---|---|---|
| Power Consumption | -27% | -27% | -66% | -71% | -53% | |
| Idle Minimum * (Watt) | 3.4 | 3.86 -14% | 3.5 -3% | 6.7 -97% | 4.2 -24% | 4.8 -41% |
| Idle Average * (Watt) | 5.7 | 6.4 -12% | 7.2 -26% | 10.3 -81% | 10.1 -77% | 7.9 -39% |
| Idle Maximum * (Watt) | 7.4 | 7.17 3% | 7.9 -7% | 13.5 -82% | 14 -89% | 10.7 -45% |
| Load Average * (Watt) | 15 | 30.5 -103% | 29.6 -97% | 26 -73% | 37.4 -149% | 35 -133% |
| Load Maximum * (Watt) | 29.7 | 32.4 -9% | 30.8 -4% | 28.8 3% | 34 -14% | 31.6 -6% |
| Witcher 3 ultra * (Watt) | 38.1 |
* ... menor é melhor
| Asus Transformer 4 Pro (i7-7500U, HD620) i7-7500U, HD Graphics 620, 39 Wh | Acer Switch 5 SW512-52-5819 i7-7500U, HD Graphics 620, Wh | Lenovo Ideapad Miix 720-12IKB i7-7500U, HD Graphics 620, 41 Wh | Asus Transformer 3 Pro T303UA-GN050T 6500U, HD Graphics 520, 39 Wh | Microsoft Surface Pro (2017) i7 i7-7660U, Iris Plus Graphics 640, 45 Wh | Acer TravelMate P648-G2-M-73T0 i7-7500U, HD Graphics 620, 54 Wh | |
|---|---|---|---|---|---|---|
| Duração da bateria | -3% | 1% | -28% | 35% | 54% | |
| Reader / Idle (h) | 14 | 11.9 -15% | 11.9 -15% | 7.1 -49% | 18.1 29% | |
| WiFi v1.3 (h) | 4.7 | 5.9 26% | 5.8 23% | 3.7 -21% | 8.2 74% | 11.2 138% |
| Load (h) | 2 | 1.6 -20% | 1.9 -5% | 1.7 -15% | 1.9 -5% | 1.9 -5% |
| H.264 (h) | 3.4 | 10.2 | ||||
| Witcher 3 ultra (h) | 1.9 |
Pro
Contra
Asus' Transformer 4 Pro is a sham model upgrade. In reality, the convertible laptop is in some ways inferior to its predecessor. The lower resolution display, the throttling CPU and an equal battery capacity leave few recognizable improvements to the Transformer 3 Pro. The only truly useful improvement is the fact that the USB Type-C port is no longer occupied by the power cord when the device is in AC power mode.
The improvements to the Transformer 4 Pro come at the expense of some of the previous model's good attributes. In crucial areas, our impression of this device is worse than that of its predecessor. Prospective buyers may want to consider whether a different product would suit them better.
Buyers of the Transformer 4 Pro will receive a convertible laptop that is in fact a good device, taken in isolation. Compared to the competition, however, it is clear where Asus cut costs. The device's processor performance and SSD performance are both far below average. Compared to the previous model, the Transformer 3 Pro, things look even worse. With the exception of its longer battery life, the new model provides no genuine added value. At its current price, the Transformer 4 Pro's performance is simply too weak. Other manufacturers offer devices with stronger performance at similar price points.
Asus Transformer 4 Pro (i7-7500U, HD620)
- 11/27/2017 v6 (old)
Mike Wobker