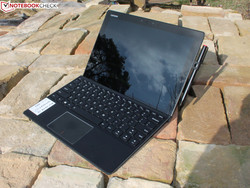
Breve Análise do Conversível Lenovo IdeaPad Miix 720 (7500U, QHD)

| Networking | |
| iperf3 transmit AX12 | |
| Asus Transformer 3 Pro T303UA-GN050T | |
| Lenovo Ideapad Miix 720-12IKB | |
| Lenovo Miix 510 Pro 80U10006GE (jseb) | |
| iperf3 receive AX12 | |
| Lenovo Miix 510 Pro 80U10006GE (jseb) | |
| Asus Transformer 3 Pro T303UA-GN050T | |
| Lenovo Ideapad Miix 720-12IKB | |
| |||||||||||||||||||||||||
iluminação: 88 %
iluminação com acumulador: 414 cd/m²
Contraste: 1353:1 (Preto: 0.3 cd/m²)
ΔE ColorChecker Calman: 5.28 | ∀{0.5-29.43 Ø4.71}
ΔE Greyscale Calman: 6.71 | ∀{0.09-98 Ø4.96}
91% sRGB (Argyll 1.6.3 3D)
59% AdobeRGB 1998 (Argyll 1.6.3 3D)
66.1% AdobeRGB 1998 (Argyll 3D)
91% sRGB (Argyll 3D)
65.2% Display P3 (Argyll 3D)
Gamma: 2.29
CCT: 6532 K
| Lenovo Ideapad Miix 720-12IKB AUO B120YAN01 / AUO106F, , 2880x1920, 12" | Microsoft Surface Pro 4 Core i7 Samsung 123YL01-001 ID: SDC3853, , 2736x1824, 12.3" | Asus Transformer 3 Pro T303UA-GN050T BOE BOE06AC (NV126A1M-N51), , 2880x1920, 12.6" | Lenovo Miix 510 Pro 80U10006GE Unknown, , 1920x1200, 12.2" | Acer Aspire Switch Alpha 12 SA5-271-56HM Panasonic VVX12T041N00, , 2160x1440, 12" | HP Elite x2 1012 G1 LG Philips, , 1920x1280, 12.1" | Dell XPS 12 9250 4K Sharp SHP143D, , 3840x2160, 12.5" | |
|---|---|---|---|---|---|---|---|
| Display | 5% | 19% | -0% | 2% | -18% | 29% | |
| Display P3 Coverage (%) | 65.2 | 66.9 3% | 81.8 25% | 64.5 -1% | 65.5 0% | 53.8 -17% | 83.9 29% |
| sRGB Coverage (%) | 91 | 97.5 7% | 98.3 8% | 92 1% | 96.1 6% | 73.7 -19% | 99.8 10% |
| AdobeRGB 1998 Coverage (%) | 66.1 | 68.6 4% | 82.2 24% | 65.5 -1% | 66.9 1% | 53.8 -19% | 98.1 48% |
| Response Times | -28% | 6% | 16% | 7% | 16% | -13% | |
| Response Time Grey 50% / Grey 80% * (ms) | 45 ? | 48.4 ? -8% | 30 ? 33% | 33 ? 27% | 20 ? 56% | 33.2 ? 26% | 36 ? 20% |
| Response Time Black / White * (ms) | 24 ? | 35.6 ? -48% | 29 ? -21% | 23 ? 4% | 34 ? -42% | 22.8 ? 5% | 35 ? -46% |
| PWM Frequency (Hz) | 10420 | 200 ? | 125 ? | 1000 ? | 1000 ? | ||
| Screen | 18% | 4% | -21% | -14% | -16% | 13% | |
| Brightness middle (cd/m²) | 406 | 436.7 8% | 316 -22% | 327 -19% | 345 -15% | 322 -21% | 437 8% |
| Brightness (cd/m²) | 396 | 433 9% | 307 -22% | 324 -18% | 328 -17% | 319 -19% | 399 1% |
| Brightness Distribution (%) | 88 | 87 -1% | 91 3% | 88 0% | 91 3% | 97 10% | 81 -8% |
| Black Level * (cd/m²) | 0.3 | 0.326 -9% | 0.29 3% | 0.35 -17% | 0.38 -27% | 0.42 -40% | 0.35 -17% |
| Contrast (:1) | 1353 | 1340 -1% | 1090 -19% | 934 -31% | 908 -33% | 767 -43% | 1249 -8% |
| Colorchecker dE 2000 * | 5.28 | 1.82 66% | 3.91 26% | 6.54 -24% | 8.4 -59% | 6.02 -14% | 3.56 33% |
| Colorchecker dE 2000 max. * | 9.83 | 7.9 20% | 15.59 -59% | 11.9 -21% | 10.06 -2% | 9.3 5% | |
| Greyscale dE 2000 * | 6.71 | 1.44 79% | 5.37 20% | 9.52 -42% | 4.3 36% | 6.29 6% | 2.67 60% |
| Gamma | 2.29 96% | 2.1 105% | 2.36 93% | 2.35 94% | 2.63 84% | 2.4 92% | 2.17 101% |
| CCT | 6532 100% | 6560 99% | 7812 83% | 8802 74% | 7368 88% | 7712 84% | 6681 97% |
| Color Space (Percent of AdobeRGB 1998) (%) | 59 | 62.3 6% | 72 22% | 59 0% | 62 5% | 47.8 -19% | 86 46% |
| Color Space (Percent of sRGB) (%) | 91 | 97.5 7% | 98 8% | 92 1% | 73.2 -20% | 100 10% | |
| Média Total (Programa/Configurações) | -2% /
9% | 10% /
7% | -2% /
-12% | -2% /
-8% | -6% /
-12% | 10% /
13% |
* ... menor é melhor
Exibir tempos de resposta
| ↔ Tempo de resposta preto para branco | ||
|---|---|---|
| 24 ms ... ascensão ↗ e queda ↘ combinadas | ↗ 14 ms ascensão | 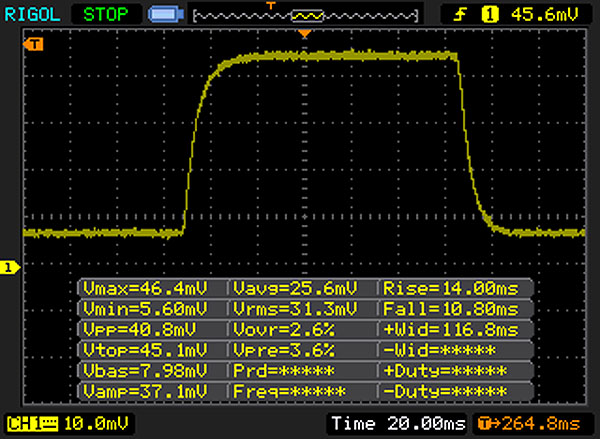 |
| ↘ 10 ms queda | ||
| A tela mostra boas taxas de resposta em nossos testes, mas pode ser muito lenta para jogadores competitivos. Em comparação, todos os dispositivos testados variam de 0.1 (mínimo) a 240 (máximo) ms. » 54 % de todos os dispositivos são melhores. Isso significa que o tempo de resposta medido é pior que a média de todos os dispositivos testados (19.8 ms). | ||
| ↔ Tempo de resposta 50% cinza a 80% cinza | ||
| 45 ms ... ascensão ↗ e queda ↘ combinadas | ↗ 22 ms ascensão | 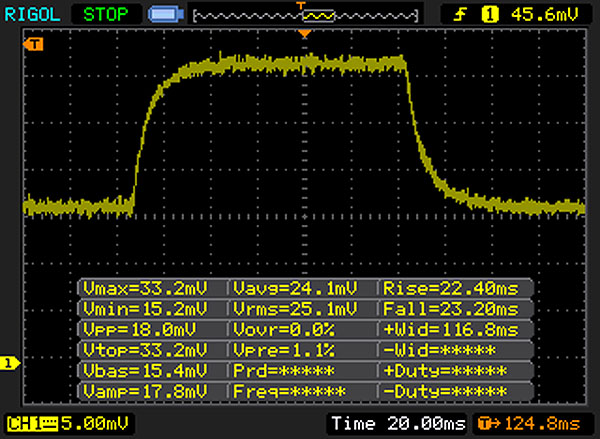 |
| ↘ 23 ms queda | ||
| A tela mostra taxas de resposta lentas em nossos testes e será insatisfatória para os jogadores. Em comparação, todos os dispositivos testados variam de 0.165 (mínimo) a 636 (máximo) ms. » 77 % de todos os dispositivos são melhores. Isso significa que o tempo de resposta medido é pior que a média de todos os dispositivos testados (31 ms). | ||
Cintilação da tela / PWM (modulação por largura de pulso)
| Tela tremeluzindo / PWM não detectado | ||
[pwm_comparison] Em comparação: 52 % de todos os dispositivos testados não usam PWM para escurecer a tela. Se PWM foi detectado, uma média de 7754 (mínimo: 5 - máximo: 343500) Hz foi medida. | ||
| PCMark 8 Home Score Accelerated v2 | 3186 pontos | |
| PCMark 8 Work Score Accelerated v2 | 4216 pontos | |
Ajuda | ||
| Lenovo Ideapad Miix 720-12IKB Samsung SSD PM961 1TB M.2 PCIe 3.0 x4 NVMe (MZVLW1T0) | Microsoft Surface Pro 4 Core i7 Samsung MZFLV256 NVMe | Asus Transformer 3 Pro T303UA-GN050T SK Hynix Canvas SC300 512GB M.2 (HFS512G39MND) | Lenovo Miix 510 Pro 80U10006GE Samsung PM951 NVMe MZVLV256 | Acer Aspire Switch Alpha 12 SA5-271-56HM Kingston RBU-SNS8152S3256GG2 | HP Elite x2 1012 G1 Liteon L8H-256V2G | Dell XPS 12 9250 4K Samsung PM951 NVMe 512 GB | |
|---|---|---|---|---|---|---|---|
| CrystalDiskMark 3.0 | -51% | -65% | -43% | -65% | -60% | -55% | |
| Read Seq (MB/s) | 2408 | 834 -65% | 398.9 -83% | 1271 -47% | 518 -78% | 501 -79% | 984 -59% |
| Write Seq (MB/s) | 1702 | 304 -82% | 402 -76% | 305.4 -82% | 199.9 -88% | 297.2 -83% | 525 -69% |
| Read 512 (MB/s) | 1301 | 396.7 -70% | 303.1 -77% | 651 -50% | 374.9 -71% | 351.7 -73% | 428.7 -67% |
| Write 512 (MB/s) | 1288 | 304.3 -76% | 320.3 -75% | 305.2 -76% | 201 -84% | 295.7 -77% | 176.6 -86% |
| Read 4k (MB/s) | 53.6 | 40.75 -24% | 26.11 -51% | 41.07 -23% | 29.3 -45% | 28.31 -47% | 37.31 -30% |
| Write 4k (MB/s) | 162.2 | 106.3 -34% | 57.7 -64% | 122.7 -24% | 76.8 -53% | 90.3 -44% | 104 -36% |
| Read 4k QD32 (MB/s) | 504 | 393.1 -22% | 245.8 -51% | 411.2 -18% | 272 -46% | 285 -43% | 254.4 -50% |
| Write 4k QD32 (MB/s) | 420.8 | 292.3 -31% | 253.8 -40% | 305.1 -27% | 197.1 -53% | 268.4 -36% | 234.1 -44% |

| 3DMark 11 Performance | 1558 pontos | |
| 3DMark Cloud Gate Standard Score | 5620 pontos | |
Ajuda | ||
| Thief - 1024x768 Very Low Preset | |
| Lenovo Ideapad Miix 720-12IKB | |
| Lenovo Miix 510 Pro 80U10006GE | |
| Rise of the Tomb Raider - 1024x768 Lowest Preset | |
| Asus Transformer 3 Pro T303UA-GN050T | |
| Lenovo Miix 510 Pro 80U10006GE | |
| Acer Aspire Switch Alpha 12 SA5-271-56HM | |
| Lenovo Ideapad Miix 720-12IKB | |
| Dell XPS 12 9250 4K | |
| baixo | média | alto | ultra | |
|---|---|---|---|---|
| BioShock Infinite (2013) | 48 | 29 | 24.7 | 7.4 |
| Thief (2014) | 21.7 | 14.1 | 11.7 | 5.7 |
| Rise of the Tomb Raider (2016) | 16.7 | 10.2 | 5.5 |
Barulho
| Ocioso |
| 30.4 / 32.4 / 32.4 dB |
| Carga |
| 36 / 36.3 dB |
 | ||
30 dB silencioso 40 dB(A) audível 50 dB(A) ruidosamente alto |
||
min: | ||
(±) A temperatura máxima no lado superior é 42 °C / 108 F, em comparação com a média de 35.4 °C / 96 F , variando de 19.6 a 60 °C para a classe Convertible.
(±) A parte inferior aquece até um máximo de 43.6 °C / 110 F, em comparação com a média de 36.9 °C / 98 F
(+) Em uso inativo, a temperatura média para o lado superior é 30.2 °C / 86 F, em comparação com a média do dispositivo de 30.3 °C / ### class_avg_f### F.
(±) Os apoios para as mãos e o touchpad podem ficar muito quentes ao toque, com um máximo de 37.5 °C / 99.5 F.
(-) A temperatura média da área do apoio para as mãos de dispositivos semelhantes foi 28 °C / 82.4 F (-9.5 °C / -17.1 F).
Lenovo Ideapad Miix 720-12IKB análise de áudio
(-) | alto-falantes não muito altos (###valor### dB)
Graves 100 - 315Hz
(±) | graves reduzidos - em média 9.9% menor que a mediana
(-) | graves não são lineares (16.2% delta para frequência anterior)
Médios 400 - 2.000 Hz
(±) | médios mais altos - em média 7.3% maior que a mediana
(±) | a linearidade dos médios é média (13.3% delta para frequência anterior)
Altos 2 - 16 kHz
(+) | agudos equilibrados - apenas 3.3% longe da mediana
(±) | a linearidade dos máximos é média (12.2% delta para frequência anterior)
Geral 100 - 16.000 Hz
(±) | a linearidade do som geral é média (25.1% diferença em relação à mediana)
Comparado com a mesma classe
» 76% de todos os dispositivos testados nesta classe foram melhores, 7% semelhantes, 17% piores
» O melhor teve um delta de 6%, a média foi 20%, o pior foi 57%
Comparado com todos os dispositivos testados
» 77% de todos os dispositivos testados foram melhores, 5% semelhantes, 18% piores
» O melhor teve um delta de 4%, a média foi 23%, o pior foi 134%
Asus Transformer 3 Pro T303UA-GN050T análise de áudio
(±) | o volume do alto-falante é médio, mas bom (###valor### dB)
Graves 100 - 315Hz
(±) | graves reduzidos - em média 11.2% menor que a mediana
(±) | a linearidade dos graves é média (8.2% delta para a frequência anterior)
Médios 400 - 2.000 Hz
(+) | médios equilibrados - apenas 1.8% longe da mediana
(+) | médios são lineares (6.7% delta para frequência anterior)
Altos 2 - 16 kHz
(±) | máximos mais altos - em média 9% maior que a mediana
(+) | os máximos são lineares (5.7% delta da frequência anterior)
Geral 100 - 16.000 Hz
(±) | a linearidade do som geral é média (19% diferença em relação à mediana)
Comparado com a mesma classe
» 45% de todos os dispositivos testados nesta classe foram melhores, 7% semelhantes, 48% piores
» O melhor teve um delta de 6%, a média foi 20%, o pior foi 57%
Comparado com todos os dispositivos testados
» 45% de todos os dispositivos testados foram melhores, 7% semelhantes, 48% piores
» O melhor teve um delta de 4%, a média foi 23%, o pior foi 134%
| desligado | |
| Ocioso | |
| Carga |
|
Key:
min: | |
| Lenovo Ideapad Miix 720-12IKB i7-7500U, HD Graphics 620, Samsung SSD PM961 1TB M.2 PCIe 3.0 x4 NVMe (MZVLW1T0), IPS, 2880x1920, 12" | Microsoft Surface Pro 4, Core i5, 128GB 6300U, HD Graphics 520, Samsung MZFLV128 NVMe, IPS, 2736x1824, 12.3" | Asus Transformer 3 Pro T303UA-GN050T 6500U, HD Graphics 520, SK Hynix Canvas SC300 512GB M.2 (HFS512G39MND), IPS, 2880x1920, 12.6" | Lenovo Miix 510 Pro 80U10006GE 6200U, HD Graphics 520, Samsung PM951 NVMe MZVLV256, IPS, 1920x1200, 12.2" | Acer Aspire Switch Alpha 12 SA5-271-56HM 6200U, HD Graphics 520, Kingston RBU-SNS8152S3256GG2, IPS, 2160x1440, 12" | HP Elite x2 1012 G1 6Y54, HD Graphics 515, Liteon L8H-256V2G, IPS, 1920x1280, 12.1" | Dell XPS 12 9250 4K 6Y75, HD Graphics 515, Samsung PM951 NVMe 512 GB, IPS, 3840x2160, 12.5" | |
|---|---|---|---|---|---|---|---|
| Power Consumption | -3% | -37% | -24% | -31% | 3% | -21% | |
| Idle Minimum * (Watt) | 3.5 | 4.4 -26% | 6.7 -91% | 4.2 -20% | 7.3 -109% | 3.7 -6% | 5.4 -54% |
| Idle Average * (Watt) | 7.2 | 9 -25% | 10.3 -43% | 11.5 -60% | 10 -39% | 6.8 6% | 10.2 -42% |
| Idle Maximum * (Watt) | 7.9 | 10.7 -35% | 13.5 -71% | 11.7 -48% | 10.15 -28% | 7.6 4% | 12.5 -58% |
| Load Average * (Watt) | 29.6 | 19.6 34% | 26 12% | 31 -5% | 25.2 15% | 22.5 24% | 21.4 28% |
| Load Maximum * (Watt) | 30.8 | 19.9 35% | 28.8 6% | 27.4 11% | 29.3 5% | 34.5 -12% | 24.4 21% |
* ... menor é melhor
| Lenovo Ideapad Miix 720-12IKB i7-7500U, HD Graphics 620, 41 Wh | Microsoft Surface Pro 4 Core i7 6650U, Iris Graphics 540, 38 Wh | Asus Transformer 3 Pro T303UA-GN050T 6500U, HD Graphics 520, 39 Wh | Lenovo Miix 510 Pro 80U10006GE 6200U, HD Graphics 520, 50 Wh | Acer Aspire Switch Alpha 12 SA5-271-56HM 6200U, HD Graphics 520, 37 Wh | HP Elite x2 1012 G1 6Y54, HD Graphics 515, 37 Wh | Dell XPS 12 9250 4K 6Y75, HD Graphics 515, 28 Wh | |
|---|---|---|---|---|---|---|---|
| Duração da bateria | -19% | -29% | -3% | -6% | 16% | -31% | |
| Reader / Idle (h) | 11.9 | 10.9 -8% | 7.1 -40% | 11.6 -3% | 10.7 -10% | 12.2 3% | 6.2 -48% |
| WiFi v1.3 (h) | 5.8 | 4.9 -16% | 3.7 -36% | 5.4 -7% | 5.4 -7% | 7.4 28% | 4.1 -29% |
| Load (h) | 1.9 | 1.3 -32% | 1.7 -11% | 1.9 0% | 1.9 0% | 2.2 16% | 1.6 -16% |
| H.264 (h) | 3.4 | 7.8 | 7.2 |
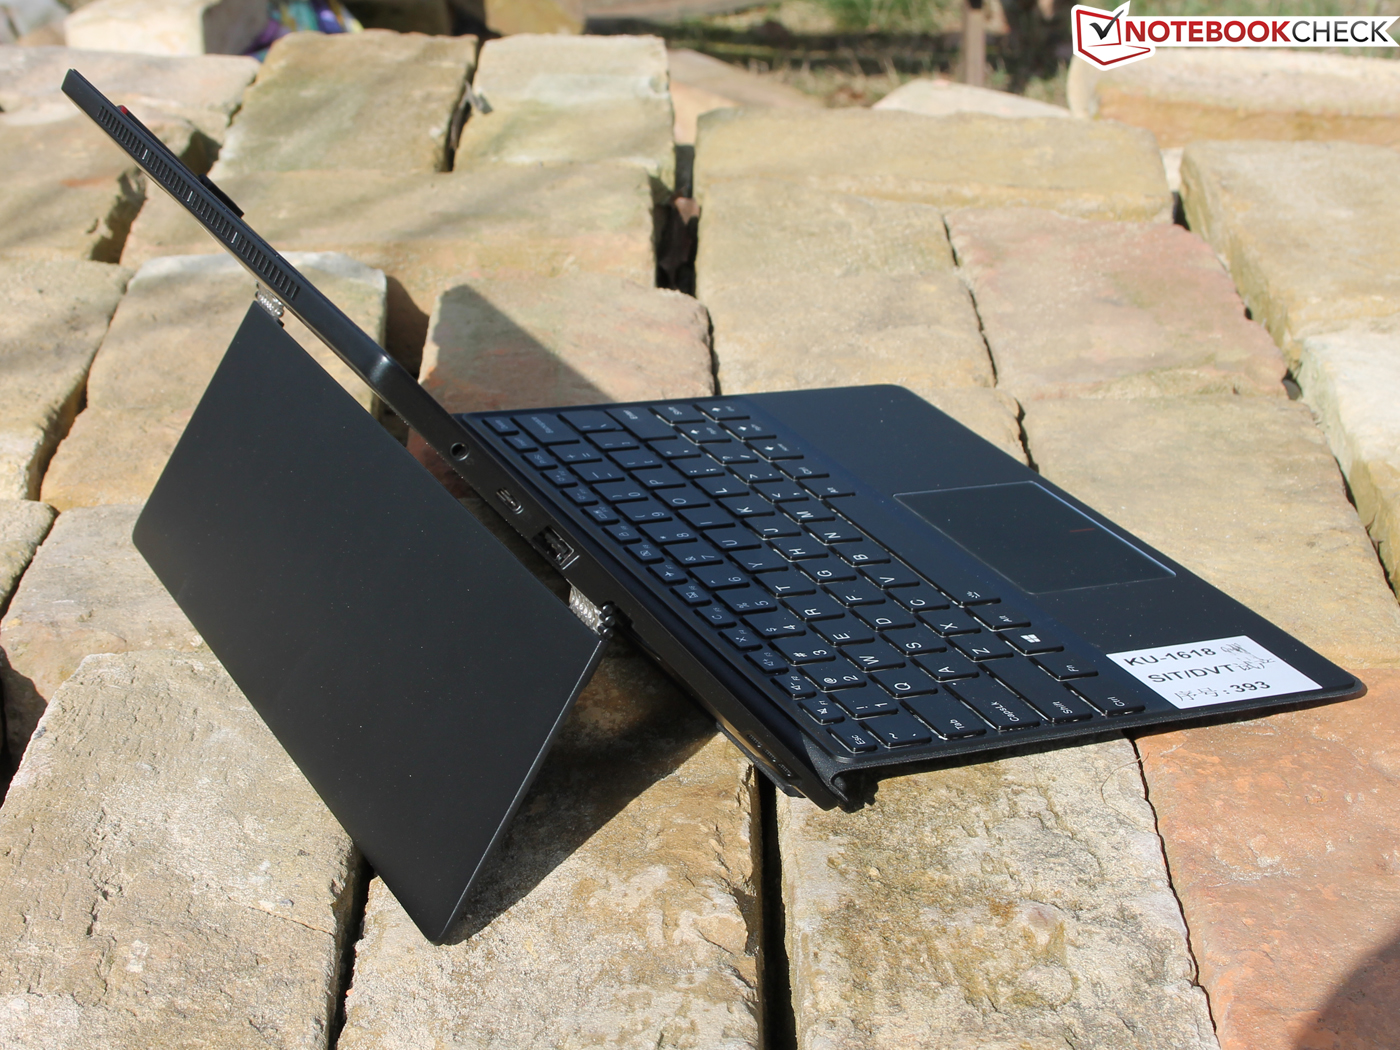
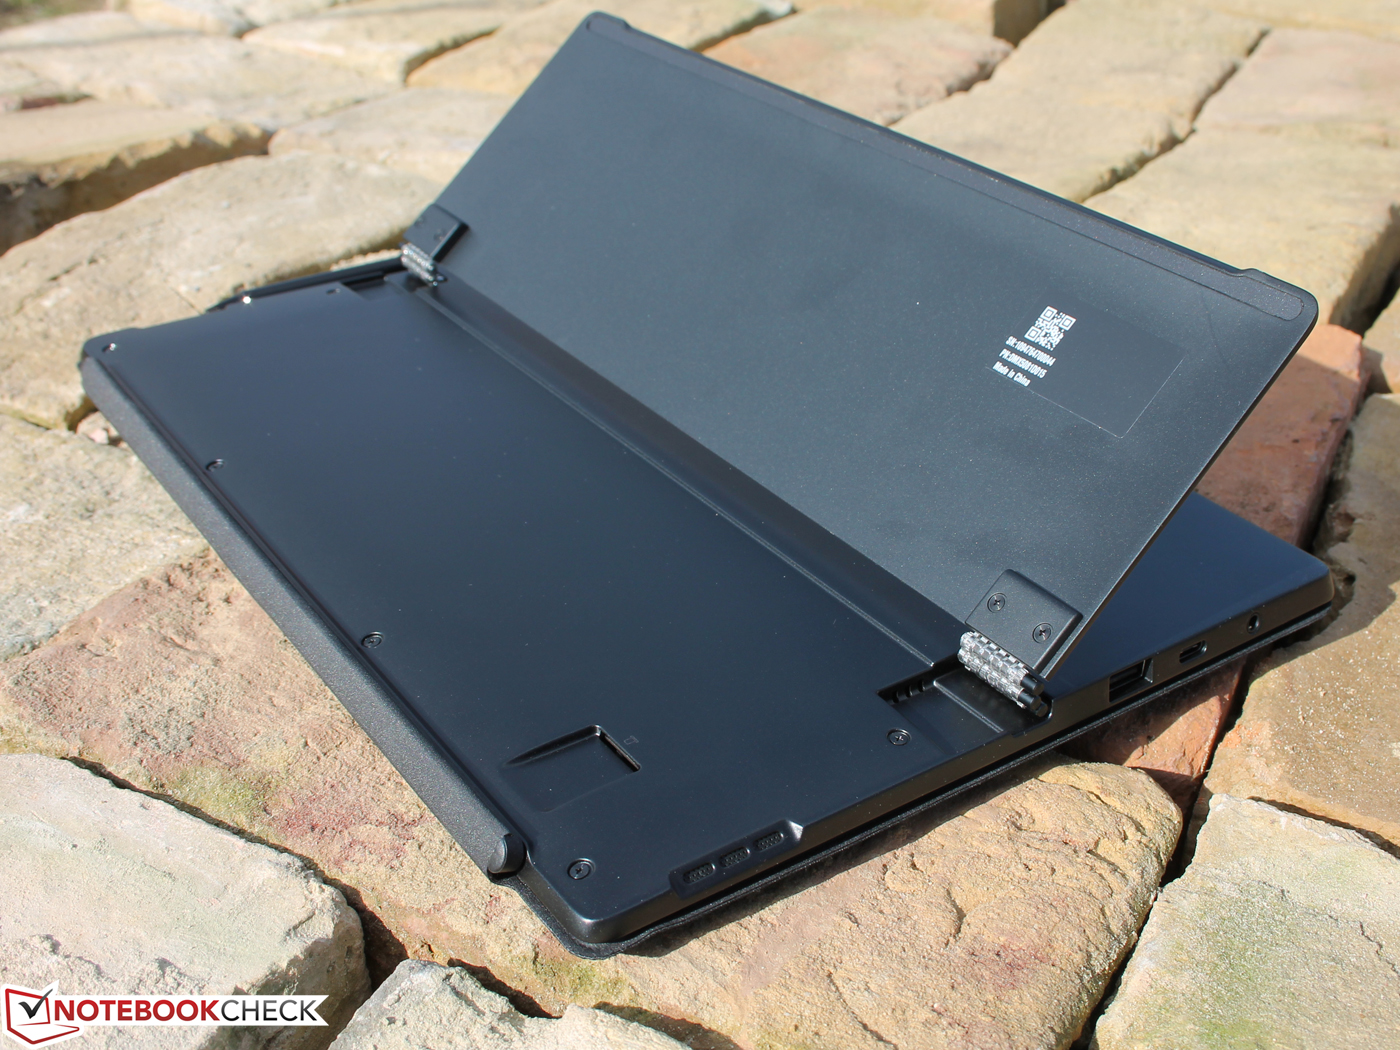
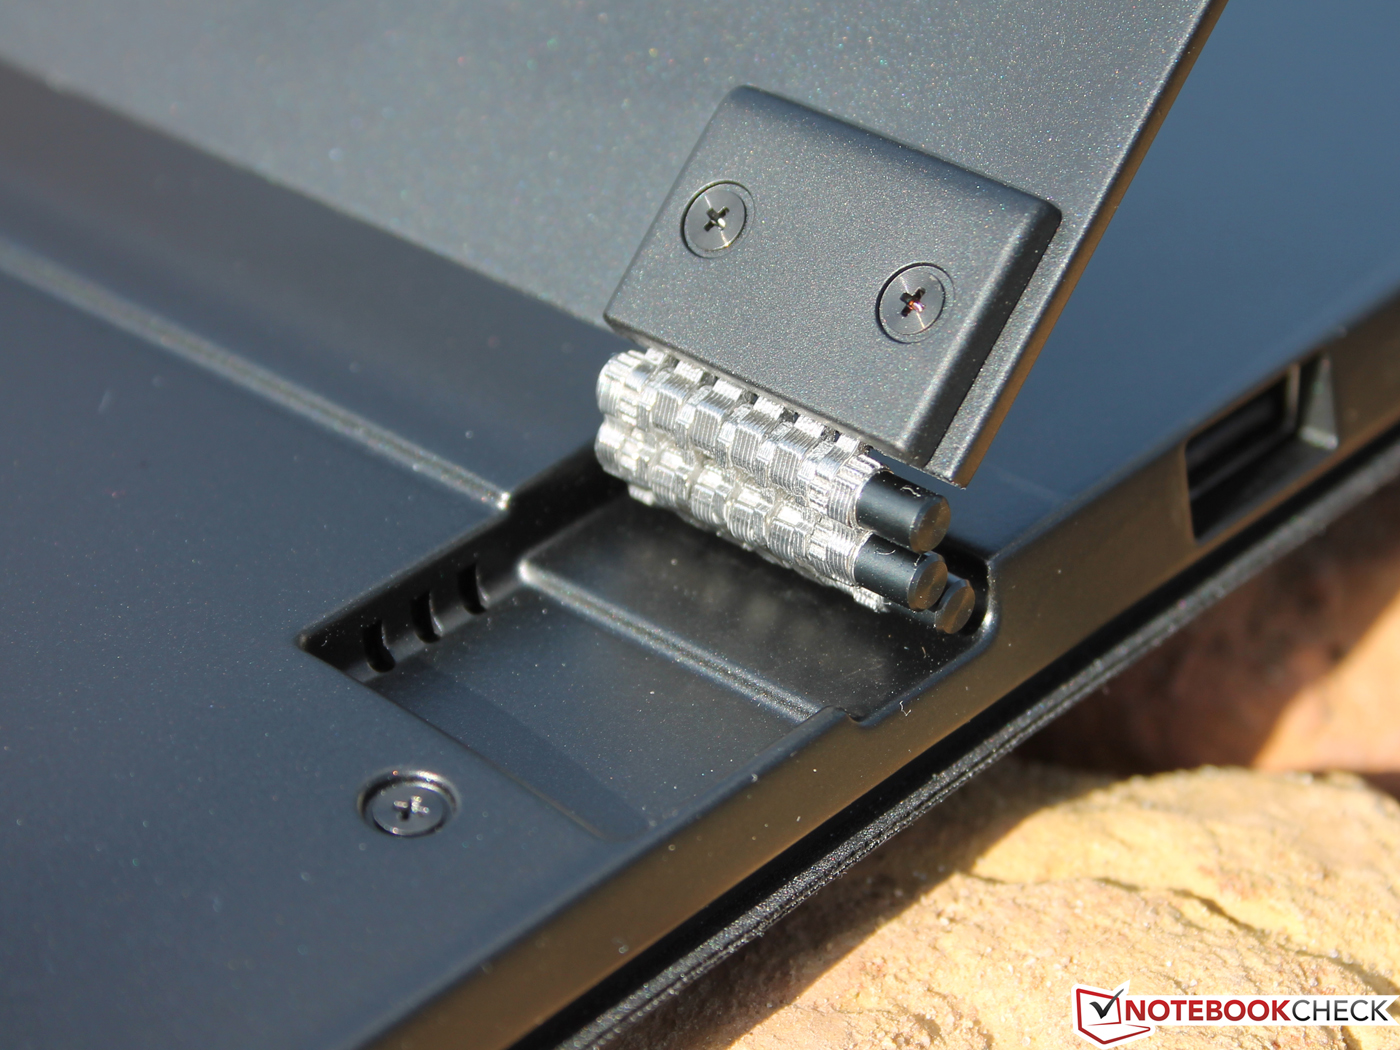
A Lenovo lançou sua resposta ao Surface Pro 4 com o IdeaPad Miix 720, principalmente porque o formato 3: 2 é igual e a alta resolução (2736x1.824 do Surface, 2880x1920 do Miix 720) são quase intercambiáveis. Em termos de tela. não há nada a criticar, exceto pelo espaço de cores talvez, mas isso seria demasiado mesquinho.
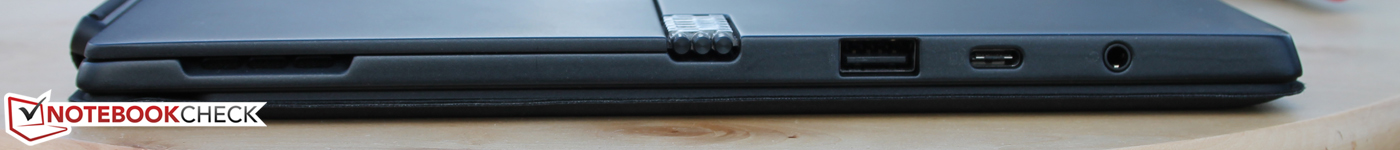
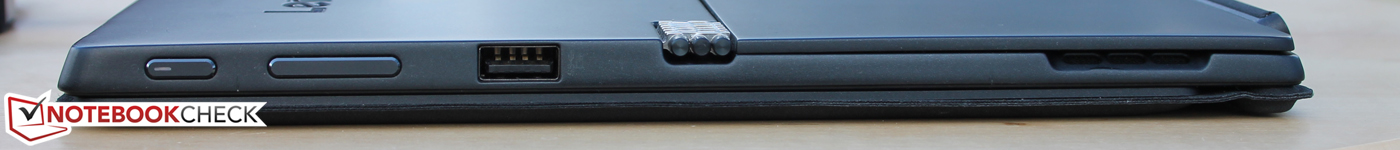
A vantagem do Miix é que está equipado com muitas portas: 2 USB 3.0 Type-A, USB Type-C Gen2 com Thunderbolt 3 e uma câmera IV para o Windows Hello. No lado técnico, um processador Kaby Lake está instalado, além de um enorme SSD RAID, que é muito veloz.
Infelizmente, o miix 720 não consegue utilizar o poder do SoC plenamente, 10% está faltando durante a carga contínua de aplicativos do dia a dia. Isto o coloca no mesmo nível do Surface Pro 4 i7. Inclusive de modelos muito mais acessíveis, como o Aspire Switch Alpha 12 (i5) se espera que seus SoCs Skylake sejam mais velozes ou pelo menos estejam no mesmo nível.
O Switch Alpha 12 com i5 já está disponível a partir de 750 Euros (~$815), o Microsoft Surface Pro 4 + Type Cover (i5-6300U) a partir de 1200 Euros (~$1304). A questão é esta: Por que comprar o Miix 720 quando o desempenho do processador fica atrás das expectativas?
O Miix 720 certamente não é barato: A versão 7500U, 16 GB e SSD de 1TB custa 1700 Euros ($1845). Para a maioria dos usuários com preferências móveis, no entanto, uma versão pequena com 256 ou 128 GB e Core i3 ou i5 7200U também deve bastar. Estes estão disponíveis a partir de 1070 Euros (~$1162).
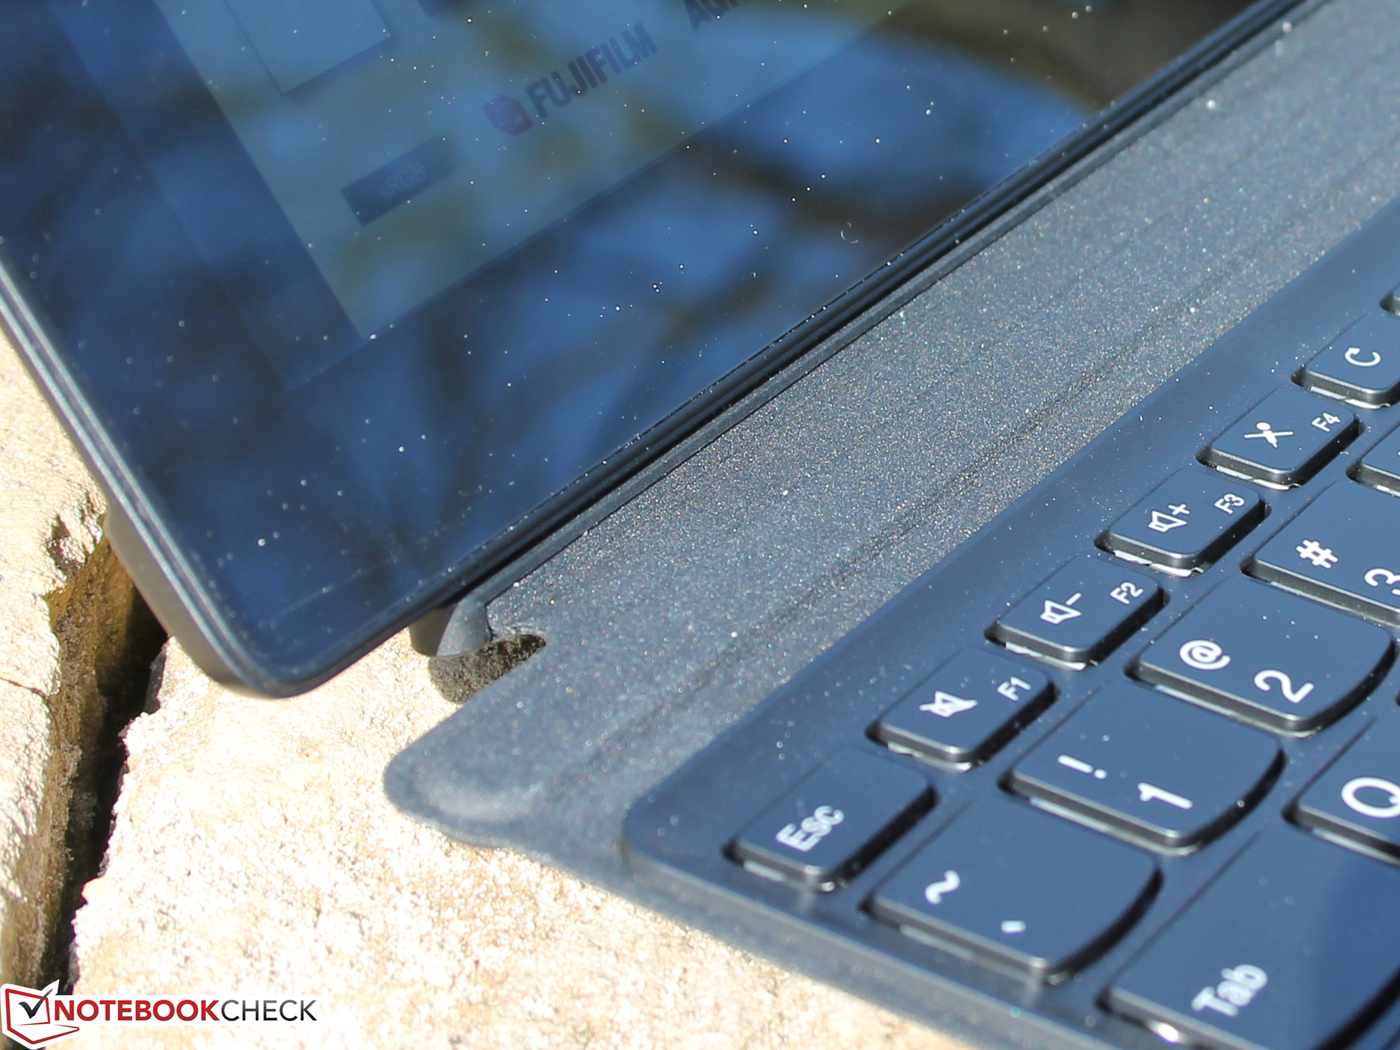
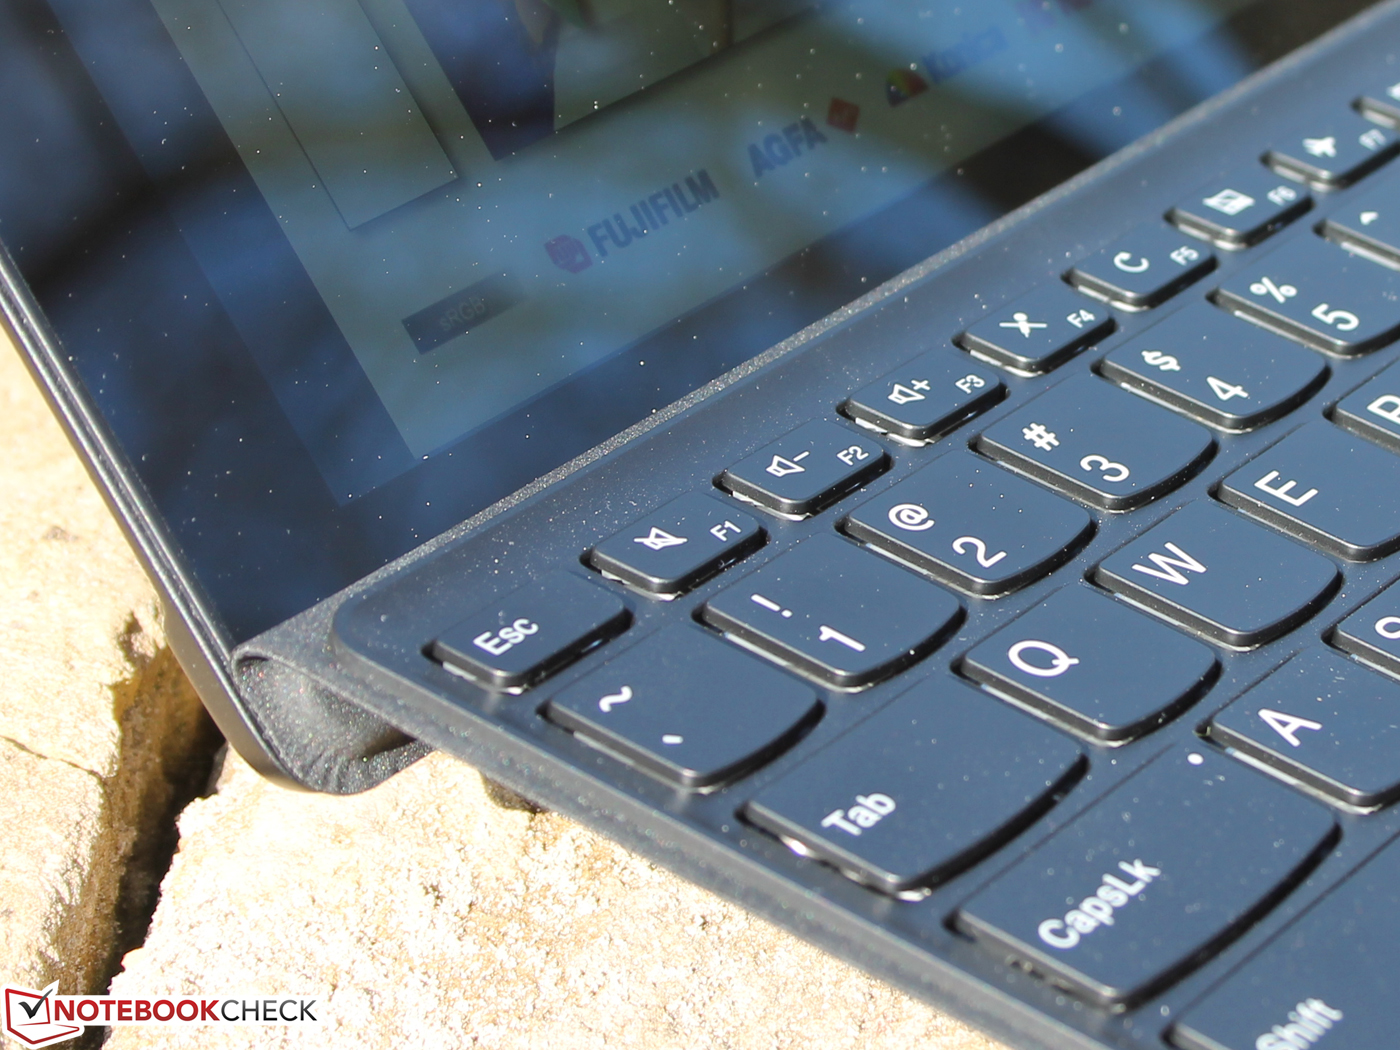
A variante menor é suficiente para desfrutar das vantagens do docking, do Thunderbolt 3, da duração da bateria, da ótima tela, da câmera IV com Windows Hello e do versátil teclado (iluminado). Em breve o preço cairá, com 900 Euros (~$978) pela versão pequena i3 sendo uma oferta competitiva.
Pro
Contra
Lenovo has launched its response to the Surface Pro 4 with the IdeaPad Miix 720, mainly because the 3: 2 aspect ratio is identical and the high resolution (2736x1.824 of the surface, 2880x1920 of the Miix 720) are almost interchangeable. In terms of the display there is nothing to criticize, except for the color space coverage perhaps, but this would be a bit too stingy.
The advantage of the Miix is that it is equipped with so many ports: 2x large USB 3.0 Type-A, USB Type-C Gen2 with Thunderbolt 3 and then an IR camera for Windows Hello. On the technical side, a Kaby Lake processor is installed, plus a huge RAID-SSD, which is very fast-paced.
Unfortunately, the mix 720 cannot fully utilize the power of the SoC, 10% is missing during continuous load of everyday applications. This puts it at the same level as the Surface Pro 4 i7. Even significantly more affordable models such as the Aspire Switch Alpha 12 (i5) expect their Skylake SoCs to be faster or just on par.
The Switch Alpha 12 with i5 is already available from 750 Euros (~$815), the Microsoft Surface Pro 4 + Type Cover (i5-6300U) from 1200 Euros (~$1304). Here is the question: Why buy the Miix 720 when processor performance falls short of expectations?
The Miix 720 is certainly not cheap: The 7500U, 16 GB and 1 TB SSD version costs 1700 Euros ($1845). For most users with mobile preferences, however, a small version with 256 or 128 GB and Core i3 or i5 7200U should also suffice. These are available from 1070 Euros (~$1162).
The smaller variant is enough to enjoy the docking advantages of Thunderbolt 3, the runtime, the great display, the IR camera with Windows Hello and the versatile keyboard (illuminated). Sometime soon the price will fall, with 900 Euros (~$978) for the small i3 version being a competitive offer.
Lenovo Ideapad Miix 720-12IKB
- 03/21/2017 v6 (old)
Sebastian Jentsch