Breve Análise do Conversível Microsoft Surface Pro (2017) (i7, 512 GB, 16 GB)
| |||||||||||||||||||||||||
iluminação: 92 %
iluminação com acumulador: 482 cd/m²
Contraste: 1220:1 (Preto: 0.395 cd/m²)
ΔE ColorChecker Calman: 4 | ∀{0.5-29.43 Ø4.73}
ΔE Greyscale Calman: 5.7 | ∀{0.09-98 Ø4.97}
98.7% sRGB (Calman 2D)
96% sRGB (Argyll 1.6.3 3D)
62% AdobeRGB 1998 (Argyll 1.6.3 3D)
67.8% AdobeRGB 1998 (Argyll 3D)
96.5% sRGB (Argyll 3D)
66.6% Display P3 (Argyll 3D)
Gamma: 2.28
CCT: 7950 K
| Microsoft Surface Pro (2017) i7 LG Display LP123WQ112604, , 2736x1824, 12.3" | Microsoft Surface Pro (2017) i5 LG Display LP123WQ112604, , 2736x1824, 12.3" | Lenovo Ideapad Miix 720-12IKB AUO B120YAN01 / AUO106F, , 2880x1920, 12" | Asus Transformer 3 Pro T303UA-GN050T BOE BOE06AC (NV126A1M-N51), , 2880x1920, 12.6" | Dell Latitude 12 5285 2-in-1 BOE06DC, , 1920x1280, 12.3" | Acer Switch 5 SW512-52-5819 WST KL.1200w.004, , 2160x1440, 12" | Toshiba Portege X30-D (PT274U-01N001) Toshiba TOS508F, , 1920x1080, 13.3" | |
|---|---|---|---|---|---|---|---|
| Display | 2% | -4% | 15% | -5% | -11% | -2% | |
| Display P3 Coverage (%) | 66.6 | 67.6 2% | 65.2 -2% | 81.8 23% | 62.8 -6% | 58.8 -12% | 66.4 0% |
| sRGB Coverage (%) | 96.5 | 99 3% | 91 -6% | 98.3 2% | 94 -3% | 87.5 -9% | 93.5 -3% |
| AdobeRGB 1998 Coverage (%) | 67.8 | 69.1 2% | 66.1 -3% | 82.2 21% | 64.7 -5% | 60.6 -11% | 66.6 -2% |
| Response Times | -15% | -9% | 2% | -19% | -2% | -9% | |
| Response Time Grey 50% / Grey 80% * (ms) | 37 ? | 42 ? -14% | 45 ? -22% | 30 ? 19% | 42.4 ? -15% | 37 ? -0% | 36.8 ? 1% |
| Response Time Black / White * (ms) | 25 ? | 29 ? -16% | 24 ? 4% | 29 ? -16% | 30.8 ? -23% | 26 ? -4% | 29.6 ? -18% |
| PWM Frequency (Hz) | 22130 ? | 21000 | 200 ? | 210.1 ? | |||
| Screen | 10% | -10% | -4% | 0% | -23% | 5% | |
| Brightness middle (cd/m²) | 482 | 417 -13% | 406 -16% | 316 -34% | 523.2 9% | 369 -23% | 332.6 -31% |
| Brightness (cd/m²) | 466 | 401 -14% | 396 -15% | 307 -34% | 522 12% | 331 -29% | 323 -31% |
| Brightness Distribution (%) | 92 | 88 -4% | 88 -4% | 91 -1% | 88 -4% | 75 -18% | 86 -7% |
| Black Level * (cd/m²) | 0.395 | 0.29 27% | 0.3 24% | 0.29 27% | 0.42 -6% | 0.46 -16% | 0.28 29% |
| Contrast (:1) | 1220 | 1438 18% | 1353 11% | 1090 -11% | 1246 2% | 802 -34% | 1188 -3% |
| Colorchecker dE 2000 * | 4 | 3.63 9% | 5.28 -32% | 3.91 2% | 4 -0% | 5.52 -38% | 2.6 35% |
| Colorchecker dE 2000 max. * | 7.2 | 6.74 6% | 9.83 -37% | 7.9 -10% | 8.6 -19% | 9.29 -29% | 6.7 7% |
| Greyscale dE 2000 * | 5.7 | 2.18 62% | 6.71 -18% | 5.37 6% | 5.5 4% | 6.95 -22% | 2.5 56% |
| Gamma | 2.28 96% | 3.09 71% | 2.29 96% | 2.36 93% | 2.16 102% | 2.58 85% | 2.12 104% |
| CCT | 7950 82% | 6767 96% | 6532 100% | 7812 83% | 7546 86% | 7009 93% | 6720 97% |
| Color Space (Percent of AdobeRGB 1998) (%) | 62 | 63 2% | 59 -5% | 72 16% | 64.86 5% | 56 -10% | 62 0% |
| Color Space (Percent of sRGB) (%) | 96 | 99 3% | 91 -5% | 98 2% | 93.97 -2% | 88 -8% | 94 -2% |
| Média Total (Programa/Configurações) | -1% /
5% | -8% /
-8% | 4% /
1% | -8% /
-3% | -12% /
-18% | -2% /
2% |
* ... menor é melhor
Exibir tempos de resposta
| ↔ Tempo de resposta preto para branco | ||
|---|---|---|
| 25 ms ... ascensão ↗ e queda ↘ combinadas | ↗ 13 ms ascensão | 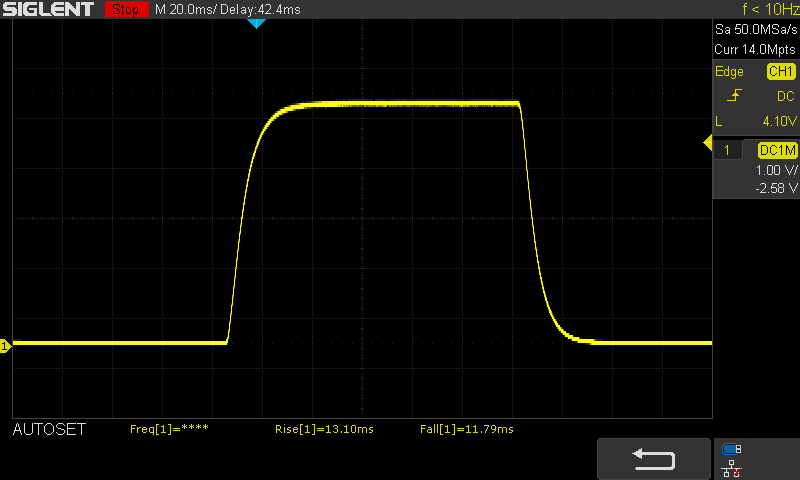 |
| ↘ 12 ms queda | ||
| A tela mostra taxas de resposta relativamente lentas em nossos testes e pode ser muito lenta para os jogadores. Em comparação, todos os dispositivos testados variam de 0.1 (mínimo) a 240 (máximo) ms. » 59 % de todos os dispositivos são melhores. Isso significa que o tempo de resposta medido é pior que a média de todos os dispositivos testados (19.9 ms). | ||
| ↔ Tempo de resposta 50% cinza a 80% cinza | ||
| 37 ms ... ascensão ↗ e queda ↘ combinadas | ↗ 16 ms ascensão | 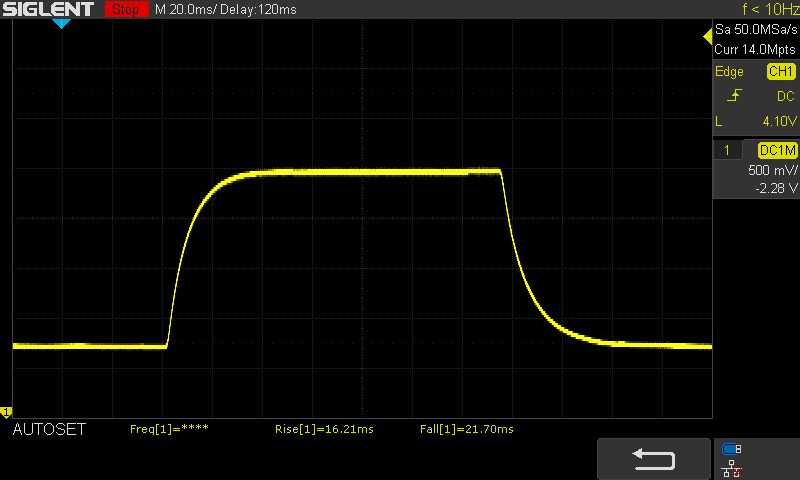 |
| ↘ 21 ms queda | ||
| A tela mostra taxas de resposta lentas em nossos testes e será insatisfatória para os jogadores. Em comparação, todos os dispositivos testados variam de 0.165 (mínimo) a 636 (máximo) ms. » 53 % de todos os dispositivos são melhores. Isso significa que o tempo de resposta medido é pior que a média de todos os dispositivos testados (31.1 ms). | ||
Cintilação da tela / PWM (modulação por largura de pulso)
| Tela tremeluzindo/PWM detectado | 22130 Hz | ≤ 55 % configuração de brilho | 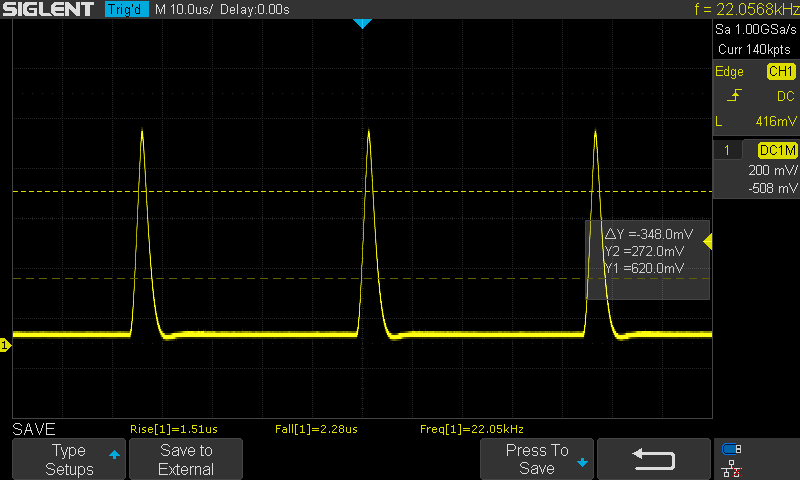 |
A luz de fundo da tela pisca em 22130 Hz (pior caso, por exemplo, utilizando PWM) Cintilação detectada em uma configuração de brilho de 55 % e abaixo. Não deve haver cintilação ou PWM acima desta configuração de brilho. A frequência de 22130 Hz é bastante alta, então a maioria dos usuários sensíveis ao PWM não deve notar nenhuma oscilação. [pwm_comparison] Em comparação: 52 % de todos os dispositivos testados não usam PWM para escurecer a tela. Se PWM foi detectado, uma média de 7784 (mínimo: 5 - máximo: 343500) Hz foi medida. | |||
Cinebench R15 CPU Multi 64 Bit - Surface Pro 2017 i7-7660U cooling fan
Cinebench R15 CPU Multi 64 Bit - Surface Pro 2017 i5-7300U fanless
Cinebench R15 CPU Multi 64 Bit - Switch 5 SW512 i7-7500U Liquid Loop
| PCMark 8 Home Score Accelerated v2 | 4095 pontos | |
| PCMark 8 Creative Score Accelerated v2 | 5540 pontos | |
| PCMark 8 Work Score Accelerated v2 | 4431 pontos | |
| PCMark 10 Score | 3909 pontos | |
Ajuda | ||
| Microsoft Surface Pro (2017) i7 Samsung PM971 KUS040202M | Microsoft Surface Pro (2017) i5 Samsung PM971 KUS030202M | Microsoft Surface Pro 4, Core i5, 128GB Samsung MZFLV128 NVMe | Lenovo Ideapad Miix 720-12IKB Samsung SSD PM961 1TB M.2 PCIe 3.0 x4 NVMe (MZVLW1T0) | Lenovo ThinkPad X1 Tablet Gen 2 Samsung PM961 MZVLW256HEHP | Asus Transformer 3 Pro T303UA-GN050T SK Hynix Canvas SC300 512GB M.2 (HFS512G39MND) | Dell Latitude 12 5285 2-in-1 Samsung PM961 MZVLW256HEHP | Acer Switch 5 SW512-52-5819 Intel SSD 600p SSDPEKKW512G7 | |
|---|---|---|---|---|---|---|---|---|
| CrystalDiskMark 3.0 | -19% | -45% | 90% | 22% | -44% | -5% | 7% | |
| Read Seq (MB/s) | 1308 | 723 -45% | 666 -49% | 2408 84% | 1739 33% | 398.9 -70% | 1294 -1% | 1066 -19% |
| Write Seq (MB/s) | 961 | 853 -11% | 154.2 -84% | 1702 77% | 1259 31% | 402 -58% | 865 -10% | 593 -38% |
| Read 512 (MB/s) | 227.5 | 225 -1% | 266.3 17% | 1301 472% | 698 207% | 303.1 33% | 406 78% | 653 187% |
| Write 512 (MB/s) | 792 | 445 -44% | 154.2 -81% | 1288 63% | 869 10% | 320.3 -60% | 589 -26% | 535 -32% |
| Read 4k (MB/s) | 53.6 | 46 -14% | 28.51 -47% | 53.6 0% | 52.3 -2% | 26.11 -51% | 31.75 -41% | 35.92 -33% |
| Write 4k (MB/s) | 136.3 | 125 -8% | 101.5 -26% | 162.2 19% | 120 -12% | 57.7 -58% | 72.2 -47% | 128.3 -6% |
| Read 4k QD32 (MB/s) | 485.6 | 423 -13% | 368.3 -24% | 504 4% | 247.9 -49% | 245.8 -49% | 493.3 2% | 460.6 -5% |
| Write 4k QD32 (MB/s) | 421.5 | 373 -12% | 153.6 -64% | 420.8 0% | 259 -39% | 253.8 -40% | 434.5 3% | 425.4 1% |

| 3DMark 06 Standard Score | 15071 pontos | |
| 3DMark 11 Performance | 2664 pontos | |
| 3DMark Cloud Gate Standard Score | 8067 pontos | |
| 3DMark Fire Strike Score | 1310 pontos | |
| 3DMark Time Spy Score | 513 pontos | |
Ajuda | ||
| The Witcher 3 - 1024x768 Low Graphics & Postprocessing | |
| Asus Zenbook UX3430UQ-GV012T | |
| Lenovo Ideapad 310-15ISK | |
| Microsoft Surface Pro (2017) i7 | |
| Microsoft Surface Pro (2017) i5 | |
| Rise of the Tomb Raider - 1024x768 Lowest Preset | |
| Microsoft Surface Pro (2017) i7 | |
| Asus X302UV-FN016T | |
| Asus Transformer 3 Pro T303UA-GN050T | |
| Acer Switch 5 SW512-52-5819 | |
| Lenovo Ideapad Miix 720-12IKB | |
| Microsoft Surface Pro (2017) i5 | |
| Deus Ex Mankind Divided - 1280x720 Low Preset AF:1x | |
| Microsoft Surface Pro (2017) i7 | |
| Battlefield 1 - 1280x720 Low Preset | |
| Microsoft Surface Pro (2017) i7 | |
| Huawei MateBook X | |
| Rocket League - 1920x1080 High Quality AA:High FX | |
| Microsoft Surface Pro (2017) i7 | |
| Acer Switch 5 SW512-52-5819 | |
| Warhammer 40.000: Dawn of War III - 1280x720 Minimum / Off (100 % Gameplay Resolution) | |
| Acer TravelMate P658-G2-MG-7327 | |
| Microsoft Surface Pro (2017) i7 | |
| For Honor - 1280x720 Low Preset | |
| Microsoft Surface Pro (2017) i7 | |
| Huawei MateBook X | |
| Farming Simulator 17 - 1920x1080 High Preset AA:2xMS AF:2x | |
| Asus Zenbook UX3430UQ-GV012T | |
| Microsoft Surface Pro (2017) i7 | |
| Huawei MateBook X | |
| The Division - 1280x720 Low Preset AF:1x | |
| Asus X302UV-FN016T | |
| Microsoft Surface Pro (2017) i7 | |
| Rainbow Six Siege - 1366x768 Medium Preset AA:T AF:2x | |
| Asus X302UV-FN016T | |
| Microsoft Surface Pro (2017) i7 | |
| Thief - 1024x768 Very Low Preset | |
| Lenovo Ideapad Miix 720-12IKB | |
| Microsoft Surface Pro (2017) i5 | |
| Diablo III - 1366x768 High AA:on | |
| Asus Zenbook UX3430UQ-GV012T | |
| Asus X302UV-FN016T | |
| baixo | média | alto | ultra | |
|---|---|---|---|---|
| Sims 4 (2014) | 20.8 | |||
| GTA V (2015) | 56.7 | 28.9 | 11.8 | |
| The Witcher 3 (2015) | 21.7 | |||
| Dota 2 Reborn (2015) | 92 | 63.7 | 29.5 | 19.8 |
| Rainbow Six Siege (2015) | 45 (windowed) | 30 (windowed) | 16 (windowed) | |
| Rise of the Tomb Raider (2016) | 23.5 | 16.7 | 9.1 | |
| Far Cry Primal (2016) | 28 | 13 | ||
| The Division (2016) | 24.9 | |||
| Overwatch (2016) | 63.3 | 41 | 15.9 | |
| Deus Ex Mankind Divided (2016) | 20.2 | |||
| Battlefield 1 (2016) | 26.6 | 19.6 | 9.2 | |
| Farming Simulator 17 (2016) | 121 | 91 | 31.6 | 17.8 |
| For Honor (2017) | 33.5 | 12.7 | ||
| Ghost Recon Wildlands (2017) | 16 | |||
| Mass Effect Andromeda (2017) | 20.4 | |||
| Warhammer 40.000: Dawn of War III (2017) | 33.8 | |||
| Prey (2017) | 45.4 | 18.1 | ||
| Rocket League (2017) | 103 | 42.6 | 29.3 | |
| Dirt 4 (2017) | 27 |
Barulho
| Ocioso |
| 29.6 / 29.6 / 29.6 dB |
| Carga |
| 33.4 / 34.1 dB |
 | ||
30 dB silencioso 40 dB(A) audível 50 dB(A) ruidosamente alto |
||
min: | ||
| Microsoft Surface Pro (2017) i7 Iris Plus Graphics 640, i7-7660U, Samsung PM971 KUS040202M | Microsoft Surface Pro 4, Core i5, 128GB HD Graphics 520, 6300U, Samsung MZFLV128 NVMe | Lenovo Ideapad Miix 720-12IKB HD Graphics 620, i7-7500U, Samsung SSD PM961 1TB M.2 PCIe 3.0 x4 NVMe (MZVLW1T0) | Asus Transformer 3 Pro T303UA-GN050T HD Graphics 520, 6500U, SK Hynix Canvas SC300 512GB M.2 (HFS512G39MND) | Dell Latitude 12 5285 2-in-1 HD Graphics 620, i7-7600U, Samsung PM961 MZVLW256HEHP | Toshiba Portege X30-D (PT274U-01N001) HD Graphics 620, i7-7600U, Samsung PM961 MZVLW256HEHP | |
|---|---|---|---|---|---|---|
| Emissions | ||||||
| Fan Noise (dB(A)) | 36.3 | 37.1 | 38.4 | |||
| Noise | -12% | -6% | -6% | 5% | 1% | |
| desligado / ambiente * (dB) | 29.6 | 30.4 -3% | 30.7 -4% | 28.2 5% | 28.4 4% | |
| Idle Minimum * (dB) | 29.6 | 31.5 -6% | 30.4 -3% | 30.7 -4% | 28.2 5% | 28.4 4% |
| Idle Average * (dB) | 29.6 | 31.5 -6% | 32.4 -9% | 30.7 -4% | 28.2 5% | 28.4 4% |
| Idle Maximum * (dB) | 29.6 | 31.5 -6% | 32.4 -9% | 30.7 -4% | 28.2 5% | 28.4 4% |
| Load Average * (dB) | 33.4 | 40.5 -21% | 36 -8% | 37 -11% | 30.4 9% | 33.2 1% |
| Witcher 3 ultra * (dB) | 33.4 | |||||
| Load Maximum * (dB) | 34.1 | 40.7 -19% | 36.3 -6% | 37.1 -9% | 34 -0% | 37.9 -11% |
| Média Total (Programa/Configurações) | -12% /
-12% | -6% /
-6% | -6% /
-6% | 5% /
5% | 1% /
1% |
* ... menor é melhor
(±) A temperatura máxima no lado superior é 42 °C / 108 F, em comparação com a média de 35.4 °C / 96 F , variando de 19.6 a 60 °C para a classe Convertible.
(±) A parte inferior aquece até um máximo de 42 °C / 108 F, em comparação com a média de 36.9 °C / 98 F
(+) Em uso inativo, a temperatura média para o lado superior é 28.6 °C / 83 F, em comparação com a média do dispositivo de 30.3 °C / ### class_avg_f### F.
(±) Os apoios para as mãos e o touchpad podem ficar muito quentes ao toque, com um máximo de 38 °C / 100.4 F.
(-) A temperatura média da área do apoio para as mãos de dispositivos semelhantes foi 28 °C / 82.4 F (-10 °C / -18 F).
| desligado | |
| Ocioso | |
| Carga |
|
Key:
min: | |
| Microsoft Surface Pro (2017) i7 i7-7660U, Iris Plus Graphics 640, Samsung PM971 KUS040202M, IPS, 2736x1824, 12.3" | Microsoft Surface Pro (2017) i5 i5-7300U, HD Graphics 620, Samsung PM971 KUS030202M, IPS, 2736x1824, 12.3" | Microsoft Surface Pro 4, Core i5, 128GB 6300U, HD Graphics 520, Samsung MZFLV128 NVMe, IPS, 2736x1824, 12.3" | Lenovo Ideapad Miix 720-12IKB i7-7500U, HD Graphics 620, Samsung SSD PM961 1TB M.2 PCIe 3.0 x4 NVMe (MZVLW1T0), IPS, 2880x1920, 12" | Asus Transformer 3 Pro T303UA-GN050T 6500U, HD Graphics 520, SK Hynix Canvas SC300 512GB M.2 (HFS512G39MND), IPS, 2880x1920, 12.6" | Dell Latitude 12 5285 2-in-1 i7-7600U, HD Graphics 620, Samsung PM961 MZVLW256HEHP, IPS, 1920x1280, 12.3" | Acer Switch 5 SW512-52-5819 i7-7500U, HD Graphics 620, Intel SSD 600p SSDPEKKW512G7, IPS, 2160x1440, 12" | Huawei MateBook X i5-7200U, HD Graphics 620, LITEON CB1-SD256, , 2160x1440, 13.3" | |
|---|---|---|---|---|---|---|---|---|
| Power Consumption | 27% | 24% | 24% | -3% | 24% | 23% | -3% | |
| Idle Minimum * (Watt) | 4.2 | 3.6 14% | 4.4 -5% | 3.5 17% | 6.7 -60% | 2.85 32% | 3.86 8% | 4.6 -10% |
| Idle Average * (Watt) | 10.1 | 8.1 20% | 9 11% | 7.2 29% | 10.3 -2% | 6.76 33% | 6.4 37% | 11 -9% |
| Idle Maximum * (Watt) | 14 | 8.7 38% | 10.7 24% | 7.9 44% | 13.5 4% | 6.91 51% | 7.17 49% | 12 14% |
| Load Average * (Watt) | 37.4 | 25.5 32% | 19.6 48% | 29.6 21% | 26 30% | 32.88 12% | 30.5 18% | 39.5 -6% |
| Witcher 3 ultra * (Watt) | 38.1 | |||||||
| Load Maximum * (Watt) | 34 | 23.5 31% | 19.9 41% | 30.8 9% | 28.8 15% | 37.41 -10% | 32.4 5% | 34.6 -2% |
* ... menor é melhor
| Microsoft Surface Pro (2017) i7 i7-7660U, Iris Plus Graphics 640, 45 Wh | Microsoft Surface Pro (2017) i5 i5-7300U, HD Graphics 620, 45 Wh | Microsoft Surface Pro 4, Core i5, 128GB 6300U, HD Graphics 520, 38 Wh | Lenovo Ideapad Miix 720-12IKB i7-7500U, HD Graphics 620, 41 Wh | Lenovo ThinkPad X1 Tablet Gen 2 i5-7Y54, HD Graphics 615, 37 Wh | Asus Transformer 3 Pro T303UA-GN050T 6500U, HD Graphics 520, 39 Wh | Dell Latitude 12 5285 2-in-1 i7-7600U, HD Graphics 620, 42 Wh | Acer Switch 5 SW512-52-5819 i7-7500U, HD Graphics 620, Wh | Huawei MateBook X i5-7200U, HD Graphics 620, 40 Wh | |
|---|---|---|---|---|---|---|---|---|---|
| Duração da bateria | 49% | -7% | -15% | 3% | -44% | -3% | -22% | 5% | |
| H.264 (h) | 10.2 | 3.4 -67% | |||||||
| WiFi v1.3 (h) | 8.2 | 12.4 51% | 7.1 -13% | 5.8 -29% | 7.4 -10% | 3.7 -55% | 8.1 -1% | 5.9 -28% | 5.6 -32% |
| Witcher 3 ultra (h) | 1.9 | ||||||||
| Load (h) | 1.9 | 2.8 47% | 1.9 0% | 1.9 0% | 2.2 16% | 1.7 -11% | 1.8 -5% | 1.6 -16% | 2.7 42% |
| Reader / Idle (h) | 17.6 | 15 | 11.9 | 11 | 7.1 | 17.9 | 11.9 | 8.5 |
Pro
Contra
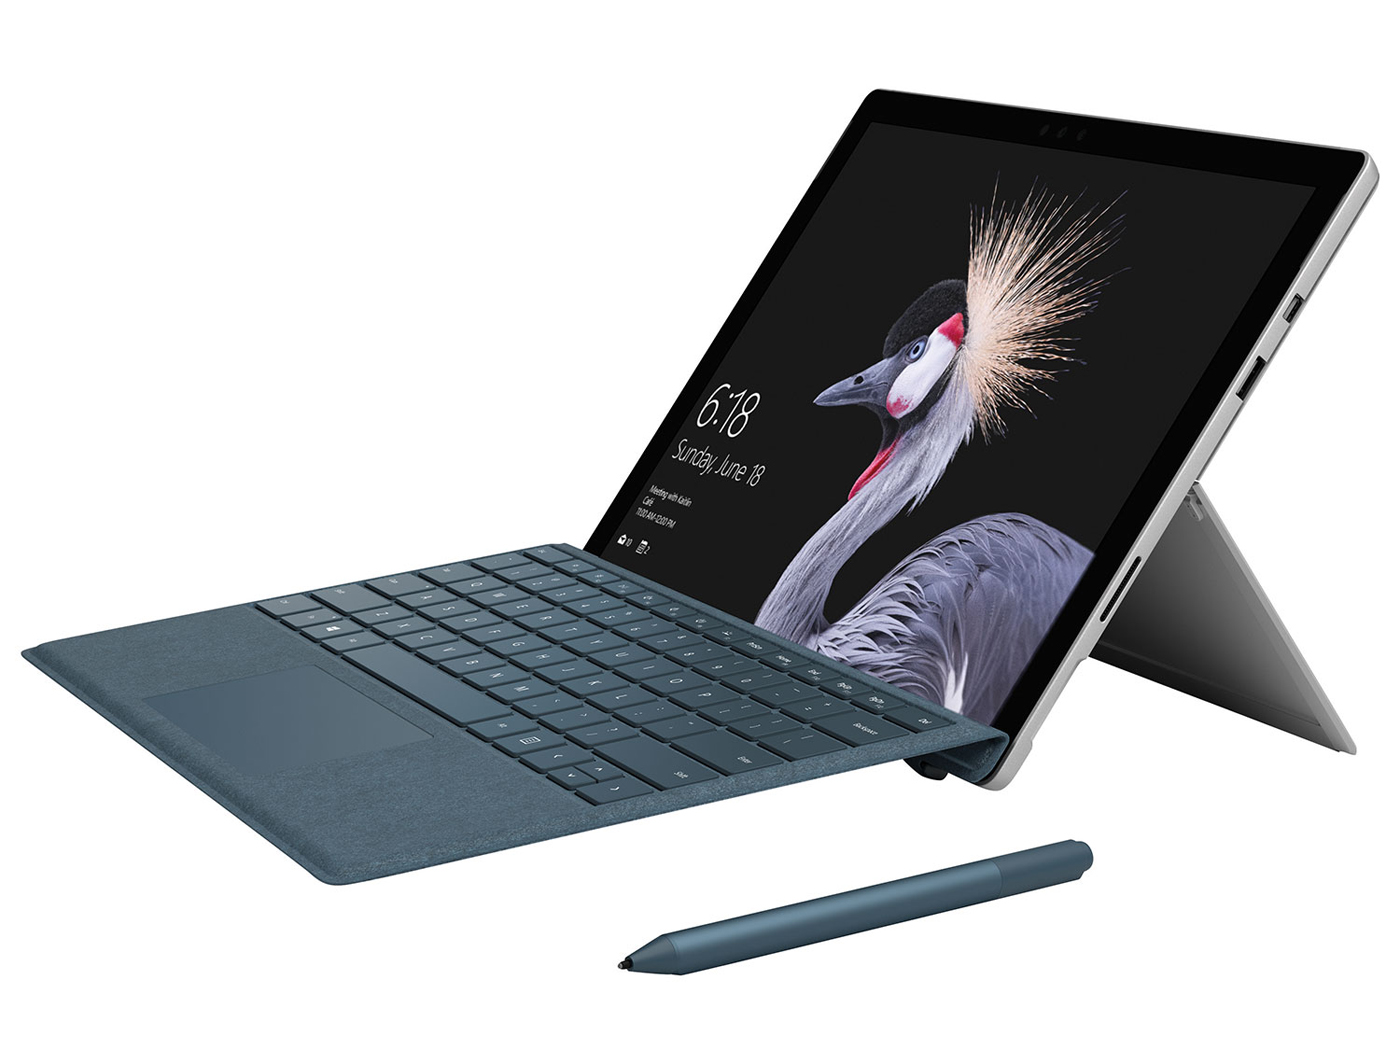
Com o Surface Pro i7 2017, a Microsoft criou um tablet conversível que cumpre muitas, mas nem todas, suas promessas. O acabamento, a tela e a duração da bateria são, sem dúvida, são de última geração. Seus concorrentes, como o Acer Switch 5, não podem manter o nível aqui.
Olhando para o tablet como um possível substituto de portátil, encontramos afogamentos similares como na versão i5 (sem ventoinha). Mas não foi tão ruim (-17% na primeira rodada do i7 vs. -33% no i5). No entanto, o afogamento se torna notório no PCMarks: O Surface Pro i7 (2017) não está no topo do seu campo de comparação com conversíveis da Acer e Dell, superando com facilidade o Surface Pro de gama alta.
No entanto, damos ao Surface Pro i7 uma boa avaliação de 90%, porque o desempenho (os pontos subtraídos são por causa do afogamento) é apenas um dos muitos aspectos que consideramos em nossas análises. O ruído do sistema é baixo, apesar de ter um sistema de resfriamento, e a ventoinha é desativada durante o modo inativo. O aparelho possui bons alto-falantes e os dispositivos de entrada, ou melhor, o Type Cover, são extremamente bons para um conversível.
Alternativas
O Dell Latitude 12 5285 oferece desempenho similar com menos afogamento (-9%). A tela é da mesma qualidade (brilho, contraste, distribuição do brilho), mas tem apenas em Full HD. Mas o aparelho da Dell esquenta bastante.
O mesmo pode ser dito do Acer Switch 5 SW512-52, do qual o desempenho cai apenas 9% e, portanto não pode ser considerado um afogamento. Mas a sua duração é consideravelmente mais baixa, com seis horas. A tela não pode acompanhar a do Surface Pro, nem a do Latitude 12 5285, apesar de ter 2160x1440 pixels.
Se você está procurando durações de 10 horas, deve considerar a versão i5 ou mesmo a versão Core M do novo Surface Pro 2017. Se o SoC não pode lidar com a carga constante de qualquer maneira, por que não comprar o modelo Core M mais barato? Ele provavelmente superará a duração Wi-Fi de 12,5 horas do modelo i5 com facilidade. Atualmente, estamos testando o aparelho e atualizaremos com nossos resultados.
Microsoft Surface Pro (2017) i7
- 07/21/2017 v6 (old)
Sebastian Jentsch