Breve Análise do Portátil Dell Inspiron 13 7370 (i5-8250U)

| SD Card Reader | |
| average JPG Copy Test (av. of 3 runs) | |
| Toshiba Tecra X40-D | |
| Dell Inspiron 13 7370 (Toshiba Exceria Pro SDXC 64 GB UHS-II) | |
| maximum AS SSD Seq Read Test (1GB) | |
| Toshiba Tecra X40-D | |
| Dell Inspiron 13 7370 (Toshiba Exceria Pro SDXC 64 GB UHS-II) | |
| Networking | |
| iperf3 transmit AX12 | |
| Dell Inspiron 13 7370 | |
| HP Spectre 13-v131ng | |
| Microsoft Surface Laptop i5 | |
| Toshiba Tecra X40-D | |
| iperf3 receive AX12 | |
| Toshiba Tecra X40-D | |
| Microsoft Surface Laptop i5 | |
| Dell Inspiron 13 7370 | |
| HP Spectre 13-v131ng | |
| |||||||||||||||||||||||||
iluminação: 87 %
iluminação com acumulador: 246 cd/m²
Contraste: 912:1 (Preto: 0.33 cd/m²)
ΔE ColorChecker Calman: 5.39 | ∀{0.5-29.43 Ø4.71}
ΔE Greyscale Calman: 5.93 | ∀{0.09-98 Ø4.96}
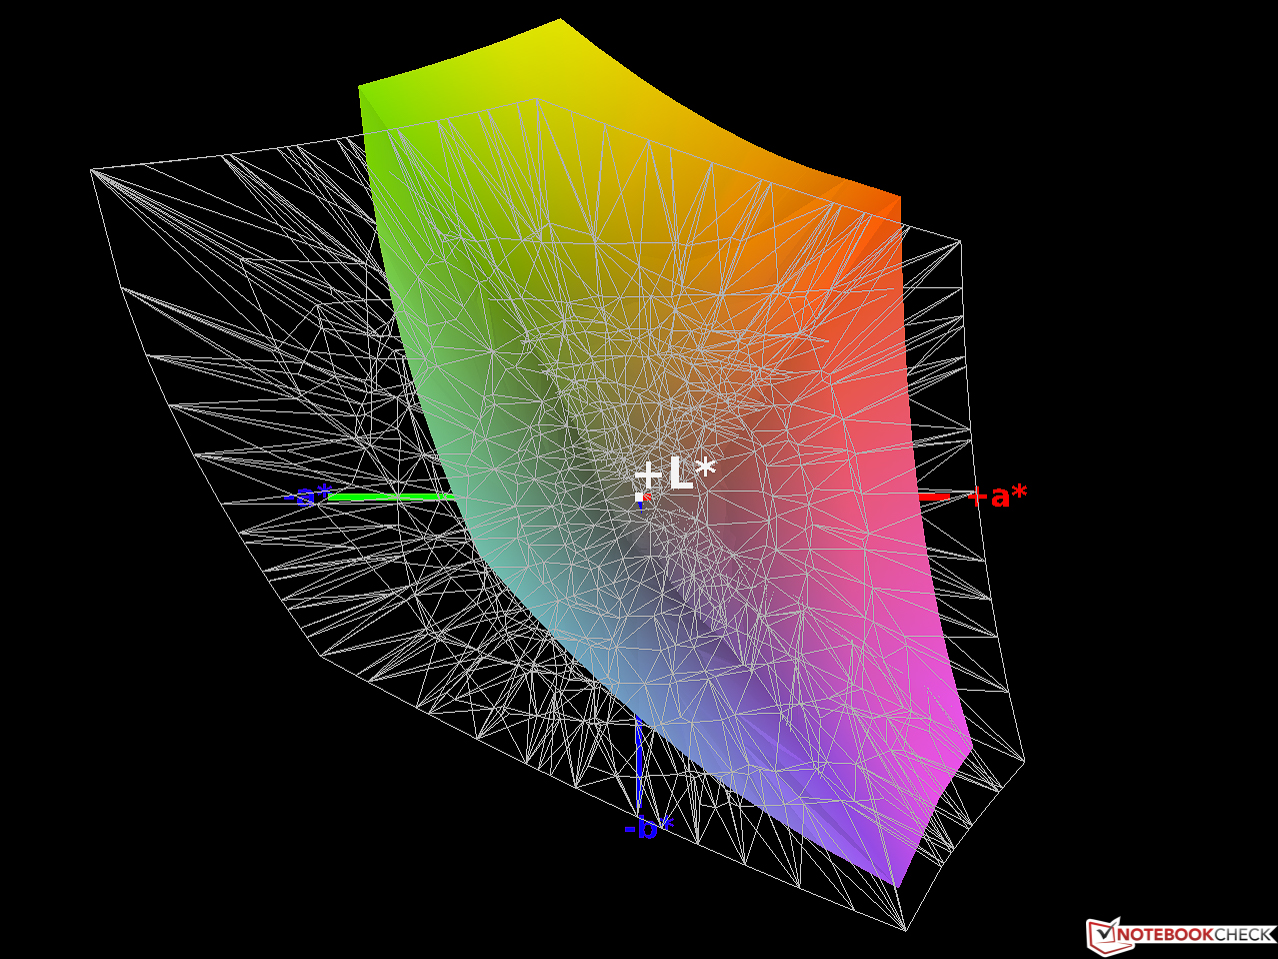
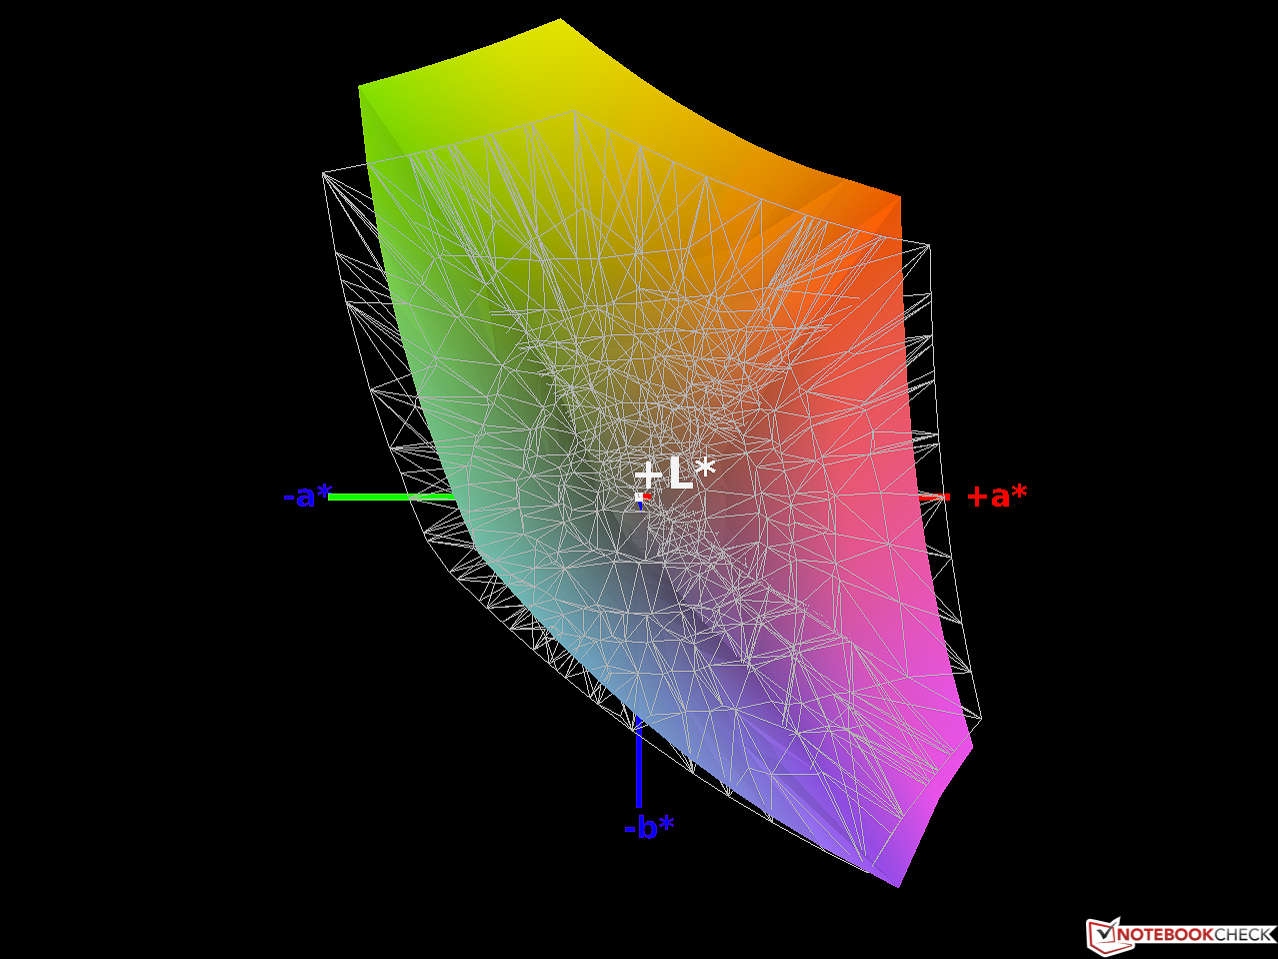
86% sRGB (Argyll 1.6.3 3D)
56% AdobeRGB 1998 (Argyll 1.6.3 3D)
63% AdobeRGB 1998 (Argyll 3D)
86.2% sRGB (Argyll 3D)
66.7% Display P3 (Argyll 3D)
Gamma: 2.6
CCT: 6358 K
| Dell Inspiron 13 7370 BOE071A / NV13FHM / Dell G64PY, , 1920x1080, 13.3" | HP Spectre 13-v131ng CMN1374, , 1920x1080, 13.3" | Toshiba Tecra X40-D Toshiba TOS508F, , 1920x1080, 14" | Microsoft Surface Laptop i5 ID: MEI96A2, Name: Panasonic VVX14T092N00, , 2256x1504, 13.5" | |
|---|---|---|---|---|
| Display | 1% | -34% | 7% | |
| Display P3 Coverage (%) | 66.7 | 64.6 -3% | 40.55 -39% | 67.8 2% |
| sRGB Coverage (%) | 86.2 | 88.8 3% | 61 -29% | 94.3 9% |
| AdobeRGB 1998 Coverage (%) | 63 | 64.8 3% | 41.89 -34% | 69.5 10% |
| Response Times | 0% | 18% | -12% | |
| Response Time Grey 50% / Grey 80% * (ms) | 46 ? | 46 ? -0% | 38 ? 17% | 50.8 ? -10% |
| Response Time Black / White * (ms) | 33 ? | 33 ? -0% | 26.8 ? 19% | 37.2 ? -13% |
| PWM Frequency (Hz) | 201 ? | 20410 ? | ||
| Screen | 8% | -17% | 29% | |
| Brightness middle (cd/m²) | 301 | 404 34% | 283.9 -6% | 384.2 28% |
| Brightness (cd/m²) | 291 | 382 31% | 261 -10% | 378 30% |
| Brightness Distribution (%) | 87 | 91 5% | 85 -2% | 90 3% |
| Black Level * (cd/m²) | 0.33 | 0.35 -6% | 0.25 24% | 0.36 -9% |
| Contrast (:1) | 912 | 1154 27% | 1136 25% | 1067 17% |
| Colorchecker dE 2000 * | 5.39 | 5.37 -0% | 6.4 -19% | 1.8 67% |
| Colorchecker dE 2000 max. * | 8.56 | 9.46 -11% | 18.7 -118% | 4.2 51% |
| Greyscale dE 2000 * | 5.93 | 6.44 -9% | 6.3 -6% | 1.2 80% |
| Gamma | 2.6 85% | 2.52 87% | 2.39 92% | 2.21 100% |
| CCT | 6358 102% | 6738 96% | 6511 100% | 6708 97% |
| Color Space (Percent of AdobeRGB 1998) (%) | 56 | 58 4% | 38 -32% | 63.7 14% |
| Color Space (Percent of sRGB) (%) | 86 | 89 3% | 60 -30% | 94.2 10% |
| Média Total (Programa/Configurações) | 3% /
5% | -11% /
-16% | 8% /
19% |
* ... menor é melhor
Exibir tempos de resposta
| ↔ Tempo de resposta preto para branco | ||
|---|---|---|
| 33 ms ... ascensão ↗ e queda ↘ combinadas | ↗ 17 ms ascensão | 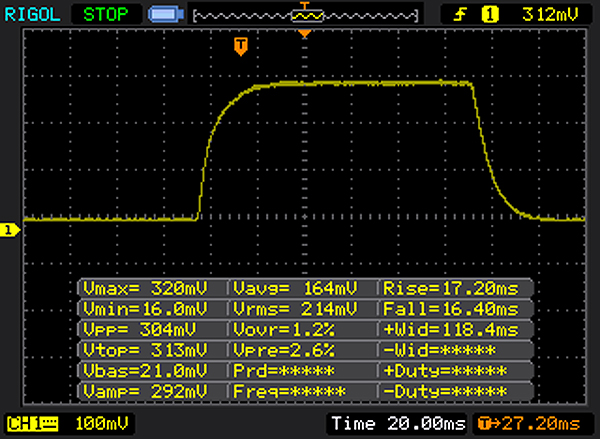 |
| ↘ 16 ms queda | ||
| A tela mostra taxas de resposta lentas em nossos testes e será insatisfatória para os jogadores. Em comparação, todos os dispositivos testados variam de 0.1 (mínimo) a 240 (máximo) ms. » 89 % de todos os dispositivos são melhores. Isso significa que o tempo de resposta medido é pior que a média de todos os dispositivos testados (19.8 ms). | ||
| ↔ Tempo de resposta 50% cinza a 80% cinza | ||
| 46 ms ... ascensão ↗ e queda ↘ combinadas | ↗ 21 ms ascensão | 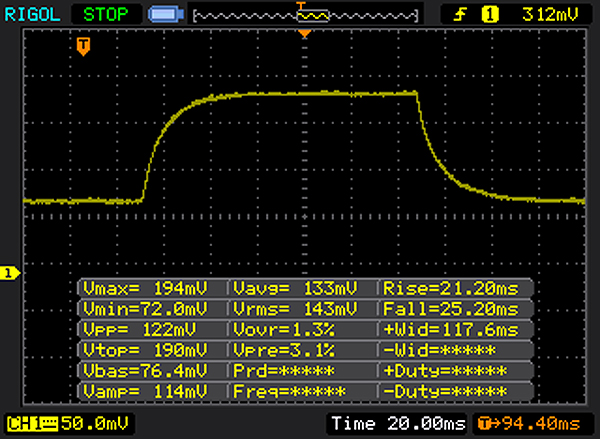 |
| ↘ 25 ms queda | ||
| A tela mostra taxas de resposta lentas em nossos testes e será insatisfatória para os jogadores. Em comparação, todos os dispositivos testados variam de 0.165 (mínimo) a 636 (máximo) ms. » 79 % de todos os dispositivos são melhores. Isso significa que o tempo de resposta medido é pior que a média de todos os dispositivos testados (31 ms). | ||
Cintilação da tela / PWM (modulação por largura de pulso)
| Tela tremeluzindo/PWM detectado | 201 Hz | ≤ 90 % configuração de brilho | 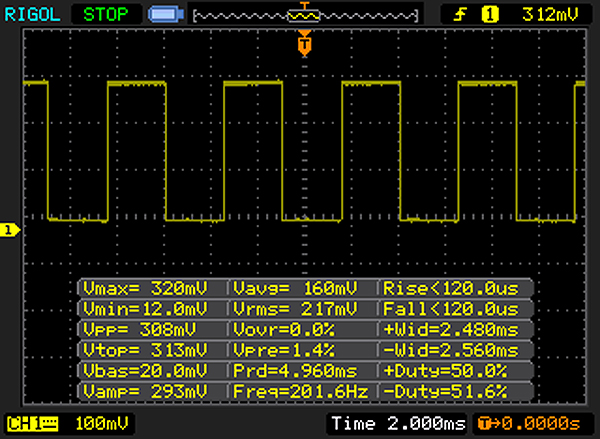 |
A luz de fundo da tela pisca em 201 Hz (pior caso, por exemplo, utilizando PWM) Cintilação detectada em uma configuração de brilho de 90 % e abaixo. Não deve haver cintilação ou PWM acima desta configuração de brilho. A frequência de 201 Hz é relativamente baixa, portanto, usuários sensíveis provavelmente notarão cintilação e sentirão fadiga ocular na configuração de brilho indicada e abaixo. [pwm_comparison] Em comparação: 52 % de todos os dispositivos testados não usam PWM para escurecer a tela. Se PWM foi detectado, uma média de 7754 (mínimo: 5 - máximo: 343500) Hz foi medida. | |||
| Cinebench R15 | |
| CPU Single 64Bit | |
| Toshiba Tecra X40-D | |
| Dell Inspiron 13 7370 | |
| HP Spectre 13-v131ng | |
| Microsoft Surface Laptop i5 | |
| CPU Multi 64Bit | |
| Dell Inspiron 13 7370 | |
| Toshiba Tecra X40-D | |
| Microsoft Surface Laptop i5 | |
| HP Spectre 13-v131ng | |
| PCMark 8 | |
| Home Score Accelerated v2 | |
| Dell Inspiron 13 7370 | |
| HP Spectre 13-v131ng | |
| Toshiba Tecra X40-D | |
| Microsoft Surface Laptop i5 | |
| Work Score Accelerated v2 | |
| HP Spectre 13-v131ng | |
| Toshiba Tecra X40-D | |
| Dell Inspiron 13 7370 | |
| Microsoft Surface Laptop i5 | |
| PCMark 8 Home Score Accelerated v2 | 3902 pontos | |
| PCMark 8 Work Score Accelerated v2 | 4786 pontos | |
Ajuda | ||
| Dell Inspiron 13 7370 Micron 1100 MTFDDAV256TBN | HP Spectre 13-v131ng Samsung PM961 NVMe MZVLW512HMJP | Microsoft Surface Laptop i5 Toshiba THNSN0128GTYA | |
|---|---|---|---|
| CrystalDiskMark 3.0 | 153% | -40% | |
| Read Seq (MB/s) | 476.8 | 1090 129% | 425.6 -11% |
| Write Seq (MB/s) | 458.3 | 1088 137% | 128.2 -72% |
| Read 512 (MB/s) | 351 | 753 115% | 278.5 -21% |
| Write 512 (MB/s) | 298.2 | 911 205% | 126.7 -58% |
| Read 4k (MB/s) | 20.79 | 57.5 177% | 22.15 7% |
| Write 4k (MB/s) | 65.8 | 140.2 113% | 40.45 -39% |
| Read 4k QD32 (MB/s) | 172.8 | 497.1 188% | 77.8 -55% |
| Write 4k QD32 (MB/s) | 160.3 | 416 160% | 41.18 -74% |

| 3DMark 11 - 1280x720 Performance GPU | |
| Dell Inspiron 13 7370 | |
| Toshiba Tecra X40-D | |
| HP Spectre 13-v131ng | |
| Microsoft Surface Laptop i5 | |
| 3DMark | |
| 1280x720 Cloud Gate Standard Graphics | |
| Dell Inspiron 13 7370 | |
| Toshiba Tecra X40-D | |
| HP Spectre 13-v131ng | |
| Microsoft Surface Laptop i5 | |
| 1920x1080 Fire Strike Graphics | |
| Dell Inspiron 13 7370 | |
| Toshiba Tecra X40-D | |
| HP Spectre 13-v131ng | |
| Microsoft Surface Laptop i5 | |
| 3DMark 11 Performance | 1935 pontos | |
| 3DMark Cloud Gate Standard Score | 8527 pontos | |
| 3DMark Fire Strike Score | 1059 pontos | |
Ajuda | ||
| baixo | média | alto | ultra | |
|---|---|---|---|---|
| Rise of the Tomb Raider (2016) | 21.1 | |||
| Deus Ex Mankind Divided (2016) | 16.8 | |||
| Farming Simulator 17 (2016) | 95.9 | 63.3 | 25.4 |
Barulho
| Ocioso |
| 30.3 / 30.3 / 30.3 dB |
| Carga |
| 33.6 / 36.8 dB |
 | ||
30 dB silencioso 40 dB(A) audível 50 dB(A) ruidosamente alto |
||
min: | ||
(±) A temperatura máxima no lado superior é 41.1 °C / 106 F, em comparação com a média de 34.3 °C / 94 F , variando de 21.2 a 62.5 °C para a classe Office.
(-) A parte inferior aquece até um máximo de 47.6 °C / 118 F, em comparação com a média de 36.8 °C / 98 F
(+) Em uso inativo, a temperatura média para o lado superior é 26.2 °C / 79 F, em comparação com a média do dispositivo de 29.5 °C / ### class_avg_f### F.
(+) Os apoios para as mãos e o touchpad são mais frios que a temperatura da pele, com um máximo de 30 °C / 86 F e, portanto, são frios ao toque.
(-) A temperatura média da área do apoio para as mãos de dispositivos semelhantes foi 27.5 °C / 81.5 F (-2.5 °C / -4.5 F).
Dell Inspiron 13 7370 análise de áudio
(-) | alto-falantes não muito altos (###valor### dB)
Graves 100 - 315Hz
(-) | quase nenhum baixo - em média 19.5% menor que a mediana
(±) | a linearidade dos graves é média (10.2% delta para a frequência anterior)
Médios 400 - 2.000 Hz
(±) | médios mais altos - em média 6.7% maior que a mediana
(±) | a linearidade dos médios é média (12.5% delta para frequência anterior)
Altos 2 - 16 kHz
(+) | agudos equilibrados - apenas 3.2% longe da mediana
(±) | a linearidade dos máximos é média (8.9% delta para frequência anterior)
Geral 100 - 16.000 Hz
(±) | a linearidade do som geral é média (26% diferença em relação à mediana)
Comparado com a mesma classe
» 79% de todos os dispositivos testados nesta classe foram melhores, 7% semelhantes, 14% piores
» O melhor teve um delta de 7%, a média foi 21%, o pior foi 53%
Comparado com todos os dispositivos testados
» 80% de todos os dispositivos testados foram melhores, 4% semelhantes, 16% piores
» O melhor teve um delta de 4%, a média foi 23%, o pior foi 134%
HP Spectre 13-v131ng análise de áudio
(-) | alto-falantes não muito altos (###valor### dB)
Graves 100 - 315Hz
(-) | quase nenhum baixo - em média 23.7% menor que a mediana
(±) | a linearidade dos graves é média (9.6% delta para a frequência anterior)
Médios 400 - 2.000 Hz
(±) | médios reduzidos - em média 5.1% menor que a mediana
(±) | a linearidade dos médios é média (7.6% delta para frequência anterior)
Altos 2 - 16 kHz
(±) | máximos mais altos - em média 7.7% maior que a mediana
(+) | os máximos são lineares (3.1% delta da frequência anterior)
Geral 100 - 16.000 Hz
(±) | a linearidade do som geral é média (28.6% diferença em relação à mediana)
Comparado com a mesma classe
» 90% de todos os dispositivos testados nesta classe foram melhores, 2% semelhantes, 7% piores
» O melhor teve um delta de 5%, a média foi 18%, o pior foi 53%
Comparado com todos os dispositivos testados
» 86% de todos os dispositivos testados foram melhores, 3% semelhantes, 11% piores
» O melhor teve um delta de 4%, a média foi 23%, o pior foi 134%
Toshiba Tecra X40-D análise de áudio
(±) | o volume do alto-falante é médio, mas bom (###valor### dB)
Graves 100 - 315Hz
(-) | quase nenhum baixo - em média 15.2% menor que a mediana
(±) | a linearidade dos graves é média (7.2% delta para a frequência anterior)
Médios 400 - 2.000 Hz
(+) | médios equilibrados - apenas 3.6% longe da mediana
(+) | médios são lineares (5.7% delta para frequência anterior)
Altos 2 - 16 kHz
(±) | máximos mais altos - em média 5.6% maior que a mediana
(+) | os máximos são lineares (5.2% delta da frequência anterior)
Geral 100 - 16.000 Hz
(±) | a linearidade do som geral é média (22% diferença em relação à mediana)
Comparado com a mesma classe
» 58% de todos os dispositivos testados nesta classe foram melhores, 8% semelhantes, 34% piores
» O melhor teve um delta de 7%, a média foi 21%, o pior foi 53%
Comparado com todos os dispositivos testados
» 64% de todos os dispositivos testados foram melhores, 6% semelhantes, 30% piores
» O melhor teve um delta de 4%, a média foi 23%, o pior foi 134%
Microsoft Surface Laptop i5 análise de áudio
(-) | alto-falantes não muito altos (###valor### dB)
Graves 100 - 315Hz
(±) | graves reduzidos - em média 7.1% menor que a mediana
(±) | a linearidade dos graves é média (11.8% delta para a frequência anterior)
Médios 400 - 2.000 Hz
(+) | médios equilibrados - apenas 4.1% longe da mediana
(+) | médios são lineares (5.6% delta para frequência anterior)
Altos 2 - 16 kHz
(+) | agudos equilibrados - apenas 1.2% longe da mediana
(+) | os máximos são lineares (4.7% delta da frequência anterior)
Geral 100 - 16.000 Hz
(±) | a linearidade do som geral é média (15.6% diferença em relação à mediana)
Comparado com a mesma classe
» 36% de todos os dispositivos testados nesta classe foram melhores, 5% semelhantes, 58% piores
» O melhor teve um delta de 5%, a média foi 18%, o pior foi 53%
Comparado com todos os dispositivos testados
» 23% de todos os dispositivos testados foram melhores, 5% semelhantes, 72% piores
» O melhor teve um delta de 4%, a média foi 23%, o pior foi 134%
| desligado | |
| Ocioso | |
| Carga |
|
Key:
min: | |
| Dell Inspiron 13 7370 i5-8250U, UHD Graphics 620, Micron 1100 MTFDDAV256TBN, IPS, 1920x1080, 13.3" | HP Spectre 13-v131ng i7-7500U, HD Graphics 620, Samsung PM961 NVMe MZVLW512HMJP, IPS UWVA, 1920x1080, 13.3" | Toshiba Tecra X40-D i7-7600U, HD Graphics 620, Samsung PM961 MZVLW256HEHP, IPS, 1920x1080, 14" | Microsoft Surface Laptop i5 i5-7200U, HD Graphics 620, Toshiba THNSN0128GTYA, IPS, 2256x1504, 13.5" | |
|---|---|---|---|---|
| Power Consumption | 3% | 5% | 12% | |
| Idle Minimum * (Watt) | 3.6 | 3.6 -0% | 5.2 -44% | 3.2 11% |
| Idle Average * (Watt) | 6.8 | 6.4 6% | 6.9 -1% | 6.5 4% |
| Idle Maximum * (Watt) | 8.9 | 9.2 -3% | 7 21% | 6.8 24% |
| Load Average * (Watt) | 36 | 34 6% | 24.6 32% | 28.2 22% |
| Load Maximum * (Watt) | 36.5 | 34.4 6% | 30.1 18% | 36 1% |
* ... menor é melhor
| Dell Inspiron 13 7370 i5-8250U, UHD Graphics 620, 38 Wh | HP Spectre 13-v131ng i7-7500U, HD Graphics 620, 38 Wh | Toshiba Tecra X40-D i7-7600U, HD Graphics 620, 48 Wh | Microsoft Surface Laptop i5 i5-7200U, HD Graphics 620, 45 Wh | |
|---|---|---|---|---|
| Duração da bateria | 2% | 26% | 69% | |
| Reader / Idle (h) | 12.9 | 12 -7% | 14.6 13% | 22.5 74% |
| WiFi v1.3 (h) | 5.8 | 6.6 14% | 6 3% | 10 72% |
| Load (h) | 1.3 | 1.3 0% | 2.1 62% | 2.1 62% |
| H.264 (h) | 6.1 |
Pro
Contra
 courtesy of Cyberport.de")
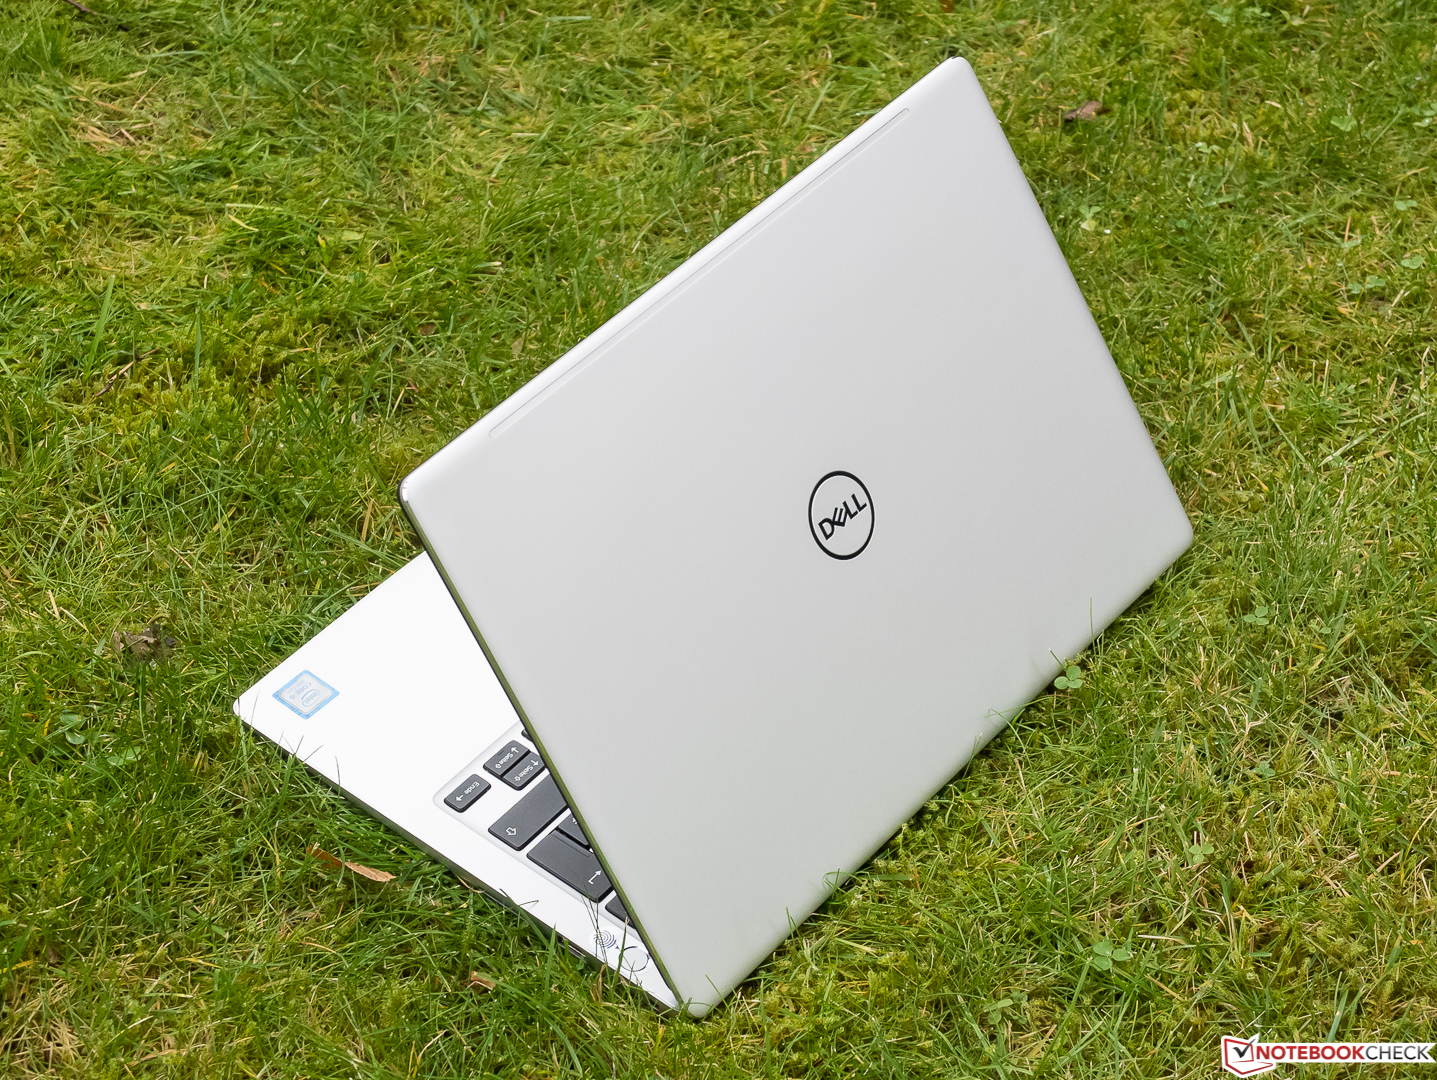
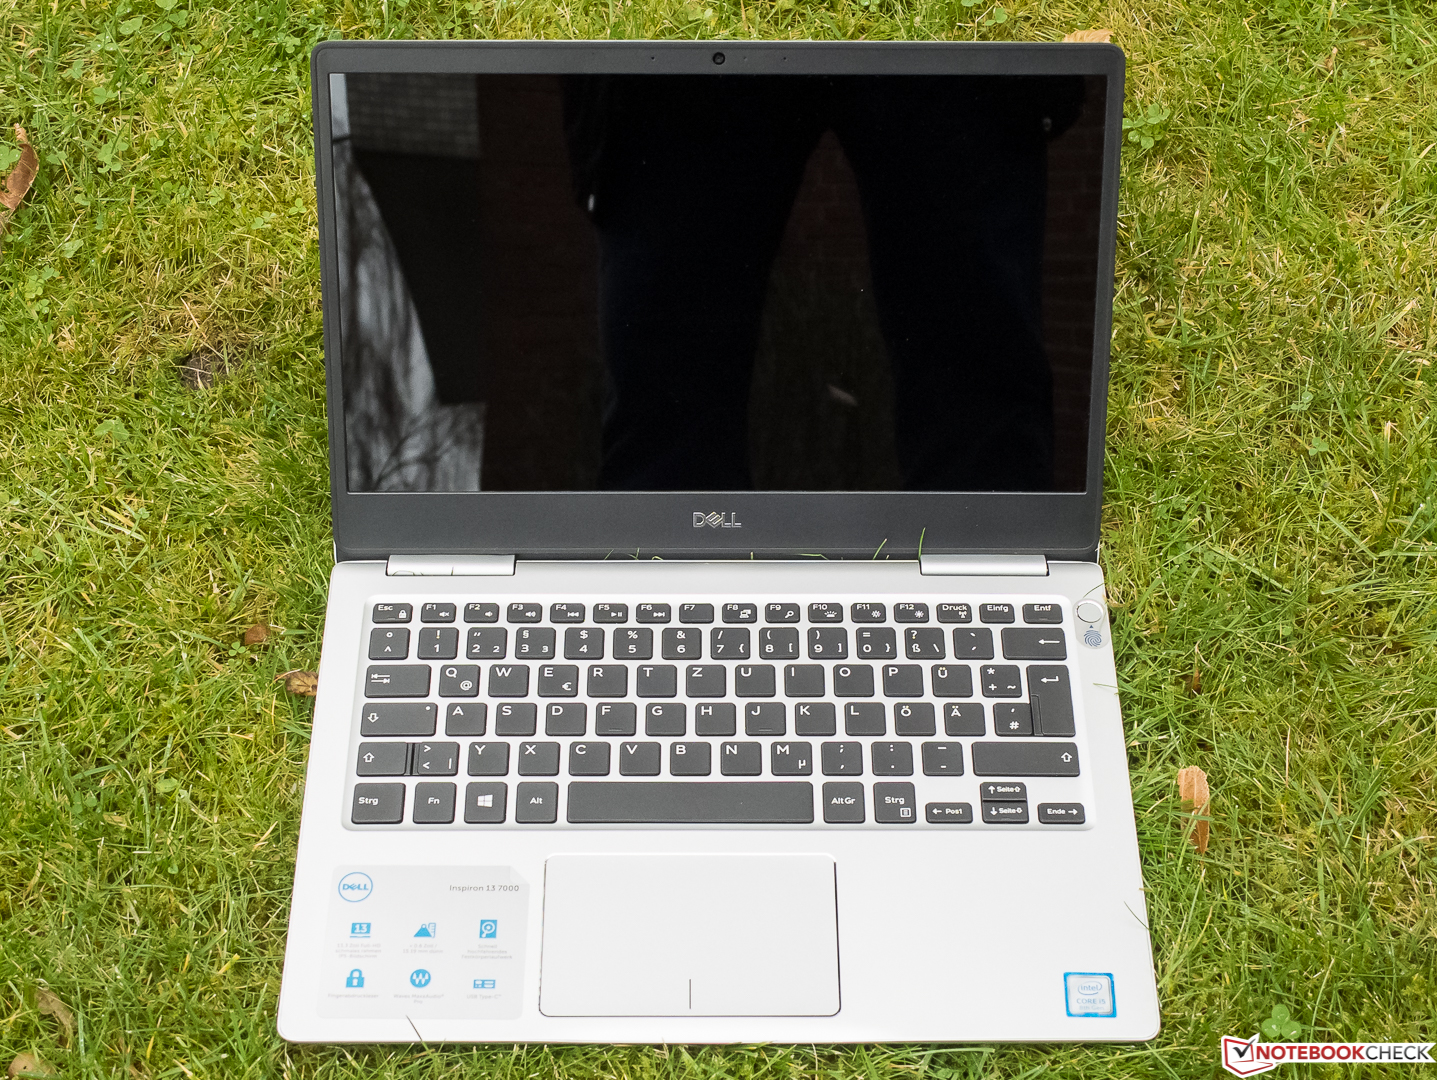
Ignorando a duração da bateria um pouco curta, a reflexão da tela e a baixa frequência PWM de 200 Hz, o Dell Inspiron 13 7370, construído de forma limpa e elegante, não possui grandes fraquezas em geral.
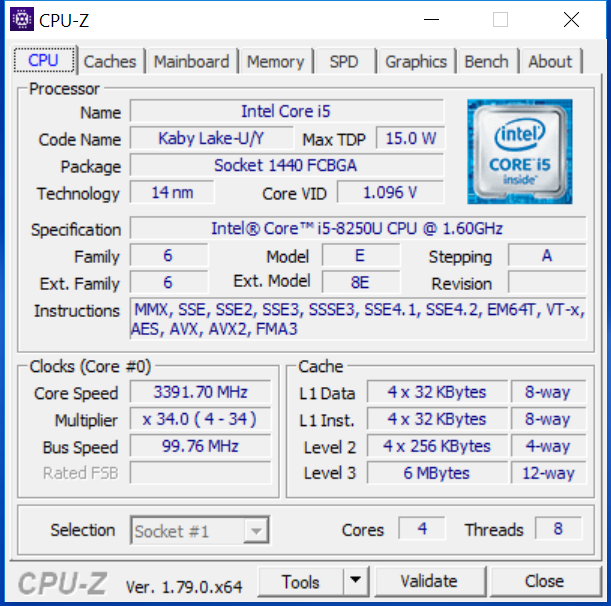
Os quatro núcleos com Hyperthreading podem definitivamente ser vistos como uma melhoria com relação aos modelos anteriores, pois não há problemas térmicos e não há um aumento considerável do consumo de energia em nosso dispositivo de teste. No entanto, também somos da opinião que a maioria dos usuários de escritório não encontrará nenhum uso apreciável para os oito threads e podem trabalhar tão bem quanto com os processadores ULV Dual-core tradicionais com Hyperthreading. Este, naturalmente não é o caso se usar software bem otimizado para ser executado em paralelo.
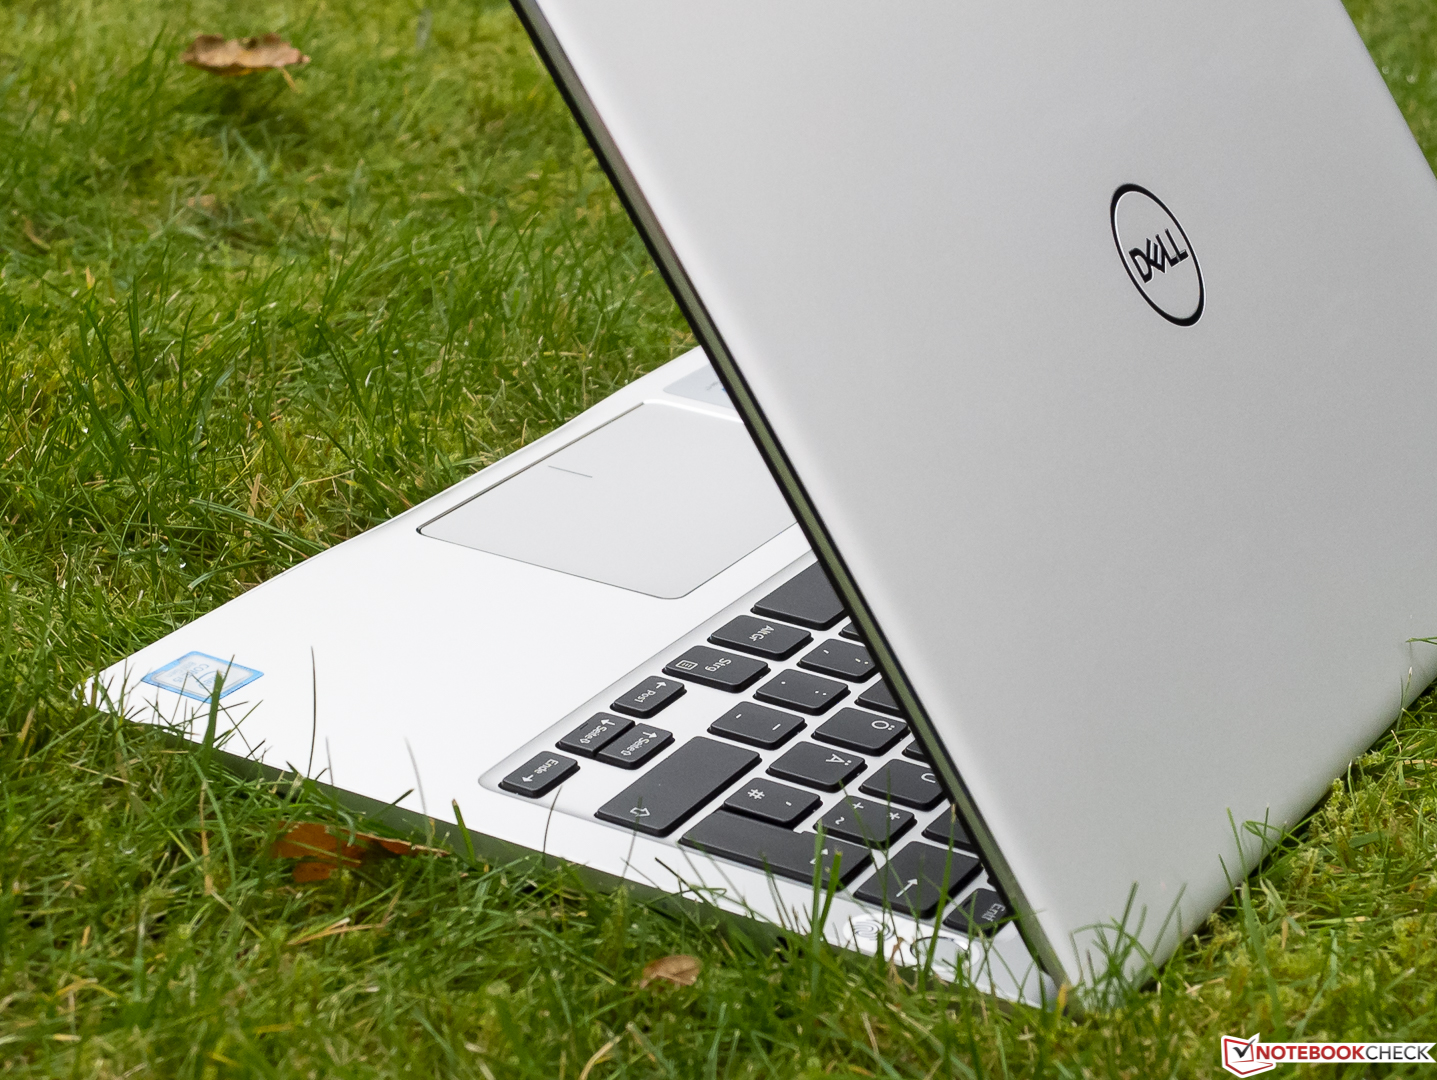
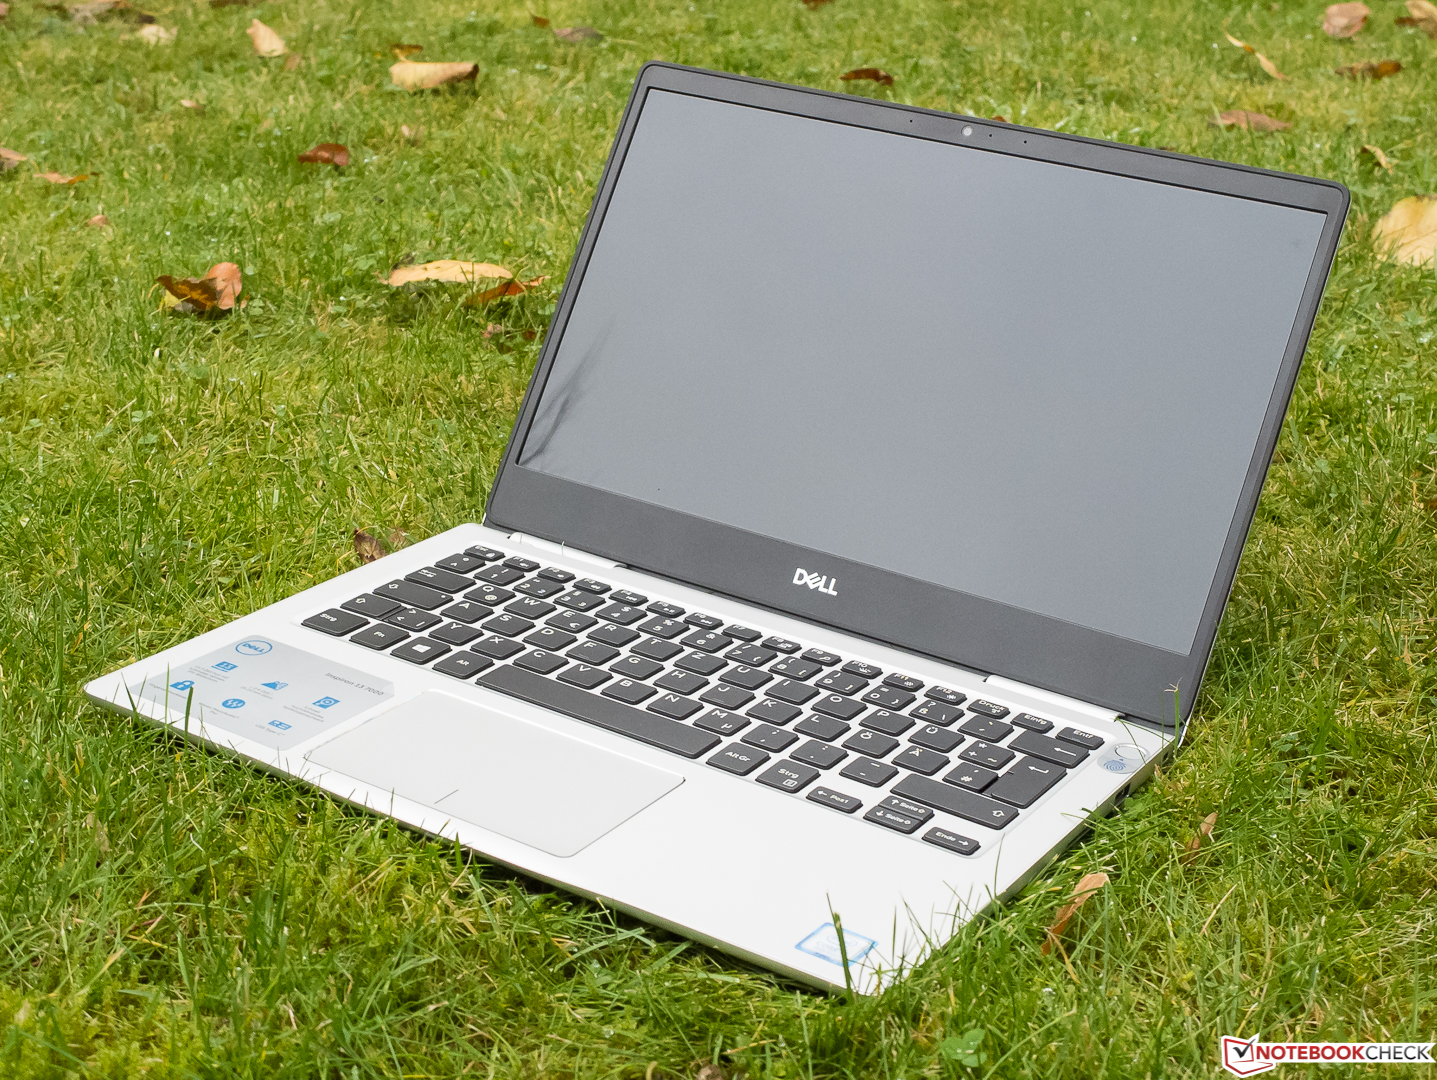
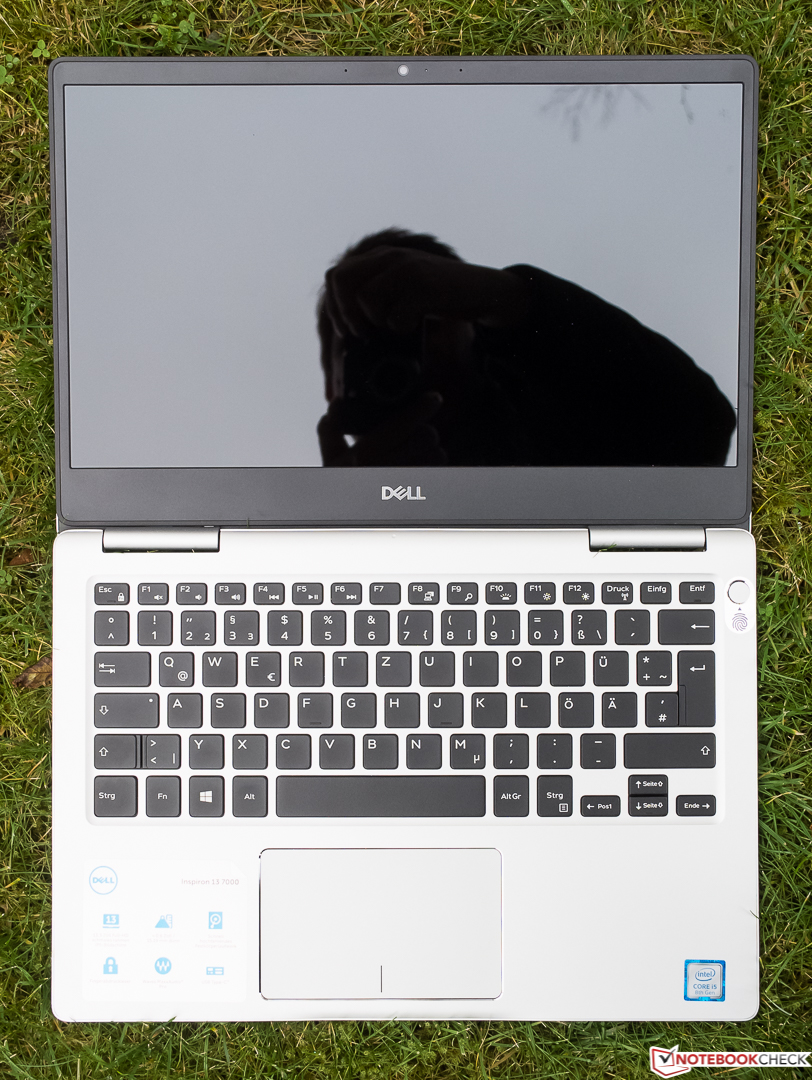
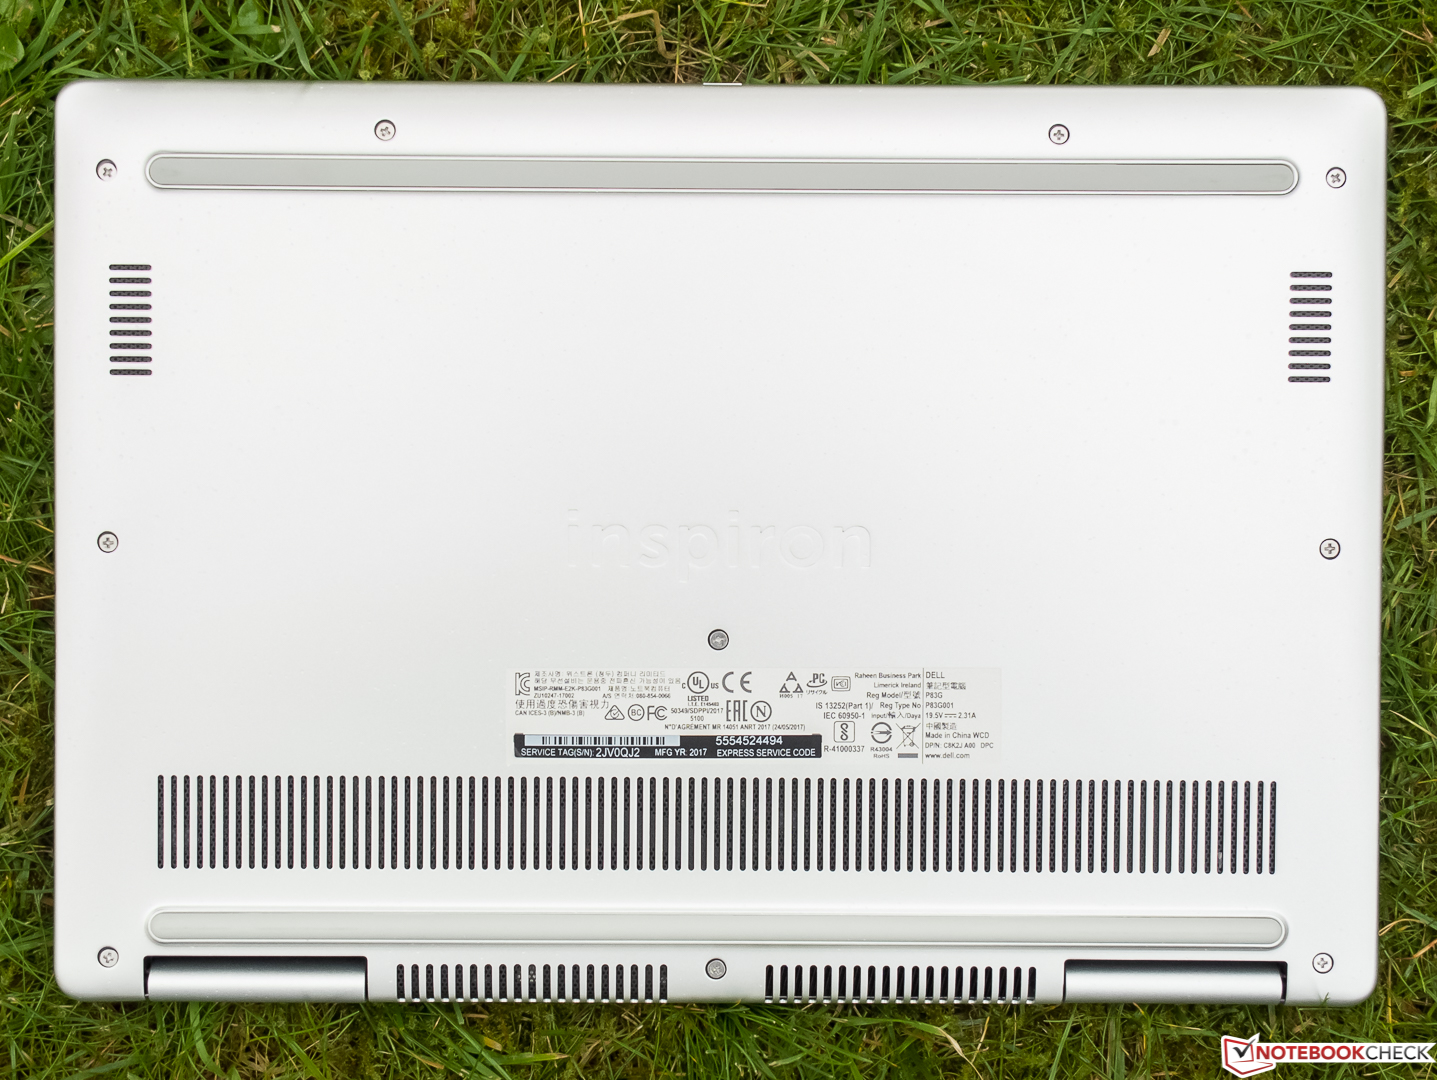
Exatamente por que a Dell escolheu usar um acabamento brilhante para a sua tela, provavelmente permanecerá um mistério, embora não tivemos grandes problemas com reflexos na tela. A tela pode ser um pouco mais clara e exibir uma melhor variedade de cores, o leitor de cartões SD tortura os fotógrafos com seu processo de cópia desnecessariamente longo, e isso não parece bom quando se trata de facilidade de reparo.
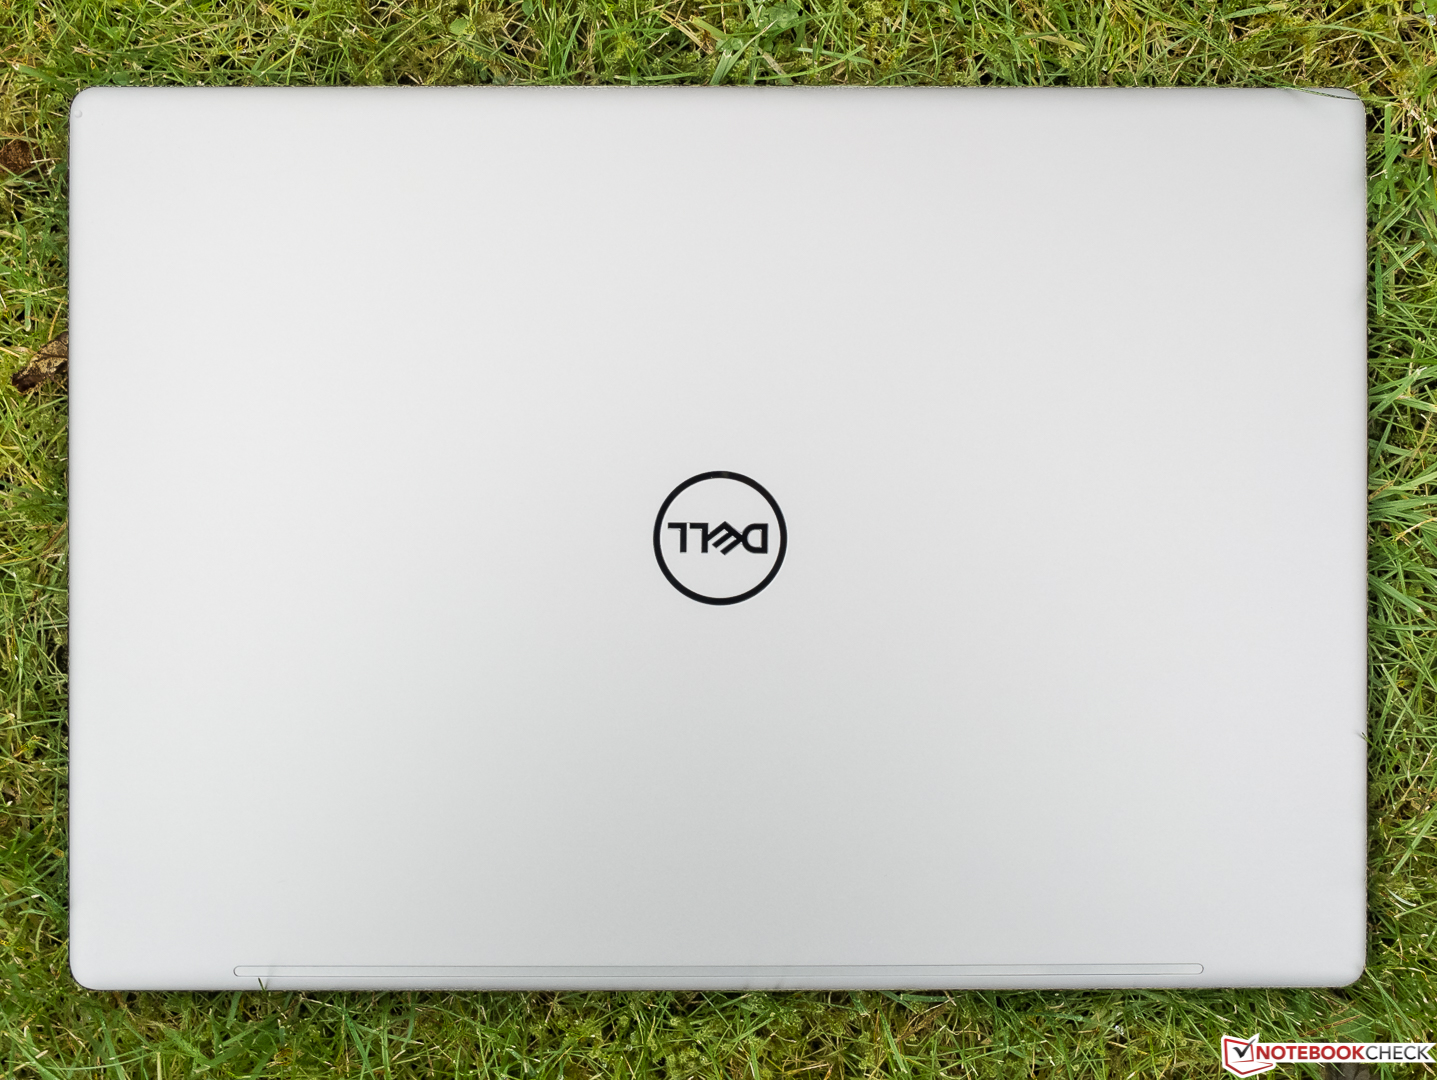
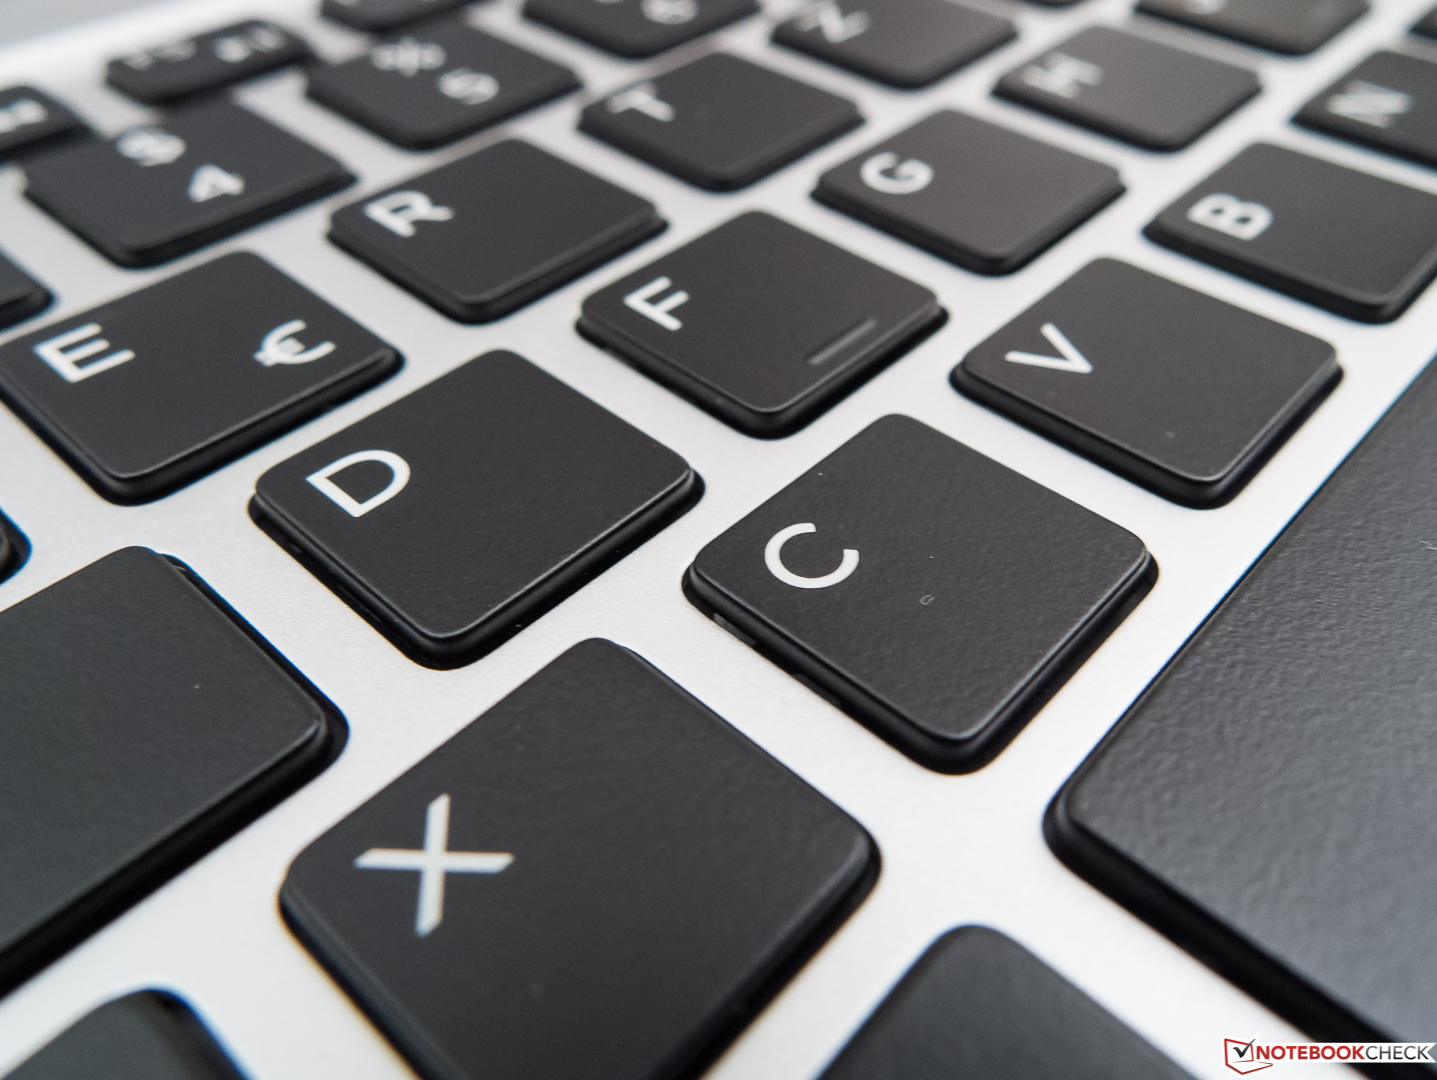
No lado positivo, está a carcaça bem construída, sólida e impressionante, o design leve e compacto, a operação normalmente fria e silenciosa, bem como os excelentes dispositivos de entrada. O Inspiron 7370 apenas perdeu uma avaliação de "muito bom", embora nada esteja impeça uma recomendação de compra. O dispositivo mais comparável em termos de design compacto é o HP Specter 13, que é um pouco mais fino, tem uma tela mais brilhante, um SSD NVMe mais rápido e oferece portas tipo USB tipo C de segunda geração com Thunderbolt. No entanto, ele também tem uma ventoinha barulhenta e irritante, não conta com um leitor de cartões SD e não consegue aproveitar o modo turbo.
Dell Inspiron 13 7370
- 11/16/2017 v6 (old)
Sven Kloevekorn